Pine Bluffs, WY Map & Demographics
Pine Bluffs Map
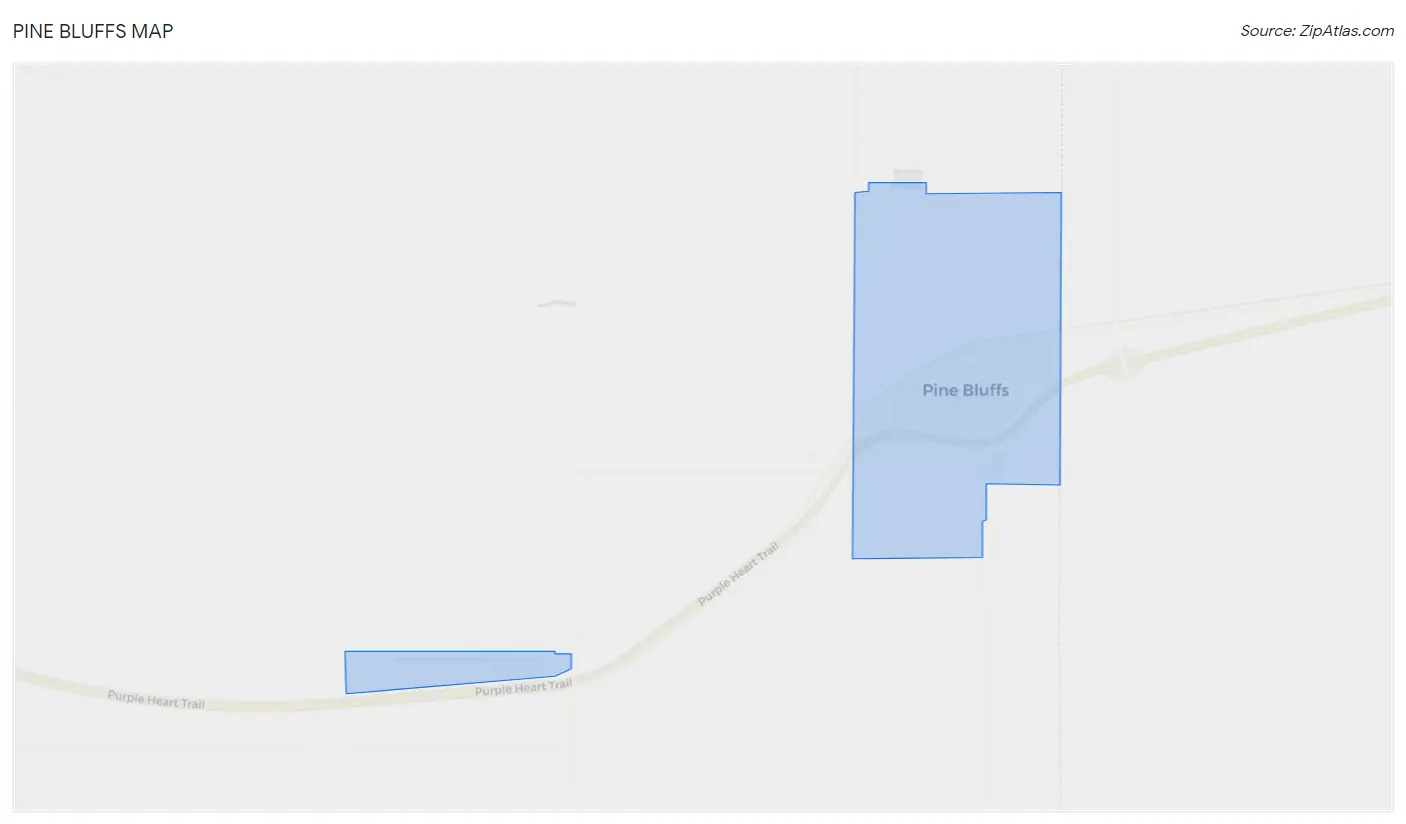
Pine Bluffs Overview
$27,736
PER CAPITA INCOME
$63,619
AVG FAMILY INCOME
$62,766
AVG HOUSEHOLD INCOME
37.6%
WAGE / INCOME GAP [ % ]
62.4¢/ $1
WAGE / INCOME GAP [ $ ]
0.34
INEQUALITY / GINI INDEX
1,363
TOTAL POPULATION
828
MALE POPULATION
535
FEMALE POPULATION
154.77
MALES / 100 FEMALES
64.61
FEMALES / 100 MALES
36.3
MEDIAN AGE
2.9
AVG FAMILY SIZE
2.5
AVG HOUSEHOLD SIZE
587
LABOR FORCE [ PEOPLE ]
56.4%
PERCENT IN LABOR FORCE
0.7%
UNEMPLOYMENT RATE
Pine Bluffs Zip Codes
Pine Bluffs Area Codes
Income in Pine Bluffs
Income Overview in Pine Bluffs
Per Capita Income in Pine Bluffs is $27,736, while median incomes of families and households are $63,619 and $62,766 respectively.
| Characteristic | Number | Measure |
| Per Capita Income | 1,363 | $27,736 |
| Median Family Income | 424 | $63,619 |
| Mean Family Income | 424 | $72,711 |
| Median Household Income | 547 | $62,766 |
| Mean Household Income | 547 | $67,269 |
| Income Deficit | 424 | $0 |
| Wage / Income Gap (%) | 1,363 | 37.60% |
| Wage / Income Gap ($) | 1,363 | 62.40¢ per $1 |
| Gini / Inequality Index | 1,363 | 0.34 |
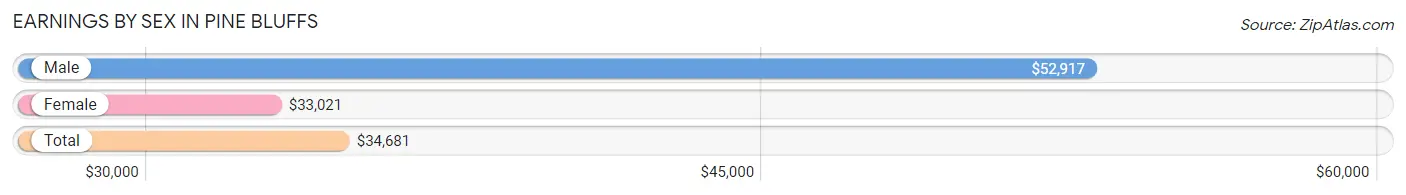
Earnings by Sex in Pine Bluffs
Average Earnings in Pine Bluffs are $34,681, $52,917 for men and $33,021 for women, a difference of 37.6%.
| Sex | Number | Average Earnings |
| Male | 447 (66.4%) | $52,917 |
| Female | 226 (33.6%) | $33,021 |
| Total | 673 (100.0%) | $34,681 |
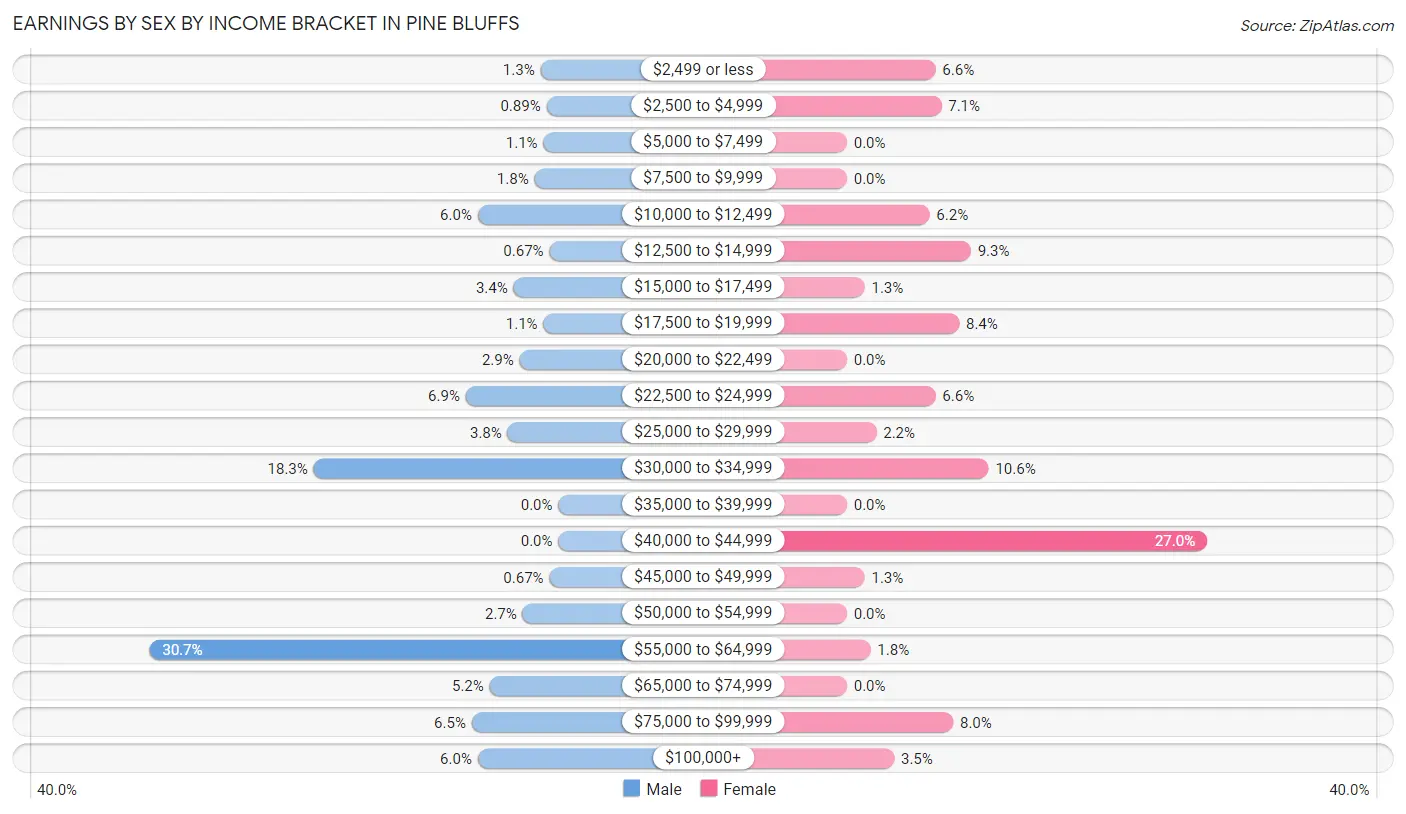
Earnings by Sex by Income Bracket in Pine Bluffs
The most common earnings brackets in Pine Bluffs are $55,000 to $64,999 for men (137 | 30.6%) and $40,000 to $44,999 for women (61 | 27.0%).
| Income | Male | Female |
| $2,499 or less | 6 (1.3%) | 15 (6.6%) |
| $2,500 to $4,999 | 4 (0.9%) | 16 (7.1%) |
| $5,000 to $7,499 | 5 (1.1%) | 0 (0.0%) |
| $7,500 to $9,999 | 8 (1.8%) | 0 (0.0%) |
| $10,000 to $12,499 | 27 (6.0%) | 14 (6.2%) |
| $12,500 to $14,999 | 3 (0.7%) | 21 (9.3%) |
| $15,000 to $17,499 | 15 (3.4%) | 3 (1.3%) |
| $17,500 to $19,999 | 5 (1.1%) | 19 (8.4%) |
| $20,000 to $22,499 | 13 (2.9%) | 0 (0.0%) |
| $22,500 to $24,999 | 31 (6.9%) | 15 (6.6%) |
| $25,000 to $29,999 | 17 (3.8%) | 5 (2.2%) |
| $30,000 to $34,999 | 82 (18.3%) | 24 (10.6%) |
| $35,000 to $39,999 | 0 (0.0%) | 0 (0.0%) |
| $40,000 to $44,999 | 0 (0.0%) | 61 (27.0%) |
| $45,000 to $49,999 | 3 (0.7%) | 3 (1.3%) |
| $50,000 to $54,999 | 12 (2.7%) | 0 (0.0%) |
| $55,000 to $64,999 | 137 (30.6%) | 4 (1.8%) |
| $65,000 to $74,999 | 23 (5.1%) | 0 (0.0%) |
| $75,000 to $99,999 | 29 (6.5%) | 18 (8.0%) |
| $100,000+ | 27 (6.0%) | 8 (3.5%) |
| Total | 447 (100.0%) | 226 (100.0%) |
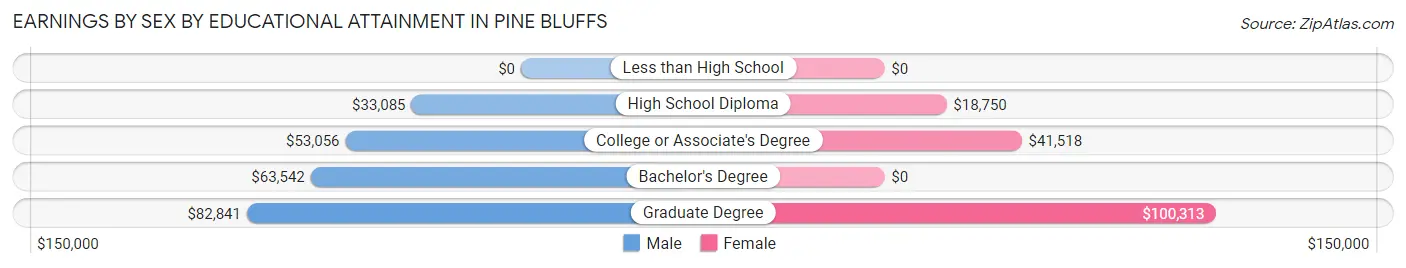
Earnings by Sex by Educational Attainment in Pine Bluffs
Average earnings in Pine Bluffs are $58,125 for men and $33,802 for women, a difference of 41.8%. Men with an educational attainment of graduate degree enjoy the highest average annual earnings of $82,841, while those with high school diploma education earn the least with $33,085. Women with an educational attainment of graduate degree earn the most with the average annual earnings of $100,313, while those with high school diploma education have the smallest earnings of $18,750.
| Educational Attainment | Male Income | Female Income |
| Less than High School | - | - |
| High School Diploma | $33,085 | $18,750 |
| College or Associate's Degree | $53,056 | $41,518 |
| Bachelor's Degree | $63,542 | $0 |
| Graduate Degree | $82,841 | $100,313 |
| Total | $58,125 | $33,802 |
Family Income in Pine Bluffs
Family Income Brackets in Pine Bluffs
According to the Pine Bluffs family income data, there are 189 families falling into the $50,000 to $74,999 income range, which is the most common income bracket and makes up 44.6% of all families.
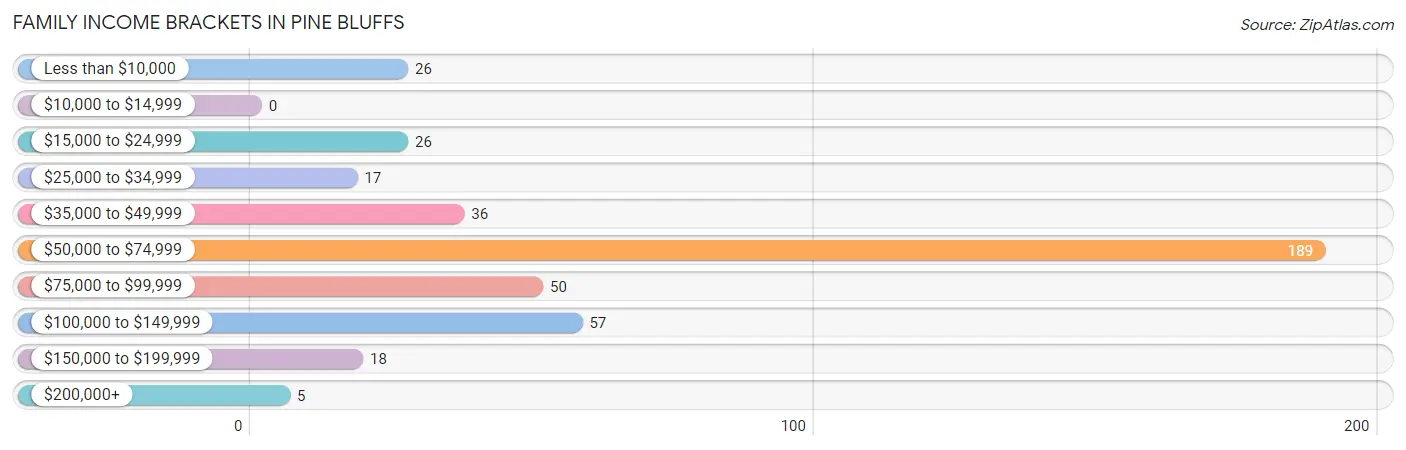
| Income Bracket | # Families | % Families |
| Less than $10,000 | 26 | 6.1% |
| $10,000 to $14,999 | 0 | 0.0% |
| $15,000 to $24,999 | 26 | 6.1% |
| $25,000 to $34,999 | 17 | 4.0% |
| $35,000 to $49,999 | 36 | 8.5% |
| $50,000 to $74,999 | 189 | 44.6% |
| $75,000 to $99,999 | 50 | 11.8% |
| $100,000 to $149,999 | 57 | 13.4% |
| $150,000 to $199,999 | 18 | 4.2% |
| $200,000+ | 5 | 1.2% |
Family Income by Famaliy Size in Pine Bluffs
5-person families (16 | 3.8%) account for the highest median family income in Pine Bluffs with $70,357 per family, while 2-person families (229 | 54.0%) have the highest median income of $28,597 per family member.
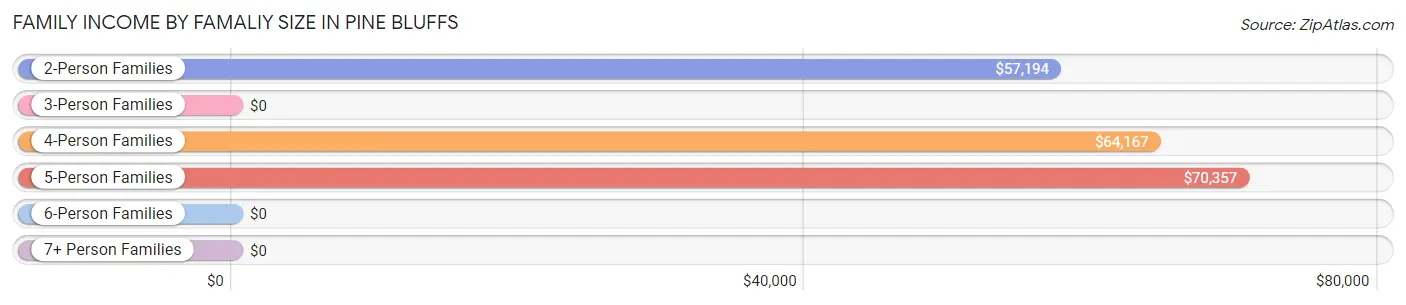
| Income Bracket | # Families | Median Income |
| 2-Person Families | 229 (54.0%) | $57,194 |
| 3-Person Families | 30 (7.1%) | $0 |
| 4-Person Families | 136 (32.1%) | $64,167 |
| 5-Person Families | 16 (3.8%) | $70,357 |
| 6-Person Families | 2 (0.5%) | $0 |
| 7+ Person Families | 11 (2.6%) | $0 |
| Total | 424 (100.0%) | $63,619 |
Family Income by Number of Earners in Pine Bluffs
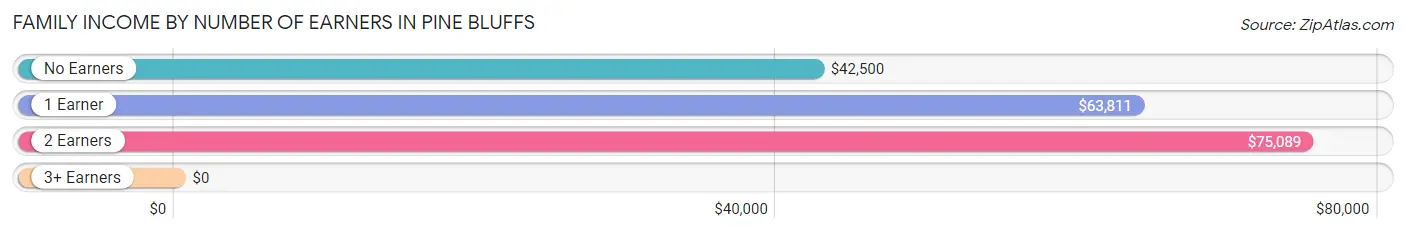
| Number of Earners | # Families | Median Income |
| No Earners | 56 (13.2%) | $42,500 |
| 1 Earner | 191 (45.1%) | $63,811 |
| 2 Earners | 163 (38.4%) | $75,089 |
| 3+ Earners | 14 (3.3%) | $0 |
| Total | 424 (100.0%) | $63,619 |
Household Income in Pine Bluffs
Household Income Brackets in Pine Bluffs
With 228 households falling in the category, the $50,000 to $74,999 income range is the most frequent in Pine Bluffs, accounting for 41.7% of all households. In contrast, only 3 households (0.5%) fall into the $10,000 to $14,999 income bracket, making it the least populous group.
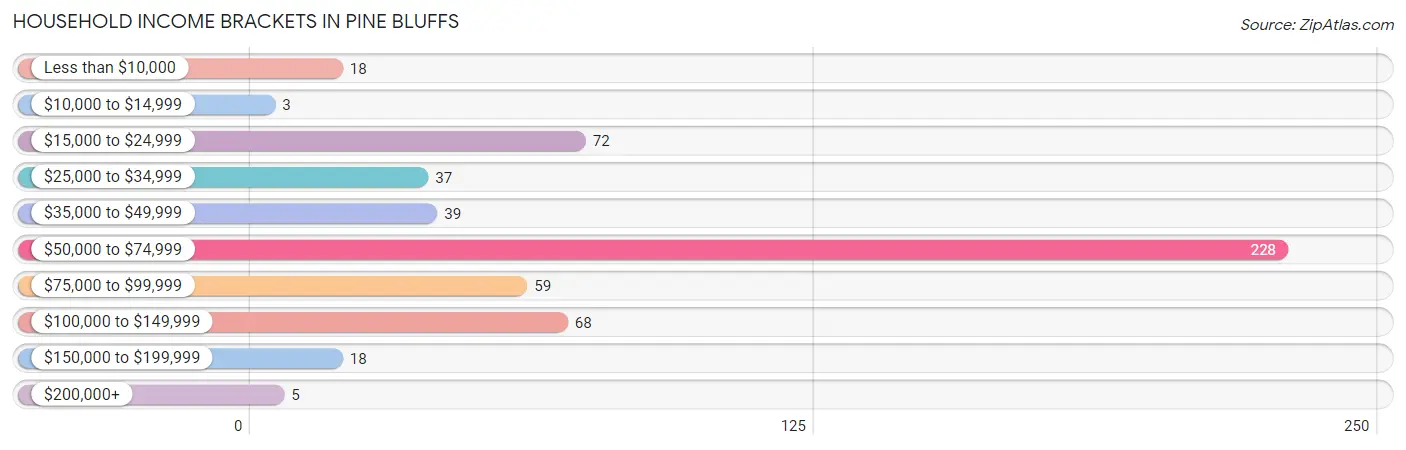
| Income Bracket | # Households | % Households |
| Less than $10,000 | 18 | 3.3% |
| $10,000 to $14,999 | 3 | 0.5% |
| $15,000 to $24,999 | 72 | 13.2% |
| $25,000 to $34,999 | 37 | 6.8% |
| $35,000 to $49,999 | 39 | 7.1% |
| $50,000 to $74,999 | 228 | 41.7% |
| $75,000 to $99,999 | 59 | 10.8% |
| $100,000 to $149,999 | 68 | 12.4% |
| $150,000 to $199,999 | 18 | 3.3% |
| $200,000+ | 5 | 0.9% |
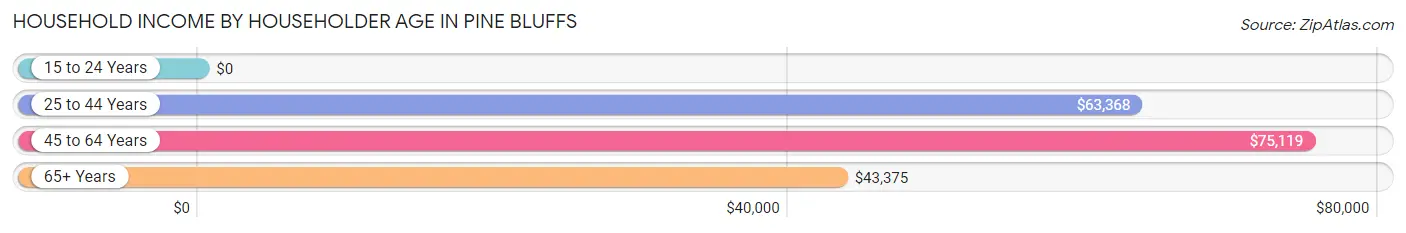
Household Income by Householder Age in Pine Bluffs
The median household income in Pine Bluffs is $62,766, with the highest median household income of $75,119 found in the 45 to 64 years age bracket for the primary householder. A total of 174 households (31.8%) fall into this category. Meanwhile, the 15 to 24 years age bracket for the primary householder has the lowest median household income of $0, with 7 households (1.3%) in this group.
| Income Bracket | # Households | Median Income |
| 15 to 24 Years | 7 (1.3%) | $0 |
| 25 to 44 Years | 197 (36.0%) | $63,368 |
| 45 to 64 Years | 174 (31.8%) | $75,119 |
| 65+ Years | 169 (30.9%) | $43,375 |
| Total | 547 (100.0%) | $62,766 |
Poverty in Pine Bluffs
Income Below Poverty by Sex and Age in Pine Bluffs
With 19.2% poverty level for males and 11.6% for females among the residents of Pine Bluffs, under 5 year old males and 6 to 11 year old females are the most vulnerable to poverty, with 30 males (85.7%) and 11 females (31.4%) in their respective age groups living below the poverty level.
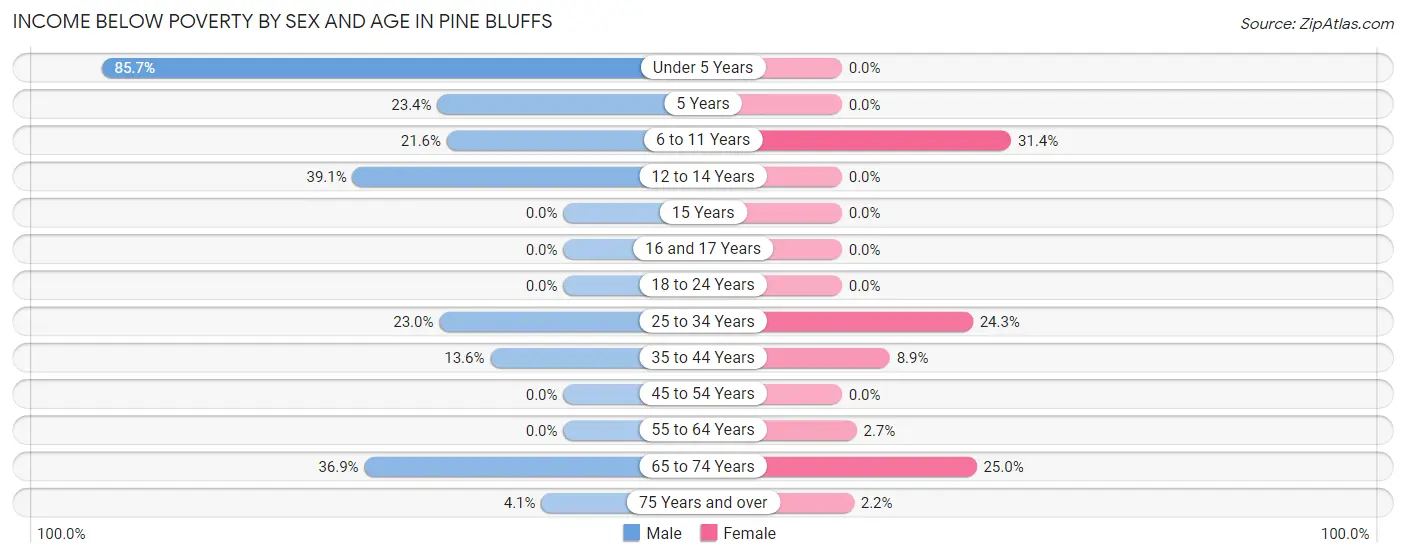
| Age Bracket | Male | Female |
| Under 5 Years | 30 (85.7%) | 0 (0.0%) |
| 5 Years | 18 (23.4%) | 0 (0.0%) |
| 6 to 11 Years | 24 (21.6%) | 11 (31.4%) |
| 12 to 14 Years | 18 (39.1%) | 0 (0.0%) |
| 15 Years | 0 (0.0%) | 0 (0.0%) |
| 16 and 17 Years | 0 (0.0%) | 0 (0.0%) |
| 18 to 24 Years | 0 (0.0%) | 0 (0.0%) |
| 25 to 34 Years | 35 (23.0%) | 26 (24.3%) |
| 35 to 44 Years | 8 (13.6%) | 4 (8.9%) |
| 45 to 54 Years | 0 (0.0%) | 0 (0.0%) |
| 55 to 64 Years | 0 (0.0%) | 3 (2.7%) |
| 65 to 74 Years | 24 (36.9%) | 16 (25.0%) |
| 75 Years and over | 2 (4.1%) | 2 (2.2%) |
| Total | 159 (19.2%) | 62 (11.6%) |
Income Above Poverty by Sex and Age in Pine Bluffs
According to the poverty statistics in Pine Bluffs, males aged 15 years and females aged under 5 years are the age groups that are most secure financially, with 100.0% of males and 100.0% of females in these age groups living above the poverty line.
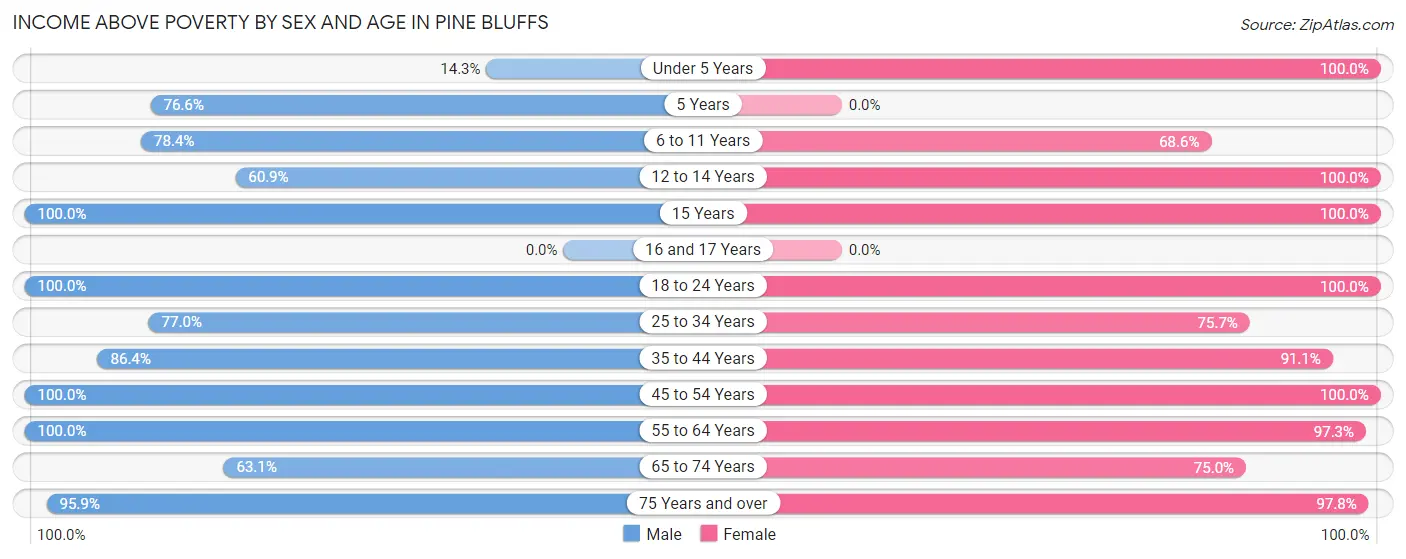
| Age Bracket | Male | Female |
| Under 5 Years | 5 (14.3%) | 4 (100.0%) |
| 5 Years | 59 (76.6%) | 0 (0.0%) |
| 6 to 11 Years | 87 (78.4%) | 24 (68.6%) |
| 12 to 14 Years | 28 (60.9%) | 2 (100.0%) |
| 15 Years | 2 (100.0%) | 11 (100.0%) |
| 16 and 17 Years | 0 (0.0%) | 0 (0.0%) |
| 18 to 24 Years | 50 (100.0%) | 25 (100.0%) |
| 25 to 34 Years | 117 (77.0%) | 81 (75.7%) |
| 35 to 44 Years | 51 (86.4%) | 41 (91.1%) |
| 45 to 54 Years | 25 (100.0%) | 42 (100.0%) |
| 55 to 64 Years | 157 (100.0%) | 107 (97.3%) |
| 65 to 74 Years | 41 (63.1%) | 48 (75.0%) |
| 75 Years and over | 47 (95.9%) | 88 (97.8%) |
| Total | 669 (80.8%) | 473 (88.4%) |
Income Below Poverty Among Married-Couple Families in Pine Bluffs
The poverty statistics for married-couple families in Pine Bluffs show that 12.9% or 49 of the total 380 families live below the poverty line. Families with 5 or more children have the highest poverty rate of 100.0%, comprising of 11 families. On the other hand, families with 3 or 4 children have the lowest poverty rate of 0.0%, which includes 0 families.
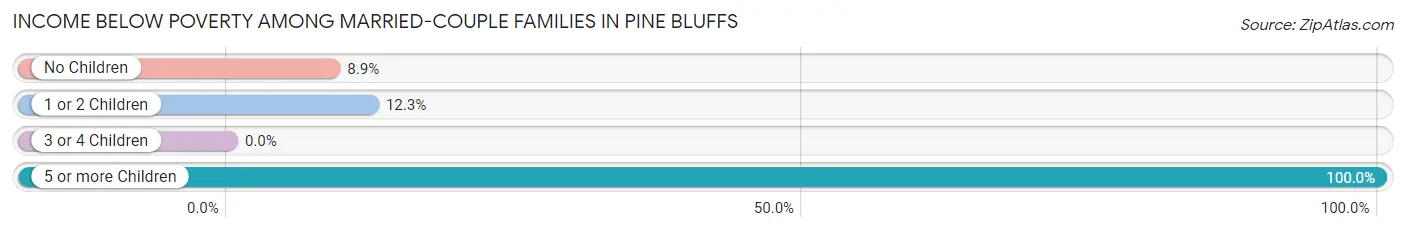
| Children | Above Poverty | Below Poverty |
| No Children | 184 (91.1%) | 18 (8.9%) |
| 1 or 2 Children | 143 (87.7%) | 20 (12.3%) |
| 3 or 4 Children | 4 (100.0%) | 0 (0.0%) |
| 5 or more Children | 0 (0.0%) | 11 (100.0%) |
| Total | 331 (87.1%) | 49 (12.9%) |
Income Below Poverty Among Single-Parent Households in Pine Bluffs
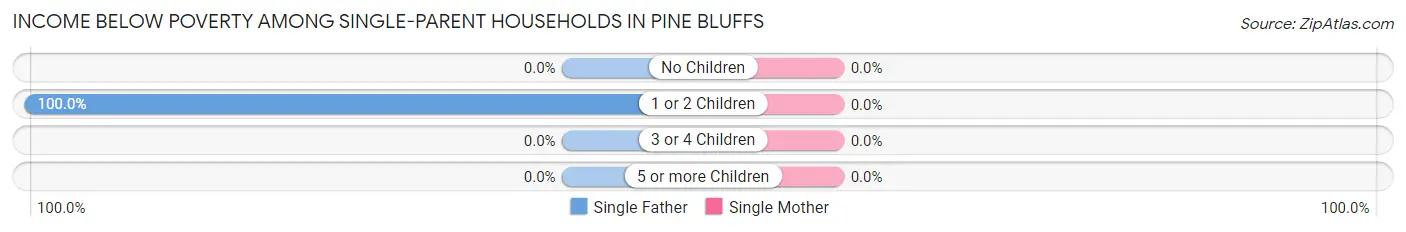
| Children | Single Father | Single Mother |
| No Children | 0 (0.0%) | 0 (0.0%) |
| 1 or 2 Children | 8 (100.0%) | 0 (0.0%) |
| 3 or 4 Children | 0 (0.0%) | 0 (0.0%) |
| 5 or more Children | 0 (0.0%) | 0 (0.0%) |
| Total | 8 (66.7%) | 0 (0.0%) |
Income Below Poverty Among Married-Couple vs Single-Parent Households in Pine Bluffs
The poverty data for Pine Bluffs shows that 49 of the married-couple family households (12.9%) and 8 of the single-parent households (18.2%) are living below the poverty level. Within the married-couple family households, those with 5 or more children have the highest poverty rate, with 11 households (100.0%) falling below the poverty line. Among the single-parent households, those with 1 or 2 children have the highest poverty rate, with 8 household (44.4%) living below poverty.
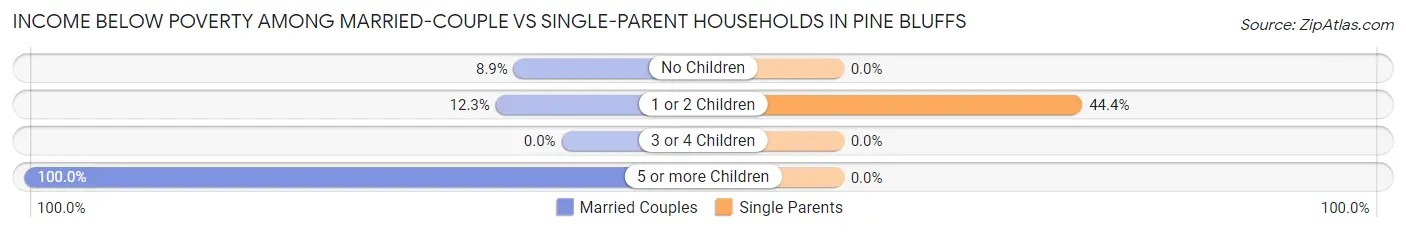
| Children | Married-Couple Families | Single-Parent Households |
| No Children | 18 (8.9%) | 0 (0.0%) |
| 1 or 2 Children | 20 (12.3%) | 8 (44.4%) |
| 3 or 4 Children | 0 (0.0%) | 0 (0.0%) |
| 5 or more Children | 11 (100.0%) | 0 (0.0%) |
| Total | 49 (12.9%) | 8 (18.2%) |
Race in Pine Bluffs
The most populous races in Pine Bluffs are White / Caucasian (1,281 | 94.0%), Hispanic or Latino (258 | 18.9%), and Two or more Races (44 | 3.2%).
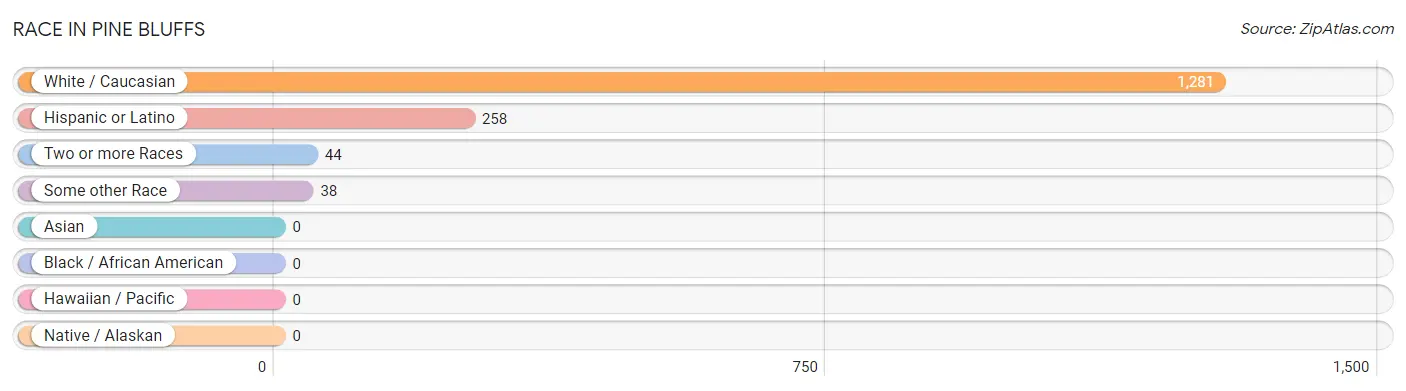
| Race | # Population | % Population |
| Asian | 0 | 0.0% |
| Black / African American | 0 | 0.0% |
| Hawaiian / Pacific | 0 | 0.0% |
| Hispanic or Latino | 258 | 18.9% |
| Native / Alaskan | 0 | 0.0% |
| White / Caucasian | 1,281 | 94.0% |
| Two or more Races | 44 | 3.2% |
| Some other Race | 38 | 2.8% |
| Total | 1,363 | 100.0% |
Ancestry in Pine Bluffs
The most populous ancestries reported in Pine Bluffs are German (311 | 22.8%), English (286 | 21.0%), Mexican (247 | 18.1%), Irish (117 | 8.6%), and Polish (79 | 5.8%), together accounting for 76.3% of all Pine Bluffs residents.
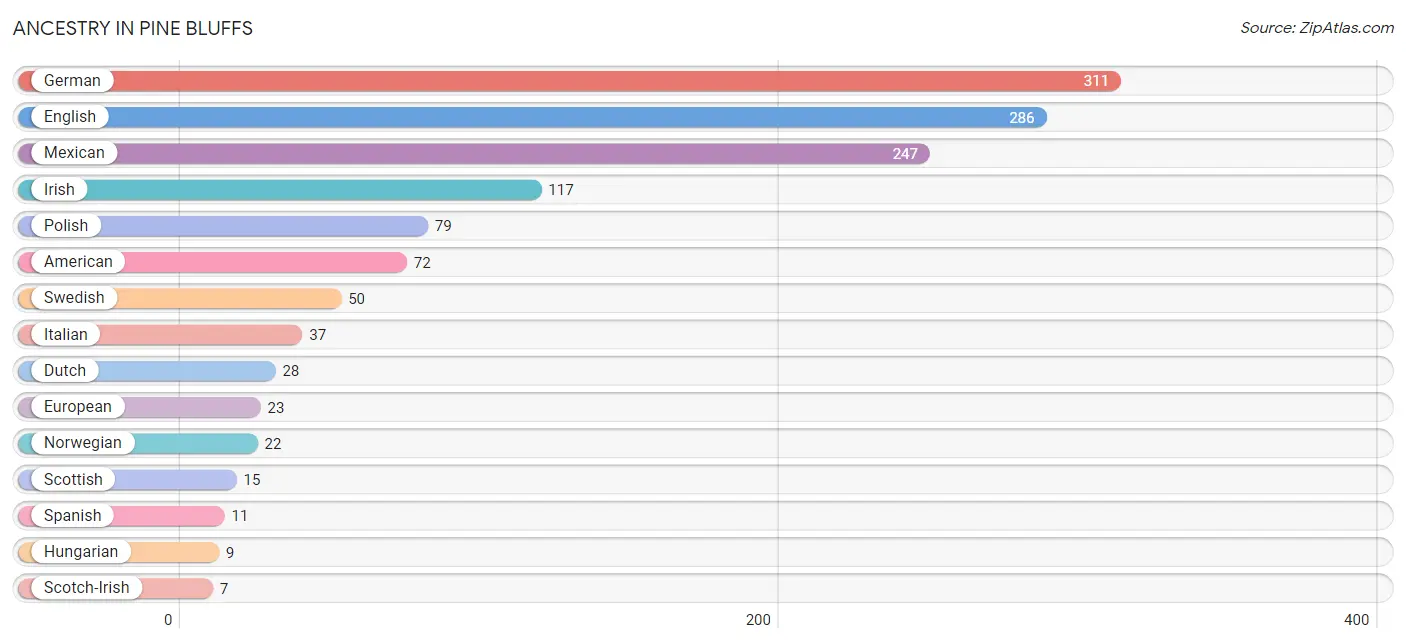
| Ancestry | # Population | % Population |
| American | 72 | 5.3% |
| Crow | 3 | 0.2% |
| Danish | 3 | 0.2% |
| Dutch | 28 | 2.1% |
| English | 286 | 21.0% |
| European | 23 | 1.7% |
| French | 2 | 0.2% |
| German | 311 | 22.8% |
| Hungarian | 9 | 0.7% |
| Irish | 117 | 8.6% |
| Italian | 37 | 2.7% |
| Mexican | 247 | 18.1% |
| Norwegian | 22 | 1.6% |
| Polish | 79 | 5.8% |
| Russian | 6 | 0.4% |
| Scotch-Irish | 7 | 0.5% |
| Scottish | 15 | 1.1% |
| Spanish | 11 | 0.8% |
| Swedish | 50 | 3.7% |
| Ukrainian | 3 | 0.2% |
| Welsh | 3 | 0.2% | View All 21 Rows |
Immigrants in Pine Bluffs
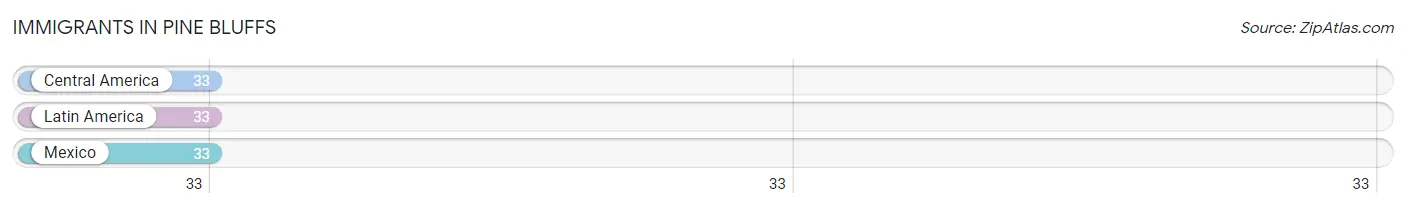
The most numerous immigrant groups reported in Pine Bluffs came from Central America (33 | 2.4%), Latin America (33 | 2.4%), and Mexico (33 | 2.4%), together accounting for 7.3% of all Pine Bluffs residents.
| Immigration Origin | # Population | % Population |
| Central America | 33 | 2.4% |
| Latin America | 33 | 2.4% |
| Mexico | 33 | 2.4% | View All 3 Rows |
Sex and Age in Pine Bluffs
Sex and Age in Pine Bluffs
The most populous age groups in Pine Bluffs are 5 to 9 Years (186 | 22.5%) for men and 30 to 34 Years (85 | 15.9%) for women.
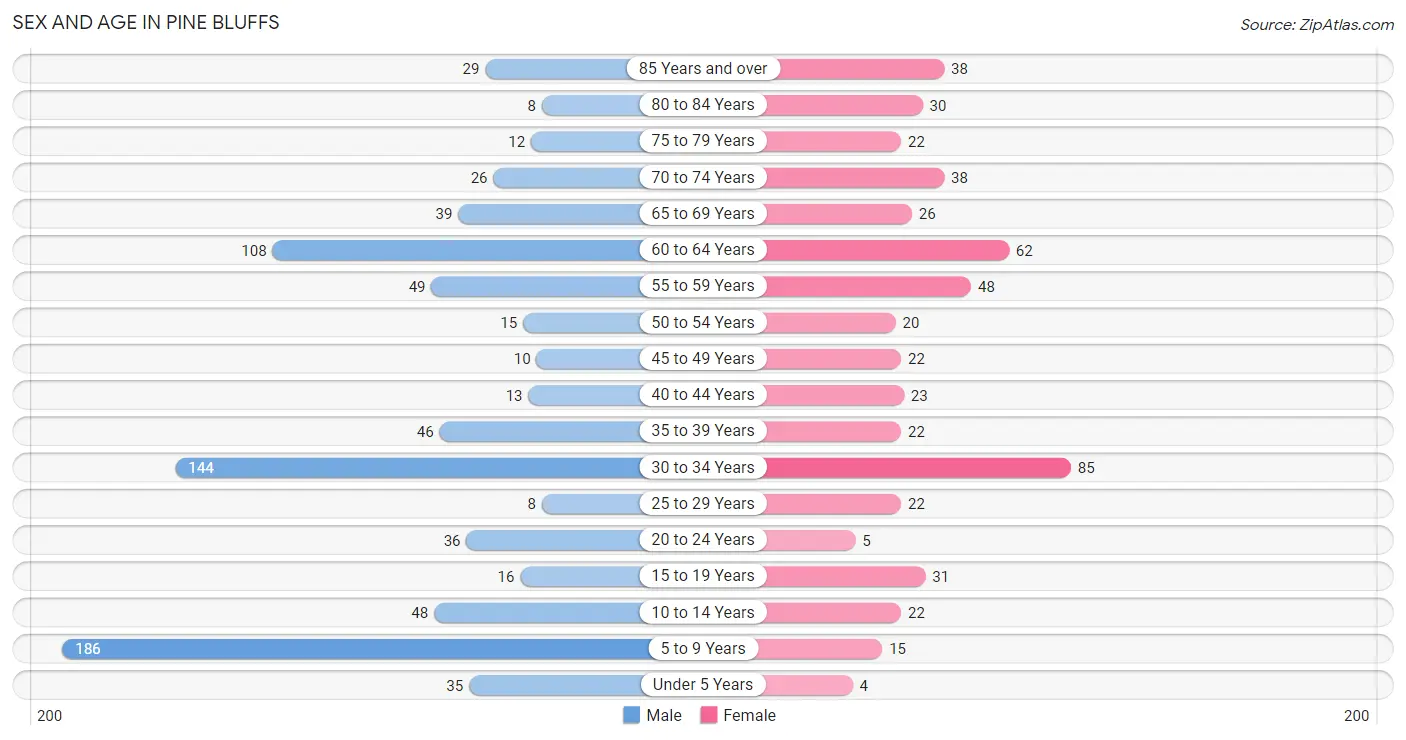
| Age Bracket | Male | Female |
| Under 5 Years | 35 (4.2%) | 4 (0.7%) |
| 5 to 9 Years | 186 (22.5%) | 15 (2.8%) |
| 10 to 14 Years | 48 (5.8%) | 22 (4.1%) |
| 15 to 19 Years | 16 (1.9%) | 31 (5.8%) |
| 20 to 24 Years | 36 (4.3%) | 5 (0.9%) |
| 25 to 29 Years | 8 (1.0%) | 22 (4.1%) |
| 30 to 34 Years | 144 (17.4%) | 85 (15.9%) |
| 35 to 39 Years | 46 (5.6%) | 22 (4.1%) |
| 40 to 44 Years | 13 (1.6%) | 23 (4.3%) |
| 45 to 49 Years | 10 (1.2%) | 22 (4.1%) |
| 50 to 54 Years | 15 (1.8%) | 20 (3.7%) |
| 55 to 59 Years | 49 (5.9%) | 48 (9.0%) |
| 60 to 64 Years | 108 (13.0%) | 62 (11.6%) |
| 65 to 69 Years | 39 (4.7%) | 26 (4.9%) |
| 70 to 74 Years | 26 (3.1%) | 38 (7.1%) |
| 75 to 79 Years | 12 (1.5%) | 22 (4.1%) |
| 80 to 84 Years | 8 (1.0%) | 30 (5.6%) |
| 85 Years and over | 29 (3.5%) | 38 (7.1%) |
| Total | 828 (100.0%) | 535 (100.0%) |
Families and Households in Pine Bluffs
Median Family Size in Pine Bluffs
The median family size in Pine Bluffs is 2.90 persons per family, with married-couple families (380 | 89.6%) accounting for the largest median family size of 2.96 persons per family. On the other hand, single male/father families (12 | 2.8%) represent the smallest median family size with 1.83 persons per family.
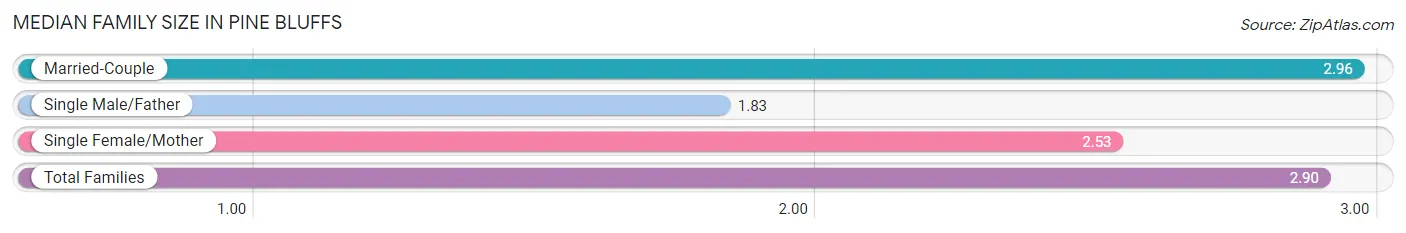
| Family Type | # Families | Family Size |
| Married-Couple | 380 (89.6%) | 2.96 |
| Single Male/Father | 12 (2.8%) | 1.83 |
| Single Female/Mother | 32 (7.5%) | 2.53 |
| Total Families | 424 (100.0%) | 2.90 |
Median Household Size in Pine Bluffs
The median household size in Pine Bluffs is 2.49 persons per household, with married-couple households (380 | 69.5%) accounting for the largest median household size of 2.96 persons per household. non-family households (123 | 22.5%) represent the smallest median household size with 1.02 persons per household.
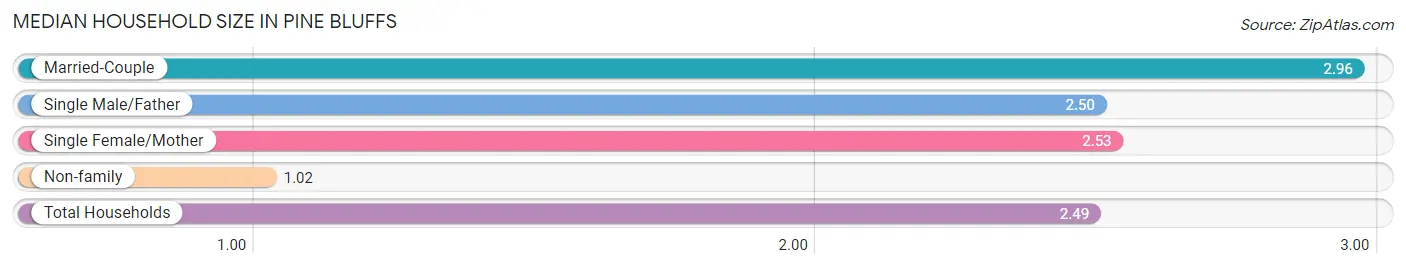
| Household Type | # Households | Household Size |
| Married-Couple | 380 (69.5%) | 2.96 |
| Single Male/Father | 12 (2.2%) | 2.50 |
| Single Female/Mother | 32 (5.9%) | 2.53 |
| Non-family | 123 (22.5%) | 1.02 |
| Total Households | 547 (100.0%) | 2.49 |
Household Size by Marriage Status in Pine Bluffs
Out of a total of 547 households in Pine Bluffs, 424 (77.5%) are family households, while 123 (22.5%) are nonfamily households. The most numerous type of family households are 2-person households, comprising 217, and the most common type of nonfamily households are 1-person households, comprising 121.
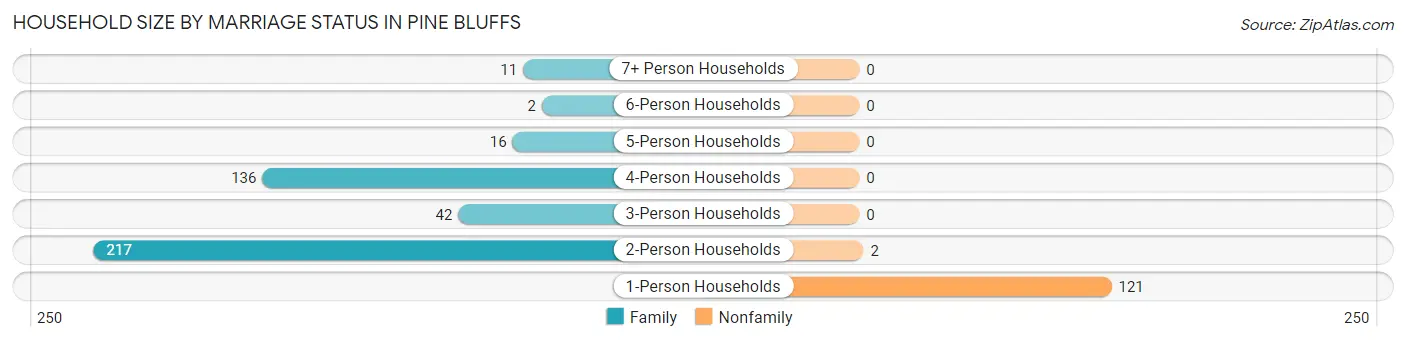
| Household Size | Family Households | Nonfamily Households |
| 1-Person Households | - | 121 (22.1%) |
| 2-Person Households | 217 (39.7%) | 2 (0.4%) |
| 3-Person Households | 42 (7.7%) | 0 (0.0%) |
| 4-Person Households | 136 (24.9%) | 0 (0.0%) |
| 5-Person Households | 16 (2.9%) | 0 (0.0%) |
| 6-Person Households | 2 (0.4%) | 0 (0.0%) |
| 7+ Person Households | 11 (2.0%) | 0 (0.0%) |
| Total | 424 (77.5%) | 123 (22.5%) |
Female Fertility in Pine Bluffs
Fertility by Age in Pine Bluffs
| Age Bracket | Women with Births | Births / 1,000 Women |
| 15 to 19 years | 0 (0.0%) | 0.0 |
| 20 to 34 years | 0 (0.0%) | 0.0 |
| 35 to 50 years | 0 (0.0%) | 0.0 |
| Total | 0 (0.0%) | 0.0 |
Fertility by Age by Marriage Status in Pine Bluffs
| Age Bracket | Married | Unmarried |
| 15 to 19 years | 0 (0.0%) | 0 (0.0%) |
| 20 to 34 years | 0 (0.0%) | 0 (0.0%) |
| 35 to 50 years | 0 (0.0%) | 0 (0.0%) |
| Total | 0 (0.0%) | 0 (0.0%) |
Fertility by Education in Pine Bluffs
| Educational Attainment | Women with Births | Births / 1,000 Women |
| Less than High School | 0 (0.0%) | 0.0 |
| High School Diploma | 0 (0.0%) | 0.0 |
| College or Associate's Degree | 0 (0.0%) | 0.0 |
| Bachelor's Degree | 0 (0.0%) | 0.0 |
| Graduate Degree | 0 (0.0%) | 0.0 |
| Total | 0 (0.0%) | 0.0 |
Fertility by Education by Marriage Status in Pine Bluffs
| Educational Attainment | Married | Unmarried |
| Less than High School | 0 (0.0%) | 0 (0.0%) |
| High School Diploma | 0 (0.0%) | 0 (0.0%) |
| College or Associate's Degree | 0 (0.0%) | 0 (0.0%) |
| Bachelor's Degree | 0 (0.0%) | 0 (0.0%) |
| Graduate Degree | 0 (0.0%) | 0 (0.0%) |
| Total | 0 (0.0%) | 0 (0.0%) |
Employment Characteristics in Pine Bluffs
Employment by Class of Employer in Pine Bluffs
Among the 583 employed individuals in Pine Bluffs, private company employees (235 | 40.3%), local government employees (162 | 27.8%), and self-employed (not incorporated) (123 | 21.1%) make up the most common classes of employment.
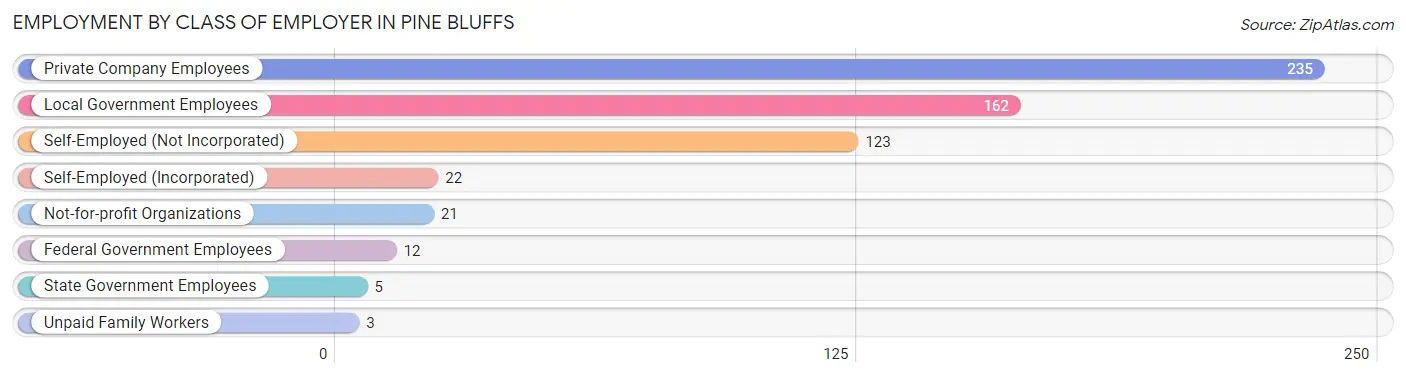
| Employer Class | # Employees | % Employees |
| Private Company Employees | 235 | 40.3% |
| Self-Employed (Incorporated) | 22 | 3.8% |
| Self-Employed (Not Incorporated) | 123 | 21.1% |
| Not-for-profit Organizations | 21 | 3.6% |
| Local Government Employees | 162 | 27.8% |
| State Government Employees | 5 | 0.9% |
| Federal Government Employees | 12 | 2.1% |
| Unpaid Family Workers | 3 | 0.5% |
| Total | 583 | 100.0% |
Employment Status by Age in Pine Bluffs
According to the labor force statistics for Pine Bluffs, out of the total population over 16 years of age (1,040), 56.4% or 587 individuals are in the labor force, with 0.7% or 4 of them unemployed. The age group with the highest labor force participation rate is 55 to 59 years, with 92.8% or 90 individuals in the labor force. Within the labor force, the 20 to 24 years age range has the highest percentage of unemployed individuals, with 13.8% or 5 of them being unemployed.
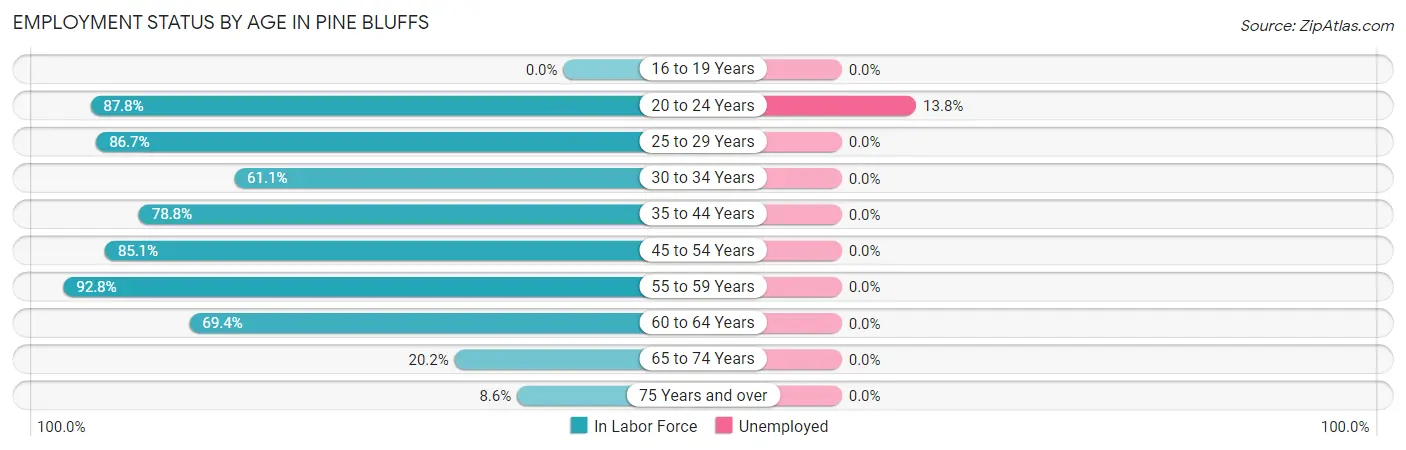
| Age Bracket | In Labor Force | Unemployed |
| 16 to 19 Years | 0 (0.0%) | 0 (0.0%) |
| 20 to 24 Years | 36 (87.8%) | 5 (13.8%) |
| 25 to 29 Years | 26 (86.7%) | 0 (0.0%) |
| 30 to 34 Years | 140 (61.1%) | 0 (0.0%) |
| 35 to 44 Years | 82 (78.8%) | 0 (0.0%) |
| 45 to 54 Years | 57 (85.1%) | 0 (0.0%) |
| 55 to 59 Years | 90 (92.8%) | 0 (0.0%) |
| 60 to 64 Years | 118 (69.4%) | 0 (0.0%) |
| 65 to 74 Years | 26 (20.2%) | 0 (0.0%) |
| 75 Years and over | 12 (8.6%) | 0 (0.0%) |
| Total | 587 (56.4%) | 4 (0.7%) |
Employment Status by Educational Attainment in Pine Bluffs
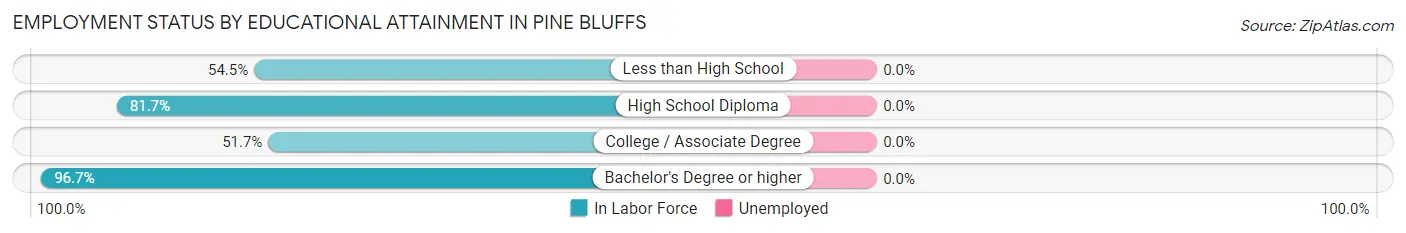
| Educational Attainment | In Labor Force | Unemployed |
| Less than High School | 18 (54.5%) | 0 (0.0%) |
| High School Diploma | 156 (81.7%) | 0 (0.0%) |
| College / Associate Degree | 136 (51.7%) | 0 (0.0%) |
| Bachelor's Degree or higher | 203 (96.7%) | 0 (0.0%) |
| Total | 513 (73.6%) | 0 (0.0%) |
Employment Occupations by Sex in Pine Bluffs
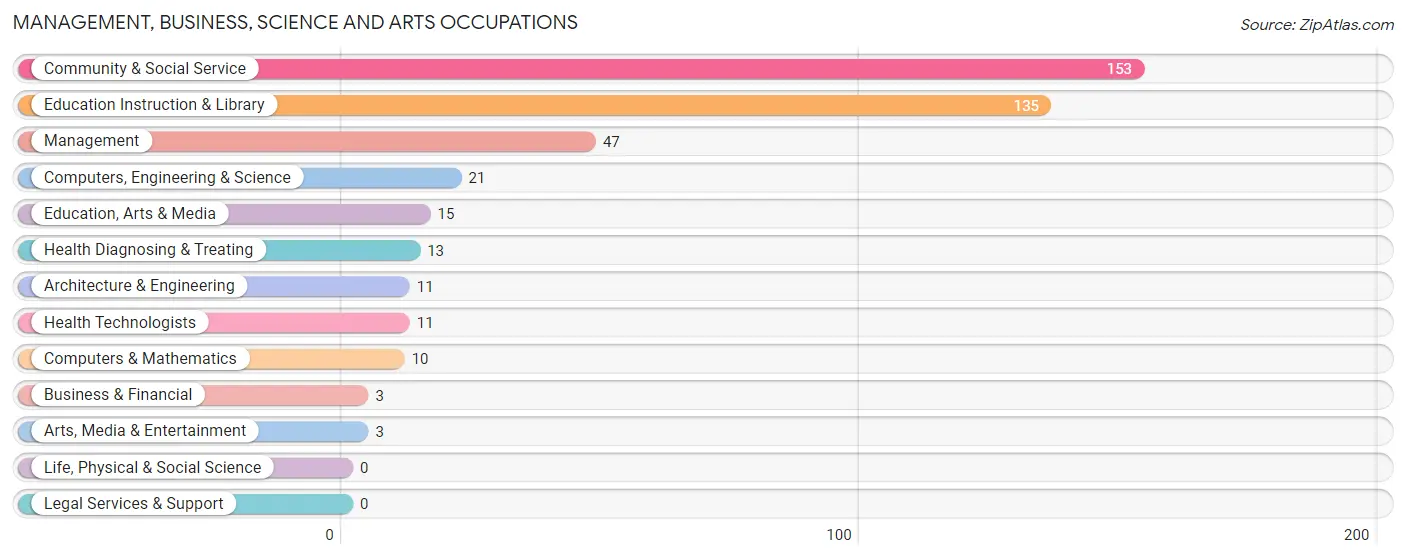
Management, Business, Science and Arts Occupations
The most common Management, Business, Science and Arts occupations in Pine Bluffs are Community & Social Service (153 | 26.6%), Education Instruction & Library (135 | 23.4%), Management (47 | 8.2%), Computers, Engineering & Science (21 | 3.6%), and Education, Arts & Media (15 | 2.6%).
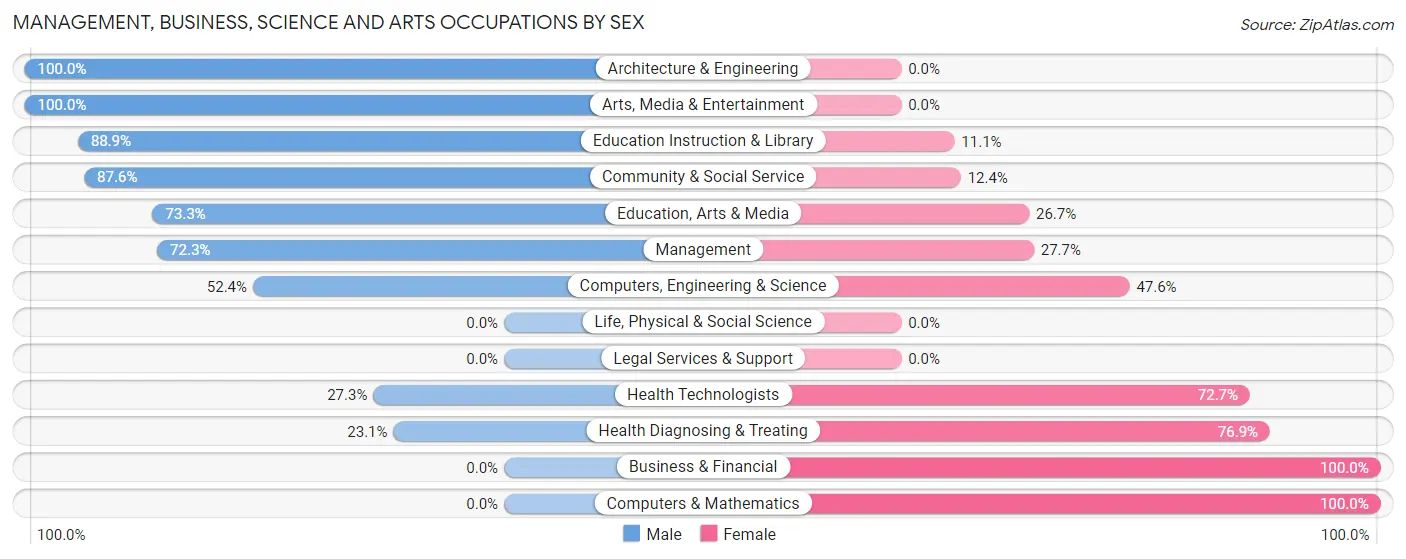
Management, Business, Science and Arts Occupations by Sex
Within the Management, Business, Science and Arts occupations in Pine Bluffs, the most male-oriented occupations are Architecture & Engineering (100.0%), Arts, Media & Entertainment (100.0%), and Education Instruction & Library (88.9%), while the most female-oriented occupations are Business & Financial (100.0%), Computers & Mathematics (100.0%), and Health Diagnosing & Treating (76.9%).
| Occupation | Male | Female |
| Management | 34 (72.3%) | 13 (27.7%) |
| Business & Financial | 0 (0.0%) | 3 (100.0%) |
| Computers, Engineering & Science | 11 (52.4%) | 10 (47.6%) |
| Computers & Mathematics | 0 (0.0%) | 10 (100.0%) |
| Architecture & Engineering | 11 (100.0%) | 0 (0.0%) |
| Life, Physical & Social Science | 0 (0.0%) | 0 (0.0%) |
| Community & Social Service | 134 (87.6%) | 19 (12.4%) |
| Education, Arts & Media | 11 (73.3%) | 4 (26.7%) |
| Legal Services & Support | 0 (0.0%) | 0 (0.0%) |
| Education Instruction & Library | 120 (88.9%) | 15 (11.1%) |
| Arts, Media & Entertainment | 3 (100.0%) | 0 (0.0%) |
| Health Diagnosing & Treating | 3 (23.1%) | 10 (76.9%) |
| Health Technologists | 3 (27.3%) | 8 (72.7%) |
| Total (Category) | 182 (76.8%) | 55 (23.2%) |
| Total (Overall) | 411 (71.4%) | 165 (28.6%) |
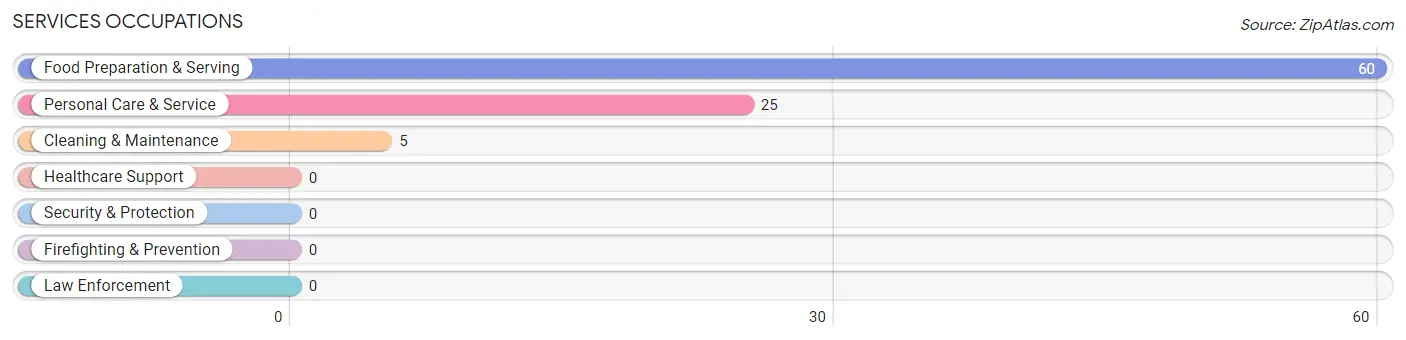
Services Occupations
The most common Services occupations in Pine Bluffs are Food Preparation & Serving (60 | 10.4%), Personal Care & Service (25 | 4.3%), and Cleaning & Maintenance (5 | 0.9%).
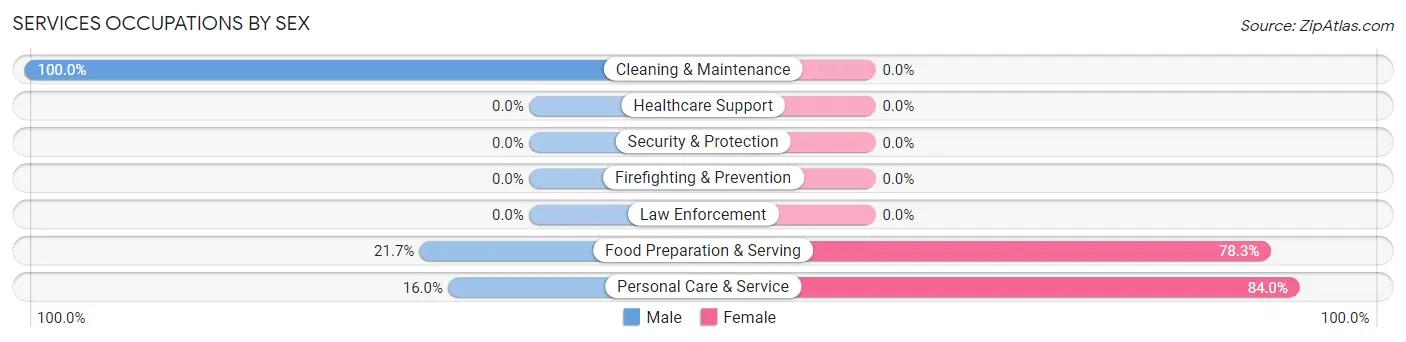
Services Occupations by Sex
Within the Services occupations in Pine Bluffs, the most male-oriented occupations are Cleaning & Maintenance (100.0%), Food Preparation & Serving (21.7%), and Personal Care & Service (16.0%), while the most female-oriented occupations are Personal Care & Service (84.0%), and Food Preparation & Serving (78.3%).
| Occupation | Male | Female |
| Healthcare Support | 0 (0.0%) | 0 (0.0%) |
| Security & Protection | 0 (0.0%) | 0 (0.0%) |
| Firefighting & Prevention | 0 (0.0%) | 0 (0.0%) |
| Law Enforcement | 0 (0.0%) | 0 (0.0%) |
| Food Preparation & Serving | 13 (21.7%) | 47 (78.3%) |
| Cleaning & Maintenance | 5 (100.0%) | 0 (0.0%) |
| Personal Care & Service | 4 (16.0%) | 21 (84.0%) |
| Total (Category) | 22 (24.4%) | 68 (75.6%) |
| Total (Overall) | 411 (71.4%) | 165 (28.6%) |
Sales and Office Occupations
The most common Sales and Office occupations in Pine Bluffs are Sales & Related (62 | 10.8%), and Office & Administration (30 | 5.2%).

Sales and Office Occupations by Sex

| Occupation | Male | Female |
| Sales & Related | 56 (90.3%) | 6 (9.7%) |
| Office & Administration | 0 (0.0%) | 30 (100.0%) |
| Total (Category) | 56 (60.9%) | 36 (39.1%) |
| Total (Overall) | 411 (71.4%) | 165 (28.6%) |
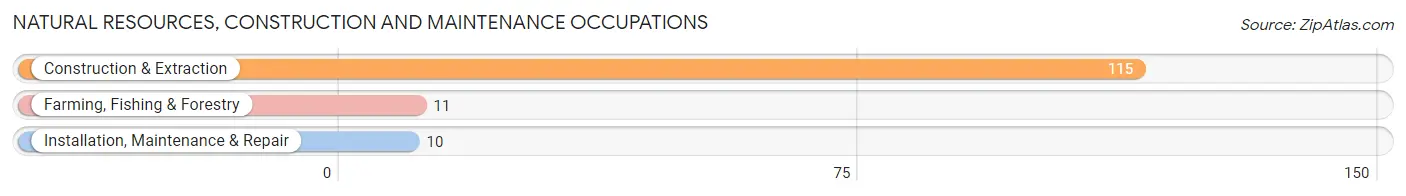
Natural Resources, Construction and Maintenance Occupations
The most common Natural Resources, Construction and Maintenance occupations in Pine Bluffs are Construction & Extraction (115 | 20.0%), Farming, Fishing & Forestry (11 | 1.9%), and Installation, Maintenance & Repair (10 | 1.7%).
Natural Resources, Construction and Maintenance Occupations by Sex
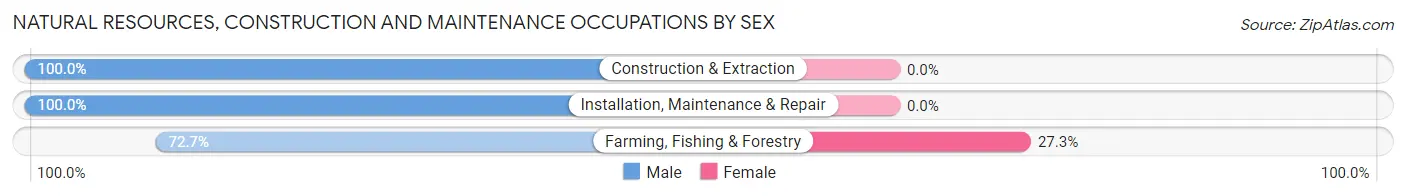
| Occupation | Male | Female |
| Farming, Fishing & Forestry | 8 (72.7%) | 3 (27.3%) |
| Construction & Extraction | 115 (100.0%) | 0 (0.0%) |
| Installation, Maintenance & Repair | 10 (100.0%) | 0 (0.0%) |
| Total (Category) | 133 (97.8%) | 3 (2.2%) |
| Total (Overall) | 411 (71.4%) | 165 (28.6%) |
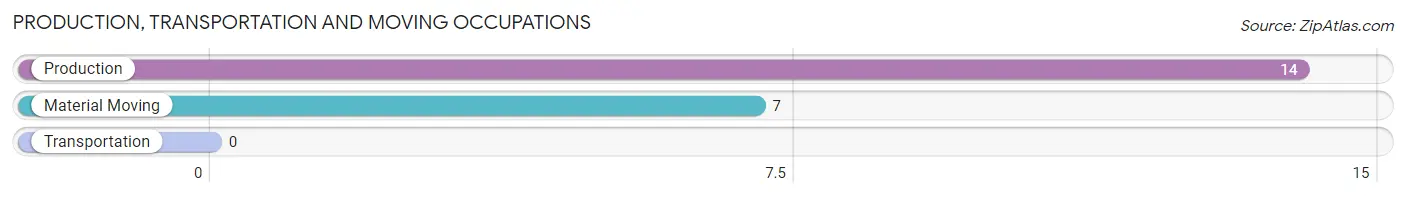
Production, Transportation and Moving Occupations
The most common Production, Transportation and Moving occupations in Pine Bluffs are Production (14 | 2.4%), and Material Moving (7 | 1.2%).
Production, Transportation and Moving Occupations by Sex
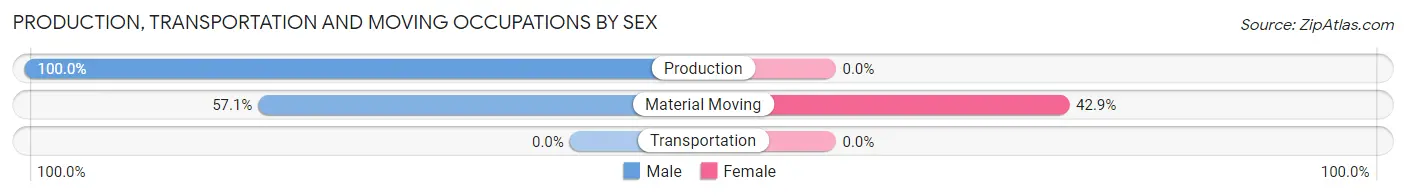
| Occupation | Male | Female |
| Production | 14 (100.0%) | 0 (0.0%) |
| Transportation | 0 (0.0%) | 0 (0.0%) |
| Material Moving | 4 (57.1%) | 3 (42.9%) |
| Total (Category) | 18 (85.7%) | 3 (14.3%) |
| Total (Overall) | 411 (71.4%) | 165 (28.6%) |
Employment Industries by Sex in Pine Bluffs
Employment Industries in Pine Bluffs
The major employment industries in Pine Bluffs include Educational Services (135 | 23.4%), Construction (112 | 19.4%), Accommodation & Food Services (60 | 10.4%), Retail Trade (45 | 7.8%), and Agriculture, Fishing & Hunting (30 | 5.2%).

Employment Industries by Sex in Pine Bluffs
The Pine Bluffs industries that see more men than women are Construction (100.0%), Transportation & Warehousing (100.0%), and Information (100.0%), whereas the industries that tend to have a higher number of women are Utilities (100.0%), Professional & Scientific (100.0%), and Arts, Entertainment & Recreation (100.0%).
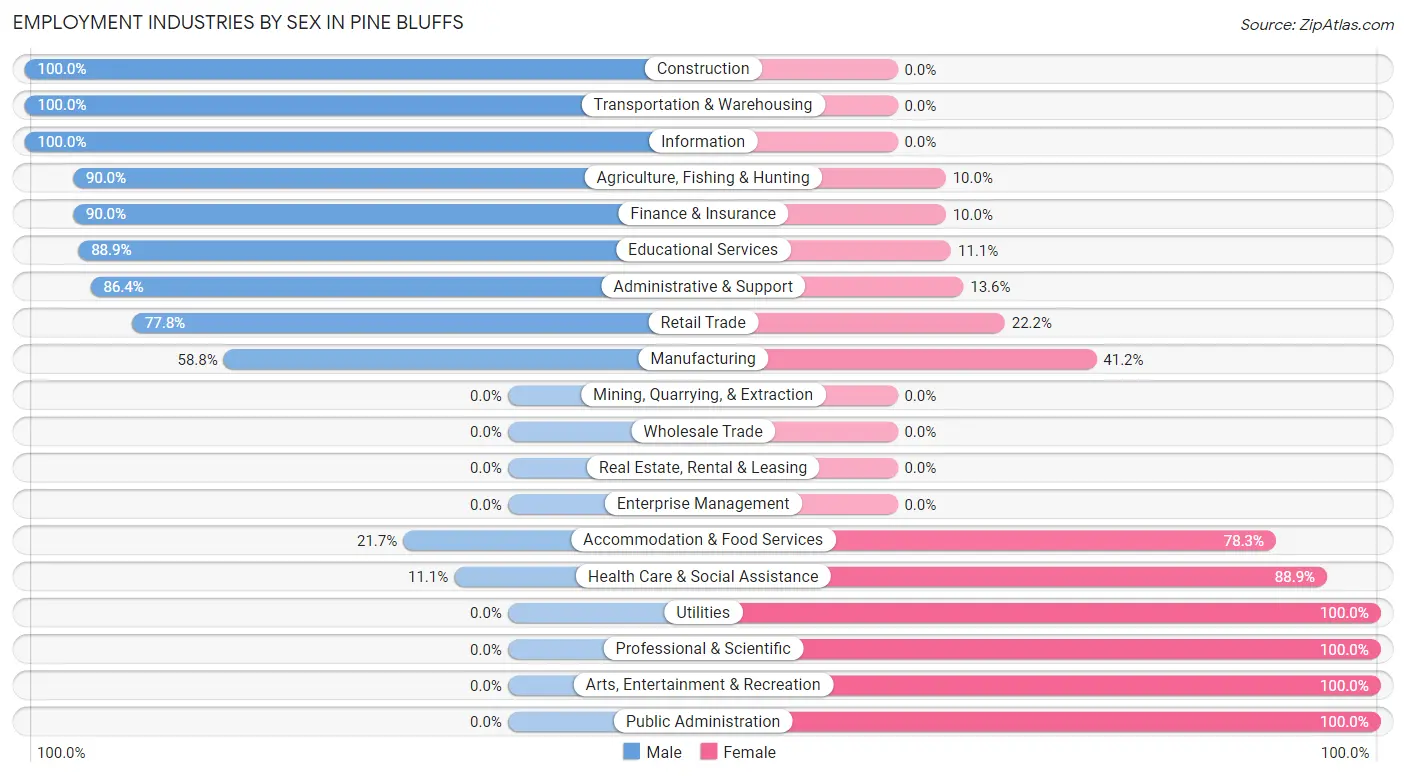
| Industry | Male | Female |
| Agriculture, Fishing & Hunting | 27 (90.0%) | 3 (10.0%) |
| Mining, Quarrying, & Extraction | 0 (0.0%) | 0 (0.0%) |
| Construction | 112 (100.0%) | 0 (0.0%) |
| Manufacturing | 10 (58.8%) | 7 (41.2%) |
| Wholesale Trade | 0 (0.0%) | 0 (0.0%) |
| Retail Trade | 35 (77.8%) | 10 (22.2%) |
| Transportation & Warehousing | 7 (100.0%) | 0 (0.0%) |
| Utilities | 0 (0.0%) | 3 (100.0%) |
| Information | 23 (100.0%) | 0 (0.0%) |
| Finance & Insurance | 27 (90.0%) | 3 (10.0%) |
| Real Estate, Rental & Leasing | 0 (0.0%) | 0 (0.0%) |
| Professional & Scientific | 0 (0.0%) | 18 (100.0%) |
| Enterprise Management | 0 (0.0%) | 0 (0.0%) |
| Administrative & Support | 19 (86.4%) | 3 (13.6%) |
| Educational Services | 120 (88.9%) | 15 (11.1%) |
| Health Care & Social Assistance | 3 (11.1%) | 24 (88.9%) |
| Arts, Entertainment & Recreation | 0 (0.0%) | 21 (100.0%) |
| Accommodation & Food Services | 13 (21.7%) | 47 (78.3%) |
| Public Administration | 0 (0.0%) | 5 (100.0%) |
| Total | 411 (71.4%) | 165 (28.6%) |
Education in Pine Bluffs
School Enrollment in Pine Bluffs
The most common levels of schooling among the 327 students in Pine Bluffs are elementary school (131 | 40.1%), middle school (63 | 19.3%), and kindergarten (54 | 16.5%).
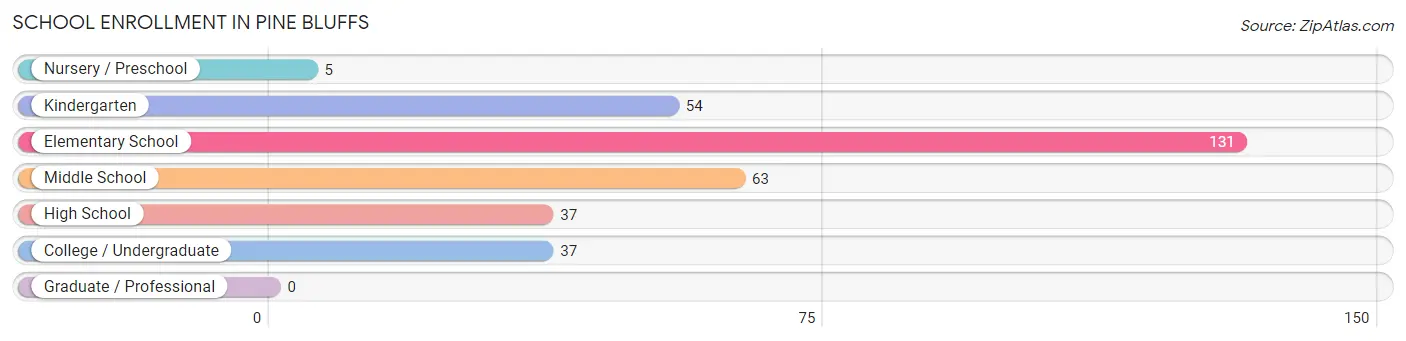
| School Level | # Students | % Students |
| Nursery / Preschool | 5 | 1.5% |
| Kindergarten | 54 | 16.5% |
| Elementary School | 131 | 40.1% |
| Middle School | 63 | 19.3% |
| High School | 37 | 11.3% |
| College / Undergraduate | 37 | 11.3% |
| Graduate / Professional | 0 | 0.0% |
| Total | 327 | 100.0% |
School Enrollment by Age by Funding Source in Pine Bluffs
Out of a total of 327 students who are enrolled in schools in Pine Bluffs, 10 (3.1%) attend a private institution, while the remaining 317 (96.9%) are enrolled in public schools. The age group of 15 to 17 year olds has the highest likelihood of being enrolled in private schools, with 2 (15.4% in the age bracket) enrolled. Conversely, the age group of 5 to 9 year old has the lowest likelihood of being enrolled in a private school, with 183 (100.0% in the age bracket) attending a public institution.
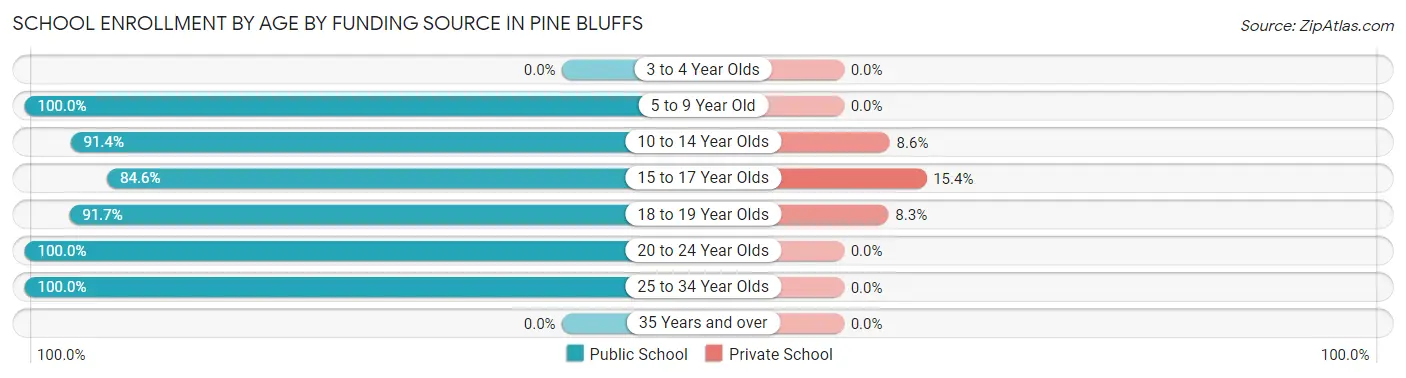
| Age Bracket | Public School | Private School |
| 3 to 4 Year Olds | 0 (0.0%) | 0 (0.0%) |
| 5 to 9 Year Old | 183 (100.0%) | 0 (0.0%) |
| 10 to 14 Year Olds | 64 (91.4%) | 6 (8.6%) |
| 15 to 17 Year Olds | 11 (84.6%) | 2 (15.4%) |
| 18 to 19 Year Olds | 22 (91.7%) | 2 (8.3%) |
| 20 to 24 Year Olds | 11 (100.0%) | 0 (0.0%) |
| 25 to 34 Year Olds | 26 (100.0%) | 0 (0.0%) |
| 35 Years and over | 0 (0.0%) | 0 (0.0%) |
| Total | 317 (96.9%) | 10 (3.1%) |
Educational Attainment by Field of Study in Pine Bluffs
Education (171 | 69.0%), liberal arts & history (15 | 6.0%), business (13 | 5.2%), science & technology (12 | 4.8%), and physical & health sciences (8 | 3.2%) are the most common fields of study among 248 individuals in Pine Bluffs who have obtained a bachelor's degree or higher.
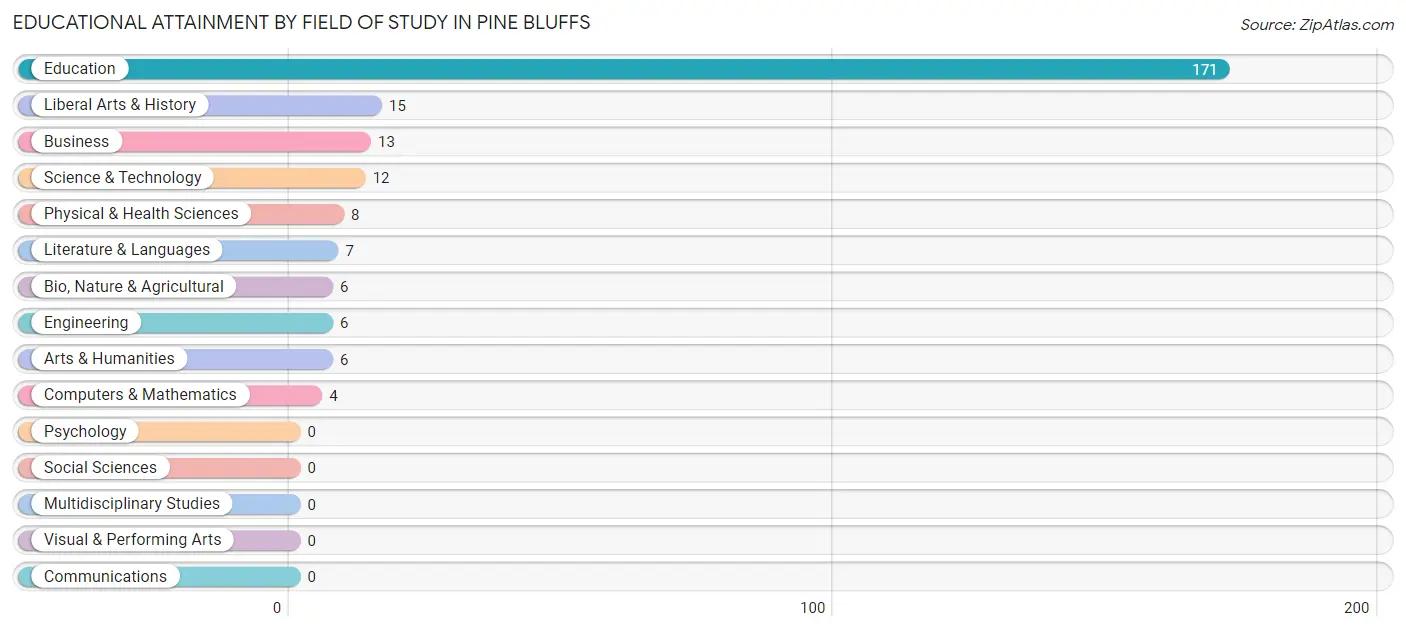
| Field of Study | # Graduates | % Graduates |
| Computers & Mathematics | 4 | 1.6% |
| Bio, Nature & Agricultural | 6 | 2.4% |
| Physical & Health Sciences | 8 | 3.2% |
| Psychology | 0 | 0.0% |
| Social Sciences | 0 | 0.0% |
| Engineering | 6 | 2.4% |
| Multidisciplinary Studies | 0 | 0.0% |
| Science & Technology | 12 | 4.8% |
| Business | 13 | 5.2% |
| Education | 171 | 69.0% |
| Literature & Languages | 7 | 2.8% |
| Liberal Arts & History | 15 | 6.0% |
| Visual & Performing Arts | 0 | 0.0% |
| Communications | 0 | 0.0% |
| Arts & Humanities | 6 | 2.4% |
| Total | 248 | 100.0% |
Transportation & Commute in Pine Bluffs
Vehicle Availability by Sex in Pine Bluffs
The most prevalent vehicle ownership categories in Pine Bluffs are males with 2 vehicles (183, accounting for 43.8%) and females with 2 vehicles (57, making up 110.9%).
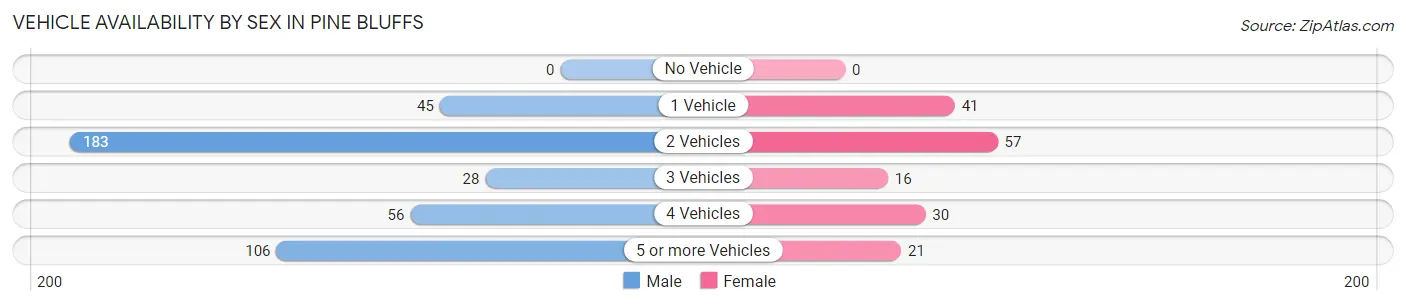
| Vehicles Available | Male | Female |
| No Vehicle | 0 (0.0%) | 0 (0.0%) |
| 1 Vehicle | 45 (10.8%) | 41 (24.8%) |
| 2 Vehicles | 183 (43.8%) | 57 (34.5%) |
| 3 Vehicles | 28 (6.7%) | 16 (9.7%) |
| 4 Vehicles | 56 (13.4%) | 30 (18.2%) |
| 5 or more Vehicles | 106 (25.4%) | 21 (12.7%) |
| Total | 418 (100.0%) | 165 (100.0%) |
Commute Time in Pine Bluffs
The most frequently occuring commute durations in Pine Bluffs are less than 5 minutes (262 commuters, 47.4%), 5 to 9 minutes (127 commuters, 23.0%), and 25 to 29 minutes (48 commuters, 8.7%).
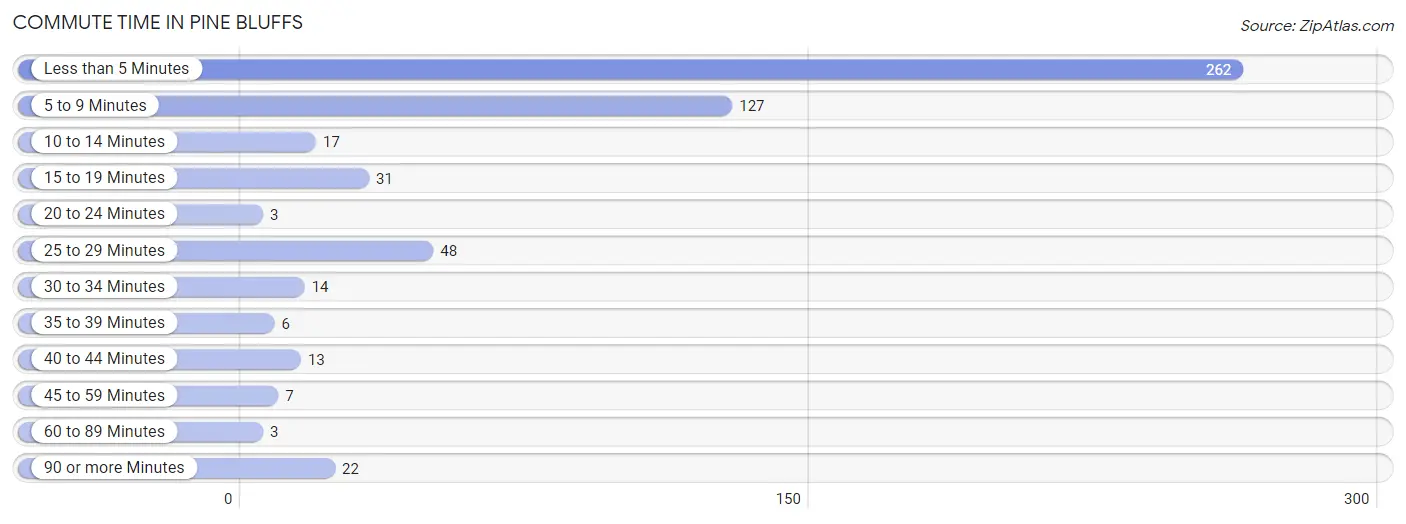
| Commute Time | # Commuters | % Commuters |
| Less than 5 Minutes | 262 | 47.4% |
| 5 to 9 Minutes | 127 | 23.0% |
| 10 to 14 Minutes | 17 | 3.1% |
| 15 to 19 Minutes | 31 | 5.6% |
| 20 to 24 Minutes | 3 | 0.5% |
| 25 to 29 Minutes | 48 | 8.7% |
| 30 to 34 Minutes | 14 | 2.5% |
| 35 to 39 Minutes | 6 | 1.1% |
| 40 to 44 Minutes | 13 | 2.4% |
| 45 to 59 Minutes | 7 | 1.3% |
| 60 to 89 Minutes | 3 | 0.5% |
| 90 or more Minutes | 22 | 4.0% |
Commute Time by Sex in Pine Bluffs
The most common commute times in Pine Bluffs are less than 5 minutes (231 commuters, 58.5%) for males and 5 to 9 minutes (63 commuters, 39.9%) for females.
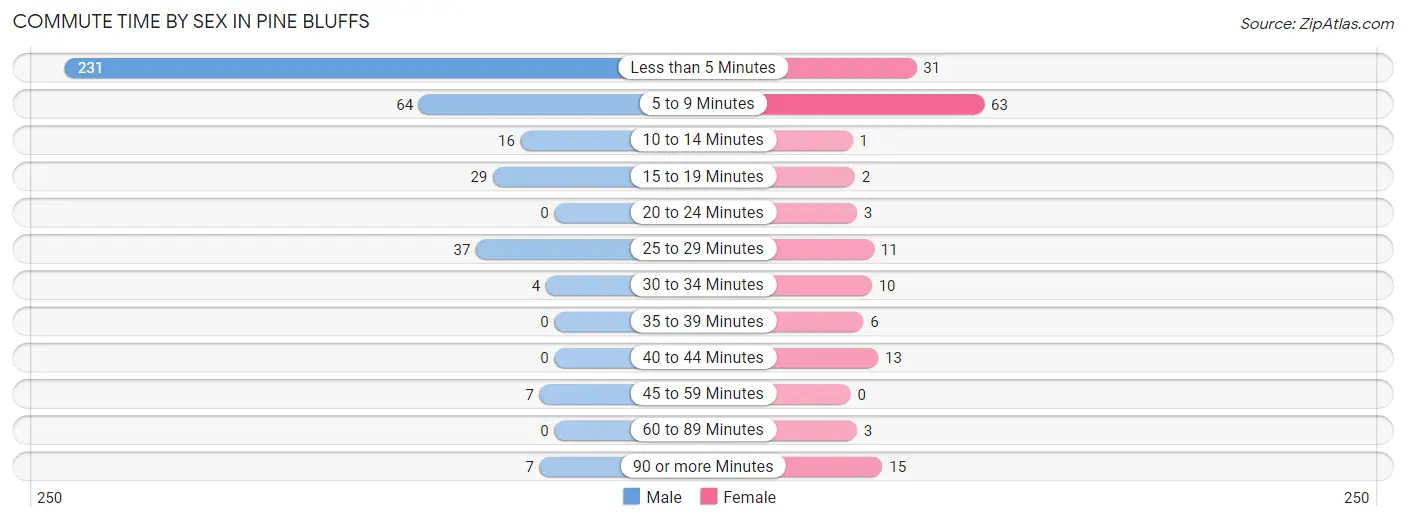
| Commute Time | Male | Female |
| Less than 5 Minutes | 231 (58.5%) | 31 (19.6%) |
| 5 to 9 Minutes | 64 (16.2%) | 63 (39.9%) |
| 10 to 14 Minutes | 16 (4.1%) | 1 (0.6%) |
| 15 to 19 Minutes | 29 (7.3%) | 2 (1.3%) |
| 20 to 24 Minutes | 0 (0.0%) | 3 (1.9%) |
| 25 to 29 Minutes | 37 (9.4%) | 11 (7.0%) |
| 30 to 34 Minutes | 4 (1.0%) | 10 (6.3%) |
| 35 to 39 Minutes | 0 (0.0%) | 6 (3.8%) |
| 40 to 44 Minutes | 0 (0.0%) | 13 (8.2%) |
| 45 to 59 Minutes | 7 (1.8%) | 0 (0.0%) |
| 60 to 89 Minutes | 0 (0.0%) | 3 (1.9%) |
| 90 or more Minutes | 7 (1.8%) | 15 (9.5%) |
Time of Departure to Work by Sex in Pine Bluffs
The most frequent times of departure to work in Pine Bluffs are 7:00 AM to 7:29 AM (216, 54.7%) for males and 7:30 AM to 7:59 AM (52, 32.9%) for females.
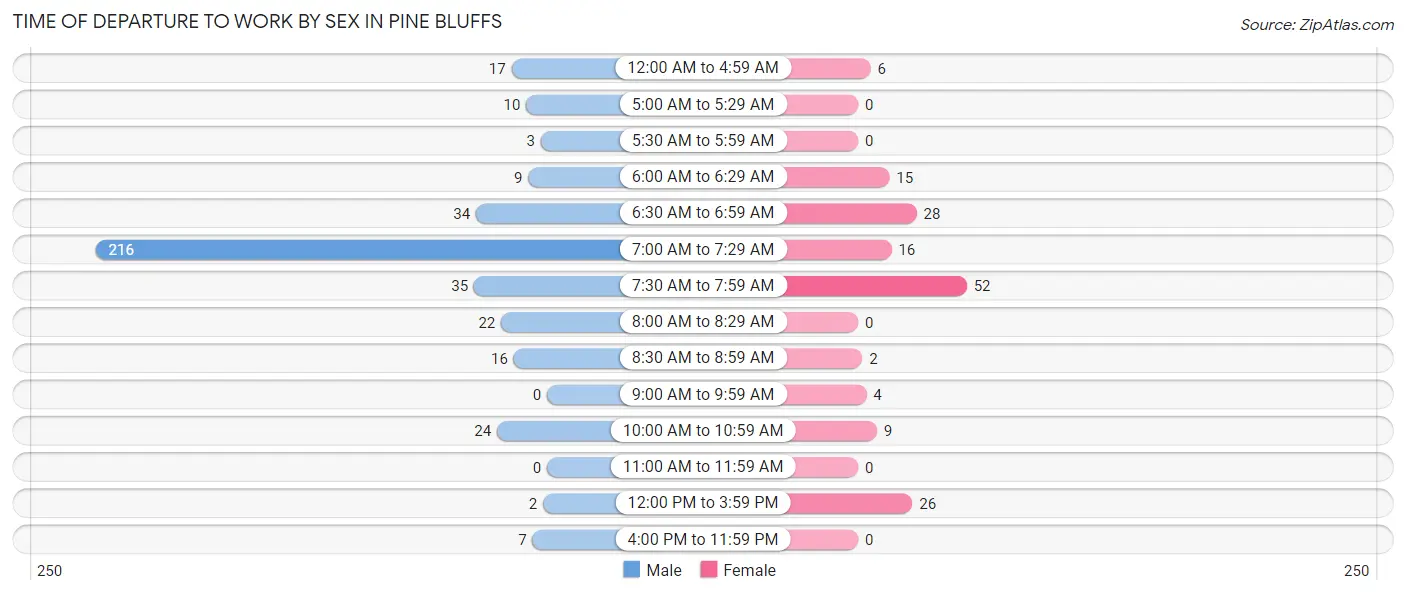
| Time of Departure | Male | Female |
| 12:00 AM to 4:59 AM | 17 (4.3%) | 6 (3.8%) |
| 5:00 AM to 5:29 AM | 10 (2.5%) | 0 (0.0%) |
| 5:30 AM to 5:59 AM | 3 (0.8%) | 0 (0.0%) |
| 6:00 AM to 6:29 AM | 9 (2.3%) | 15 (9.5%) |
| 6:30 AM to 6:59 AM | 34 (8.6%) | 28 (17.7%) |
| 7:00 AM to 7:29 AM | 216 (54.7%) | 16 (10.1%) |
| 7:30 AM to 7:59 AM | 35 (8.9%) | 52 (32.9%) |
| 8:00 AM to 8:29 AM | 22 (5.6%) | 0 (0.0%) |
| 8:30 AM to 8:59 AM | 16 (4.1%) | 2 (1.3%) |
| 9:00 AM to 9:59 AM | 0 (0.0%) | 4 (2.5%) |
| 10:00 AM to 10:59 AM | 24 (6.1%) | 9 (5.7%) |
| 11:00 AM to 11:59 AM | 0 (0.0%) | 0 (0.0%) |
| 12:00 PM to 3:59 PM | 2 (0.5%) | 26 (16.5%) |
| 4:00 PM to 11:59 PM | 7 (1.8%) | 0 (0.0%) |
| Total | 395 (100.0%) | 158 (100.0%) |
Housing Occupancy in Pine Bluffs
Occupancy by Ownership in Pine Bluffs
Of the total 547 dwellings in Pine Bluffs, owner-occupied units account for 424 (77.5%), while renter-occupied units make up 123 (22.5%).
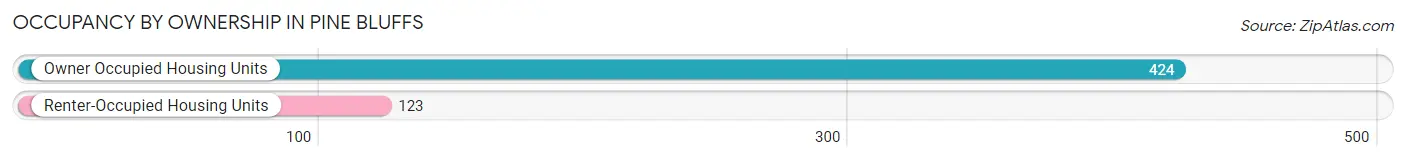
| Occupancy | # Housing Units | % Housing Units |
| Owner Occupied Housing Units | 424 | 77.5% |
| Renter-Occupied Housing Units | 123 | 22.5% |
| Total Occupied Housing Units | 547 | 100.0% |
Occupancy by Household Size in Pine Bluffs
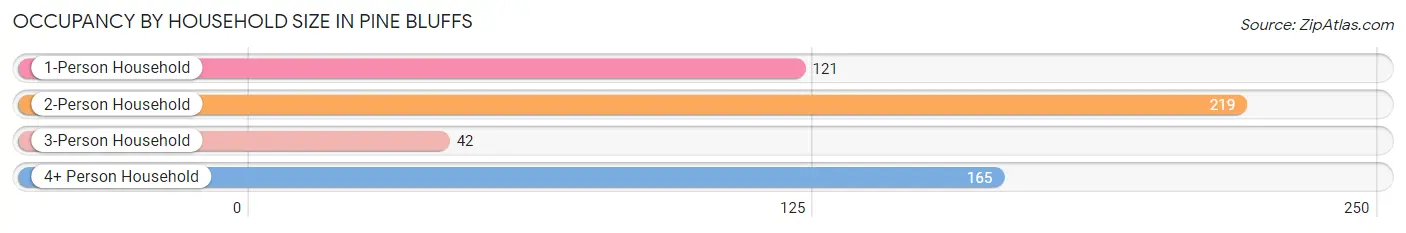
| Household Size | # Housing Units | % Housing Units |
| 1-Person Household | 121 | 22.1% |
| 2-Person Household | 219 | 40.0% |
| 3-Person Household | 42 | 7.7% |
| 4+ Person Household | 165 | 30.2% |
| Total Housing Units | 547 | 100.0% |
Occupancy by Ownership by Household Size in Pine Bluffs
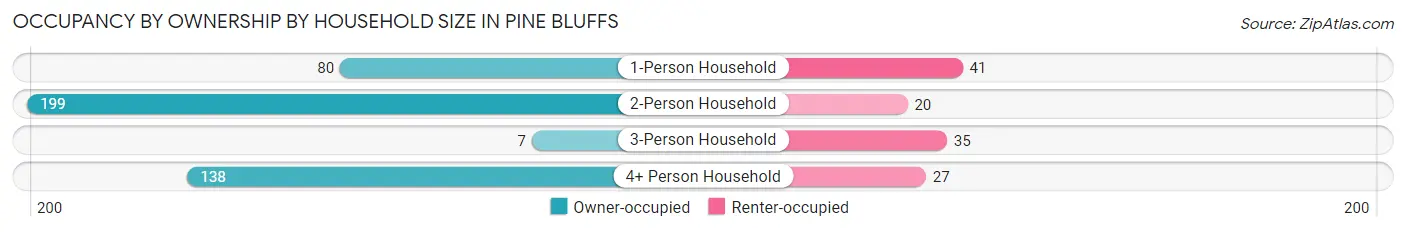
| Household Size | Owner-occupied | Renter-occupied |
| 1-Person Household | 80 (66.1%) | 41 (33.9%) |
| 2-Person Household | 199 (90.9%) | 20 (9.1%) |
| 3-Person Household | 7 (16.7%) | 35 (83.3%) |
| 4+ Person Household | 138 (83.6%) | 27 (16.4%) |
| Total Housing Units | 424 (77.5%) | 123 (22.5%) |
Occupancy by Educational Attainment in Pine Bluffs
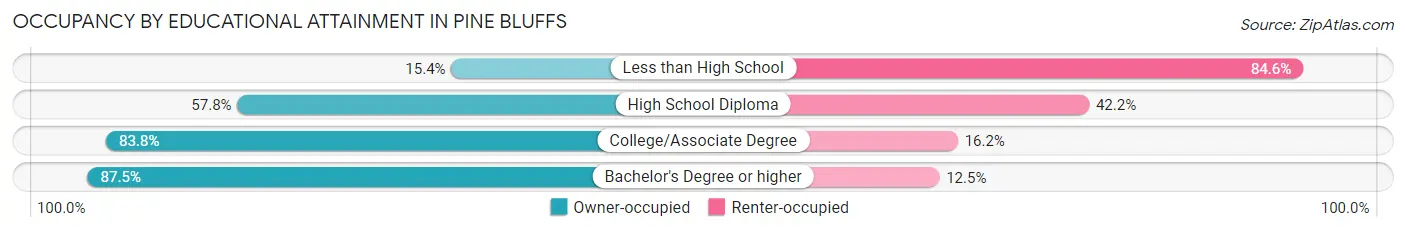
| Household Size | Owner-occupied | Renter-occupied |
| Less than High School | 2 (15.4%) | 11 (84.6%) |
| High School Diploma | 74 (57.8%) | 54 (42.2%) |
| College/Associate Degree | 166 (83.8%) | 32 (16.2%) |
| Bachelor's Degree or higher | 182 (87.5%) | 26 (12.5%) |
Occupancy by Age of Householder in Pine Bluffs
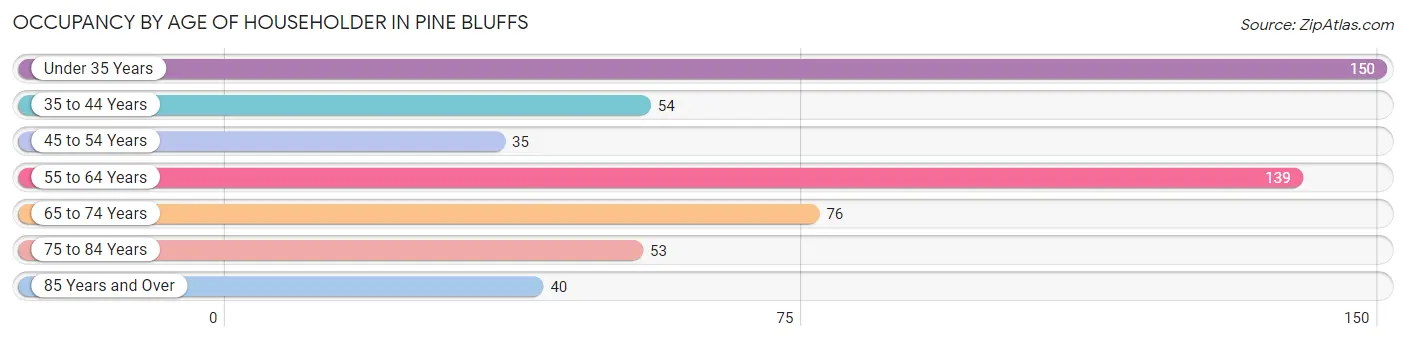
| Age Bracket | # Households | % Households |
| Under 35 Years | 150 | 27.4% |
| 35 to 44 Years | 54 | 9.9% |
| 45 to 54 Years | 35 | 6.4% |
| 55 to 64 Years | 139 | 25.4% |
| 65 to 74 Years | 76 | 13.9% |
| 75 to 84 Years | 53 | 9.7% |
| 85 Years and Over | 40 | 7.3% |
| Total | 547 | 100.0% |
Housing Finances in Pine Bluffs
Median Income by Occupancy in Pine Bluffs
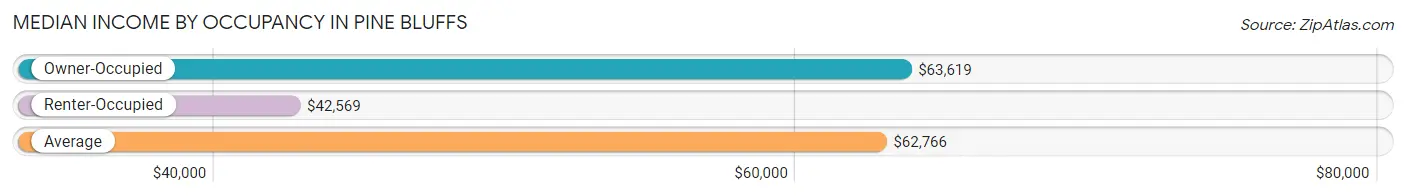
| Occupancy Type | # Households | Median Income |
| Owner-Occupied | 424 (77.5%) | $63,619 |
| Renter-Occupied | 123 (22.5%) | $42,569 |
| Average | 547 (100.0%) | $62,766 |
Occupancy by Householder Income Bracket in Pine Bluffs
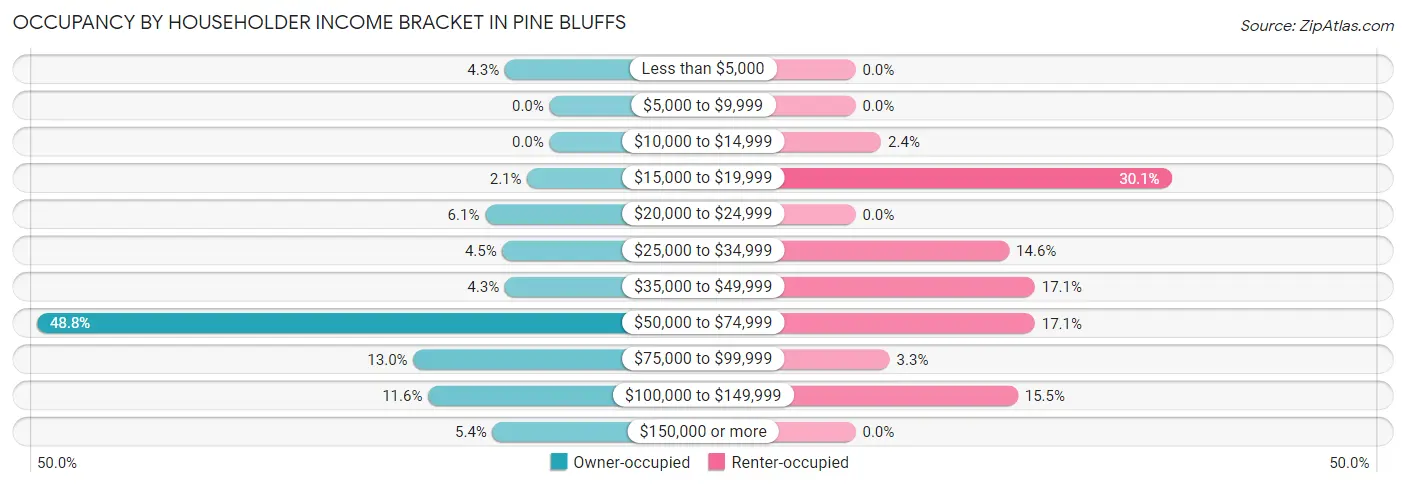
| Income Bracket | Owner-occupied | Renter-occupied |
| Less than $5,000 | 18 (4.3%) | 0 (0.0%) |
| $5,000 to $9,999 | 0 (0.0%) | 0 (0.0%) |
| $10,000 to $14,999 | 0 (0.0%) | 3 (2.4%) |
| $15,000 to $19,999 | 9 (2.1%) | 37 (30.1%) |
| $20,000 to $24,999 | 26 (6.1%) | 0 (0.0%) |
| $25,000 to $34,999 | 19 (4.5%) | 18 (14.6%) |
| $35,000 to $49,999 | 18 (4.3%) | 21 (17.1%) |
| $50,000 to $74,999 | 207 (48.8%) | 21 (17.1%) |
| $75,000 to $99,999 | 55 (13.0%) | 4 (3.3%) |
| $100,000 to $149,999 | 49 (11.6%) | 19 (15.4%) |
| $150,000 or more | 23 (5.4%) | 0 (0.0%) |
| Total | 424 (100.0%) | 123 (100.0%) |
Monthly Housing Cost Tiers in Pine Bluffs
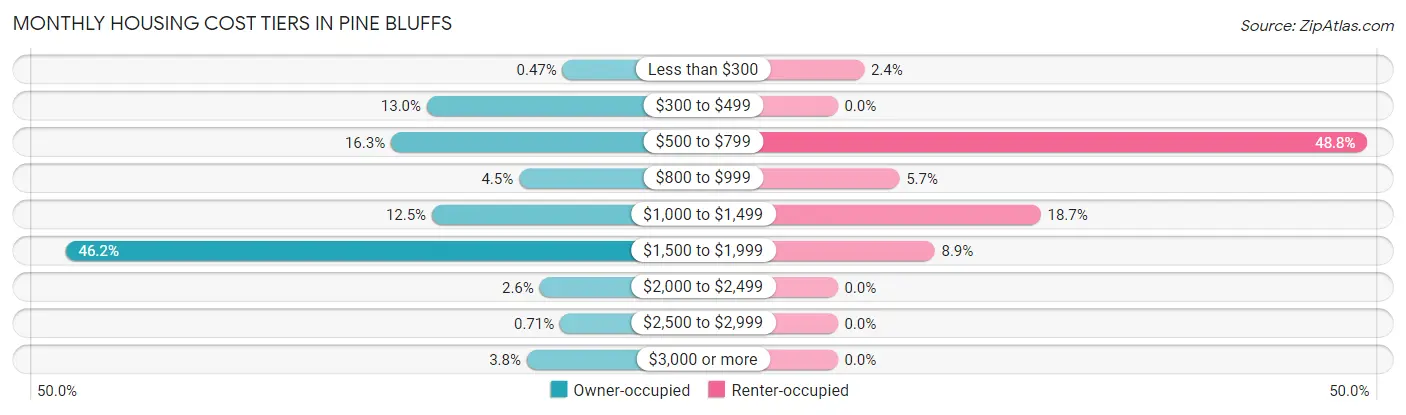
| Monthly Cost | Owner-occupied | Renter-occupied |
| Less than $300 | 2 (0.5%) | 3 (2.4%) |
| $300 to $499 | 55 (13.0%) | 0 (0.0%) |
| $500 to $799 | 69 (16.3%) | 60 (48.8%) |
| $800 to $999 | 19 (4.5%) | 7 (5.7%) |
| $1,000 to $1,499 | 53 (12.5%) | 23 (18.7%) |
| $1,500 to $1,999 | 196 (46.2%) | 11 (8.9%) |
| $2,000 to $2,499 | 11 (2.6%) | 0 (0.0%) |
| $2,500 to $2,999 | 3 (0.7%) | 0 (0.0%) |
| $3,000 or more | 16 (3.8%) | 0 (0.0%) |
| Total | 424 (100.0%) | 123 (100.0%) |
Physical Housing Characteristics in Pine Bluffs
Housing Structures in Pine Bluffs
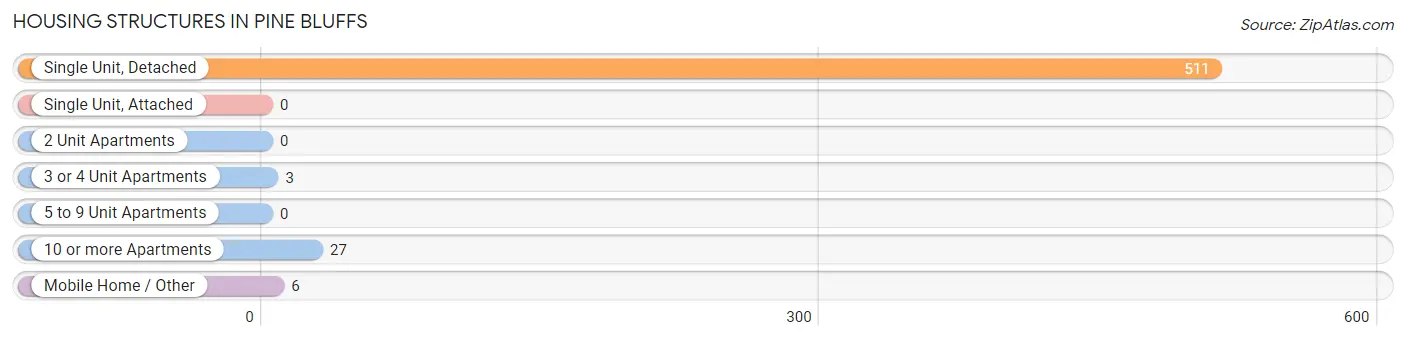
| Structure Type | # Housing Units | % Housing Units |
| Single Unit, Detached | 511 | 93.4% |
| Single Unit, Attached | 0 | 0.0% |
| 2 Unit Apartments | 0 | 0.0% |
| 3 or 4 Unit Apartments | 3 | 0.5% |
| 5 to 9 Unit Apartments | 0 | 0.0% |
| 10 or more Apartments | 27 | 4.9% |
| Mobile Home / Other | 6 | 1.1% |
| Total | 547 | 100.0% |
Housing Structures by Occupancy in Pine Bluffs
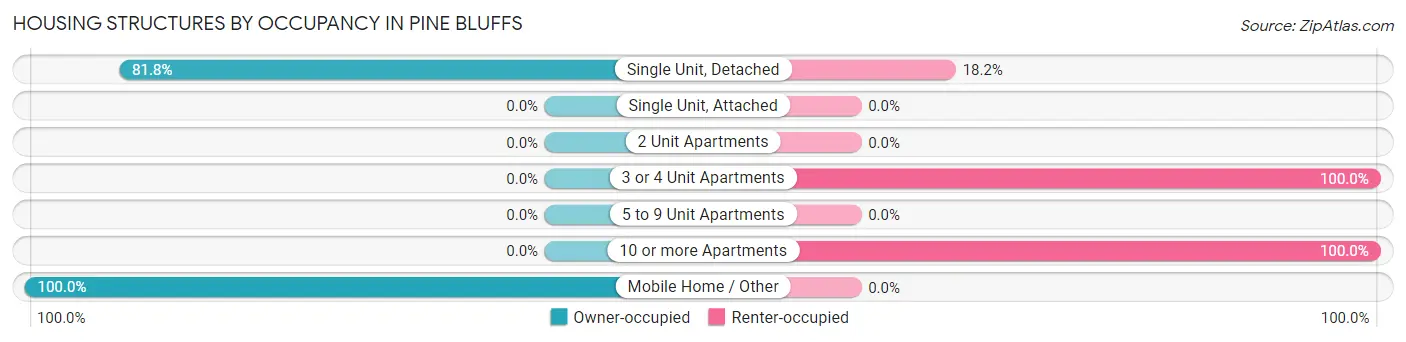
| Structure Type | Owner-occupied | Renter-occupied |
| Single Unit, Detached | 418 (81.8%) | 93 (18.2%) |
| Single Unit, Attached | 0 (0.0%) | 0 (0.0%) |
| 2 Unit Apartments | 0 (0.0%) | 0 (0.0%) |
| 3 or 4 Unit Apartments | 0 (0.0%) | 3 (100.0%) |
| 5 to 9 Unit Apartments | 0 (0.0%) | 0 (0.0%) |
| 10 or more Apartments | 0 (0.0%) | 27 (100.0%) |
| Mobile Home / Other | 6 (100.0%) | 0 (0.0%) |
| Total | 424 (77.5%) | 123 (22.5%) |
Housing Structures by Number of Rooms in Pine Bluffs
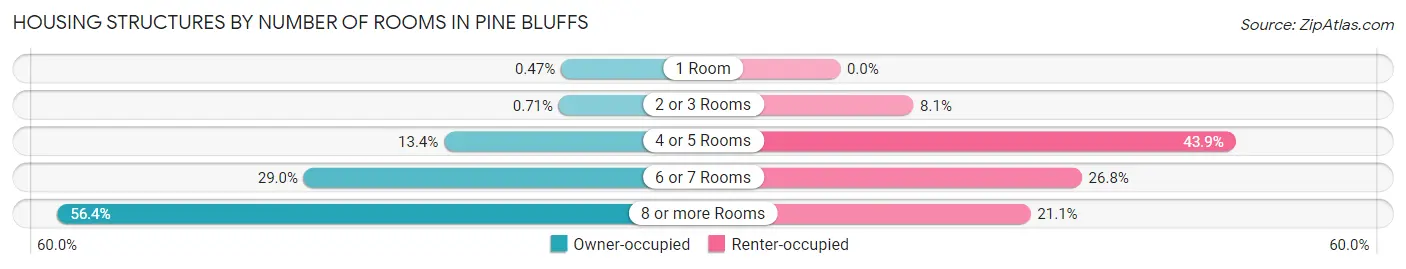
| Number of Rooms | Owner-occupied | Renter-occupied |
| 1 Room | 2 (0.5%) | 0 (0.0%) |
| 2 or 3 Rooms | 3 (0.7%) | 10 (8.1%) |
| 4 or 5 Rooms | 57 (13.4%) | 54 (43.9%) |
| 6 or 7 Rooms | 123 (29.0%) | 33 (26.8%) |
| 8 or more Rooms | 239 (56.4%) | 26 (21.1%) |
| Total | 424 (100.0%) | 123 (100.0%) |
Housing Structure by Heating Type in Pine Bluffs
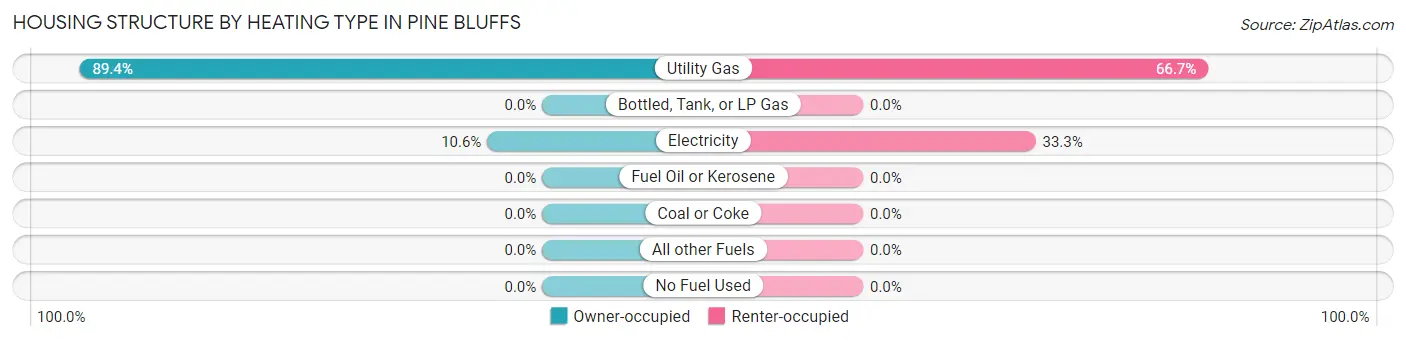
| Heating Type | Owner-occupied | Renter-occupied |
| Utility Gas | 379 (89.4%) | 82 (66.7%) |
| Bottled, Tank, or LP Gas | 0 (0.0%) | 0 (0.0%) |
| Electricity | 45 (10.6%) | 41 (33.3%) |
| Fuel Oil or Kerosene | 0 (0.0%) | 0 (0.0%) |
| Coal or Coke | 0 (0.0%) | 0 (0.0%) |
| All other Fuels | 0 (0.0%) | 0 (0.0%) |
| No Fuel Used | 0 (0.0%) | 0 (0.0%) |
| Total | 424 (100.0%) | 123 (100.0%) |
Household Vehicle Usage in Pine Bluffs
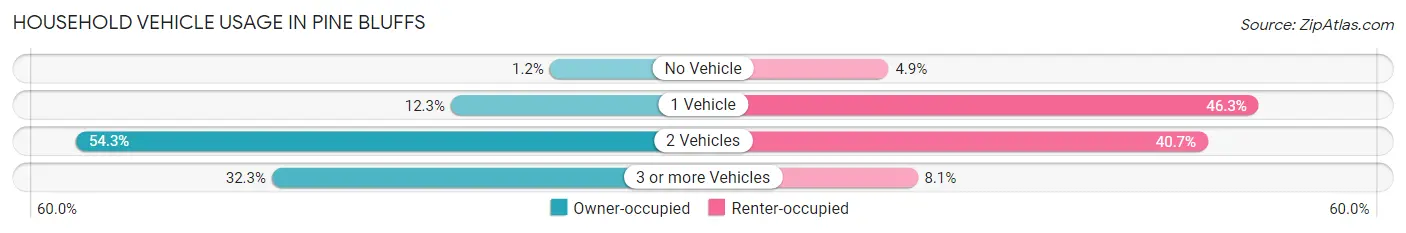
| Vehicles per Household | Owner-occupied | Renter-occupied |
| No Vehicle | 5 (1.2%) | 6 (4.9%) |
| 1 Vehicle | 52 (12.3%) | 57 (46.3%) |
| 2 Vehicles | 230 (54.2%) | 50 (40.6%) |
| 3 or more Vehicles | 137 (32.3%) | 10 (8.1%) |
| Total | 424 (100.0%) | 123 (100.0%) |
Real Estate & Mortgages in Pine Bluffs
Real Estate and Mortgage Overview in Pine Bluffs
| Characteristic | Without Mortgage | With Mortgage |
| Housing Units | 123 | 301 |
| Median Property Value | $231,700 | $321,700 |
| Median Household Income | $53,854 | $21 |
| Monthly Housing Costs | $513 | $16 |
| Real Estate Taxes | $1,199 | $0 |
Property Value by Mortgage Status in Pine Bluffs
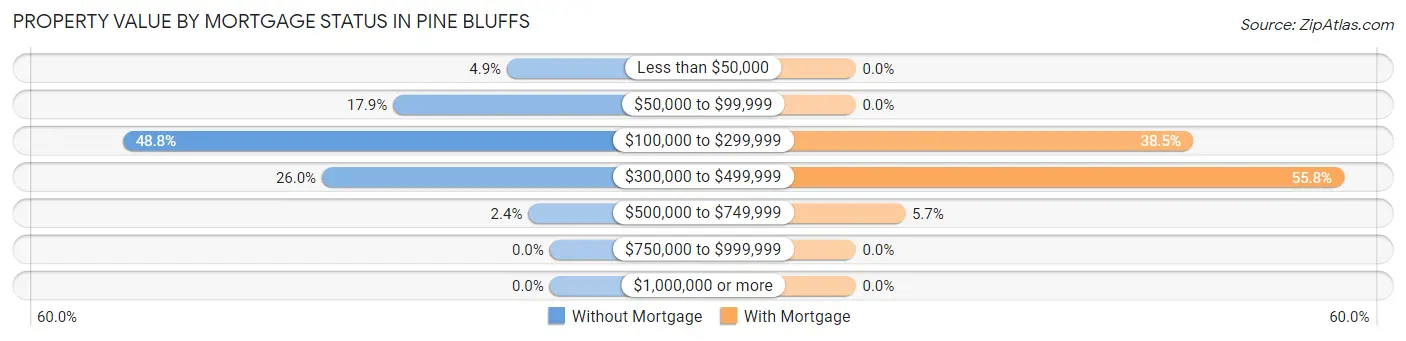
| Property Value | Without Mortgage | With Mortgage |
| Less than $50,000 | 6 (4.9%) | 0 (0.0%) |
| $50,000 to $99,999 | 22 (17.9%) | 0 (0.0%) |
| $100,000 to $299,999 | 60 (48.8%) | 116 (38.5%) |
| $300,000 to $499,999 | 32 (26.0%) | 168 (55.8%) |
| $500,000 to $749,999 | 3 (2.4%) | 17 (5.7%) |
| $750,000 to $999,999 | 0 (0.0%) | 0 (0.0%) |
| $1,000,000 or more | 0 (0.0%) | 0 (0.0%) |
| Total | 123 (100.0%) | 301 (100.0%) |
Household Income by Mortgage Status in Pine Bluffs
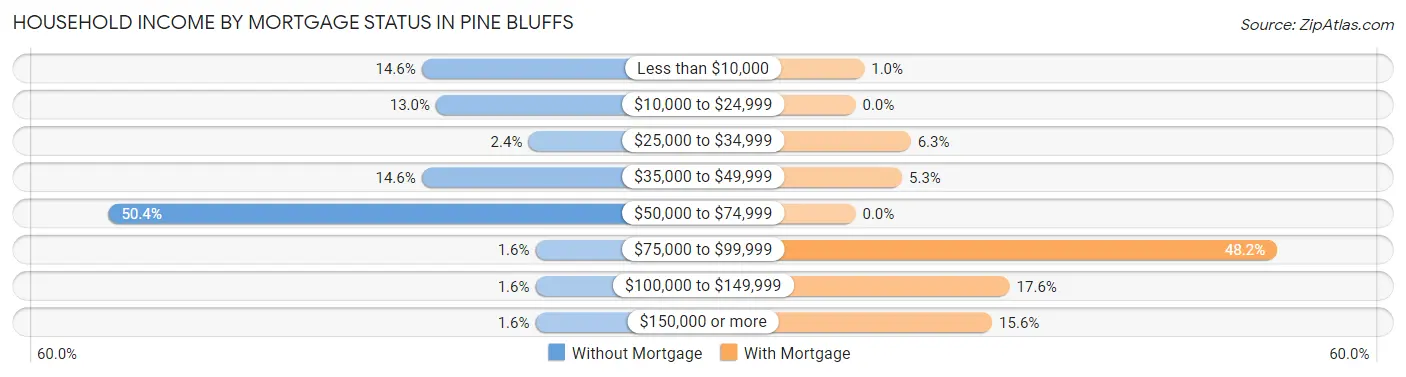
| Household Income | Without Mortgage | With Mortgage |
| Less than $10,000 | 18 (14.6%) | 3 (1.0%) |
| $10,000 to $24,999 | 16 (13.0%) | 0 (0.0%) |
| $25,000 to $34,999 | 3 (2.4%) | 19 (6.3%) |
| $35,000 to $49,999 | 18 (14.6%) | 16 (5.3%) |
| $50,000 to $74,999 | 62 (50.4%) | 0 (0.0%) |
| $75,000 to $99,999 | 2 (1.6%) | 145 (48.2%) |
| $100,000 to $149,999 | 2 (1.6%) | 53 (17.6%) |
| $150,000 or more | 2 (1.6%) | 47 (15.6%) |
| Total | 123 (100.0%) | 301 (100.0%) |
Property Value to Household Income Ratio in Pine Bluffs
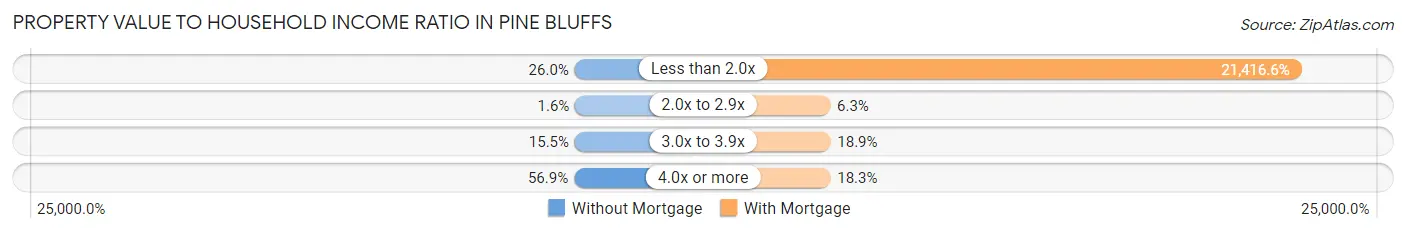
| Value-to-Income Ratio | Without Mortgage | With Mortgage |
| Less than 2.0x | 32 (26.0%) | 64,464 (21,416.6%) |
| 2.0x to 2.9x | 2 (1.6%) | 19 (6.3%) |
| 3.0x to 3.9x | 19 (15.4%) | 57 (18.9%) |
| 4.0x or more | 70 (56.9%) | 55 (18.3%) |
| Total | 123 (100.0%) | 301 (100.0%) |
Real Estate Taxes by Mortgage Status in Pine Bluffs
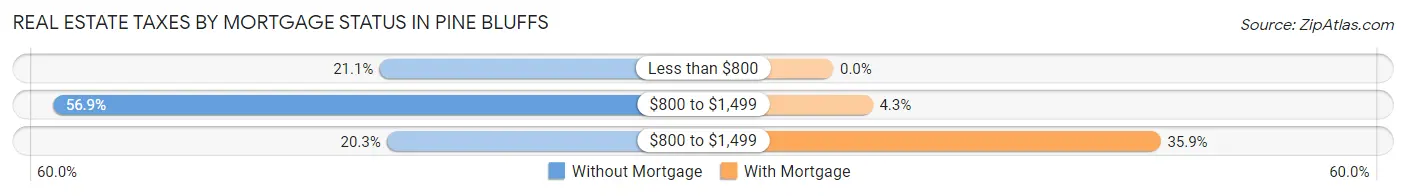
| Property Taxes | Without Mortgage | With Mortgage |
| Less than $800 | 26 (21.1%) | 0 (0.0%) |
| $800 to $1,499 | 70 (56.9%) | 13 (4.3%) |
| $800 to $1,499 | 25 (20.3%) | 108 (35.9%) |
| Total | 123 (100.0%) | 301 (100.0%) |
Health & Disability in Pine Bluffs
Health Insurance Coverage by Age in Pine Bluffs
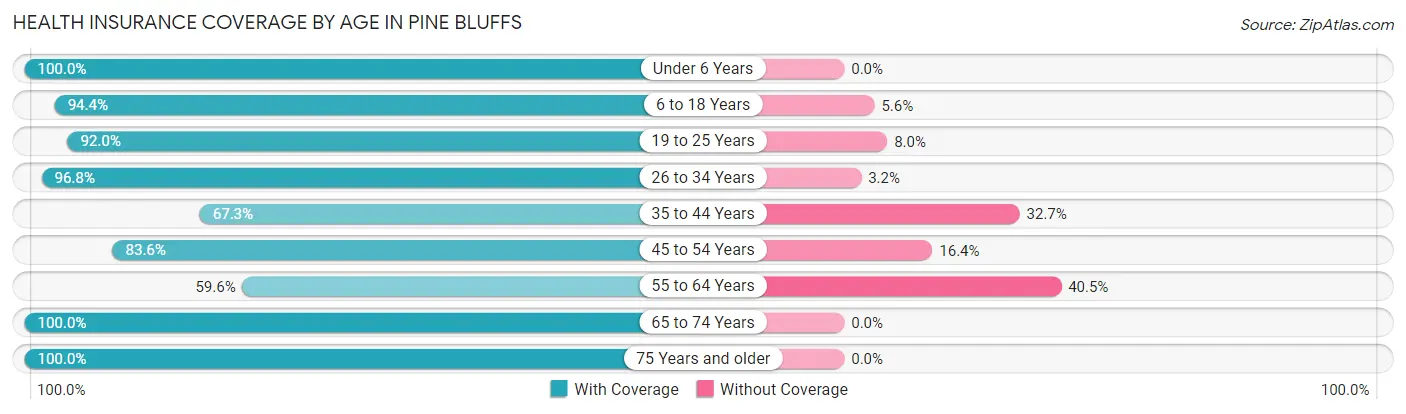
| Age Bracket | With Coverage | Without Coverage |
| Under 6 Years | 116 (100.0%) | 0 (0.0%) |
| 6 to 18 Years | 218 (94.4%) | 13 (5.6%) |
| 19 to 25 Years | 46 (92.0%) | 4 (8.0%) |
| 26 to 34 Years | 245 (96.8%) | 8 (3.2%) |
| 35 to 44 Years | 70 (67.3%) | 34 (32.7%) |
| 45 to 54 Years | 56 (83.6%) | 11 (16.4%) |
| 55 to 64 Years | 159 (59.6%) | 108 (40.5%) |
| 65 to 74 Years | 129 (100.0%) | 0 (0.0%) |
| 75 Years and older | 139 (100.0%) | 0 (0.0%) |
| Total | 1,178 (86.9%) | 178 (13.1%) |
Health Insurance Coverage by Citizenship Status in Pine Bluffs
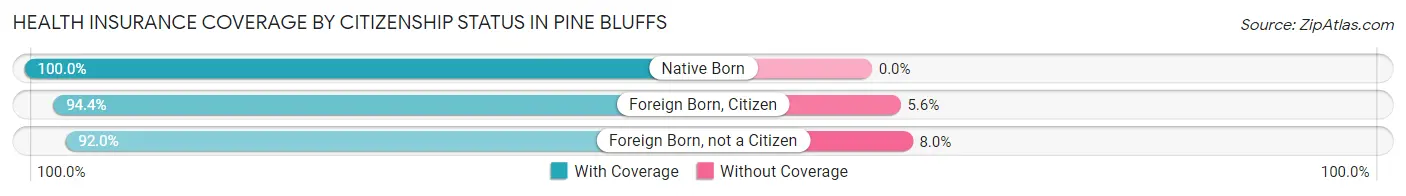
| Citizenship Status | With Coverage | Without Coverage |
| Native Born | 116 (100.0%) | 0 (0.0%) |
| Foreign Born, Citizen | 218 (94.4%) | 13 (5.6%) |
| Foreign Born, not a Citizen | 46 (92.0%) | 4 (8.0%) |
Health Insurance Coverage by Household Income in Pine Bluffs
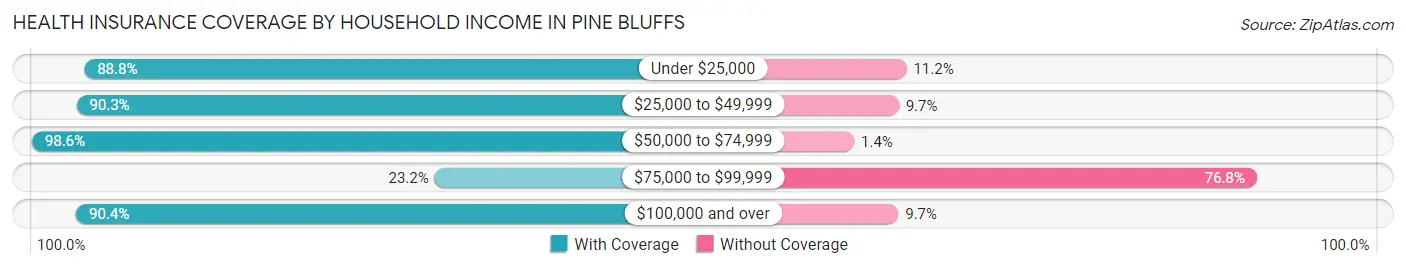
| Household Income | With Coverage | Without Coverage |
| Under $25,000 | 143 (88.8%) | 18 (11.2%) |
| $25,000 to $49,999 | 195 (90.3%) | 21 (9.7%) |
| $50,000 to $74,999 | 574 (98.6%) | 8 (1.4%) |
| $75,000 to $99,999 | 32 (23.2%) | 106 (76.8%) |
| $100,000 and over | 234 (90.3%) | 25 (9.7%) |
Public vs Private Health Insurance Coverage by Age in Pine Bluffs
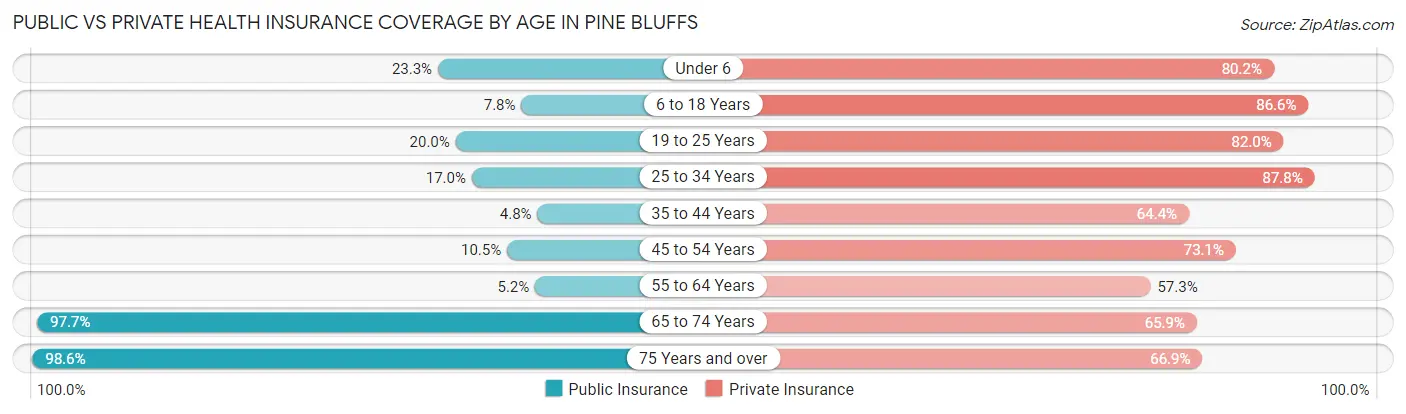
| Age Bracket | Public Insurance | Private Insurance |
| Under 6 | 27 (23.3%) | 93 (80.2%) |
| 6 to 18 Years | 18 (7.8%) | 200 (86.6%) |
| 19 to 25 Years | 10 (20.0%) | 41 (82.0%) |
| 25 to 34 Years | 43 (17.0%) | 222 (87.7%) |
| 35 to 44 Years | 5 (4.8%) | 67 (64.4%) |
| 45 to 54 Years | 7 (10.4%) | 49 (73.1%) |
| 55 to 64 Years | 14 (5.2%) | 153 (57.3%) |
| 65 to 74 Years | 126 (97.7%) | 85 (65.9%) |
| 75 Years and over | 137 (98.6%) | 93 (66.9%) |
| Total | 387 (28.5%) | 1,003 (74.0%) |
Disability Status by Sex by Age in Pine Bluffs
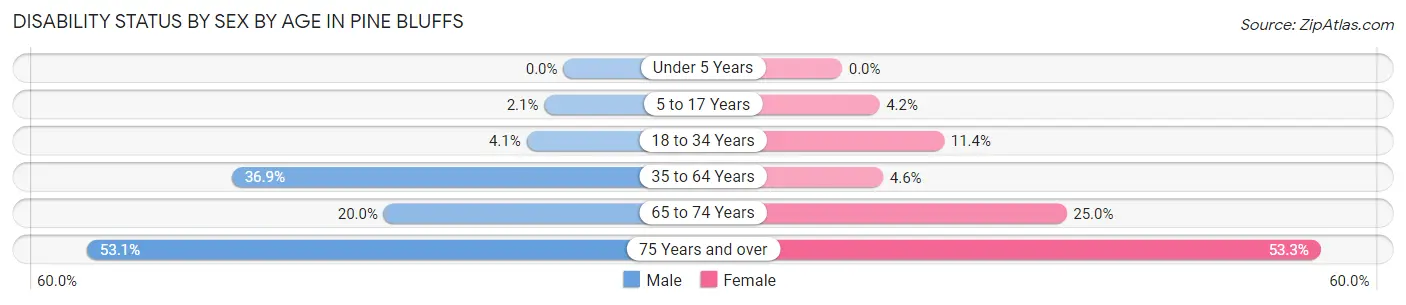
| Age Bracket | Male | Female |
| Under 5 Years | 0 (0.0%) | 0 (0.0%) |
| 5 to 17 Years | 5 (2.1%) | 2 (4.2%) |
| 18 to 34 Years | 8 (4.1%) | 15 (11.4%) |
| 35 to 64 Years | 89 (36.9%) | 9 (4.6%) |
| 65 to 74 Years | 13 (20.0%) | 16 (25.0%) |
| 75 Years and over | 26 (53.1%) | 48 (53.3%) |
Disability Class by Sex by Age in Pine Bluffs
Disability Class: Hearing Difficulty
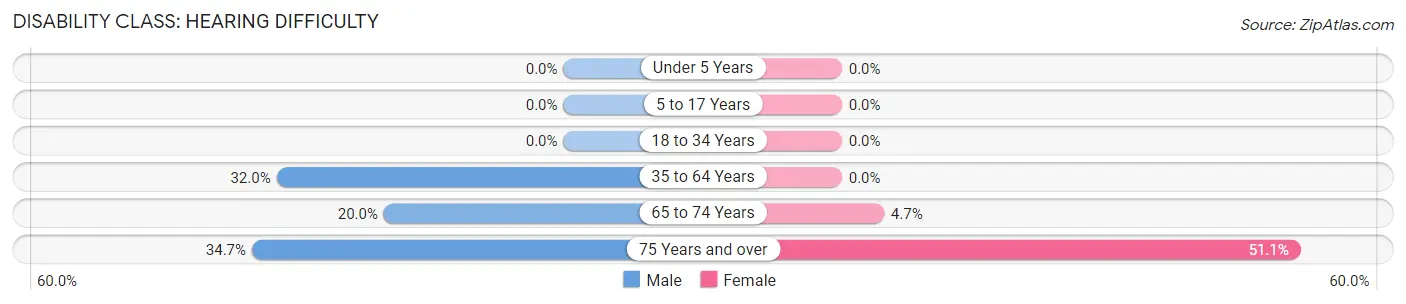
| Age Bracket | Male | Female |
| Under 5 Years | 0 (0.0%) | 0 (0.0%) |
| 5 to 17 Years | 0 (0.0%) | 0 (0.0%) |
| 18 to 34 Years | 0 (0.0%) | 0 (0.0%) |
| 35 to 64 Years | 77 (32.0%) | 0 (0.0%) |
| 65 to 74 Years | 13 (20.0%) | 3 (4.7%) |
| 75 Years and over | 17 (34.7%) | 46 (51.1%) |
Disability Class: Vision Difficulty
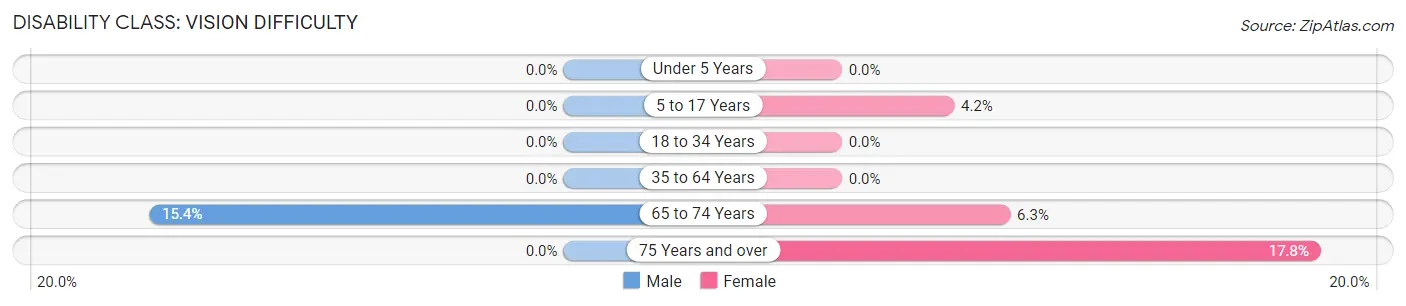
| Age Bracket | Male | Female |
| Under 5 Years | 0 (0.0%) | 0 (0.0%) |
| 5 to 17 Years | 0 (0.0%) | 2 (4.2%) |
| 18 to 34 Years | 0 (0.0%) | 0 (0.0%) |
| 35 to 64 Years | 0 (0.0%) | 0 (0.0%) |
| 65 to 74 Years | 10 (15.4%) | 4 (6.2%) |
| 75 Years and over | 0 (0.0%) | 16 (17.8%) |
Disability Class: Cognitive Difficulty
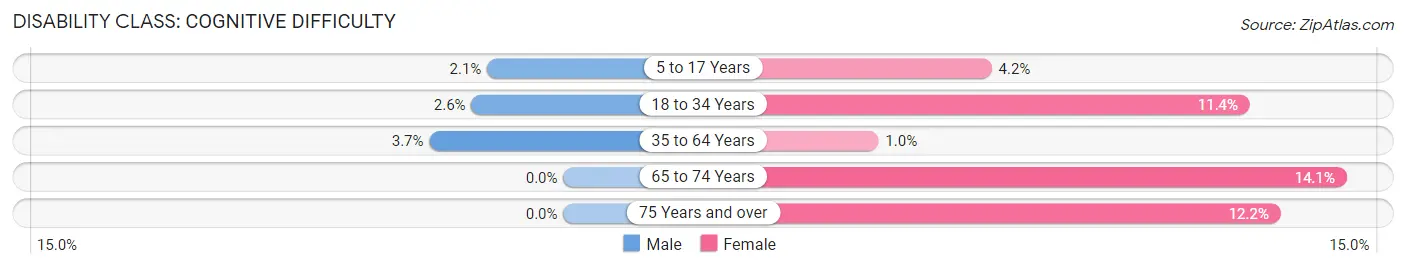
| Age Bracket | Male | Female |
| 5 to 17 Years | 5 (2.1%) | 2 (4.2%) |
| 18 to 34 Years | 5 (2.6%) | 15 (11.4%) |
| 35 to 64 Years | 9 (3.7%) | 2 (1.0%) |
| 65 to 74 Years | 0 (0.0%) | 9 (14.1%) |
| 75 Years and over | 0 (0.0%) | 11 (12.2%) |
Disability Class: Ambulatory Difficulty
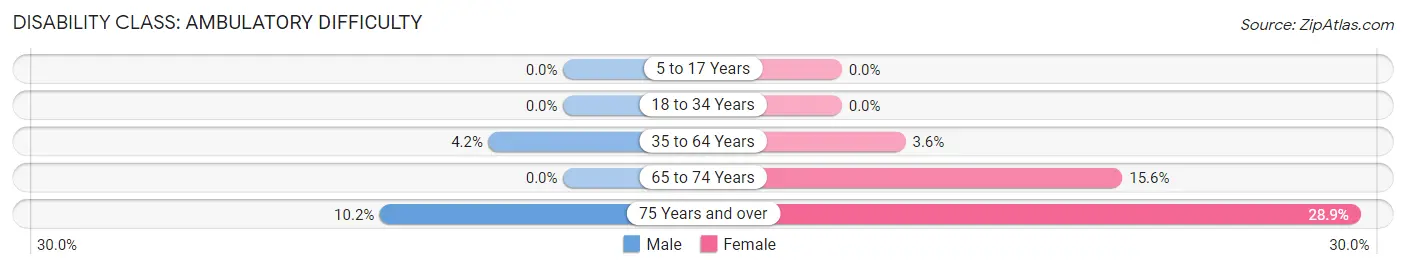
| Age Bracket | Male | Female |
| 5 to 17 Years | 0 (0.0%) | 0 (0.0%) |
| 18 to 34 Years | 0 (0.0%) | 0 (0.0%) |
| 35 to 64 Years | 10 (4.2%) | 7 (3.5%) |
| 65 to 74 Years | 0 (0.0%) | 10 (15.6%) |
| 75 Years and over | 5 (10.2%) | 26 (28.9%) |
Disability Class: Self-Care Difficulty
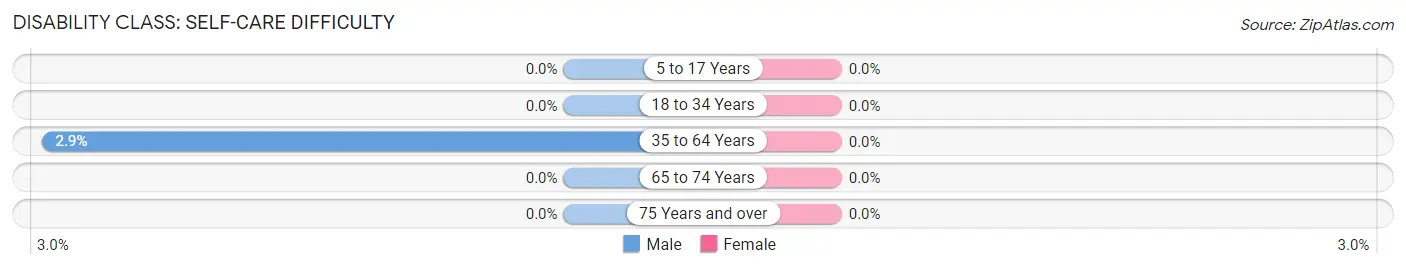
| Age Bracket | Male | Female |
| 5 to 17 Years | 0 (0.0%) | 0 (0.0%) |
| 18 to 34 Years | 0 (0.0%) | 0 (0.0%) |
| 35 to 64 Years | 7 (2.9%) | 0 (0.0%) |
| 65 to 74 Years | 0 (0.0%) | 0 (0.0%) |
| 75 Years and over | 0 (0.0%) | 0 (0.0%) |
Technology Access in Pine Bluffs
Computing Device Access in Pine Bluffs
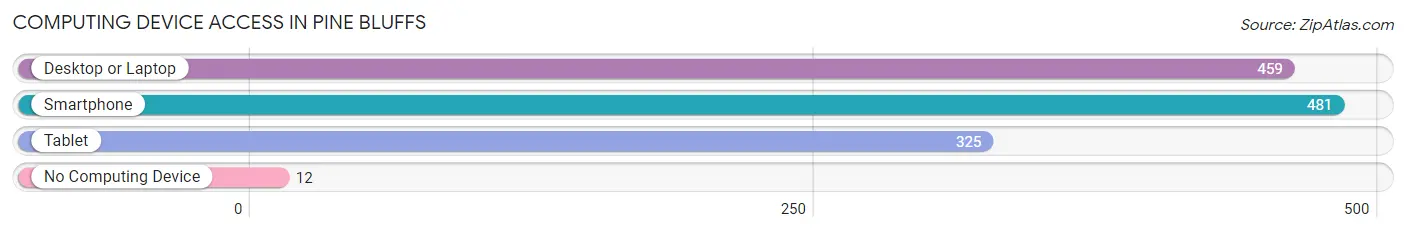
| Device Type | # Households | % Households |
| Desktop or Laptop | 459 | 83.9% |
| Smartphone | 481 | 87.9% |
| Tablet | 325 | 59.4% |
| No Computing Device | 12 | 2.2% |
| Total | 547 | 100.0% |
Internet Access in Pine Bluffs
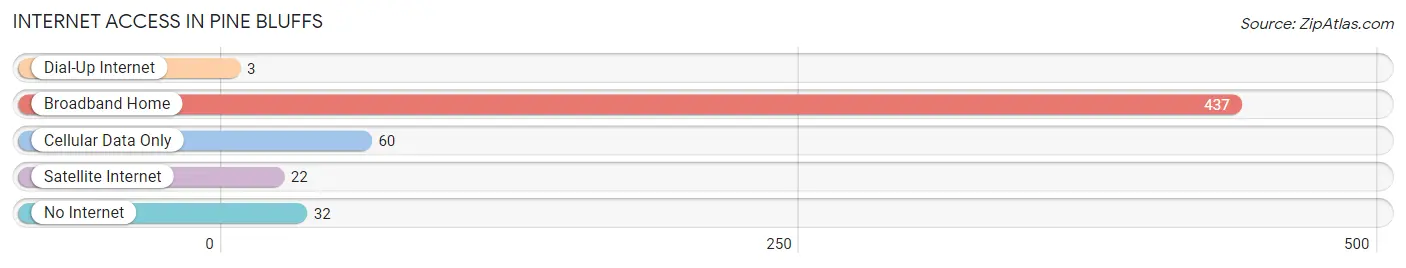
| Internet Type | # Households | % Households |
| Dial-Up Internet | 3 | 0.5% |
| Broadband Home | 437 | 79.9% |
| Cellular Data Only | 60 | 11.0% |
| Satellite Internet | 22 | 4.0% |
| No Internet | 32 | 5.9% |
| Total | 547 | 100.0% |
Pine Bluffs Summary
Pine Bluffs, Wyoming is a small town located in the southeastern corner of the state, near the border with Nebraska. It is part of Laramie County and has a population of approximately 1,000 people. The town was founded in 1887 and has a rich history of ranching, farming, and railroad activity.
Geography
Pine Bluffs is located in the southeastern corner of Wyoming, near the border with Nebraska. It is part of Laramie County and is situated at an elevation of 4,890 feet. The town is located in the Laramie Plains, a region of rolling hills and grasslands. The area is known for its wide open spaces and stunning views of the Rocky Mountains. The town is located near the North Platte River, which provides a source of water for the area.
Economy
Pine Bluffs is a small town with a limited economy. The main industries in the area are ranching, farming, and railroad activity. The town is home to several ranches, which raise cattle, sheep, and horses. The area is also known for its wheat and barley production. The Union Pacific Railroad runs through the town, providing a source of employment for many of the residents.
Demographics
As of the 2010 census, the population of Pine Bluffs was 1,017. The racial makeup of the town was 95.3% White, 0.3% African American, 0.7% Native American, 0.2% Asian, 0.1% Pacific Islander, 1.2% from other races, and 2.4% from two or more races. Hispanic or Latino of any race were 4.2% of the population.
The median income for a household in Pine Bluffs was $37,500, and the median income for a family was $41,250. The per capita income for the town was $17,845. About 11.2% of families and 13.2% of the population were below the poverty line, including 16.7% of those under age 18 and 8.3% of those age 65 or over.
Conclusion
Pine Bluffs, Wyoming is a small town located in the southeastern corner of the state, near the border with Nebraska. It is part of Laramie County and has a population of approximately 1,000 people. The town was founded in 1887 and has a rich history of ranching, farming, and railroad activity. The main industries in the area are ranching, farming, and railroad activity. The town is home to several ranches, which raise cattle, sheep, and horses. The area is also known for its wheat and barley production. The Union Pacific Railroad runs through the town, providing a source of employment for many of the residents. The population of Pine Bluffs is predominantly White, with a small percentage of African American, Native American, Asian, and Pacific Islander residents. The median income for a household in Pine Bluffs was $37,500, and the median income for a family was $41,250. The per capita income for the town was $17,845.
Common Questions
What is Per Capita Income in Pine Bluffs?
Per Capita income in Pine Bluffs is $27,736.
What is the Median Family Income in Pine Bluffs?
Median Family Income in Pine Bluffs is $63,619.
What is the Median Household income in Pine Bluffs?
Median Household Income in Pine Bluffs is $62,766.
What is Income or Wage Gap in Pine Bluffs?
Income or Wage Gap in Pine Bluffs is 37.6%.
Women in Pine Bluffs earn 62.4 cents for every dollar earned by a man.
What is Inequality or Gini Index in Pine Bluffs?
Inequality or Gini Index in Pine Bluffs is 0.34.
What is the Total Population of Pine Bluffs?
Total Population of Pine Bluffs is 1,363.
What is the Total Male Population of Pine Bluffs?
Total Male Population of Pine Bluffs is 828.
What is the Total Female Population of Pine Bluffs?
Total Female Population of Pine Bluffs is 535.
What is the Ratio of Males per 100 Females in Pine Bluffs?
There are 154.77 Males per 100 Females in Pine Bluffs.
What is the Ratio of Females per 100 Males in Pine Bluffs?
There are 64.61 Females per 100 Males in Pine Bluffs.
What is the Median Population Age in Pine Bluffs?
Median Population Age in Pine Bluffs is 36.3 Years.
What is the Average Family Size in Pine Bluffs
Average Family Size in Pine Bluffs is 2.9 People.
What is the Average Household Size in Pine Bluffs
Average Household Size in Pine Bluffs is 2.5 People.
How Large is the Labor Force in Pine Bluffs?
There are 587 People in the Labor Forcein in Pine Bluffs.
What is the Percentage of People in the Labor Force in Pine Bluffs?
56.4% of People are in the Labor Force in Pine Bluffs.
What is the Unemployment Rate in Pine Bluffs?
Unemployment Rate in Pine Bluffs is 0.7%.