Opal, WY Map & Demographics
Opal Map
Opal Overview
$58,150
PER CAPITA INCOME
$63,750
AVG FAMILY INCOME
$67,917
AVG HOUSEHOLD INCOME
0.59
INEQUALITY / GINI INDEX
74
TOTAL POPULATION
38
MALE POPULATION
36
FEMALE POPULATION
105.56
MALES / 100 FEMALES
94.74
FEMALES / 100 MALES
59.3
MEDIAN AGE
2.4
AVG FAMILY SIZE
2.4
AVG HOUSEHOLD SIZE
41
LABOR FORCE [ PEOPLE ]
57.7%
PERCENT IN LABOR FORCE
Opal Zip Codes
Opal Area Codes
Income in Opal
Income Overview in Opal
Per Capita Income in Opal is $58,150, while median incomes of families and households are $63,750 and $67,917 respectively.
| Characteristic | Number | Measure |
| Per Capita Income | 74 | $58,150 |
| Median Family Income | 30 | $63,750 |
| Mean Family Income | 30 | $135,267 |
| Median Household Income | 31 | $67,917 |
| Mean Household Income | 31 | $138,842 |
| Income Deficit | 30 | $0 |
| Wage / Income Gap (%) | 74 | 0.00% |
| Wage / Income Gap ($) | 74 | 100.00¢ per $1 |
| Gini / Inequality Index | 74 | 0.59 |
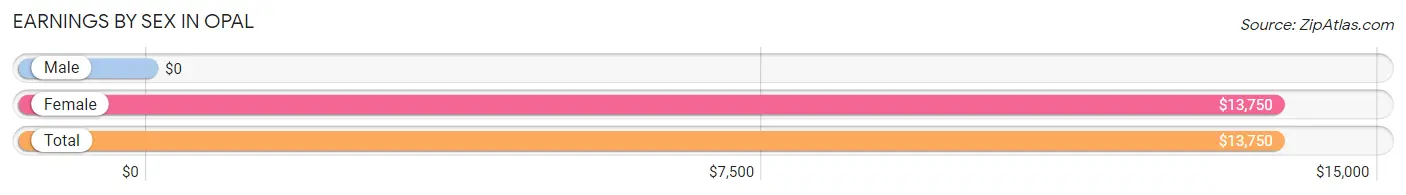
Earnings by Sex in Opal
| Sex | Number | Average Earnings |
| Male | 30 (55.6%) | $0 |
| Female | 24 (44.4%) | $13,750 |
| Total | 54 (100.0%) | $13,750 |
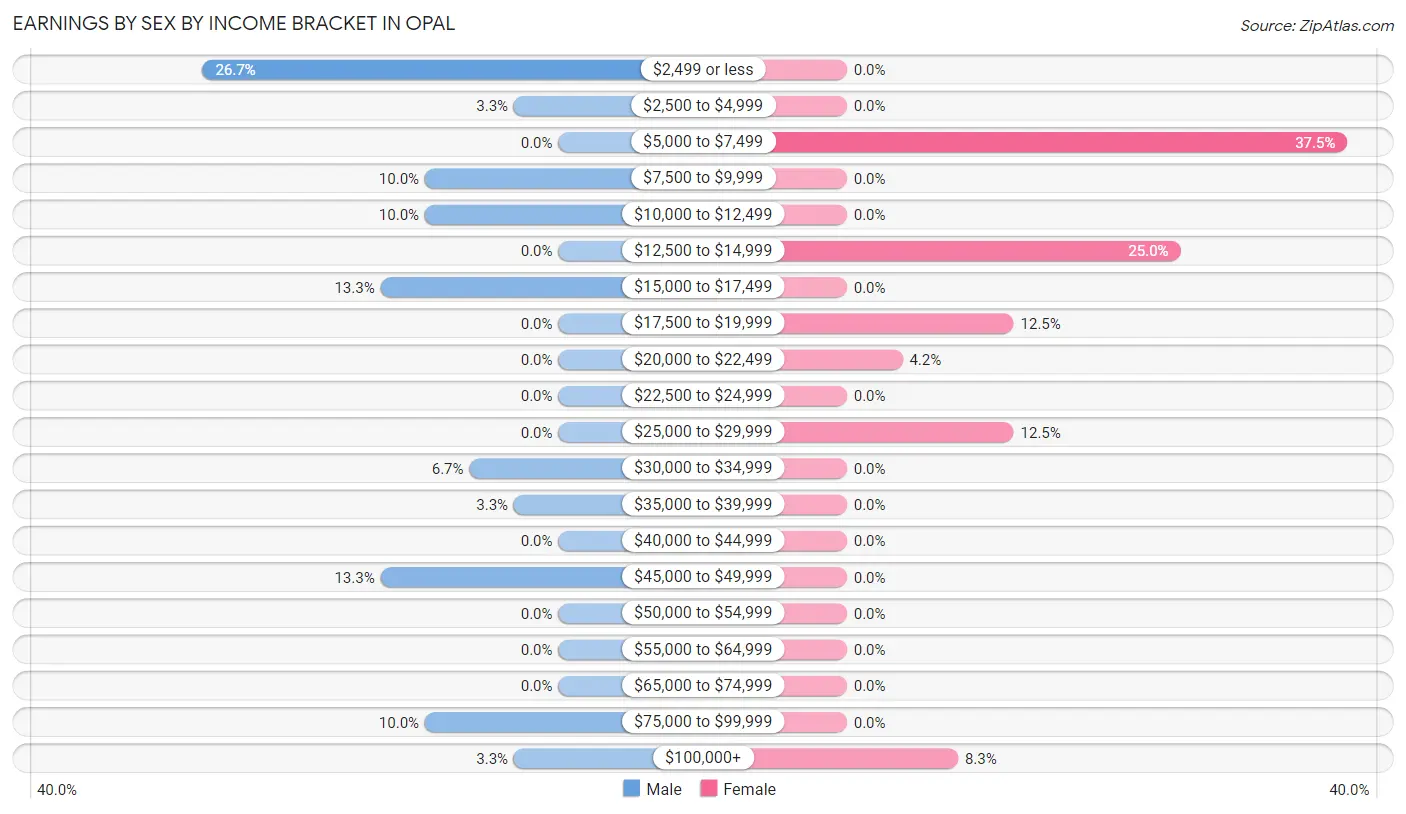
Earnings by Sex by Income Bracket in Opal
The most common earnings brackets in Opal are $2,499 or less for men (8 | 26.7%) and $5,000 to $7,499 for women (9 | 37.5%).
| Income | Male | Female |
| $2,499 or less | 8 (26.7%) | 0 (0.0%) |
| $2,500 to $4,999 | 1 (3.3%) | 0 (0.0%) |
| $5,000 to $7,499 | 0 (0.0%) | 9 (37.5%) |
| $7,500 to $9,999 | 3 (10.0%) | 0 (0.0%) |
| $10,000 to $12,499 | 3 (10.0%) | 0 (0.0%) |
| $12,500 to $14,999 | 0 (0.0%) | 6 (25.0%) |
| $15,000 to $17,499 | 4 (13.3%) | 0 (0.0%) |
| $17,500 to $19,999 | 0 (0.0%) | 3 (12.5%) |
| $20,000 to $22,499 | 0 (0.0%) | 1 (4.2%) |
| $22,500 to $24,999 | 0 (0.0%) | 0 (0.0%) |
| $25,000 to $29,999 | 0 (0.0%) | 3 (12.5%) |
| $30,000 to $34,999 | 2 (6.7%) | 0 (0.0%) |
| $35,000 to $39,999 | 1 (3.3%) | 0 (0.0%) |
| $40,000 to $44,999 | 0 (0.0%) | 0 (0.0%) |
| $45,000 to $49,999 | 4 (13.3%) | 0 (0.0%) |
| $50,000 to $54,999 | 0 (0.0%) | 0 (0.0%) |
| $55,000 to $64,999 | 0 (0.0%) | 0 (0.0%) |
| $65,000 to $74,999 | 0 (0.0%) | 0 (0.0%) |
| $75,000 to $99,999 | 3 (10.0%) | 0 (0.0%) |
| $100,000+ | 1 (3.3%) | 2 (8.3%) |
| Total | 30 (100.0%) | 24 (100.0%) |
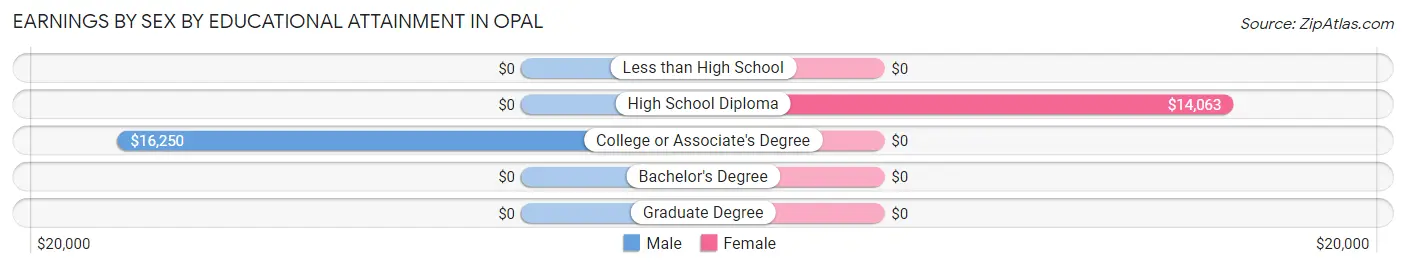
Earnings by Sex by Educational Attainment in Opal
| Educational Attainment | Male Income | Female Income |
| Less than High School | - | - |
| High School Diploma | - | - |
| College or Associate's Degree | $16,250 | $0 |
| Bachelor's Degree | - | - |
| Graduate Degree | - | - |
| Total | - | - |
Family Income in Opal
Family Income Brackets in Opal
According to the Opal family income data, there are 13 families falling into the $50,000 to $74,999 income range, which is the most common income bracket and makes up 43.3% of all families.
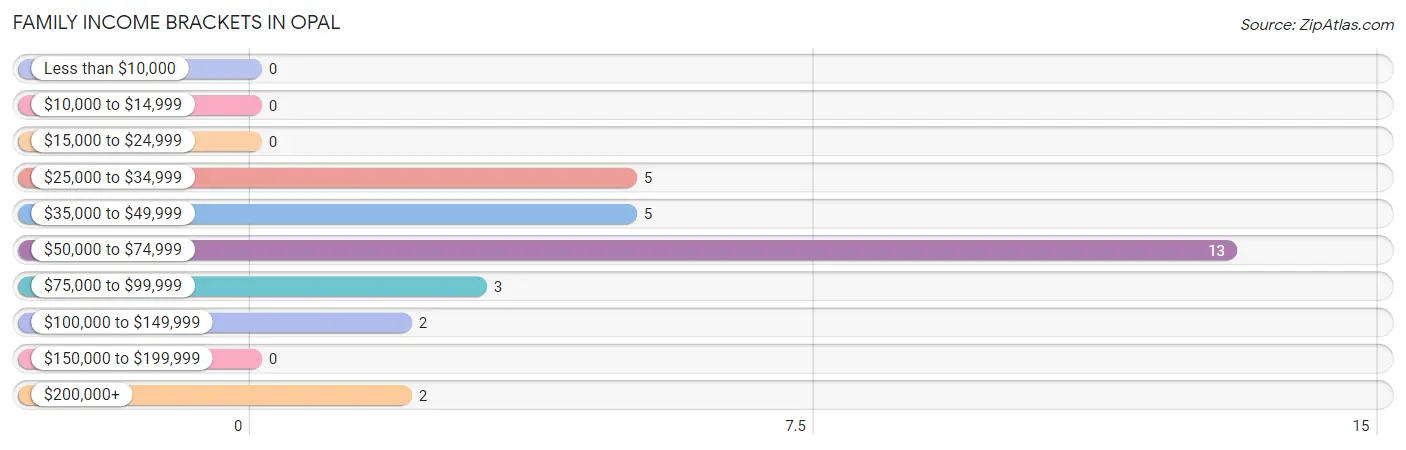
| Income Bracket | # Families | % Families |
| Less than $10,000 | 0 | 0.0% |
| $10,000 to $14,999 | 0 | 0.0% |
| $15,000 to $24,999 | 0 | 0.0% |
| $25,000 to $34,999 | 5 | 16.7% |
| $35,000 to $49,999 | 5 | 16.7% |
| $50,000 to $74,999 | 13 | 43.3% |
| $75,000 to $99,999 | 3 | 10.0% |
| $100,000 to $149,999 | 2 | 6.7% |
| $150,000 to $199,999 | 0 | 0.0% |
| $200,000+ | 2 | 6.7% |
Family Income by Famaliy Size in Opal
2-person families (23 | 76.7%) account for the highest median family income in Opal with $68,750 per family, while 2-person families (23 | 76.7%) have the highest median income of $34,375 per family member.
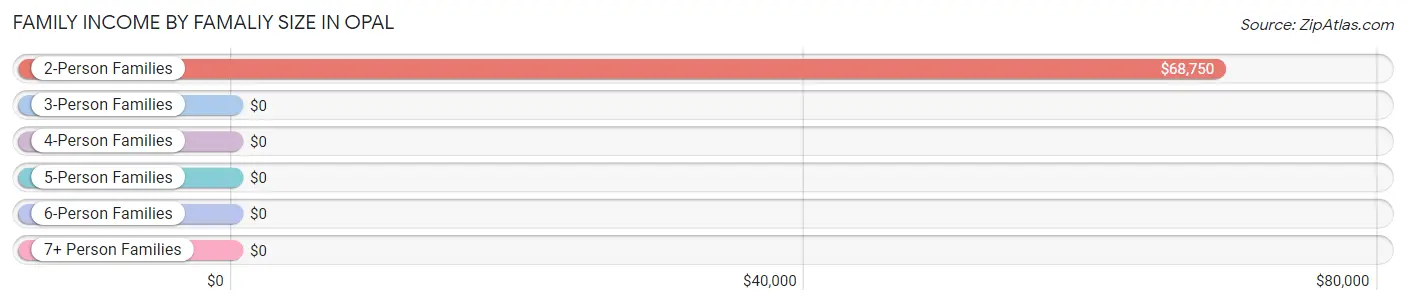
| Income Bracket | # Families | Median Income |
| 2-Person Families | 23 (76.7%) | $68,750 |
| 3-Person Families | 4 (13.3%) | $0 |
| 4-Person Families | 3 (10.0%) | $0 |
| 5-Person Families | 0 (0.0%) | $0 |
| 6-Person Families | 0 (0.0%) | $0 |
| 7+ Person Families | 0 (0.0%) | $0 |
| Total | 30 (100.0%) | $63,750 |
Family Income by Number of Earners in Opal
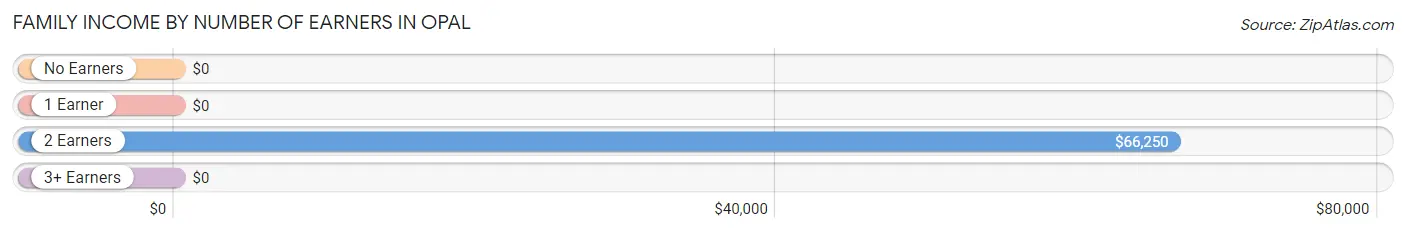
| Number of Earners | # Families | Median Income |
| No Earners | 3 (10.0%) | $0 |
| 1 Earner | 6 (20.0%) | $0 |
| 2 Earners | 18 (60.0%) | $66,250 |
| 3+ Earners | 3 (10.0%) | $0 |
| Total | 30 (100.0%) | $63,750 |
Household Income in Opal
Household Income Brackets in Opal
With 13 households falling in the category, the $50,000 to $74,999 income range is the most frequent in Opal, accounting for 41.9% of all households.
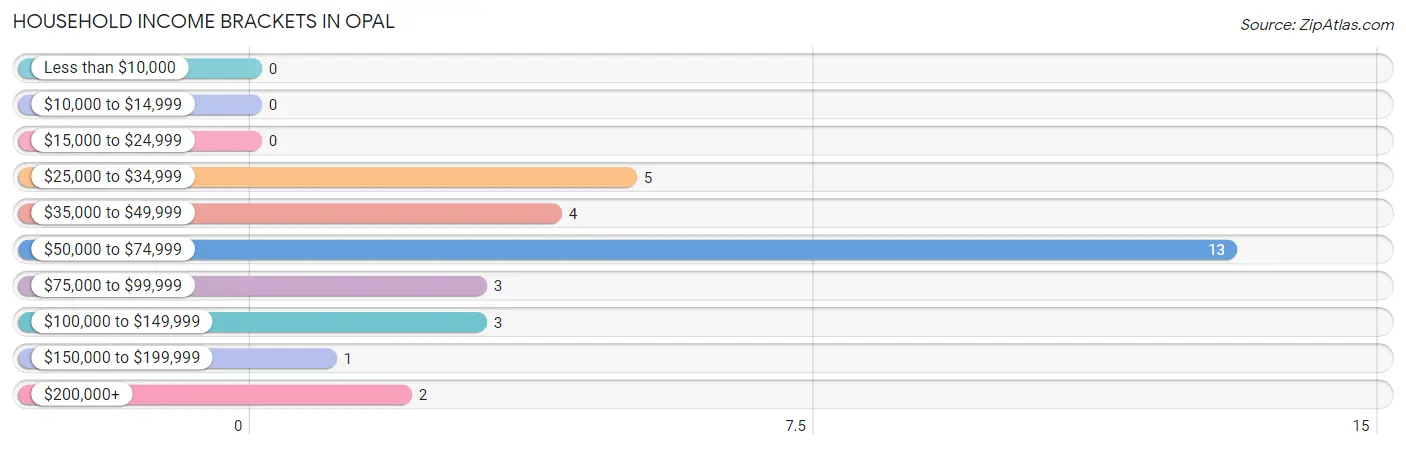
| Income Bracket | # Households | % Households |
| Less than $10,000 | 0 | 0.0% |
| $10,000 to $14,999 | 0 | 0.0% |
| $15,000 to $24,999 | 0 | 0.0% |
| $25,000 to $34,999 | 5 | 16.1% |
| $35,000 to $49,999 | 4 | 12.9% |
| $50,000 to $74,999 | 13 | 41.9% |
| $75,000 to $99,999 | 3 | 9.7% |
| $100,000 to $149,999 | 3 | 9.7% |
| $150,000 to $199,999 | 1 | 3.2% |
| $200,000+ | 2 | 6.5% |
Household Income by Householder Age in Opal
The median household income in Opal is $67,917, with the highest median household income of $69,583 found in the 45 to 64 years age bracket for the primary householder. A total of 25 households (80.6%) fall into this category.
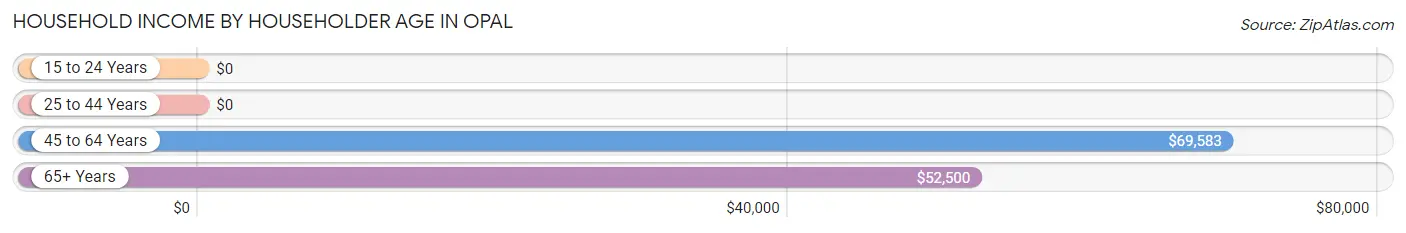
| Income Bracket | # Households | Median Income |
| 15 to 24 Years | 0 (0.0%) | $0 |
| 25 to 44 Years | 0 (0.0%) | $0 |
| 45 to 64 Years | 25 (80.6%) | $69,583 |
| 65+ Years | 6 (19.4%) | $52,500 |
| Total | 31 (100.0%) | $67,917 |
Poverty in Opal
Income Below Poverty by Sex and Age in Opal
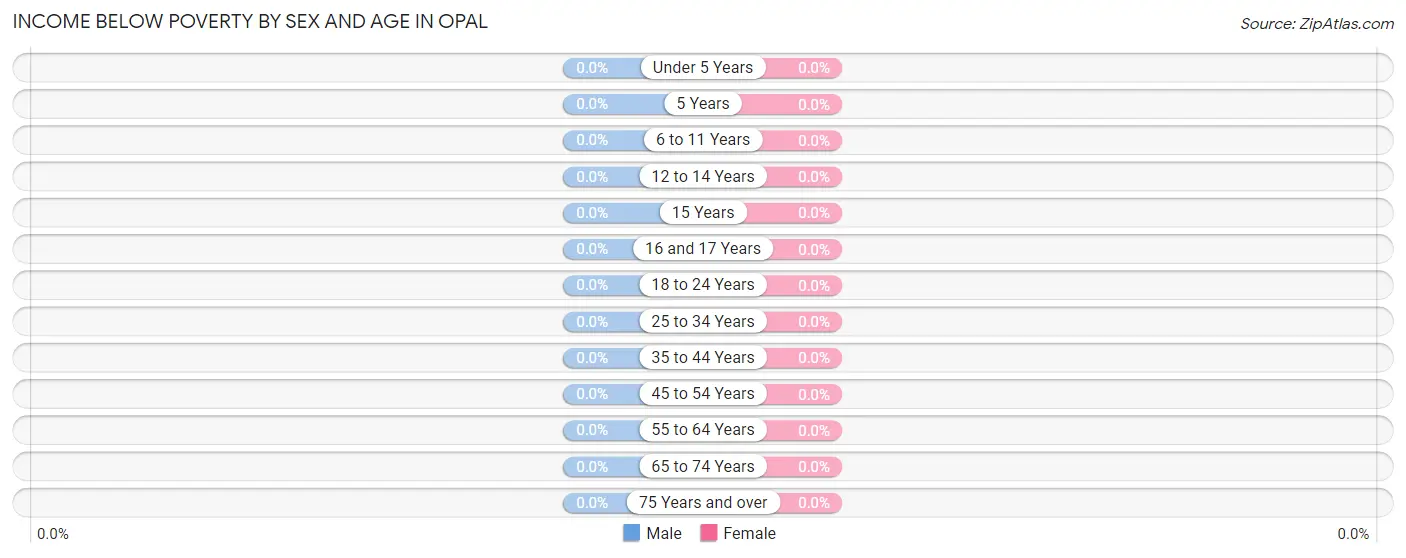
| Age Bracket | Male | Female |
| Under 5 Years | 0 (0.0%) | 0 (0.0%) |
| 5 Years | 0 (0.0%) | 0 (0.0%) |
| 6 to 11 Years | 0 (0.0%) | 0 (0.0%) |
| 12 to 14 Years | 0 (0.0%) | 0 (0.0%) |
| 15 Years | 0 (0.0%) | 0 (0.0%) |
| 16 and 17 Years | 0 (0.0%) | 0 (0.0%) |
| 18 to 24 Years | 0 (0.0%) | 0 (0.0%) |
| 25 to 34 Years | 0 (0.0%) | 0 (0.0%) |
| 35 to 44 Years | 0 (0.0%) | 0 (0.0%) |
| 45 to 54 Years | 0 (0.0%) | 0 (0.0%) |
| 55 to 64 Years | 0 (0.0%) | 0 (0.0%) |
| 65 to 74 Years | 0 (0.0%) | 0 (0.0%) |
| 75 Years and over | 0 (0.0%) | 0 (0.0%) |
| Total | 0 (0.0%) | 0 (0.0%) |
Income Above Poverty by Sex and Age in Opal
According to the poverty statistics in Opal, males aged 25 to 34 years and females aged 6 to 11 years are the age groups that are most secure financially, with 100.0% of males and 100.0% of females in these age groups living above the poverty line.
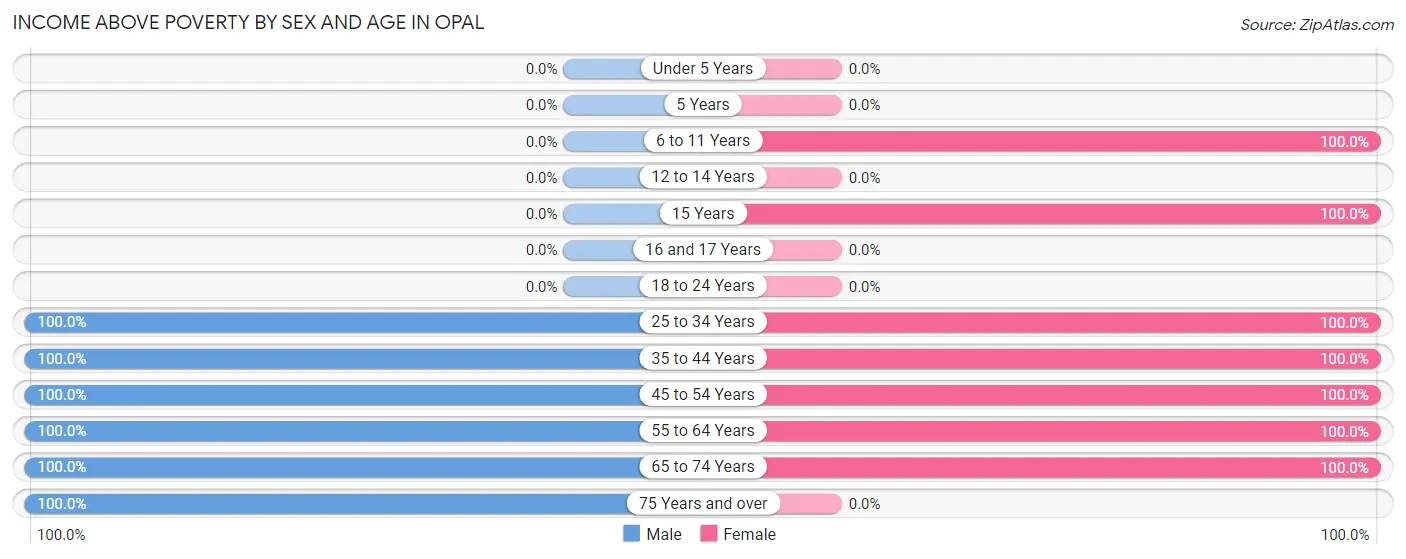
| Age Bracket | Male | Female |
| Under 5 Years | 0 (0.0%) | 0 (0.0%) |
| 5 Years | 0 (0.0%) | 0 (0.0%) |
| 6 to 11 Years | 0 (0.0%) | 2 (100.0%) |
| 12 to 14 Years | 0 (0.0%) | 0 (0.0%) |
| 15 Years | 0 (0.0%) | 1 (100.0%) |
| 16 and 17 Years | 0 (0.0%) | 0 (0.0%) |
| 18 to 24 Years | 0 (0.0%) | 0 (0.0%) |
| 25 to 34 Years | 3 (100.0%) | 1 (100.0%) |
| 35 to 44 Years | 2 (100.0%) | 1 (100.0%) |
| 45 to 54 Years | 11 (100.0%) | 7 (100.0%) |
| 55 to 64 Years | 11 (100.0%) | 15 (100.0%) |
| 65 to 74 Years | 10 (100.0%) | 9 (100.0%) |
| 75 Years and over | 1 (100.0%) | 0 (0.0%) |
| Total | 38 (100.0%) | 36 (100.0%) |
Income Below Poverty Among Married-Couple Families in Opal
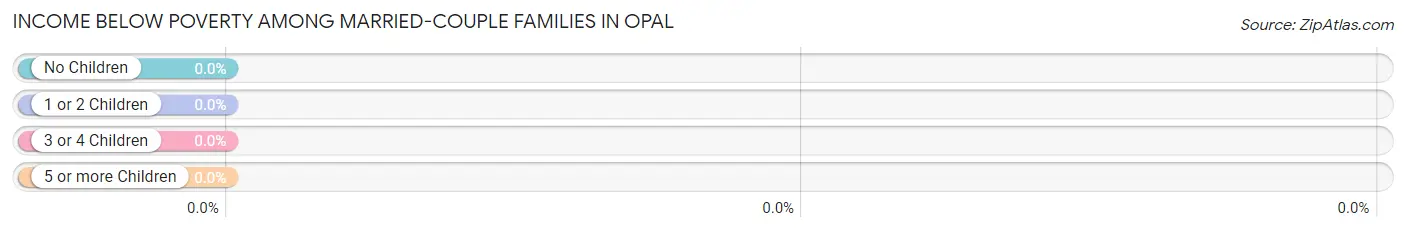
| Children | Above Poverty | Below Poverty |
| No Children | 26 (100.0%) | 0 (0.0%) |
| 1 or 2 Children | 1 (100.0%) | 0 (0.0%) |
| 3 or 4 Children | 0 (0.0%) | 0 (0.0%) |
| 5 or more Children | 0 (0.0%) | 0 (0.0%) |
| Total | 27 (100.0%) | 0 (0.0%) |
Income Below Poverty Among Single-Parent Households in Opal
| Children | Single Father | Single Mother |
| No Children | 0 (0.0%) | 0 (0.0%) |
| 1 or 2 Children | 0 (0.0%) | 0 (0.0%) |
| 3 or 4 Children | 0 (0.0%) | 0 (0.0%) |
| 5 or more Children | 0 (0.0%) | 0 (0.0%) |
| Total | 0 (0.0%) | 0 (0.0%) |
Income Below Poverty Among Married-Couple vs Single-Parent Households in Opal
| Children | Married-Couple Families | Single-Parent Households |
| No Children | 0 (0.0%) | 0 (0.0%) |
| 1 or 2 Children | 0 (0.0%) | 0 (0.0%) |
| 3 or 4 Children | 0 (0.0%) | 0 (0.0%) |
| 5 or more Children | 0 (0.0%) | 0 (0.0%) |
| Total | 0 (0.0%) | 0 (0.0%) |
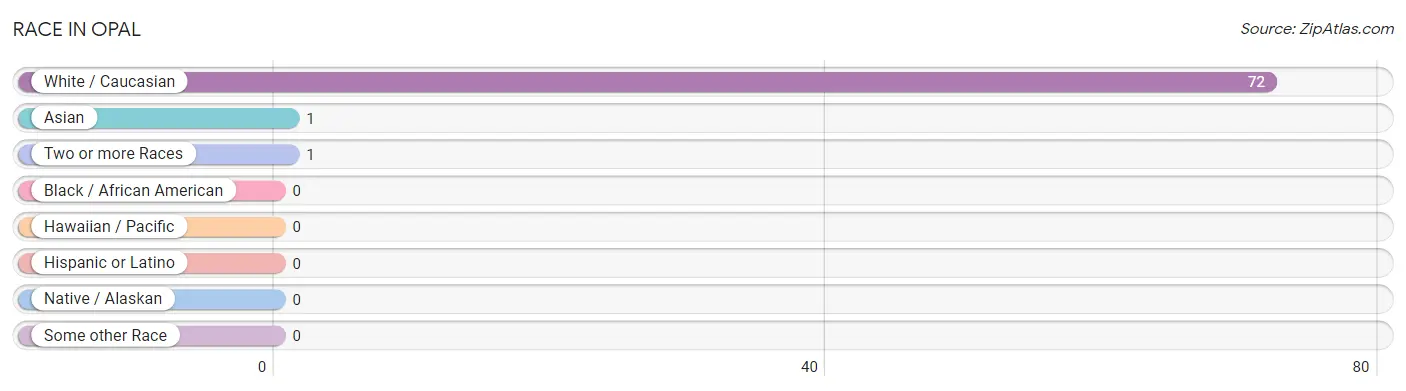
Race in Opal
The most populous races in Opal are White / Caucasian (72 | 97.3%), Asian (1 | 1.3%), and Two or more Races (1 | 1.3%).
| Race | # Population | % Population |
| Asian | 1 | 1.3% |
| Black / African American | 0 | 0.0% |
| Hawaiian / Pacific | 0 | 0.0% |
| Hispanic or Latino | 0 | 0.0% |
| Native / Alaskan | 0 | 0.0% |
| White / Caucasian | 72 | 97.3% |
| Two or more Races | 1 | 1.3% |
| Some other Race | 0 | 0.0% |
| Total | 74 | 100.0% |
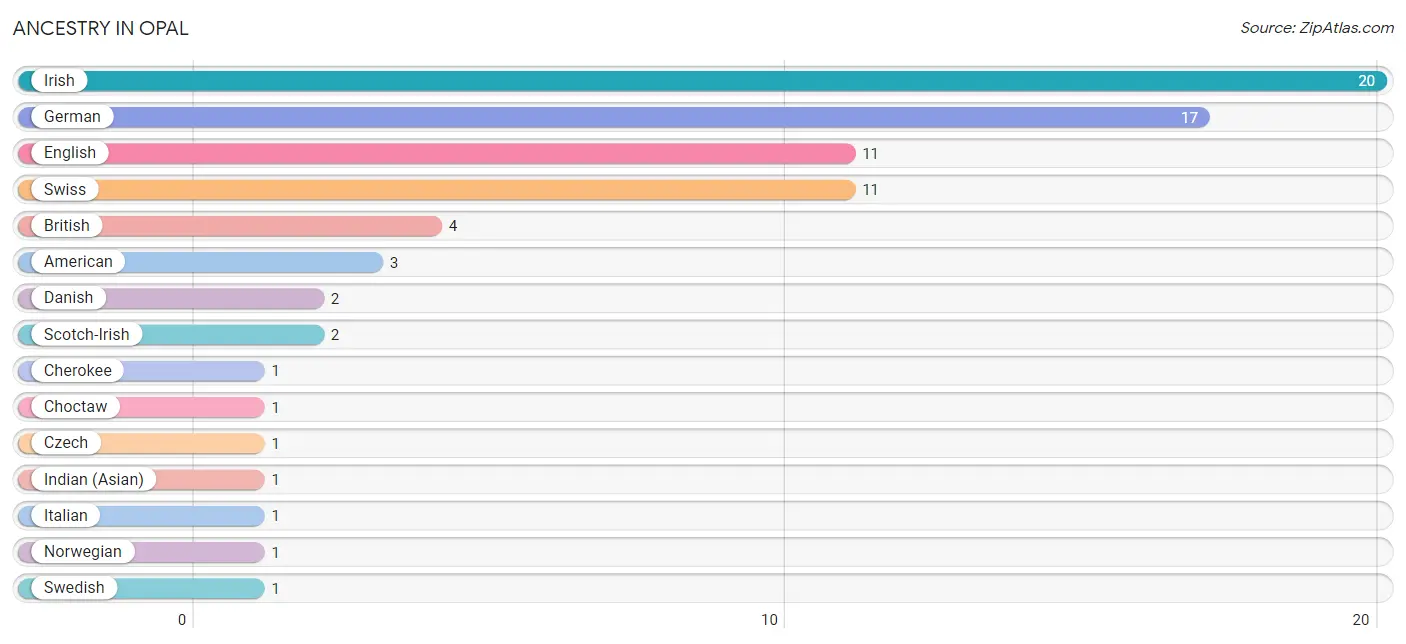
Ancestry in Opal
The most populous ancestries reported in Opal are Irish (20 | 27.0%), German (17 | 23.0%), English (11 | 14.9%), Swiss (11 | 14.9%), and British (4 | 5.4%), together accounting for 85.1% of all Opal residents.
| Ancestry | # Population | % Population |
| American | 3 | 4.1% |
| British | 4 | 5.4% |
| Cherokee | 1 | 1.3% |
| Choctaw | 1 | 1.3% |
| Czech | 1 | 1.3% |
| Danish | 2 | 2.7% |
| English | 11 | 14.9% |
| German | 17 | 23.0% |
| Indian (Asian) | 1 | 1.3% |
| Irish | 20 | 27.0% |
| Italian | 1 | 1.3% |
| Norwegian | 1 | 1.3% |
| Scotch-Irish | 2 | 2.7% |
| Swedish | 1 | 1.3% |
| Swiss | 11 | 14.9% | View All 15 Rows |
Immigrants in Opal
The most numerous immigrant groups reported in Opal came from Asia (1 | 1.3%), China (1 | 1.3%), and Eastern Asia (1 | 1.3%), together accounting for 4.1% of all Opal residents.
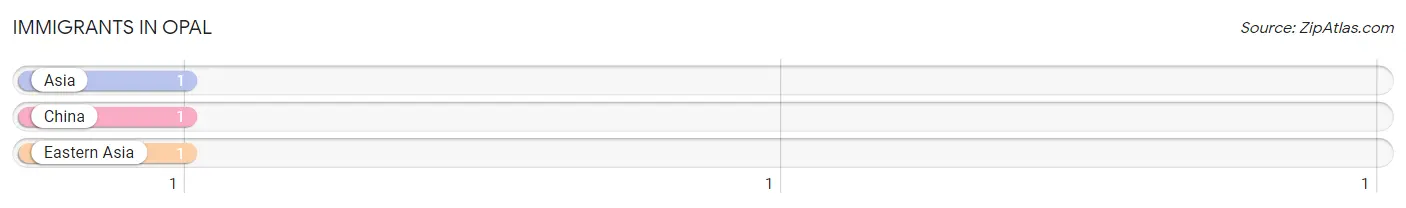
| Immigration Origin | # Population | % Population |
| Asia | 1 | 1.3% |
| China | 1 | 1.3% |
| Eastern Asia | 1 | 1.3% | View All 3 Rows |
Sex and Age in Opal
Sex and Age in Opal
The most populous age groups in Opal are 45 to 49 Years (8 | 21.0%) for men and 60 to 64 Years (11 | 30.6%) for women.
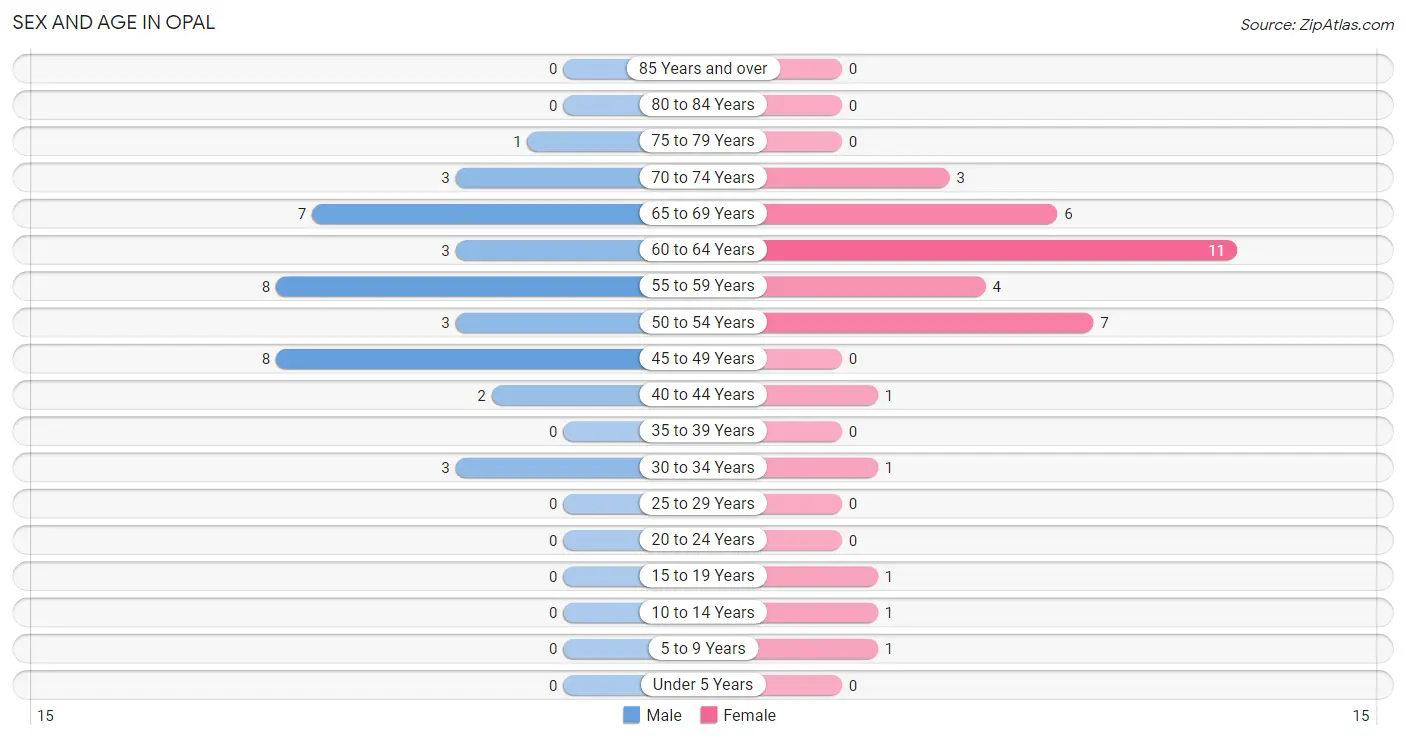
| Age Bracket | Male | Female |
| Under 5 Years | 0 (0.0%) | 0 (0.0%) |
| 5 to 9 Years | 0 (0.0%) | 1 (2.8%) |
| 10 to 14 Years | 0 (0.0%) | 1 (2.8%) |
| 15 to 19 Years | 0 (0.0%) | 1 (2.8%) |
| 20 to 24 Years | 0 (0.0%) | 0 (0.0%) |
| 25 to 29 Years | 0 (0.0%) | 0 (0.0%) |
| 30 to 34 Years | 3 (7.9%) | 1 (2.8%) |
| 35 to 39 Years | 0 (0.0%) | 0 (0.0%) |
| 40 to 44 Years | 2 (5.3%) | 1 (2.8%) |
| 45 to 49 Years | 8 (21.0%) | 0 (0.0%) |
| 50 to 54 Years | 3 (7.9%) | 7 (19.4%) |
| 55 to 59 Years | 8 (21.0%) | 4 (11.1%) |
| 60 to 64 Years | 3 (7.9%) | 11 (30.6%) |
| 65 to 69 Years | 7 (18.4%) | 6 (16.7%) |
| 70 to 74 Years | 3 (7.9%) | 3 (8.3%) |
| 75 to 79 Years | 1 (2.6%) | 0 (0.0%) |
| 80 to 84 Years | 0 (0.0%) | 0 (0.0%) |
| 85 Years and over | 0 (0.0%) | 0 (0.0%) |
| Total | 38 (100.0%) | 36 (100.0%) |
Families and Households in Opal
Median Family Size in Opal
The median family size in Opal is 2.37 persons per family, with single male/father families (1 | 3.3%) accounting for the largest median family size of 4 persons per family. On the other hand, married-couple families (27 | 90.0%) represent the smallest median family size with 2.30 persons per family.
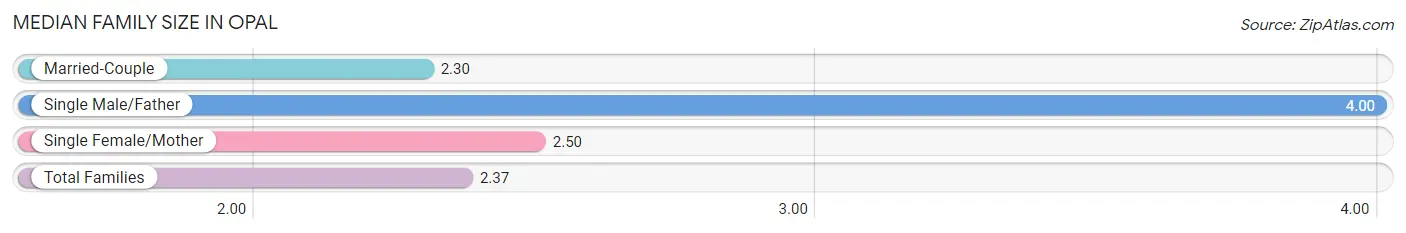
| Family Type | # Families | Family Size |
| Married-Couple | 27 (90.0%) | 2.30 |
| Single Male/Father | 1 (3.3%) | 4.00 |
| Single Female/Mother | 2 (6.7%) | 2.50 |
| Total Families | 30 (100.0%) | 2.37 |
Median Household Size in Opal
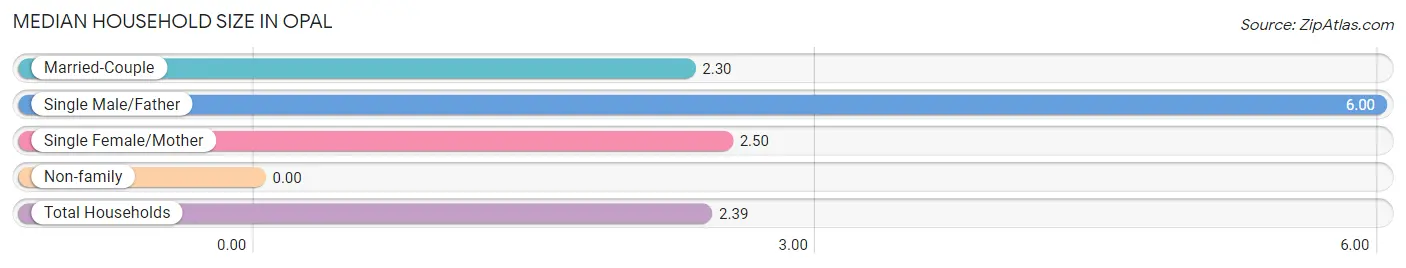
| Household Type | # Households | Household Size |
| Married-Couple | 27 (87.1%) | 2.30 |
| Single Male/Father | 1 (3.2%) | 6.00 |
| Single Female/Mother | 2 (6.5%) | 2.50 |
| Non-family | 1 (3.2%) | - |
| Total Households | 31 (100.0%) | 2.39 |
Household Size by Marriage Status in Opal
Out of a total of 31 households in Opal, 30 (96.8%) are family households, while 1 (3.2%) are nonfamily households. The most numerous type of family households are 2-person households, comprising 23, and the most common type of nonfamily households are 1-person households, comprising 1.
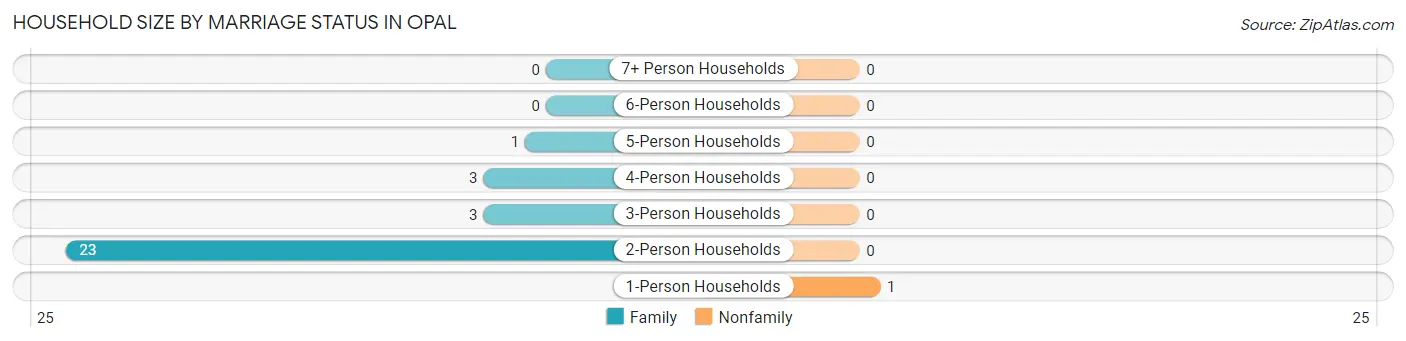
| Household Size | Family Households | Nonfamily Households |
| 1-Person Households | - | 1 (3.2%) |
| 2-Person Households | 23 (74.2%) | 0 (0.0%) |
| 3-Person Households | 3 (9.7%) | 0 (0.0%) |
| 4-Person Households | 3 (9.7%) | 0 (0.0%) |
| 5-Person Households | 1 (3.2%) | 0 (0.0%) |
| 6-Person Households | 0 (0.0%) | 0 (0.0%) |
| 7+ Person Households | 0 (0.0%) | 0 (0.0%) |
| Total | 30 (96.8%) | 1 (3.2%) |
Female Fertility in Opal
Fertility by Age in Opal
| Age Bracket | Women with Births | Births / 1,000 Women |
| 15 to 19 years | 0 (0.0%) | 0.0 |
| 20 to 34 years | 0 (0.0%) | 0.0 |
| 35 to 50 years | 0 (0.0%) | 0.0 |
| Total | 0 (0.0%) | 0.0 |
Fertility by Age by Marriage Status in Opal
| Age Bracket | Married | Unmarried |
| 15 to 19 years | 0 (0.0%) | 0 (0.0%) |
| 20 to 34 years | 0 (0.0%) | 0 (0.0%) |
| 35 to 50 years | 0 (0.0%) | 0 (0.0%) |
| Total | 0 (0.0%) | 0 (0.0%) |
Fertility by Education in Opal
| Educational Attainment | Women with Births | Births / 1,000 Women |
| Less than High School | 0 (0.0%) | 0.0 |
| High School Diploma | 0 (0.0%) | 0.0 |
| College or Associate's Degree | 0 (0.0%) | 0.0 |
| Bachelor's Degree | 0 (0.0%) | 0.0 |
| Graduate Degree | 0 (0.0%) | 0.0 |
| Total | 0 (0.0%) | 0.0 |
Fertility by Education by Marriage Status in Opal
| Educational Attainment | Married | Unmarried |
| Less than High School | 0 (0.0%) | 0 (0.0%) |
| High School Diploma | 0 (0.0%) | 0 (0.0%) |
| College or Associate's Degree | 0 (0.0%) | 0 (0.0%) |
| Bachelor's Degree | 0 (0.0%) | 0 (0.0%) |
| Graduate Degree | 0 (0.0%) | 0 (0.0%) |
| Total | 0 (0.0%) | 0 (0.0%) |
Employment Characteristics in Opal
Employment by Class of Employer in Opal
Among the 41 employed individuals in Opal, private company employees (26 | 63.4%), local government employees (6 | 14.6%), and not-for-profit organizations (4 | 9.8%) make up the most common classes of employment.
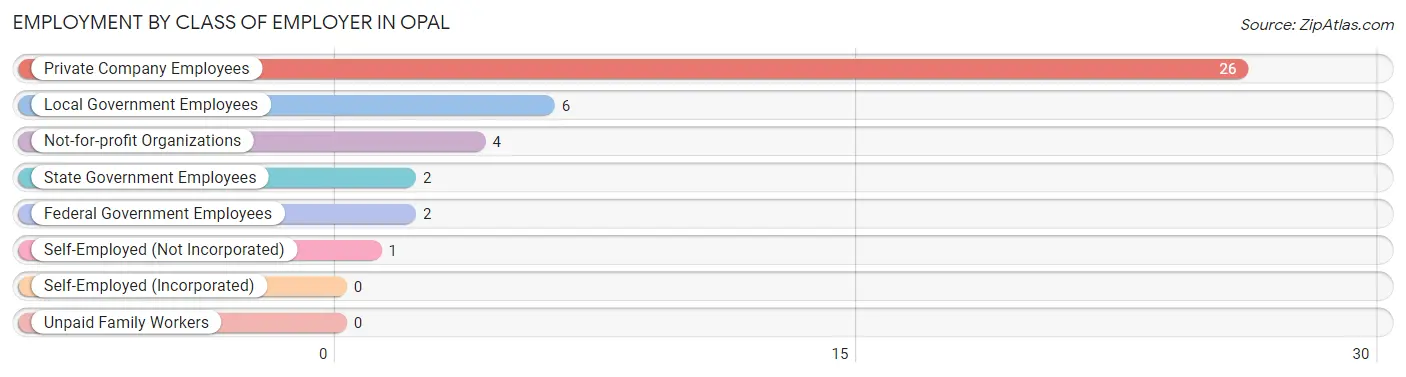
| Employer Class | # Employees | % Employees |
| Private Company Employees | 26 | 63.4% |
| Self-Employed (Incorporated) | 0 | 0.0% |
| Self-Employed (Not Incorporated) | 1 | 2.4% |
| Not-for-profit Organizations | 4 | 9.8% |
| Local Government Employees | 6 | 14.6% |
| State Government Employees | 2 | 4.9% |
| Federal Government Employees | 2 | 4.9% |
| Unpaid Family Workers | 0 | 0.0% |
| Total | 41 | 100.0% |
Employment Status by Age in Opal
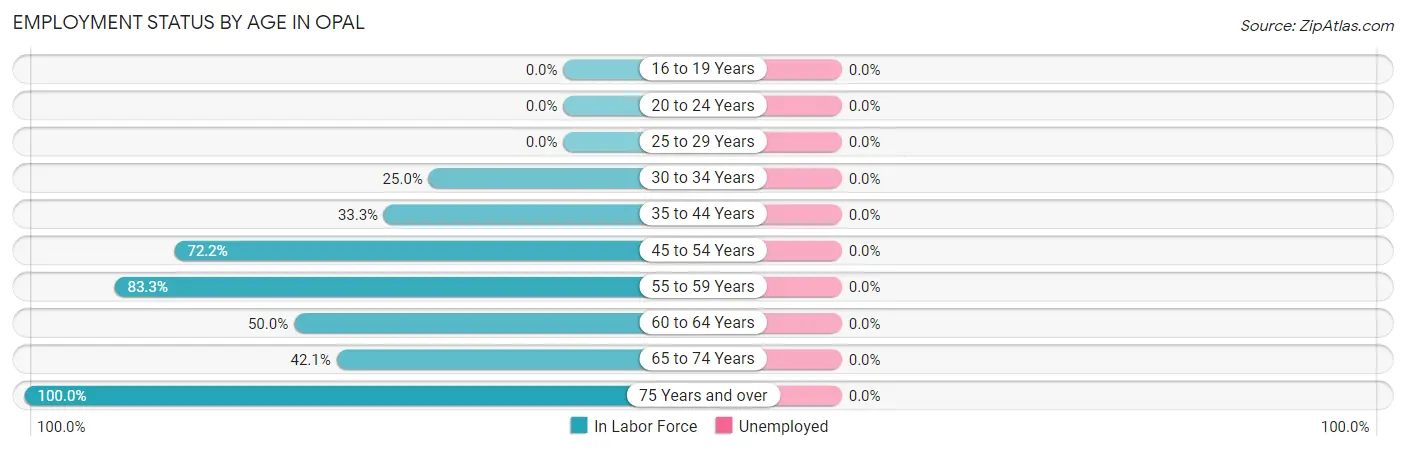
| Age Bracket | In Labor Force | Unemployed |
| 16 to 19 Years | 0 (0.0%) | 0 (0.0%) |
| 20 to 24 Years | 0 (0.0%) | 0 (0.0%) |
| 25 to 29 Years | 0 (0.0%) | 0 (0.0%) |
| 30 to 34 Years | 1 (25.0%) | 0 (0.0%) |
| 35 to 44 Years | 1 (33.3%) | 0 (0.0%) |
| 45 to 54 Years | 13 (72.2%) | 0 (0.0%) |
| 55 to 59 Years | 10 (83.3%) | 0 (0.0%) |
| 60 to 64 Years | 7 (50.0%) | 0 (0.0%) |
| 65 to 74 Years | 8 (42.1%) | 0 (0.0%) |
| 75 Years and over | 1 (100.0%) | 0 (0.0%) |
| Total | 41 (57.7%) | 0 (0.0%) |
Employment Status by Educational Attainment in Opal
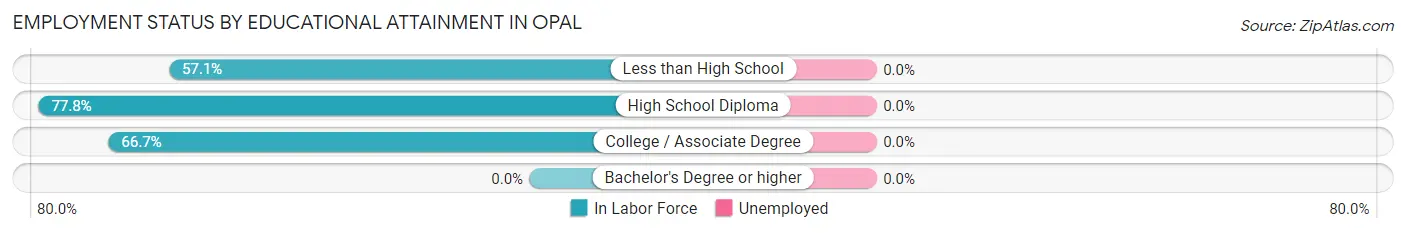
| Educational Attainment | In Labor Force | Unemployed |
| Less than High School | 4 (57.1%) | 0 (0.0%) |
| High School Diploma | 14 (77.8%) | 0 (0.0%) |
| College / Associate Degree | 14 (66.7%) | 0 (0.0%) |
| Bachelor's Degree or higher | 0 (0.0%) | 0 (0.0%) |
| Total | 32 (62.7%) | 0 (0.0%) |
Employment Occupations by Sex in Opal
Management, Business, Science and Arts Occupations
The most common Management, Business, Science and Arts occupations in Opal are Management (2 | 4.9%), Community & Social Service (1 | 2.4%), and Education Instruction & Library (1 | 2.4%).
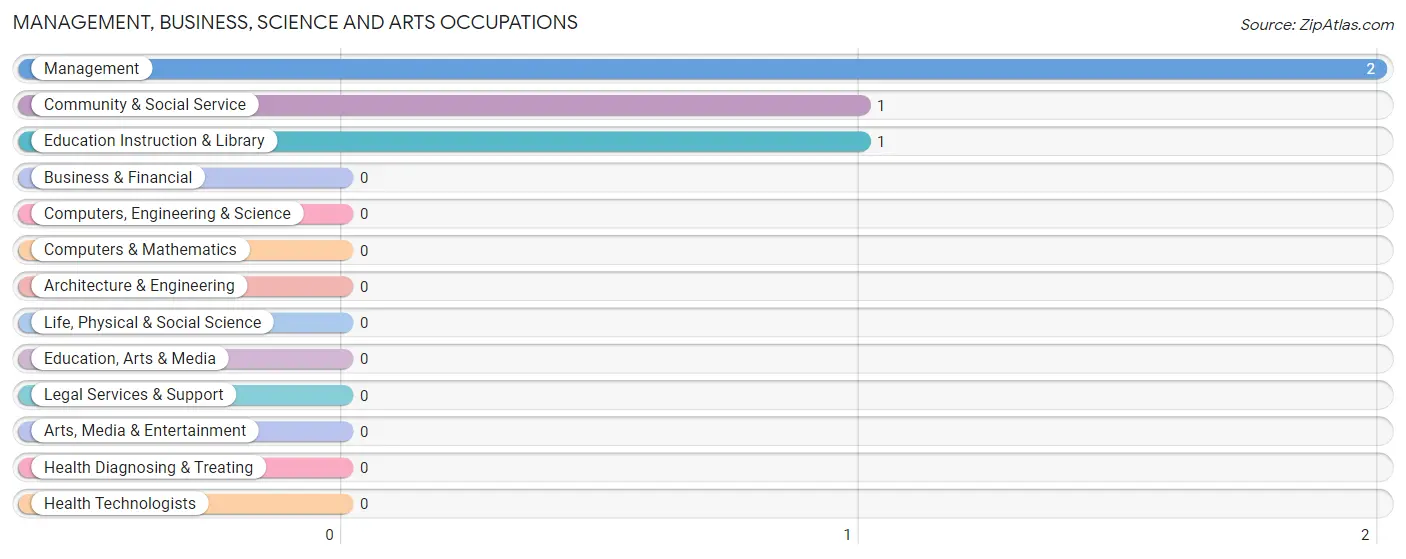
Management, Business, Science and Arts Occupations by Sex
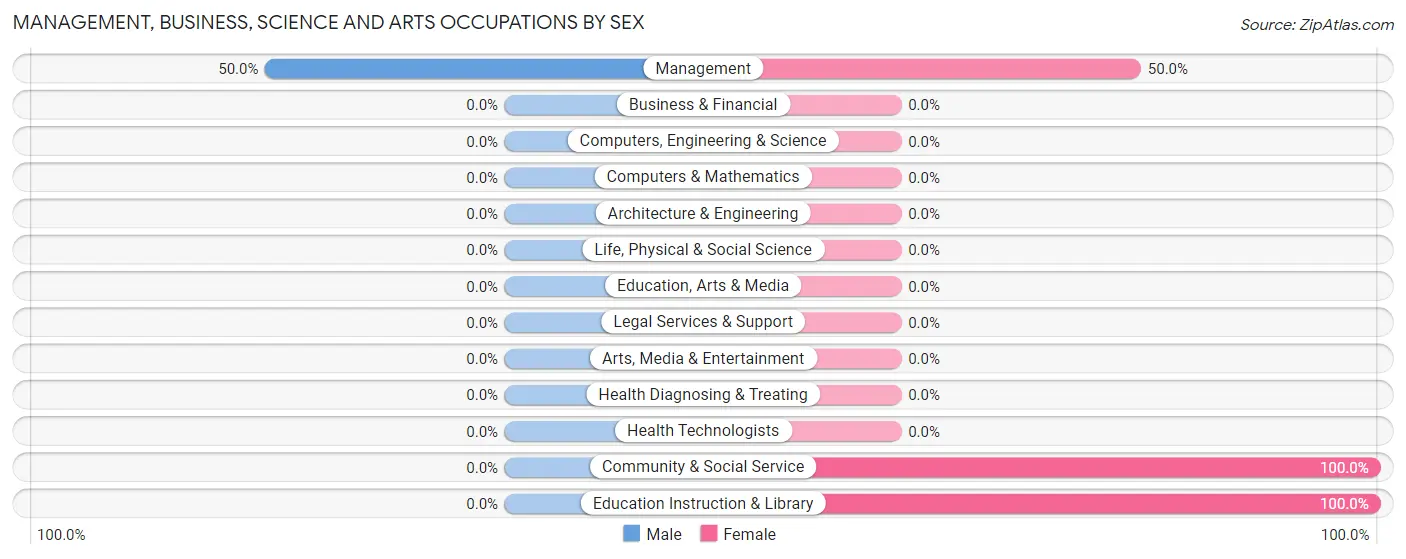
| Occupation | Male | Female |
| Management | 1 (50.0%) | 1 (50.0%) |
| Business & Financial | 0 (0.0%) | 0 (0.0%) |
| Computers, Engineering & Science | 0 (0.0%) | 0 (0.0%) |
| Computers & Mathematics | 0 (0.0%) | 0 (0.0%) |
| Architecture & Engineering | 0 (0.0%) | 0 (0.0%) |
| Life, Physical & Social Science | 0 (0.0%) | 0 (0.0%) |
| Community & Social Service | 0 (0.0%) | 1 (100.0%) |
| Education, Arts & Media | 0 (0.0%) | 0 (0.0%) |
| Legal Services & Support | 0 (0.0%) | 0 (0.0%) |
| Education Instruction & Library | 0 (0.0%) | 1 (100.0%) |
| Arts, Media & Entertainment | 0 (0.0%) | 0 (0.0%) |
| Health Diagnosing & Treating | 0 (0.0%) | 0 (0.0%) |
| Health Technologists | 0 (0.0%) | 0 (0.0%) |
| Total (Category) | 1 (33.3%) | 2 (66.7%) |
| Total (Overall) | 22 (53.7%) | 19 (46.3%) |
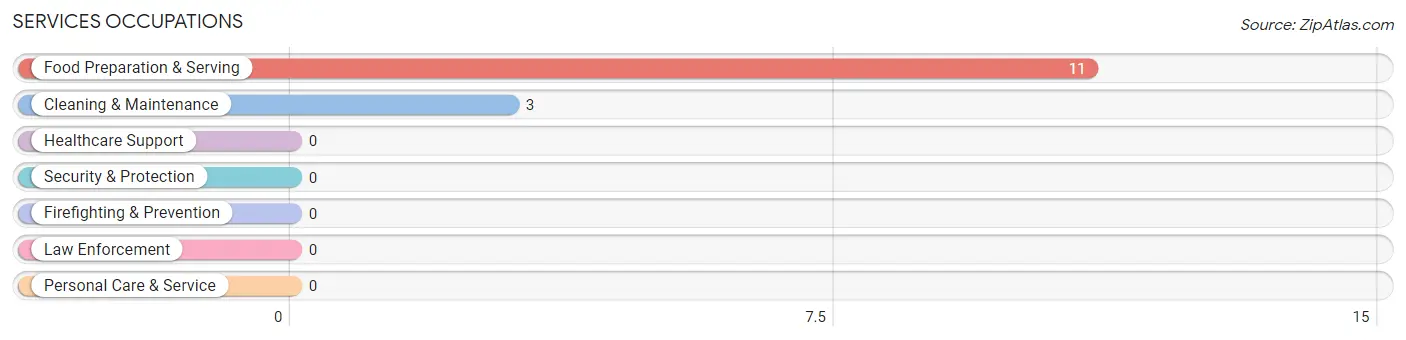
Services Occupations
The most common Services occupations in Opal are Food Preparation & Serving (11 | 26.8%), and Cleaning & Maintenance (3 | 7.3%).
Services Occupations by Sex
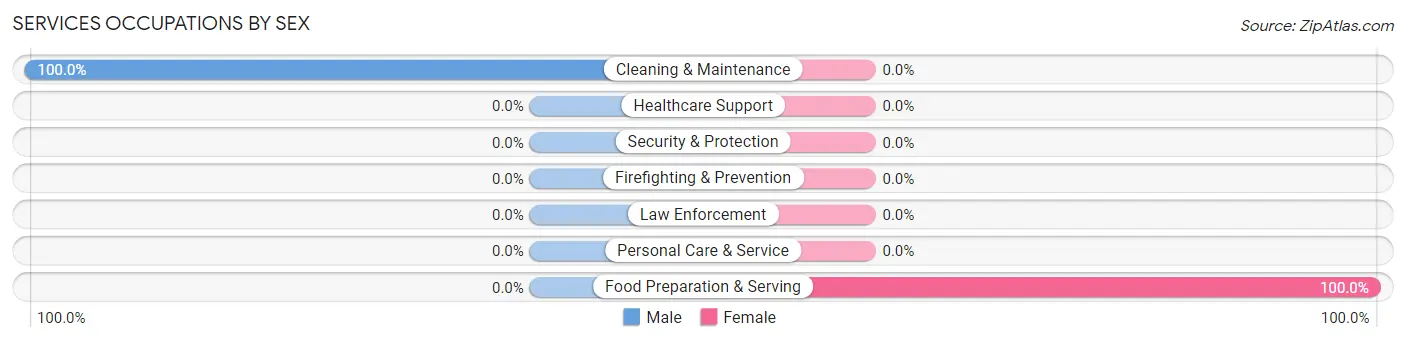
| Occupation | Male | Female |
| Healthcare Support | 0 (0.0%) | 0 (0.0%) |
| Security & Protection | 0 (0.0%) | 0 (0.0%) |
| Firefighting & Prevention | 0 (0.0%) | 0 (0.0%) |
| Law Enforcement | 0 (0.0%) | 0 (0.0%) |
| Food Preparation & Serving | 0 (0.0%) | 11 (100.0%) |
| Cleaning & Maintenance | 3 (100.0%) | 0 (0.0%) |
| Personal Care & Service | 0 (0.0%) | 0 (0.0%) |
| Total (Category) | 3 (21.4%) | 11 (78.6%) |
| Total (Overall) | 22 (53.7%) | 19 (46.3%) |
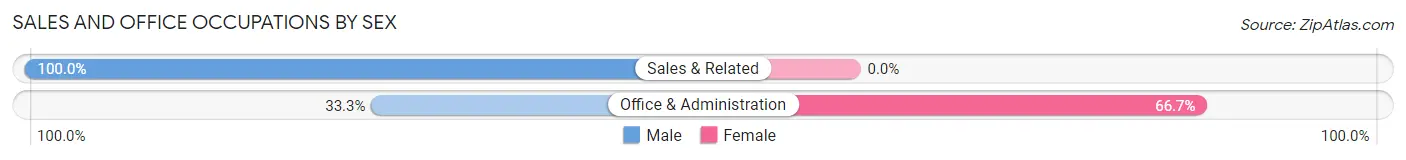
Sales and Office Occupations
The most common Sales and Office occupations in Opal are Office & Administration (6 | 14.6%), and Sales & Related (3 | 7.3%).
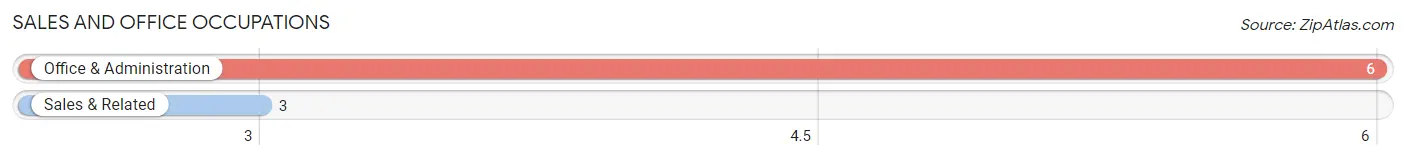
Sales and Office Occupations by Sex
| Occupation | Male | Female |
| Sales & Related | 3 (100.0%) | 0 (0.0%) |
| Office & Administration | 2 (33.3%) | 4 (66.7%) |
| Total (Category) | 5 (55.6%) | 4 (44.4%) |
| Total (Overall) | 22 (53.7%) | 19 (46.3%) |
Natural Resources, Construction and Maintenance Occupations
The most common Natural Resources, Construction and Maintenance occupations in Opal are , and Construction & Extraction (6 | 14.6%).
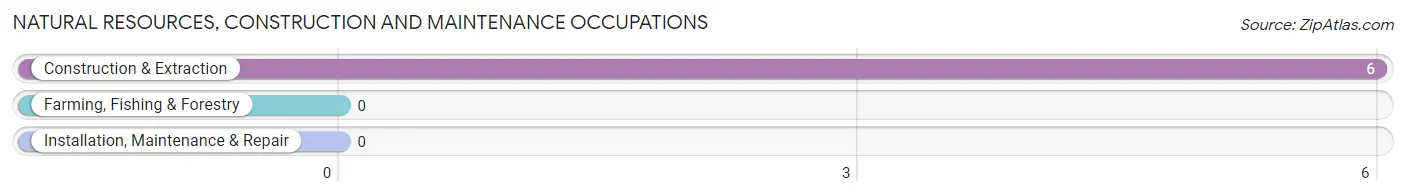
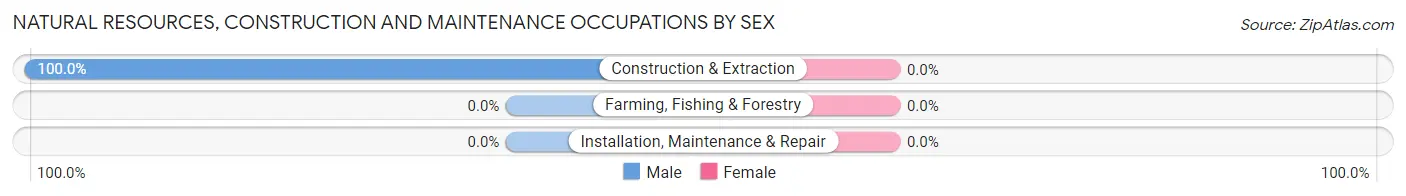
Natural Resources, Construction and Maintenance Occupations by Sex
| Occupation | Male | Female |
| Farming, Fishing & Forestry | 0 (0.0%) | 0 (0.0%) |
| Construction & Extraction | 6 (100.0%) | 0 (0.0%) |
| Installation, Maintenance & Repair | 0 (0.0%) | 0 (0.0%) |
| Total (Category) | 6 (100.0%) | 0 (0.0%) |
| Total (Overall) | 22 (53.7%) | 19 (46.3%) |
Production, Transportation and Moving Occupations
The most common Production, Transportation and Moving occupations in Opal are Transportation (8 | 19.5%), and Production (1 | 2.4%).
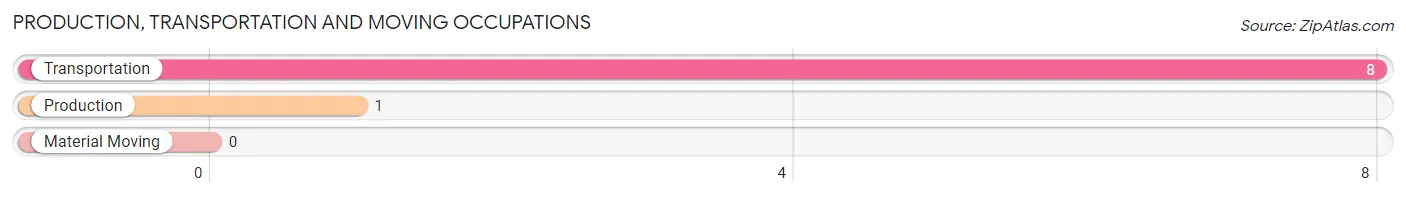
Production, Transportation and Moving Occupations by Sex
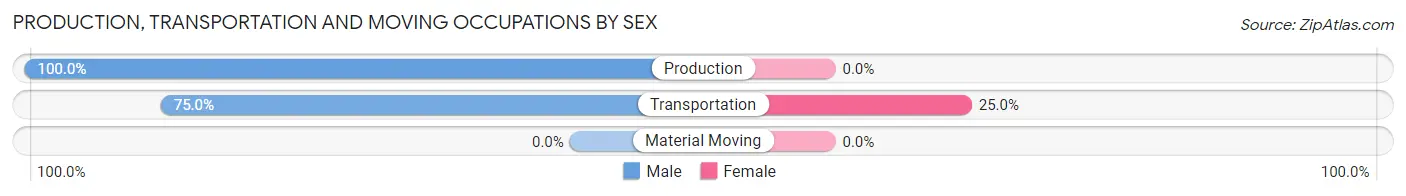
| Occupation | Male | Female |
| Production | 1 (100.0%) | 0 (0.0%) |
| Transportation | 6 (75.0%) | 2 (25.0%) |
| Material Moving | 0 (0.0%) | 0 (0.0%) |
| Total (Category) | 7 (77.8%) | 2 (22.2%) |
| Total (Overall) | 22 (53.7%) | 19 (46.3%) |
Employment Industries by Sex in Opal
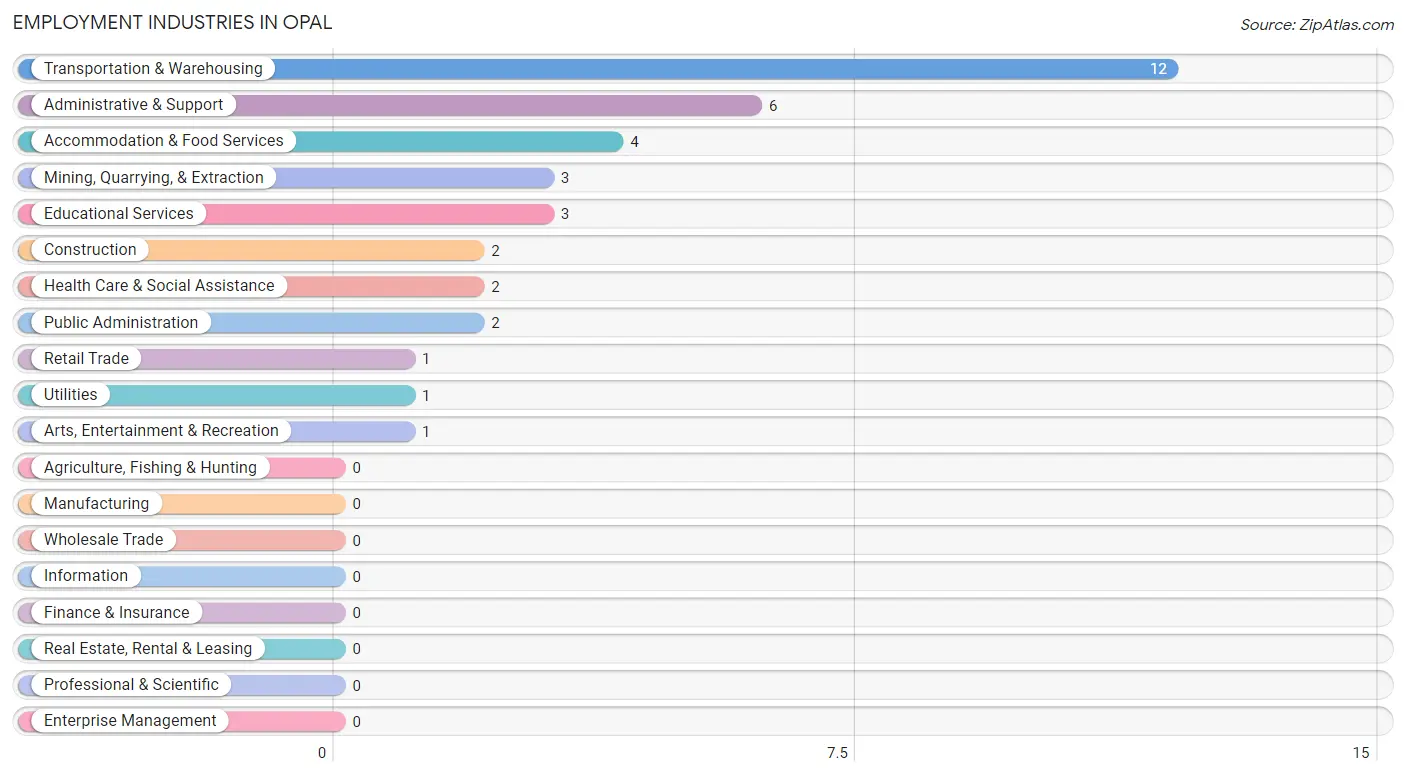
Employment Industries in Opal
The major employment industries in Opal include Transportation & Warehousing (12 | 29.3%), Administrative & Support (6 | 14.6%), Accommodation & Food Services (4 | 9.8%), Mining, Quarrying, & Extraction (3 | 7.3%), and Educational Services (3 | 7.3%).
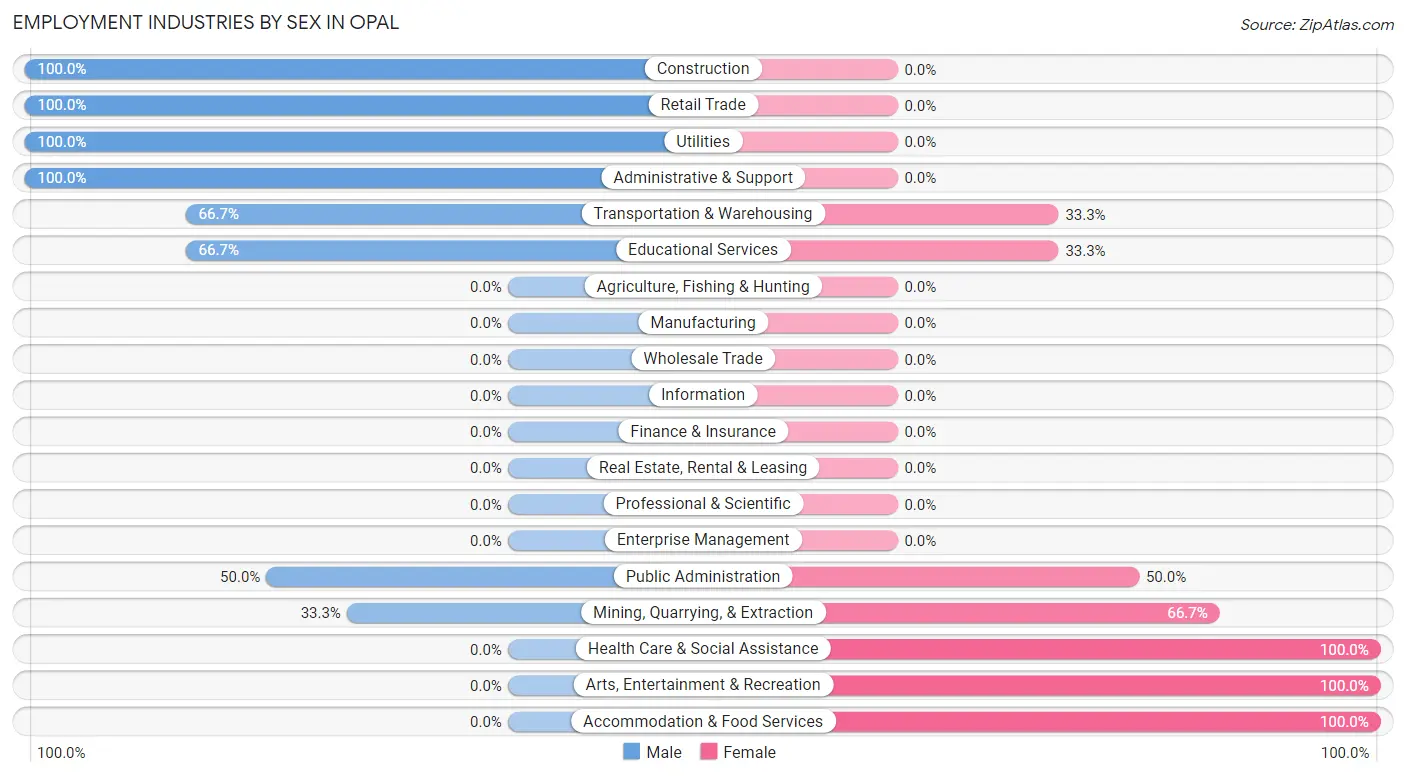
Employment Industries by Sex in Opal
The Opal industries that see more men than women are Construction (100.0%), Retail Trade (100.0%), and Utilities (100.0%), whereas the industries that tend to have a higher number of women are Health Care & Social Assistance (100.0%), Arts, Entertainment & Recreation (100.0%), and Accommodation & Food Services (100.0%).
| Industry | Male | Female |
| Agriculture, Fishing & Hunting | 0 (0.0%) | 0 (0.0%) |
| Mining, Quarrying, & Extraction | 1 (33.3%) | 2 (66.7%) |
| Construction | 2 (100.0%) | 0 (0.0%) |
| Manufacturing | 0 (0.0%) | 0 (0.0%) |
| Wholesale Trade | 0 (0.0%) | 0 (0.0%) |
| Retail Trade | 1 (100.0%) | 0 (0.0%) |
| Transportation & Warehousing | 8 (66.7%) | 4 (33.3%) |
| Utilities | 1 (100.0%) | 0 (0.0%) |
| Information | 0 (0.0%) | 0 (0.0%) |
| Finance & Insurance | 0 (0.0%) | 0 (0.0%) |
| Real Estate, Rental & Leasing | 0 (0.0%) | 0 (0.0%) |
| Professional & Scientific | 0 (0.0%) | 0 (0.0%) |
| Enterprise Management | 0 (0.0%) | 0 (0.0%) |
| Administrative & Support | 6 (100.0%) | 0 (0.0%) |
| Educational Services | 2 (66.7%) | 1 (33.3%) |
| Health Care & Social Assistance | 0 (0.0%) | 2 (100.0%) |
| Arts, Entertainment & Recreation | 0 (0.0%) | 1 (100.0%) |
| Accommodation & Food Services | 0 (0.0%) | 4 (100.0%) |
| Public Administration | 1 (50.0%) | 1 (50.0%) |
| Total | 22 (53.7%) | 19 (46.3%) |
Education in Opal
School Enrollment in Opal
The most common levels of schooling among the 4 students in Opal are elementary school (1 | 25.0%), middle school (1 | 25.0%), and high school (1 | 25.0%).
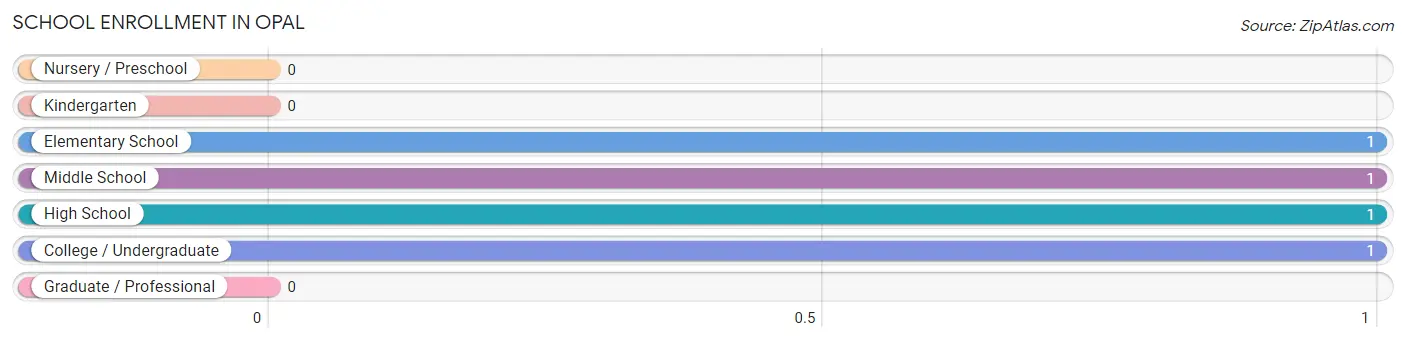
| School Level | # Students | % Students |
| Nursery / Preschool | 0 | 0.0% |
| Kindergarten | 0 | 0.0% |
| Elementary School | 1 | 25.0% |
| Middle School | 1 | 25.0% |
| High School | 1 | 25.0% |
| College / Undergraduate | 1 | 25.0% |
| Graduate / Professional | 0 | 0.0% |
| Total | 4 | 100.0% |
School Enrollment by Age by Funding Source in Opal
Out of a total of 4 students who are enrolled in schools in Opal, 1 (25.0%) attend a private institution, while the remaining 3 (75.0%) are enrolled in public schools. The age group of 5 to 9 year old has the highest likelihood of being enrolled in private schools, with 1 (100.0% in the age bracket) enrolled. Conversely, the age group of 10 to 14 year olds has the lowest likelihood of being enrolled in a private school, with 1 (100.0% in the age bracket) attending a public institution.
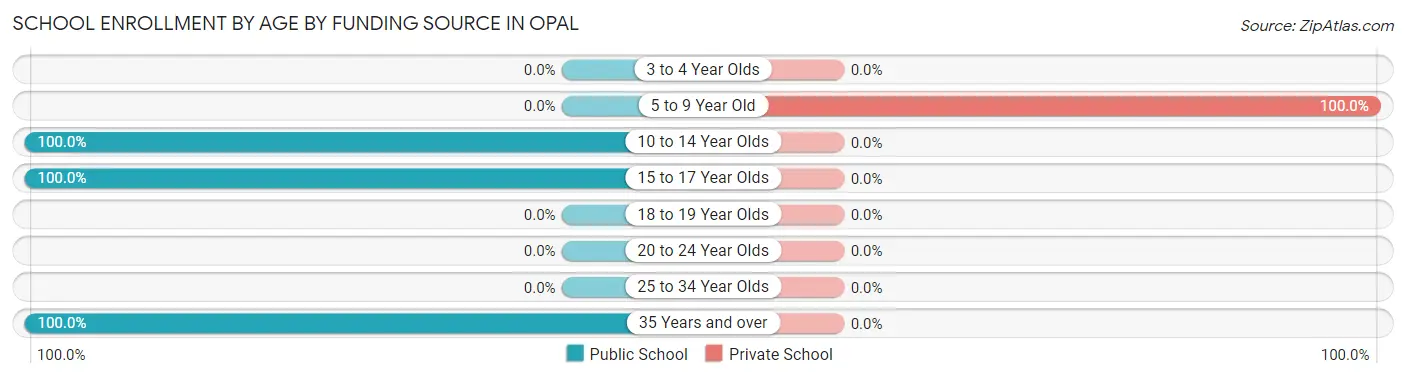
| Age Bracket | Public School | Private School |
| 3 to 4 Year Olds | 0 (0.0%) | 0 (0.0%) |
| 5 to 9 Year Old | 0 (0.0%) | 1 (100.0%) |
| 10 to 14 Year Olds | 1 (100.0%) | 0 (0.0%) |
| 15 to 17 Year Olds | 1 (100.0%) | 0 (0.0%) |
| 18 to 19 Year Olds | 0 (0.0%) | 0 (0.0%) |
| 20 to 24 Year Olds | 0 (0.0%) | 0 (0.0%) |
| 25 to 34 Year Olds | 0 (0.0%) | 0 (0.0%) |
| 35 Years and over | 1 (100.0%) | 0 (0.0%) |
| Total | 3 (75.0%) | 1 (25.0%) |
Educational Attainment by Field of Study in Opal
Arts & humanities (3 | 60.0%), and computers & mathematics (2 | 40.0%) are the most common fields of study among 5 individuals in Opal who have obtained a bachelor's degree or higher.
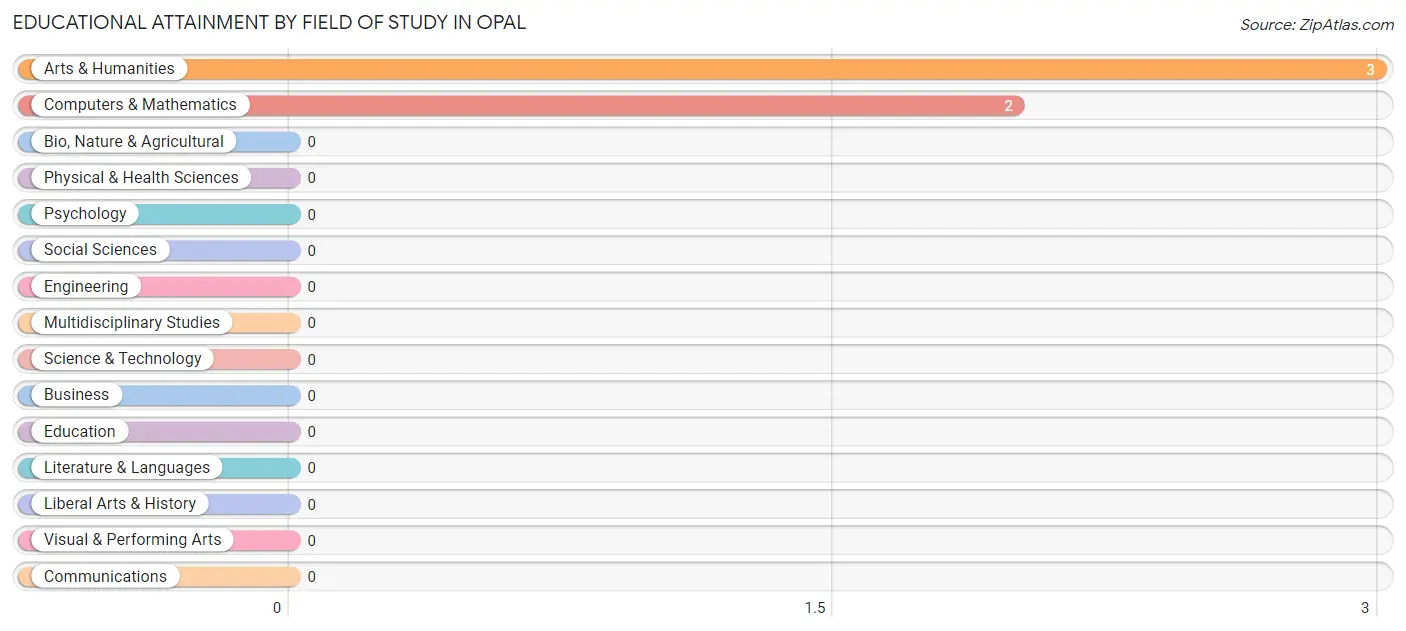
| Field of Study | # Graduates | % Graduates |
| Computers & Mathematics | 2 | 40.0% |
| Bio, Nature & Agricultural | 0 | 0.0% |
| Physical & Health Sciences | 0 | 0.0% |
| Psychology | 0 | 0.0% |
| Social Sciences | 0 | 0.0% |
| Engineering | 0 | 0.0% |
| Multidisciplinary Studies | 0 | 0.0% |
| Science & Technology | 0 | 0.0% |
| Business | 0 | 0.0% |
| Education | 0 | 0.0% |
| Literature & Languages | 0 | 0.0% |
| Liberal Arts & History | 0 | 0.0% |
| Visual & Performing Arts | 0 | 0.0% |
| Communications | 0 | 0.0% |
| Arts & Humanities | 3 | 60.0% |
| Total | 5 | 100.0% |
Transportation & Commute in Opal
Vehicle Availability by Sex in Opal
The most prevalent vehicle ownership categories in Opal are males with 2 vehicles (11, accounting for 50.0%) and females with 2 vehicles (9, making up 57.9%).
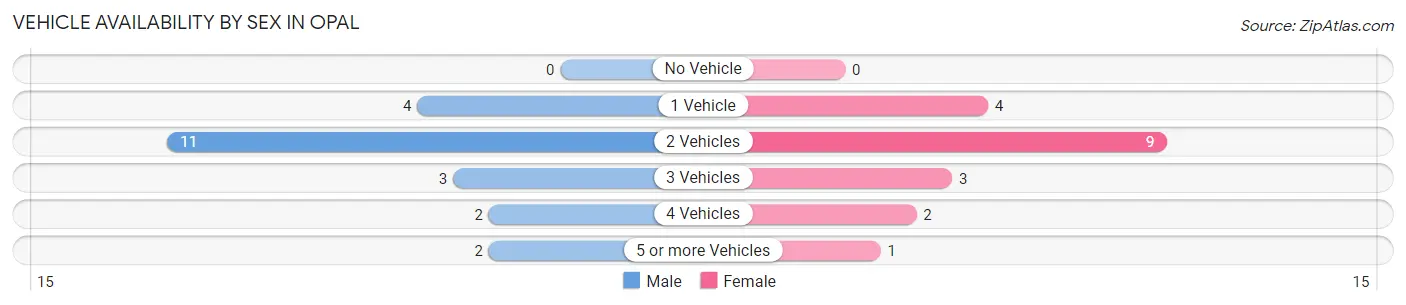
| Vehicles Available | Male | Female |
| No Vehicle | 0 (0.0%) | 0 (0.0%) |
| 1 Vehicle | 4 (18.2%) | 4 (21.0%) |
| 2 Vehicles | 11 (50.0%) | 9 (47.4%) |
| 3 Vehicles | 3 (13.6%) | 3 (15.8%) |
| 4 Vehicles | 2 (9.1%) | 2 (10.5%) |
| 5 or more Vehicles | 2 (9.1%) | 1 (5.3%) |
| Total | 22 (100.0%) | 19 (100.0%) |
Commute Time in Opal
The most frequently occuring commute durations in Opal are 20 to 24 minutes (17 commuters, 42.5%), 15 to 19 minutes (7 commuters, 17.5%), and 30 to 34 minutes (6 commuters, 15.0%).
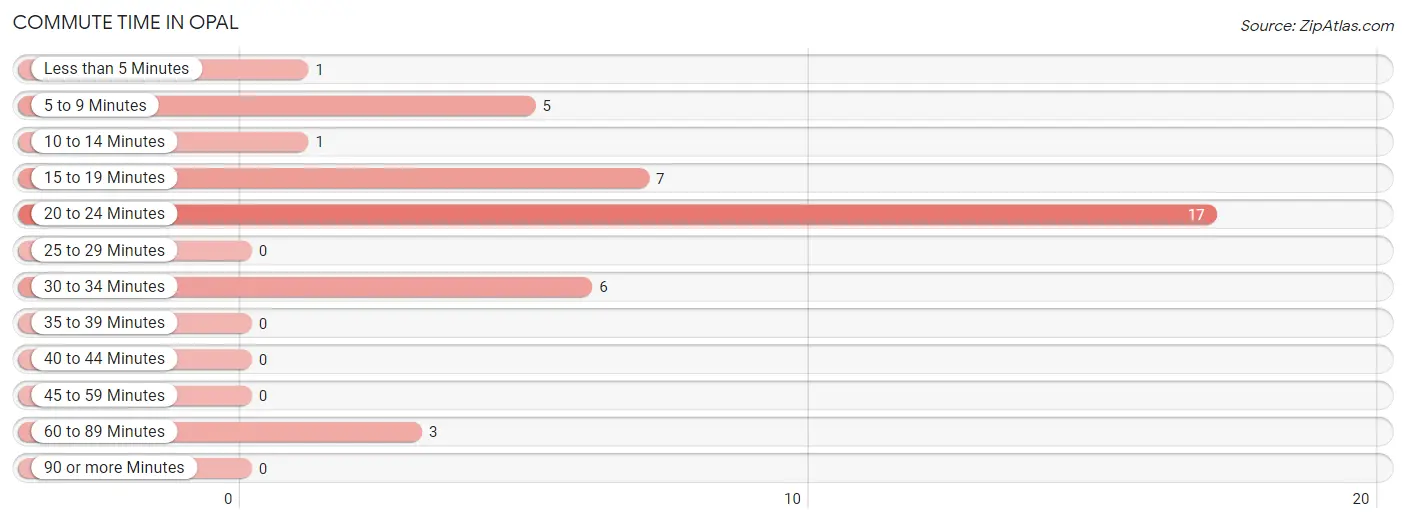
| Commute Time | # Commuters | % Commuters |
| Less than 5 Minutes | 1 | 2.5% |
| 5 to 9 Minutes | 5 | 12.5% |
| 10 to 14 Minutes | 1 | 2.5% |
| 15 to 19 Minutes | 7 | 17.5% |
| 20 to 24 Minutes | 17 | 42.5% |
| 25 to 29 Minutes | 0 | 0.0% |
| 30 to 34 Minutes | 6 | 15.0% |
| 35 to 39 Minutes | 0 | 0.0% |
| 40 to 44 Minutes | 0 | 0.0% |
| 45 to 59 Minutes | 0 | 0.0% |
| 60 to 89 Minutes | 3 | 7.5% |
| 90 or more Minutes | 0 | 0.0% |
Commute Time by Sex in Opal
The most common commute times in Opal are 20 to 24 minutes (11 commuters, 52.4%) for males and 20 to 24 minutes (6 commuters, 31.6%) for females.
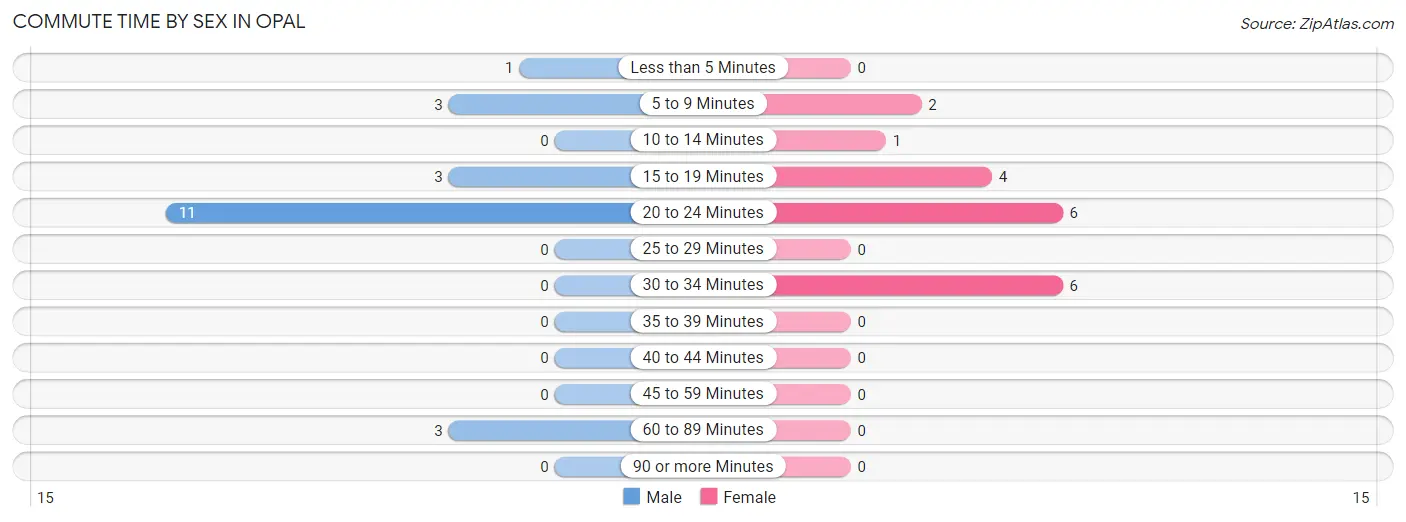
| Commute Time | Male | Female |
| Less than 5 Minutes | 1 (4.8%) | 0 (0.0%) |
| 5 to 9 Minutes | 3 (14.3%) | 2 (10.5%) |
| 10 to 14 Minutes | 0 (0.0%) | 1 (5.3%) |
| 15 to 19 Minutes | 3 (14.3%) | 4 (21.0%) |
| 20 to 24 Minutes | 11 (52.4%) | 6 (31.6%) |
| 25 to 29 Minutes | 0 (0.0%) | 0 (0.0%) |
| 30 to 34 Minutes | 0 (0.0%) | 6 (31.6%) |
| 35 to 39 Minutes | 0 (0.0%) | 0 (0.0%) |
| 40 to 44 Minutes | 0 (0.0%) | 0 (0.0%) |
| 45 to 59 Minutes | 0 (0.0%) | 0 (0.0%) |
| 60 to 89 Minutes | 3 (14.3%) | 0 (0.0%) |
| 90 or more Minutes | 0 (0.0%) | 0 (0.0%) |
Time of Departure to Work by Sex in Opal
The most frequent times of departure to work in Opal are 6:00 AM to 6:29 AM (6, 28.6%) for males and 4:00 PM to 11:59 PM (6, 31.6%) for females.
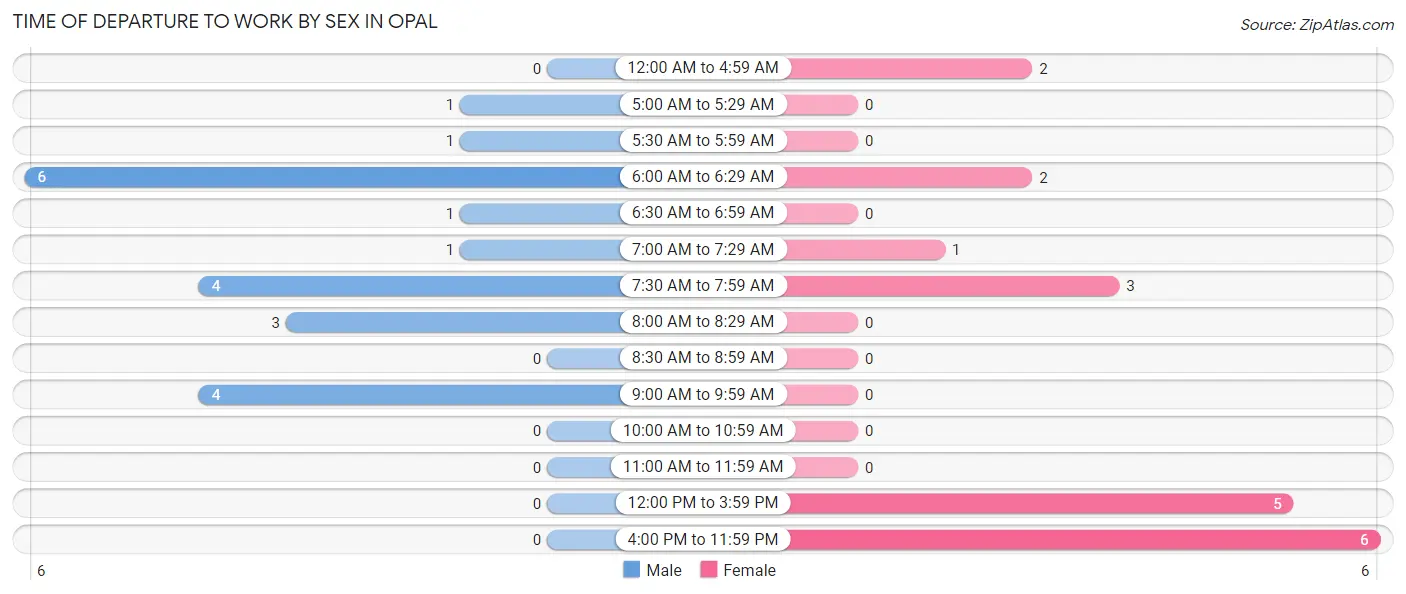
| Time of Departure | Male | Female |
| 12:00 AM to 4:59 AM | 0 (0.0%) | 2 (10.5%) |
| 5:00 AM to 5:29 AM | 1 (4.8%) | 0 (0.0%) |
| 5:30 AM to 5:59 AM | 1 (4.8%) | 0 (0.0%) |
| 6:00 AM to 6:29 AM | 6 (28.6%) | 2 (10.5%) |
| 6:30 AM to 6:59 AM | 1 (4.8%) | 0 (0.0%) |
| 7:00 AM to 7:29 AM | 1 (4.8%) | 1 (5.3%) |
| 7:30 AM to 7:59 AM | 4 (19.1%) | 3 (15.8%) |
| 8:00 AM to 8:29 AM | 3 (14.3%) | 0 (0.0%) |
| 8:30 AM to 8:59 AM | 0 (0.0%) | 0 (0.0%) |
| 9:00 AM to 9:59 AM | 4 (19.1%) | 0 (0.0%) |
| 10:00 AM to 10:59 AM | 0 (0.0%) | 0 (0.0%) |
| 11:00 AM to 11:59 AM | 0 (0.0%) | 0 (0.0%) |
| 12:00 PM to 3:59 PM | 0 (0.0%) | 5 (26.3%) |
| 4:00 PM to 11:59 PM | 0 (0.0%) | 6 (31.6%) |
| Total | 21 (100.0%) | 19 (100.0%) |
Housing Occupancy in Opal
Occupancy by Ownership in Opal
Of the total 31 dwellings in Opal, owner-occupied units account for 28 (90.3%), while renter-occupied units make up 3 (9.7%).
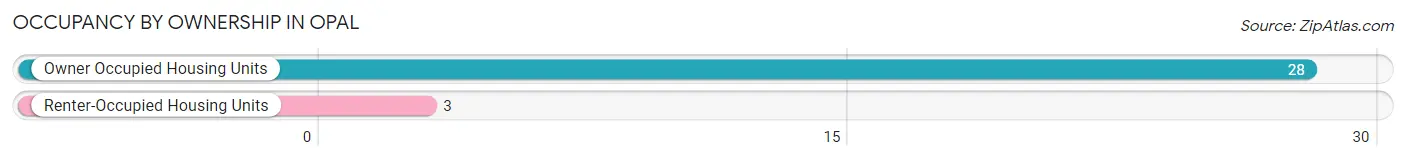
| Occupancy | # Housing Units | % Housing Units |
| Owner Occupied Housing Units | 28 | 90.3% |
| Renter-Occupied Housing Units | 3 | 9.7% |
| Total Occupied Housing Units | 31 | 100.0% |
Occupancy by Household Size in Opal
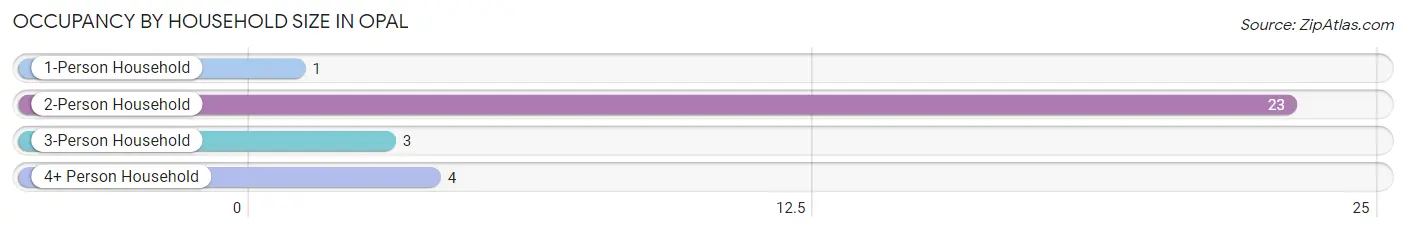
| Household Size | # Housing Units | % Housing Units |
| 1-Person Household | 1 | 3.2% |
| 2-Person Household | 23 | 74.2% |
| 3-Person Household | 3 | 9.7% |
| 4+ Person Household | 4 | 12.9% |
| Total Housing Units | 31 | 100.0% |
Occupancy by Ownership by Household Size in Opal
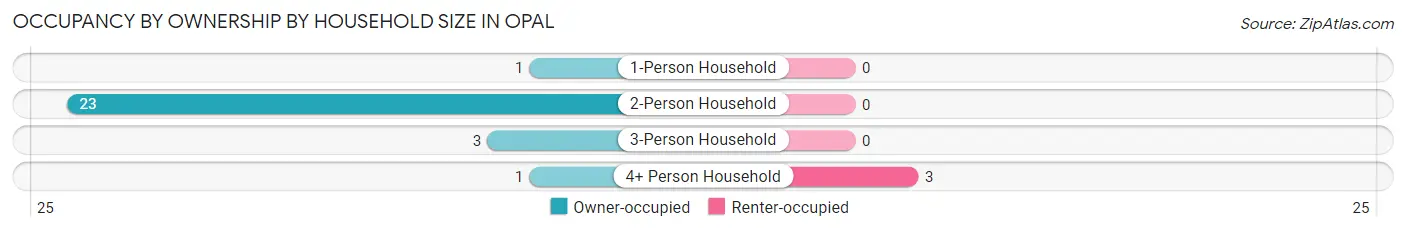
| Household Size | Owner-occupied | Renter-occupied |
| 1-Person Household | 1 (100.0%) | 0 (0.0%) |
| 2-Person Household | 23 (100.0%) | 0 (0.0%) |
| 3-Person Household | 3 (100.0%) | 0 (0.0%) |
| 4+ Person Household | 1 (25.0%) | 3 (75.0%) |
| Total Housing Units | 28 (90.3%) | 3 (9.7%) |
Occupancy by Educational Attainment in Opal
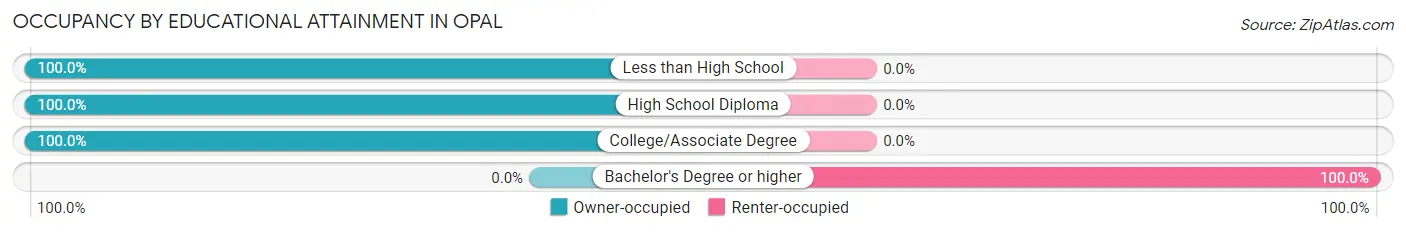
| Household Size | Owner-occupied | Renter-occupied |
| Less than High School | 1 (100.0%) | 0 (0.0%) |
| High School Diploma | 10 (100.0%) | 0 (0.0%) |
| College/Associate Degree | 17 (100.0%) | 0 (0.0%) |
| Bachelor's Degree or higher | 0 (0.0%) | 3 (100.0%) |
Occupancy by Age of Householder in Opal
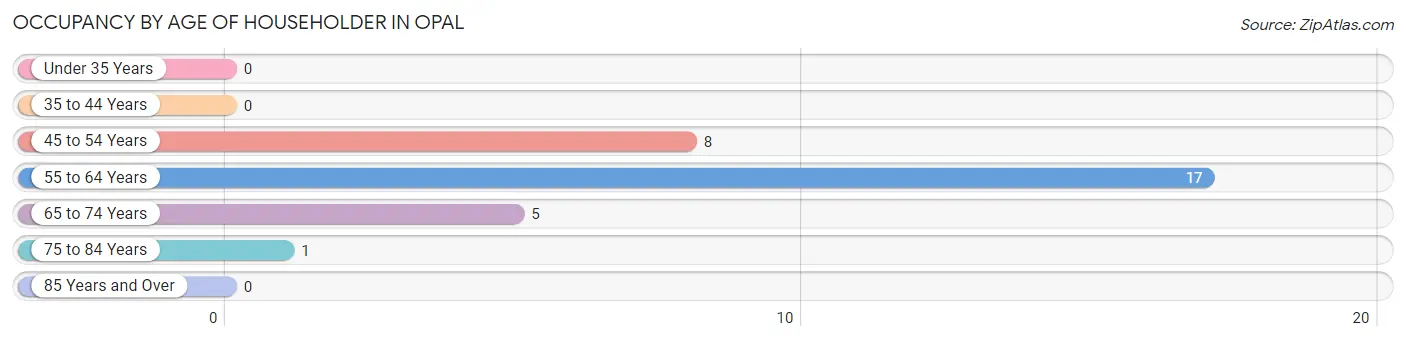
| Age Bracket | # Households | % Households |
| Under 35 Years | 0 | 0.0% |
| 35 to 44 Years | 0 | 0.0% |
| 45 to 54 Years | 8 | 25.8% |
| 55 to 64 Years | 17 | 54.8% |
| 65 to 74 Years | 5 | 16.1% |
| 75 to 84 Years | 1 | 3.2% |
| 85 Years and Over | 0 | 0.0% |
| Total | 31 | 100.0% |
Housing Finances in Opal
Median Income by Occupancy in Opal
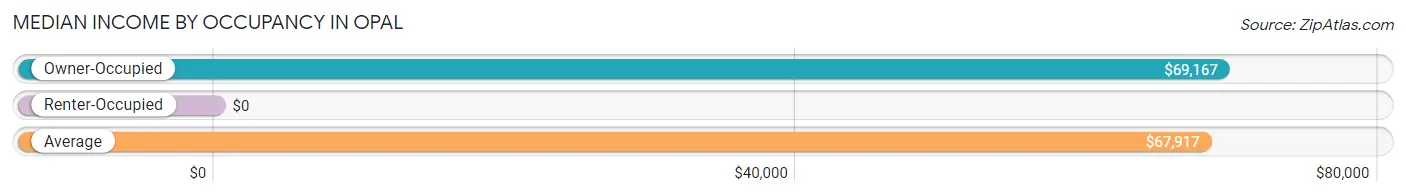
| Occupancy Type | # Households | Median Income |
| Owner-Occupied | 28 (90.3%) | $69,167 |
| Renter-Occupied | 3 (9.7%) | $0 |
| Average | 31 (100.0%) | $67,917 |
Occupancy by Householder Income Bracket in Opal
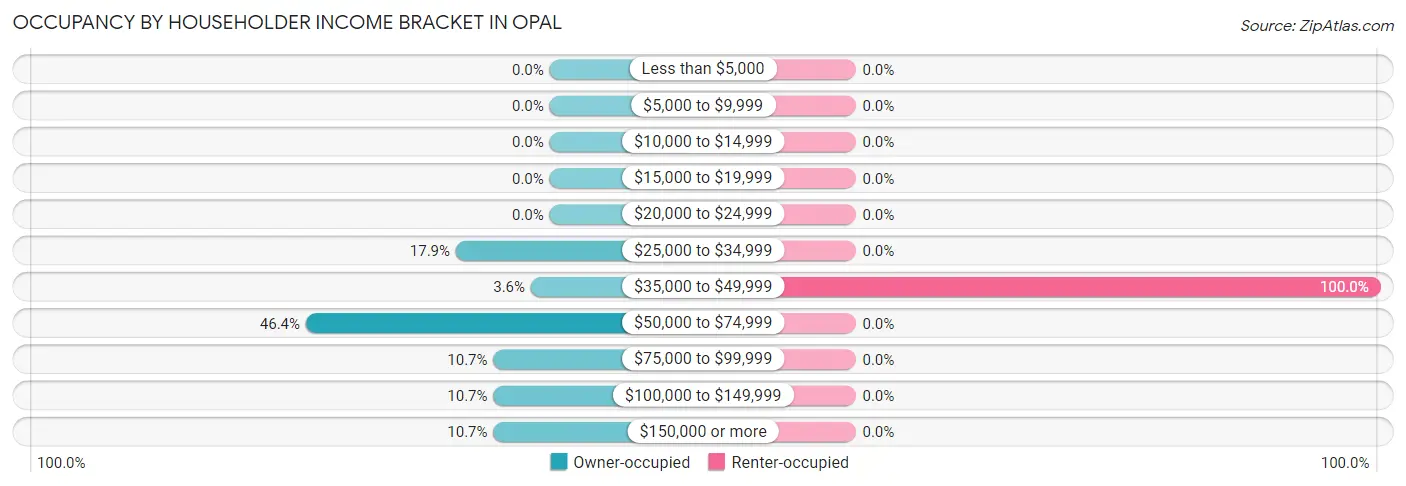
| Income Bracket | Owner-occupied | Renter-occupied |
| Less than $5,000 | 0 (0.0%) | 0 (0.0%) |
| $5,000 to $9,999 | 0 (0.0%) | 0 (0.0%) |
| $10,000 to $14,999 | 0 (0.0%) | 0 (0.0%) |
| $15,000 to $19,999 | 0 (0.0%) | 0 (0.0%) |
| $20,000 to $24,999 | 0 (0.0%) | 0 (0.0%) |
| $25,000 to $34,999 | 5 (17.9%) | 0 (0.0%) |
| $35,000 to $49,999 | 1 (3.6%) | 3 (100.0%) |
| $50,000 to $74,999 | 13 (46.4%) | 0 (0.0%) |
| $75,000 to $99,999 | 3 (10.7%) | 0 (0.0%) |
| $100,000 to $149,999 | 3 (10.7%) | 0 (0.0%) |
| $150,000 or more | 3 (10.7%) | 0 (0.0%) |
| Total | 28 (100.0%) | 3 (100.0%) |
Monthly Housing Cost Tiers in Opal
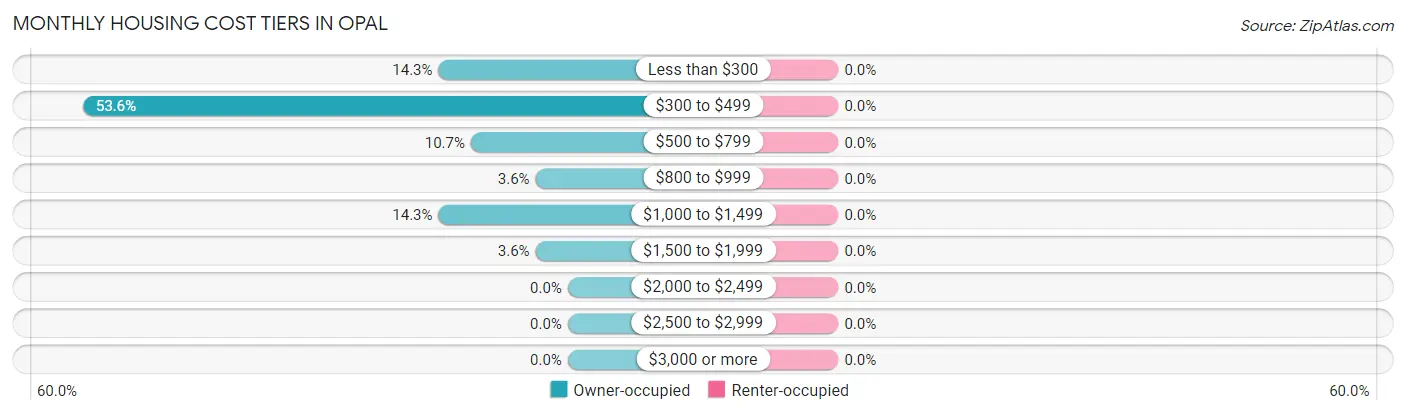
| Monthly Cost | Owner-occupied | Renter-occupied |
| Less than $300 | 4 (14.3%) | 0 (0.0%) |
| $300 to $499 | 15 (53.6%) | 0 (0.0%) |
| $500 to $799 | 3 (10.7%) | 0 (0.0%) |
| $800 to $999 | 1 (3.6%) | 0 (0.0%) |
| $1,000 to $1,499 | 4 (14.3%) | 0 (0.0%) |
| $1,500 to $1,999 | 1 (3.6%) | 0 (0.0%) |
| $2,000 to $2,499 | 0 (0.0%) | 0 (0.0%) |
| $2,500 to $2,999 | 0 (0.0%) | 0 (0.0%) |
| $3,000 or more | 0 (0.0%) | 0 (0.0%) |
| Total | 28 (100.0%) | 3 (100.0%) |
Physical Housing Characteristics in Opal
Housing Structures in Opal
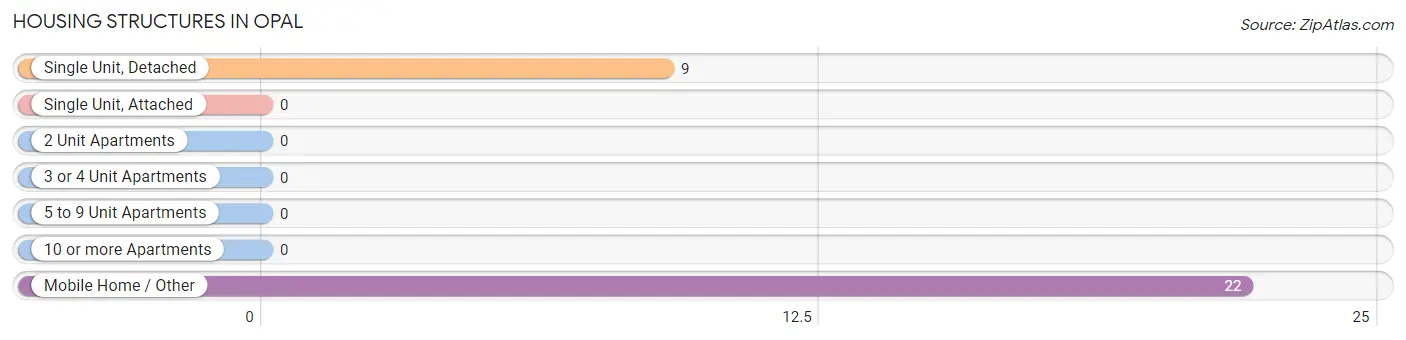
| Structure Type | # Housing Units | % Housing Units |
| Single Unit, Detached | 9 | 29.0% |
| Single Unit, Attached | 0 | 0.0% |
| 2 Unit Apartments | 0 | 0.0% |
| 3 or 4 Unit Apartments | 0 | 0.0% |
| 5 to 9 Unit Apartments | 0 | 0.0% |
| 10 or more Apartments | 0 | 0.0% |
| Mobile Home / Other | 22 | 71.0% |
| Total | 31 | 100.0% |
Housing Structures by Occupancy in Opal
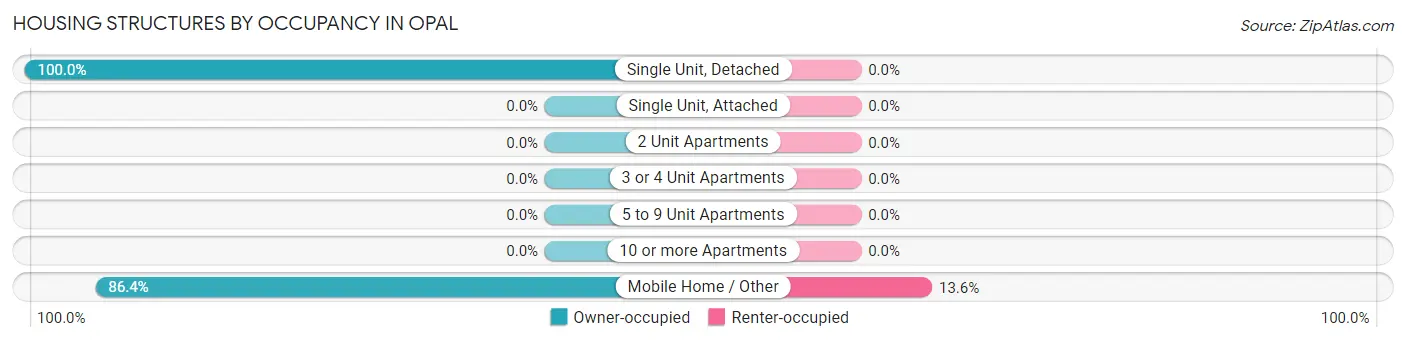
| Structure Type | Owner-occupied | Renter-occupied |
| Single Unit, Detached | 9 (100.0%) | 0 (0.0%) |
| Single Unit, Attached | 0 (0.0%) | 0 (0.0%) |
| 2 Unit Apartments | 0 (0.0%) | 0 (0.0%) |
| 3 or 4 Unit Apartments | 0 (0.0%) | 0 (0.0%) |
| 5 to 9 Unit Apartments | 0 (0.0%) | 0 (0.0%) |
| 10 or more Apartments | 0 (0.0%) | 0 (0.0%) |
| Mobile Home / Other | 19 (86.4%) | 3 (13.6%) |
| Total | 28 (90.3%) | 3 (9.7%) |
Housing Structures by Number of Rooms in Opal
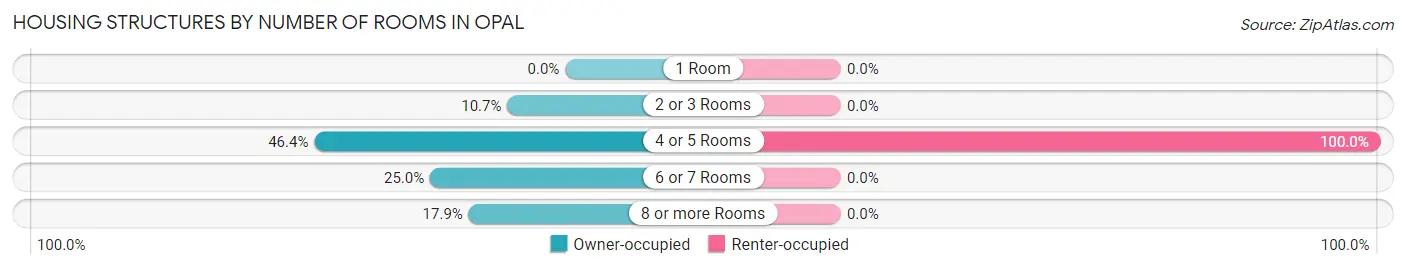
| Number of Rooms | Owner-occupied | Renter-occupied |
| 1 Room | 0 (0.0%) | 0 (0.0%) |
| 2 or 3 Rooms | 3 (10.7%) | 0 (0.0%) |
| 4 or 5 Rooms | 13 (46.4%) | 3 (100.0%) |
| 6 or 7 Rooms | 7 (25.0%) | 0 (0.0%) |
| 8 or more Rooms | 5 (17.9%) | 0 (0.0%) |
| Total | 28 (100.0%) | 3 (100.0%) |
Housing Structure by Heating Type in Opal
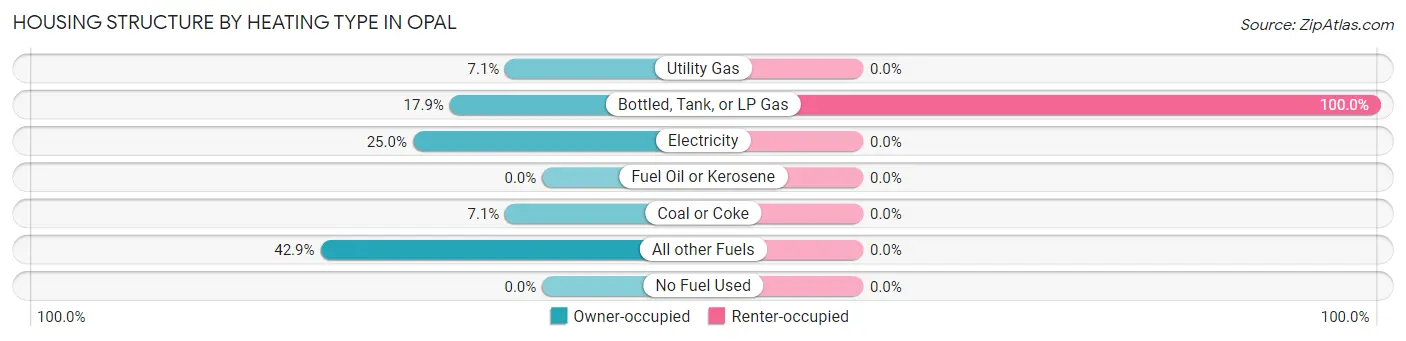
| Heating Type | Owner-occupied | Renter-occupied |
| Utility Gas | 2 (7.1%) | 0 (0.0%) |
| Bottled, Tank, or LP Gas | 5 (17.9%) | 3 (100.0%) |
| Electricity | 7 (25.0%) | 0 (0.0%) |
| Fuel Oil or Kerosene | 0 (0.0%) | 0 (0.0%) |
| Coal or Coke | 2 (7.1%) | 0 (0.0%) |
| All other Fuels | 12 (42.9%) | 0 (0.0%) |
| No Fuel Used | 0 (0.0%) | 0 (0.0%) |
| Total | 28 (100.0%) | 3 (100.0%) |
Household Vehicle Usage in Opal
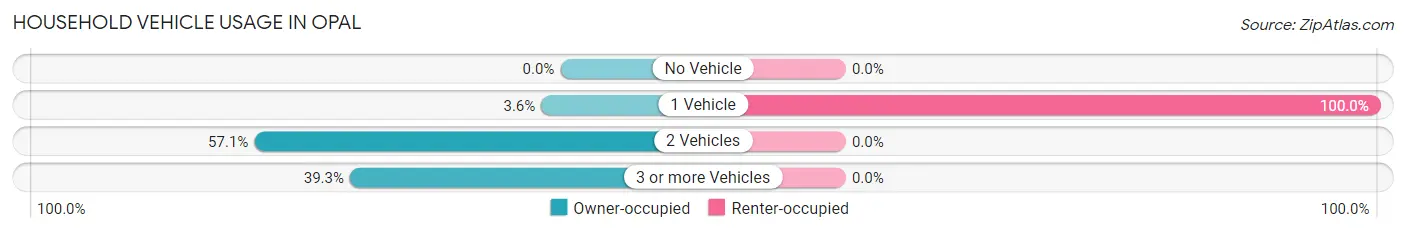
| Vehicles per Household | Owner-occupied | Renter-occupied |
| No Vehicle | 0 (0.0%) | 0 (0.0%) |
| 1 Vehicle | 1 (3.6%) | 3 (100.0%) |
| 2 Vehicles | 16 (57.1%) | 0 (0.0%) |
| 3 or more Vehicles | 11 (39.3%) | 0 (0.0%) |
| Total | 28 (100.0%) | 3 (100.0%) |
Real Estate & Mortgages in Opal
Real Estate and Mortgage Overview in Opal
| Characteristic | Without Mortgage | With Mortgage |
| Housing Units | 24 | 4 |
| Median Property Value | $30,000 | $0 |
| Median Household Income | $66,250 | $3 |
| Monthly Housing Costs | $400 | $0 |
| Real Estate Taxes | $199 | $0 |
Property Value by Mortgage Status in Opal
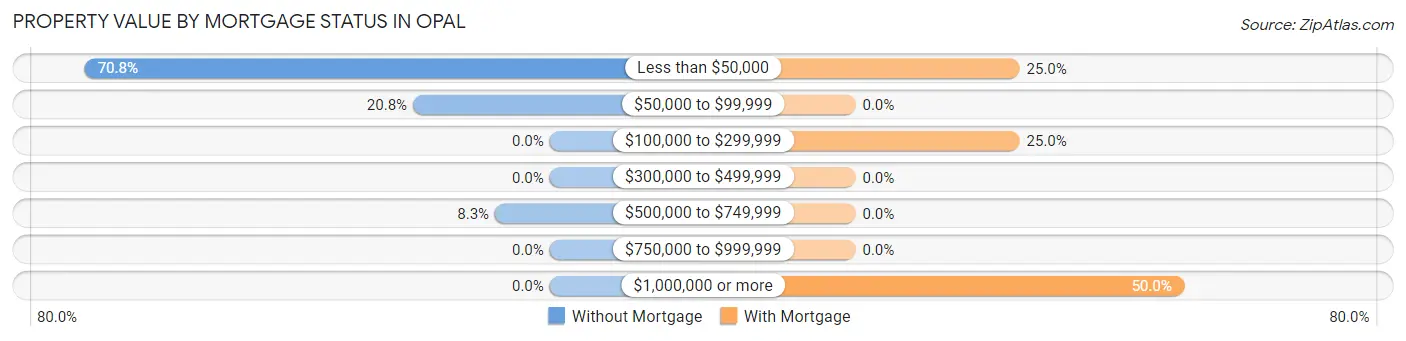
| Property Value | Without Mortgage | With Mortgage |
| Less than $50,000 | 17 (70.8%) | 1 (25.0%) |
| $50,000 to $99,999 | 5 (20.8%) | 0 (0.0%) |
| $100,000 to $299,999 | 0 (0.0%) | 1 (25.0%) |
| $300,000 to $499,999 | 0 (0.0%) | 0 (0.0%) |
| $500,000 to $749,999 | 2 (8.3%) | 0 (0.0%) |
| $750,000 to $999,999 | 0 (0.0%) | 0 (0.0%) |
| $1,000,000 or more | 0 (0.0%) | 2 (50.0%) |
| Total | 24 (100.0%) | 4 (100.0%) |
Household Income by Mortgage Status in Opal
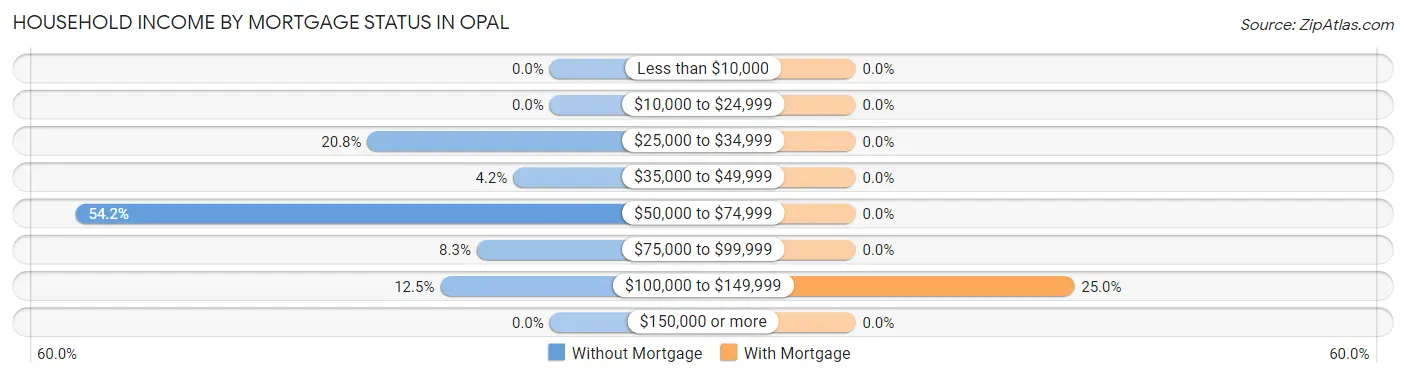
| Household Income | Without Mortgage | With Mortgage |
| Less than $10,000 | 0 (0.0%) | 0 (0.0%) |
| $10,000 to $24,999 | 0 (0.0%) | 0 (0.0%) |
| $25,000 to $34,999 | 5 (20.8%) | 0 (0.0%) |
| $35,000 to $49,999 | 1 (4.2%) | 0 (0.0%) |
| $50,000 to $74,999 | 13 (54.2%) | 0 (0.0%) |
| $75,000 to $99,999 | 2 (8.3%) | 0 (0.0%) |
| $100,000 to $149,999 | 3 (12.5%) | 1 (25.0%) |
| $150,000 or more | 0 (0.0%) | 0 (0.0%) |
| Total | 24 (100.0%) | 4 (100.0%) |
Property Value to Household Income Ratio in Opal
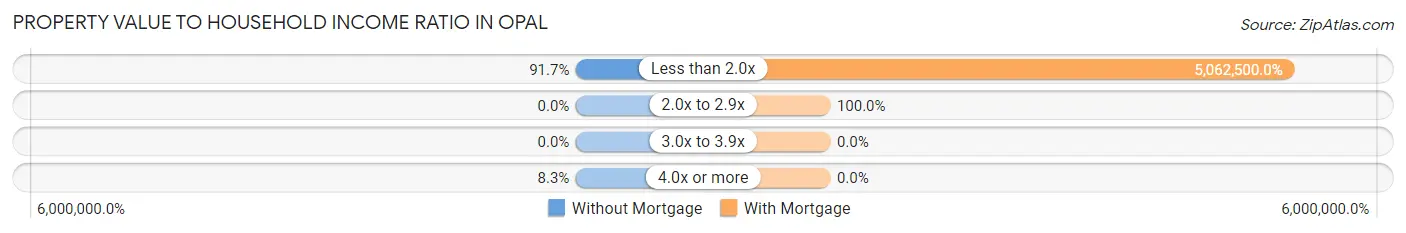
| Value-to-Income Ratio | Without Mortgage | With Mortgage |
| Less than 2.0x | 22 (91.7%) | 202,500 (5,062,500.0%) |
| 2.0x to 2.9x | 0 (0.0%) | 4 (100.0%) |
| 3.0x to 3.9x | 0 (0.0%) | 0 (0.0%) |
| 4.0x or more | 2 (8.3%) | 0 (0.0%) |
| Total | 24 (100.0%) | 4 (100.0%) |
Real Estate Taxes by Mortgage Status in Opal
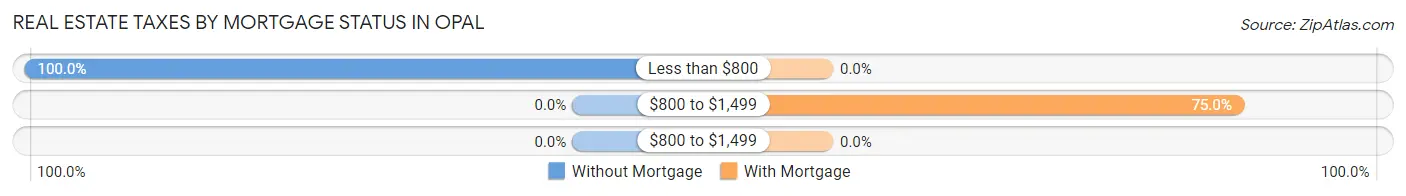
| Property Taxes | Without Mortgage | With Mortgage |
| Less than $800 | 24 (100.0%) | 0 (0.0%) |
| $800 to $1,499 | 0 (0.0%) | 3 (75.0%) |
| $800 to $1,499 | 0 (0.0%) | 0 (0.0%) |
| Total | 24 (100.0%) | 4 (100.0%) |
Health & Disability in Opal
Health Insurance Coverage by Age in Opal
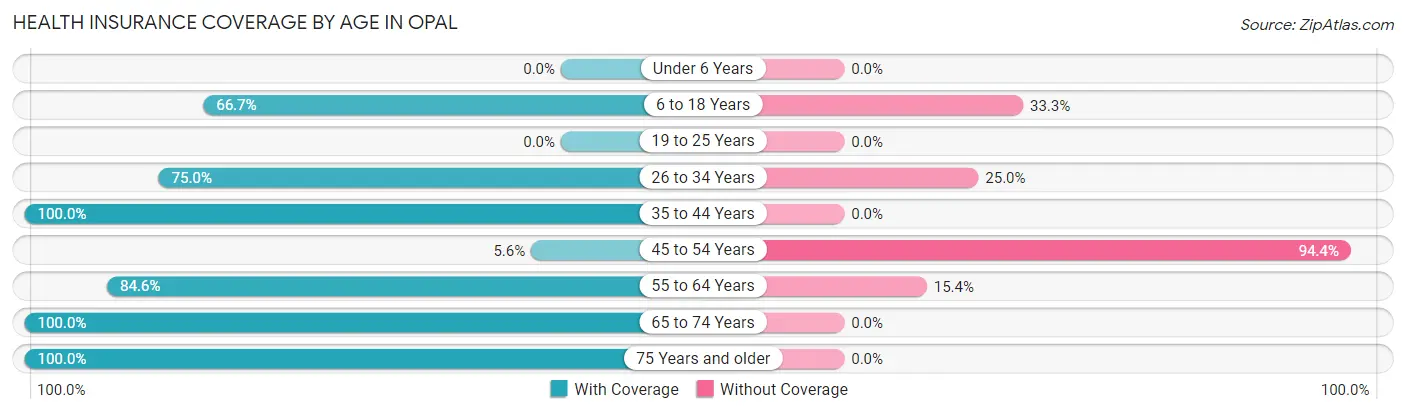
| Age Bracket | With Coverage | Without Coverage |
| Under 6 Years | 0 (0.0%) | 0 (0.0%) |
| 6 to 18 Years | 2 (66.7%) | 1 (33.3%) |
| 19 to 25 Years | 0 (0.0%) | 0 (0.0%) |
| 26 to 34 Years | 3 (75.0%) | 1 (25.0%) |
| 35 to 44 Years | 3 (100.0%) | 0 (0.0%) |
| 45 to 54 Years | 1 (5.6%) | 17 (94.4%) |
| 55 to 64 Years | 22 (84.6%) | 4 (15.4%) |
| 65 to 74 Years | 19 (100.0%) | 0 (0.0%) |
| 75 Years and older | 1 (100.0%) | 0 (0.0%) |
| Total | 51 (68.9%) | 23 (31.1%) |
Health Insurance Coverage by Citizenship Status in Opal
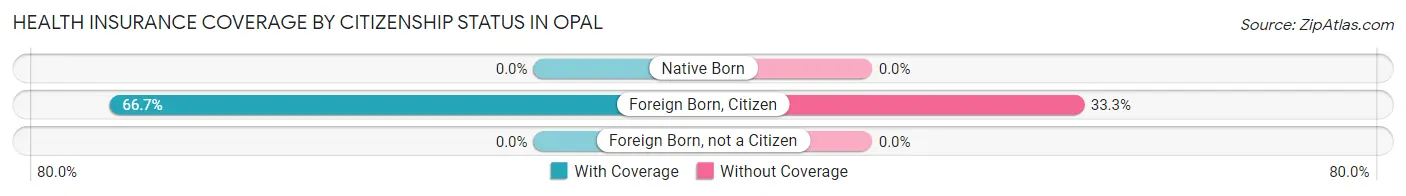
| Citizenship Status | With Coverage | Without Coverage |
| Native Born | 0 (0.0%) | 0 (0.0%) |
| Foreign Born, Citizen | 2 (66.7%) | 1 (33.3%) |
| Foreign Born, not a Citizen | 0 (0.0%) | 0 (0.0%) |
Health Insurance Coverage by Household Income in Opal
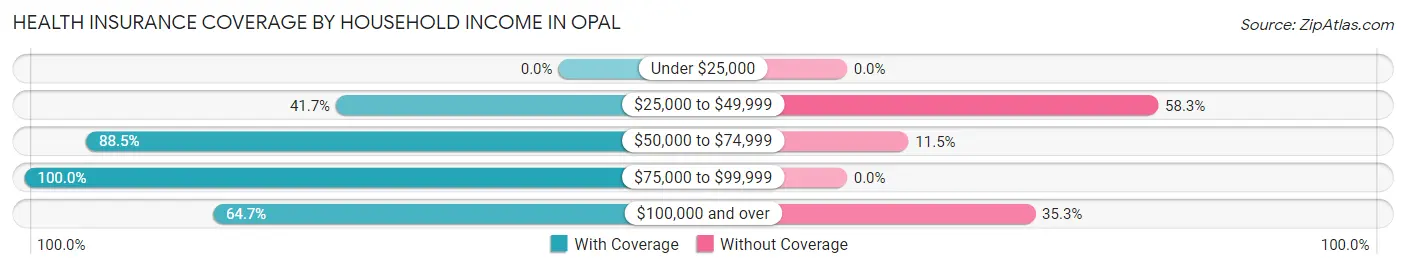
| Household Income | With Coverage | Without Coverage |
| Under $25,000 | 0 (0.0%) | 0 (0.0%) |
| $25,000 to $49,999 | 10 (41.7%) | 14 (58.3%) |
| $50,000 to $74,999 | 23 (88.5%) | 3 (11.5%) |
| $75,000 to $99,999 | 7 (100.0%) | 0 (0.0%) |
| $100,000 and over | 11 (64.7%) | 6 (35.3%) |
Public vs Private Health Insurance Coverage by Age in Opal
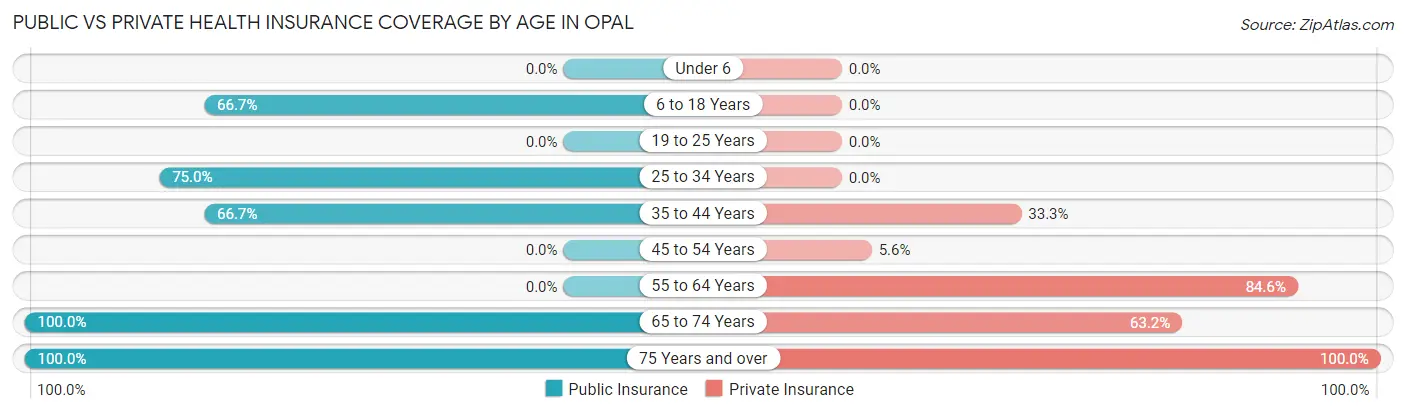
| Age Bracket | Public Insurance | Private Insurance |
| Under 6 | 0 (0.0%) | 0 (0.0%) |
| 6 to 18 Years | 2 (66.7%) | 0 (0.0%) |
| 19 to 25 Years | 0 (0.0%) | 0 (0.0%) |
| 25 to 34 Years | 3 (75.0%) | 0 (0.0%) |
| 35 to 44 Years | 2 (66.7%) | 1 (33.3%) |
| 45 to 54 Years | 0 (0.0%) | 1 (5.6%) |
| 55 to 64 Years | 0 (0.0%) | 22 (84.6%) |
| 65 to 74 Years | 19 (100.0%) | 12 (63.2%) |
| 75 Years and over | 1 (100.0%) | 1 (100.0%) |
| Total | 27 (36.5%) | 37 (50.0%) |
Disability Status by Sex by Age in Opal
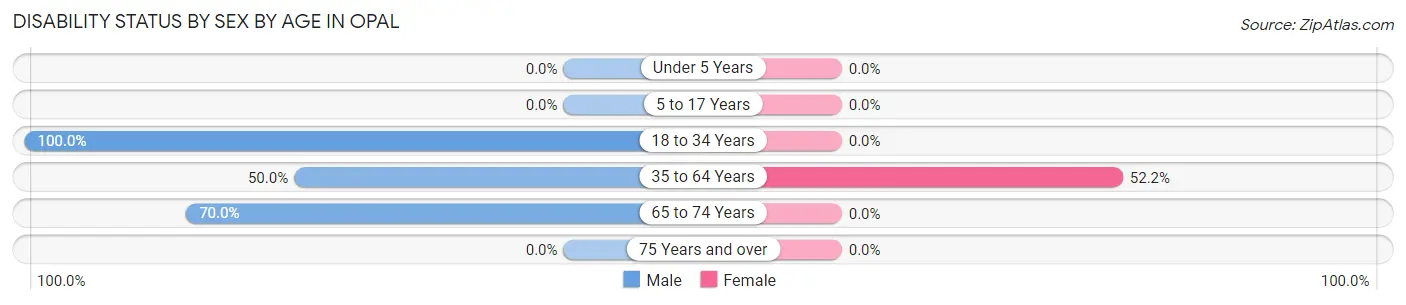
| Age Bracket | Male | Female |
| Under 5 Years | 0 (0.0%) | 0 (0.0%) |
| 5 to 17 Years | 0 (0.0%) | 0 (0.0%) |
| 18 to 34 Years | 3 (100.0%) | 0 (0.0%) |
| 35 to 64 Years | 12 (50.0%) | 12 (52.2%) |
| 65 to 74 Years | 7 (70.0%) | 0 (0.0%) |
| 75 Years and over | 0 (0.0%) | 0 (0.0%) |
Disability Class by Sex by Age in Opal
Disability Class: Hearing Difficulty
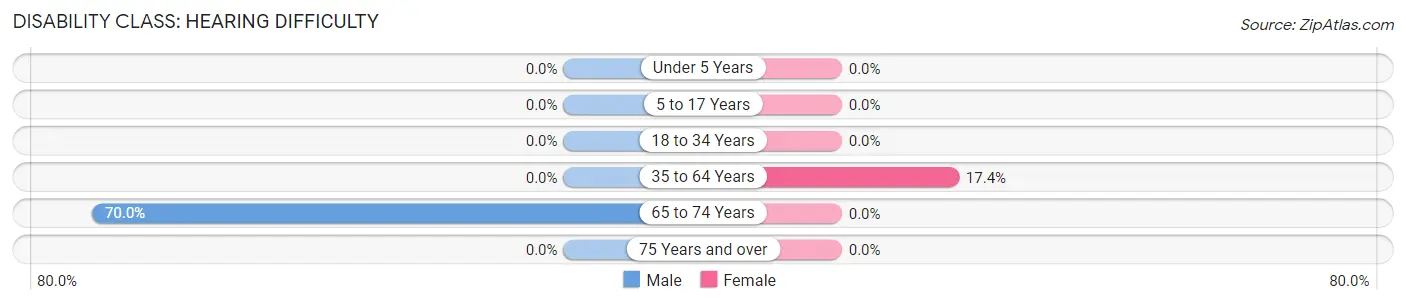
| Age Bracket | Male | Female |
| Under 5 Years | 0 (0.0%) | 0 (0.0%) |
| 5 to 17 Years | 0 (0.0%) | 0 (0.0%) |
| 18 to 34 Years | 0 (0.0%) | 0 (0.0%) |
| 35 to 64 Years | 0 (0.0%) | 4 (17.4%) |
| 65 to 74 Years | 7 (70.0%) | 0 (0.0%) |
| 75 Years and over | 0 (0.0%) | 0 (0.0%) |
Disability Class: Vision Difficulty
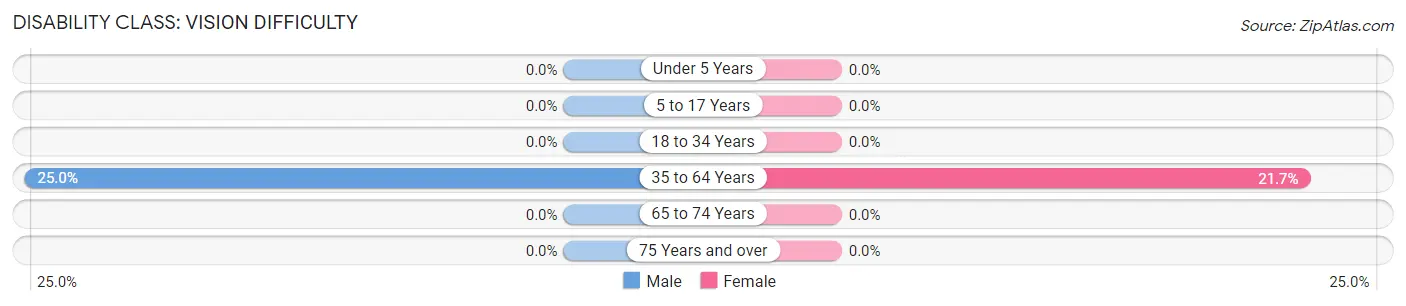
| Age Bracket | Male | Female |
| Under 5 Years | 0 (0.0%) | 0 (0.0%) |
| 5 to 17 Years | 0 (0.0%) | 0 (0.0%) |
| 18 to 34 Years | 0 (0.0%) | 0 (0.0%) |
| 35 to 64 Years | 6 (25.0%) | 5 (21.7%) |
| 65 to 74 Years | 0 (0.0%) | 0 (0.0%) |
| 75 Years and over | 0 (0.0%) | 0 (0.0%) |
Disability Class: Cognitive Difficulty
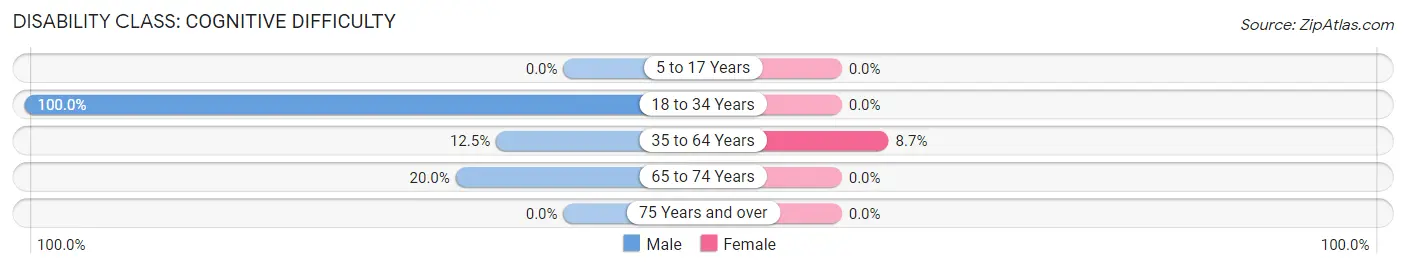
| Age Bracket | Male | Female |
| 5 to 17 Years | 0 (0.0%) | 0 (0.0%) |
| 18 to 34 Years | 3 (100.0%) | 0 (0.0%) |
| 35 to 64 Years | 3 (12.5%) | 2 (8.7%) |
| 65 to 74 Years | 2 (20.0%) | 0 (0.0%) |
| 75 Years and over | 0 (0.0%) | 0 (0.0%) |
Disability Class: Ambulatory Difficulty
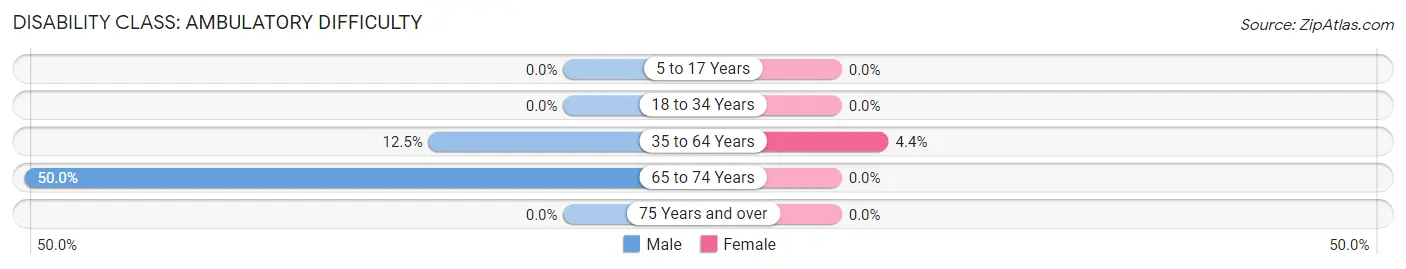
| Age Bracket | Male | Female |
| 5 to 17 Years | 0 (0.0%) | 0 (0.0%) |
| 18 to 34 Years | 0 (0.0%) | 0 (0.0%) |
| 35 to 64 Years | 3 (12.5%) | 1 (4.3%) |
| 65 to 74 Years | 5 (50.0%) | 0 (0.0%) |
| 75 Years and over | 0 (0.0%) | 0 (0.0%) |
Disability Class: Self-Care Difficulty
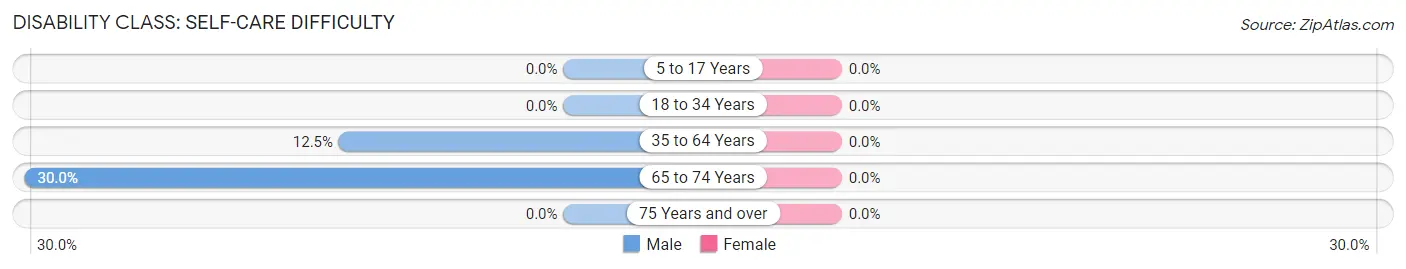
| Age Bracket | Male | Female |
| 5 to 17 Years | 0 (0.0%) | 0 (0.0%) |
| 18 to 34 Years | 0 (0.0%) | 0 (0.0%) |
| 35 to 64 Years | 3 (12.5%) | 0 (0.0%) |
| 65 to 74 Years | 3 (30.0%) | 0 (0.0%) |
| 75 Years and over | 0 (0.0%) | 0 (0.0%) |
Technology Access in Opal
Computing Device Access in Opal
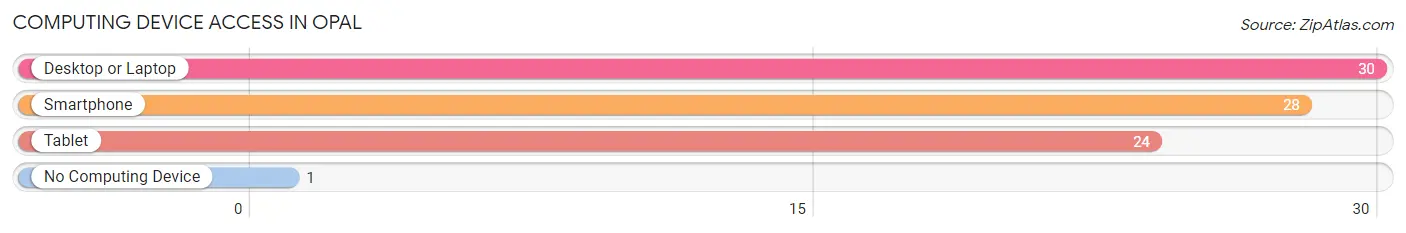
| Device Type | # Households | % Households |
| Desktop or Laptop | 30 | 96.8% |
| Smartphone | 28 | 90.3% |
| Tablet | 24 | 77.4% |
| No Computing Device | 1 | 3.2% |
| Total | 31 | 100.0% |
Internet Access in Opal
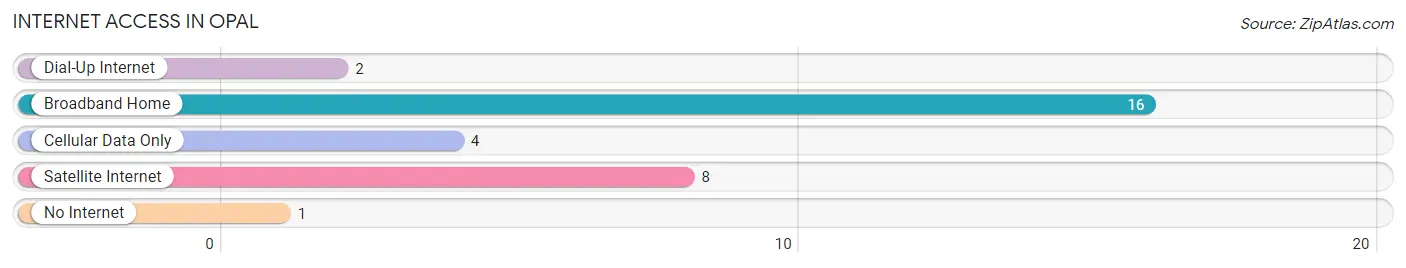
| Internet Type | # Households | % Households |
| Dial-Up Internet | 2 | 6.5% |
| Broadband Home | 16 | 51.6% |
| Cellular Data Only | 4 | 12.9% |
| Satellite Internet | 8 | 25.8% |
| No Internet | 1 | 3.2% |
| Total | 31 | 100.0% |
Opal Summary
Opal, Wyoming is a small town located in the southwestern corner of the state, near the Utah border. It is part of Sweetwater County and is situated in the high desert of the Great Divide Basin. The town was founded in 1892 and was named after the opal gemstone, which was discovered in the area.
Geography
Opal is located in the high desert of the Great Divide Basin, at an elevation of 5,845 feet. The town is situated on the banks of the Green River, which is the largest tributary of the Colorado River. The area is characterized by rolling hills, sagebrush, and juniper trees. The climate is semi-arid, with hot summers and cold winters.
Economy
The economy of Opal is largely based on agriculture and ranching. The town is home to several large ranches, which raise cattle and sheep. The area is also known for its production of hay, alfalfa, and other crops. In addition, the town is home to several small businesses, including a grocery store, a hardware store, and a gas station.
Demographics
As of the 2010 census, the population of Opal was 545. The racial makeup of the town was 95.2% White, 0.2% African American, 0.7% Native American, 0.2% Asian, 0.2% Pacific Islander, and 3.7% from other races. The median household income was $37,500, and the median age was 37.
History
Opal was founded in 1892 by a group of settlers from Utah. The town was named after the opal gemstone, which was discovered in the area. The town quickly grew, and by the early 1900s, it had become a bustling center of commerce. The town was home to several businesses, including a hotel, a bank, and a general store.
In the early 1900s, the town was also home to a large number of sheep and cattle ranches. The town was also home to several coal mines, which provided employment for many of the town’s residents.
In the 1950s, the town began to decline as the coal mines closed and the population began to move away. The town’s population has remained relatively stable since then, and it continues to be a small, rural community.
Today, Opal is a quiet, rural town. It is home to several small businesses, including a grocery store, a hardware store, and a gas station. The town is also home to several large ranches, which raise cattle and sheep. The area is also known for its production of hay, alfalfa, and other crops.
Common Questions
What is Per Capita Income in Opal?
Per Capita income in Opal is $58,150.
What is the Median Family Income in Opal?
Median Family Income in Opal is $63,750.
What is the Median Household income in Opal?
Median Household Income in Opal is $67,917.
What is Inequality or Gini Index in Opal?
Inequality or Gini Index in Opal is 0.59.
What is the Total Population of Opal?
Total Population of Opal is 74.
What is the Total Male Population of Opal?
Total Male Population of Opal is 38.
What is the Total Female Population of Opal?
Total Female Population of Opal is 36.
What is the Ratio of Males per 100 Females in Opal?
There are 105.56 Males per 100 Females in Opal.
What is the Ratio of Females per 100 Males in Opal?
There are 94.74 Females per 100 Males in Opal.
What is the Median Population Age in Opal?
Median Population Age in Opal is 59.3 Years.
What is the Average Family Size in Opal
Average Family Size in Opal is 2.4 People.
What is the Average Household Size in Opal
Average Household Size in Opal is 2.4 People.
How Large is the Labor Force in Opal?
There are 41 People in the Labor Forcein in Opal.
What is the Percentage of People in the Labor Force in Opal?
57.7% of People are in the Labor Force in Opal.