Lusk, WY Map & Demographics
Lusk Map
Lusk Overview
$25,542
PER CAPITA INCOME
$81,250
AVG FAMILY INCOME
$46,797
AVG HOUSEHOLD INCOME
54.7%
WAGE / INCOME GAP [ % ]
45.3¢/ $1
WAGE / INCOME GAP [ $ ]
0.43
INEQUALITY / GINI INDEX
1,505
TOTAL POPULATION
582
MALE POPULATION
923
FEMALE POPULATION
63.06
MALES / 100 FEMALES
158.59
FEMALES / 100 MALES
43.8
MEDIAN AGE
2.7
AVG FAMILY SIZE
1.9
AVG HOUSEHOLD SIZE
669
LABOR FORCE [ PEOPLE ]
53.1%
PERCENT IN LABOR FORCE
9.3%
UNEMPLOYMENT RATE
Lusk Zip Codes
Lusk Area Codes
Income in Lusk
Income Overview in Lusk
Per Capita Income in Lusk is $25,542, while median incomes of families and households are $81,250 and $46,797 respectively.
| Characteristic | Number | Measure |
| Per Capita Income | 1,505 | $25,542 |
| Median Family Income | 313 | $81,250 |
| Mean Family Income | 313 | $76,970 |
| Median Household Income | 653 | $46,797 |
| Mean Household Income | 653 | $59,761 |
| Income Deficit | 313 | $0 |
| Wage / Income Gap (%) | 1,505 | 54.71% |
| Wage / Income Gap ($) | 1,505 | 45.29¢ per $1 |
| Gini / Inequality Index | 1,505 | 0.43 |
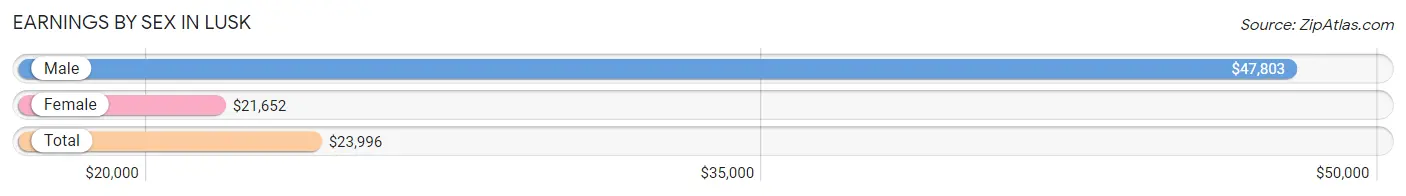
Earnings by Sex in Lusk
Average Earnings in Lusk are $23,996, $47,803 for men and $21,652 for women, a difference of 54.7%.
| Sex | Number | Average Earnings |
| Male | 328 (39.5%) | $47,803 |
| Female | 503 (60.5%) | $21,652 |
| Total | 831 (100.0%) | $23,996 |
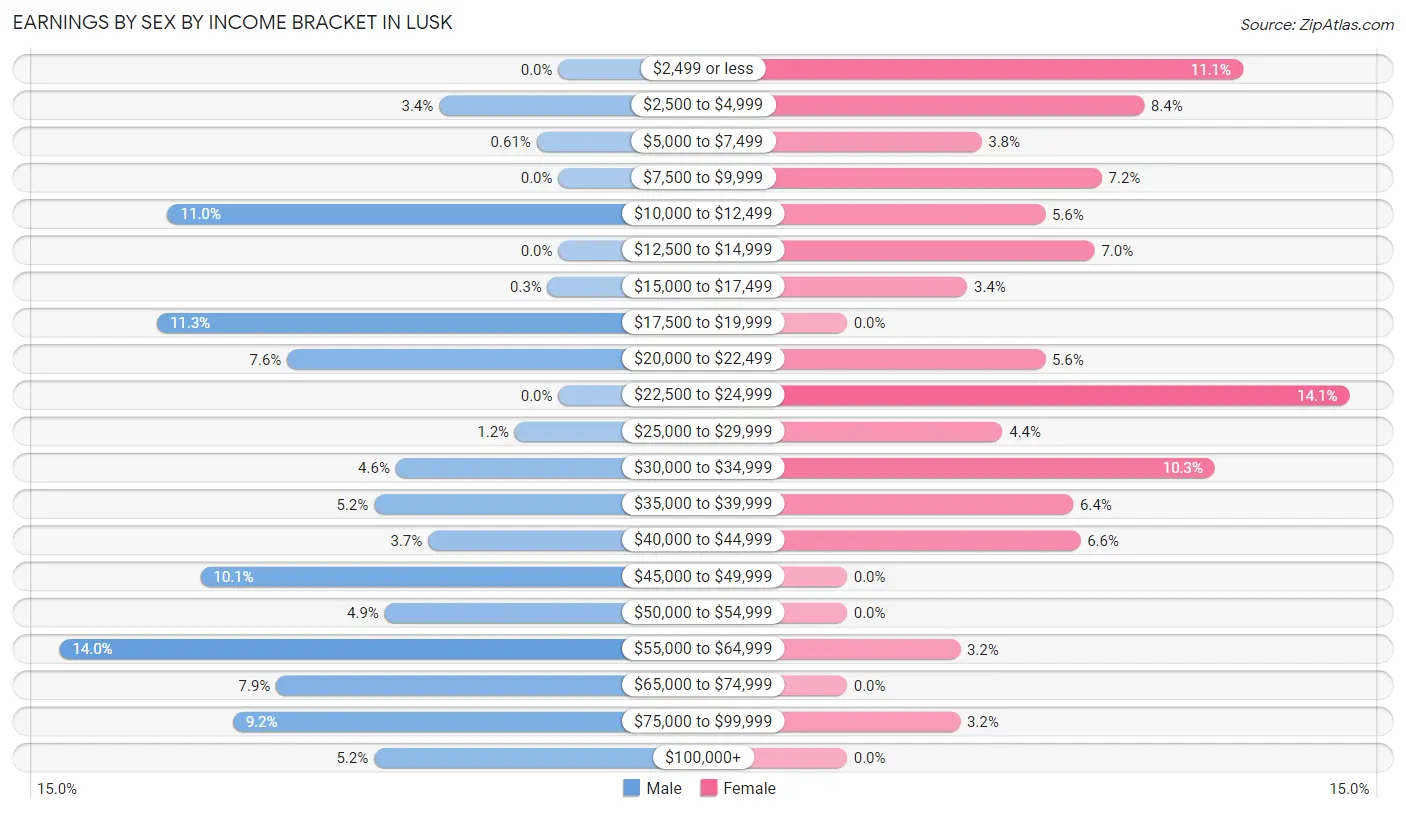
Earnings by Sex by Income Bracket in Lusk
The most common earnings brackets in Lusk are $55,000 to $64,999 for men (46 | 14.0%) and $22,500 to $24,999 for women (71 | 14.1%).
| Income | Male | Female |
| $2,499 or less | 0 (0.0%) | 56 (11.1%) |
| $2,500 to $4,999 | 11 (3.4%) | 42 (8.4%) |
| $5,000 to $7,499 | 2 (0.6%) | 19 (3.8%) |
| $7,500 to $9,999 | 0 (0.0%) | 36 (7.2%) |
| $10,000 to $12,499 | 36 (11.0%) | 28 (5.6%) |
| $12,500 to $14,999 | 0 (0.0%) | 35 (7.0%) |
| $15,000 to $17,499 | 1 (0.3%) | 17 (3.4%) |
| $17,500 to $19,999 | 37 (11.3%) | 0 (0.0%) |
| $20,000 to $22,499 | 25 (7.6%) | 28 (5.6%) |
| $22,500 to $24,999 | 0 (0.0%) | 71 (14.1%) |
| $25,000 to $29,999 | 4 (1.2%) | 22 (4.4%) |
| $30,000 to $34,999 | 15 (4.6%) | 52 (10.3%) |
| $35,000 to $39,999 | 17 (5.2%) | 32 (6.4%) |
| $40,000 to $44,999 | 12 (3.7%) | 33 (6.6%) |
| $45,000 to $49,999 | 33 (10.1%) | 0 (0.0%) |
| $50,000 to $54,999 | 16 (4.9%) | 0 (0.0%) |
| $55,000 to $64,999 | 46 (14.0%) | 16 (3.2%) |
| $65,000 to $74,999 | 26 (7.9%) | 0 (0.0%) |
| $75,000 to $99,999 | 30 (9.1%) | 16 (3.2%) |
| $100,000+ | 17 (5.2%) | 0 (0.0%) |
| Total | 328 (100.0%) | 503 (100.0%) |
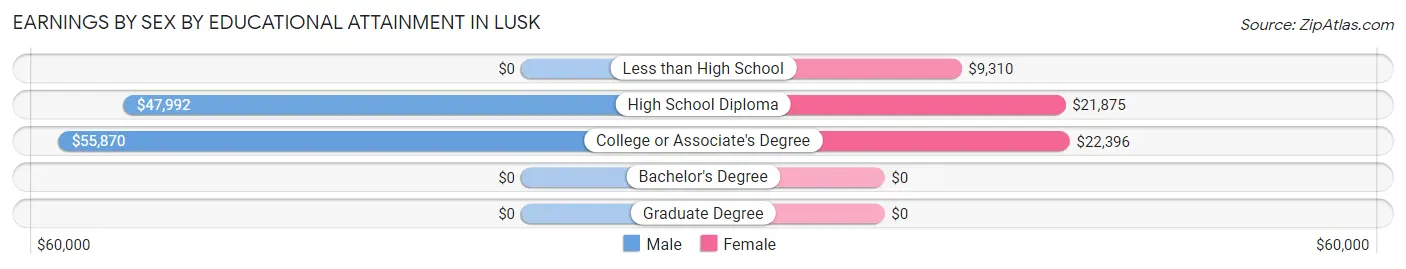
Earnings by Sex by Educational Attainment in Lusk
Average earnings in Lusk are $47,803 for men and $20,268 for women, a difference of 57.6%. Men with an educational attainment of college or associate's degree enjoy the highest average annual earnings of $55,870, while those with high school diploma education earn the least with $47,992. Women with an educational attainment of college or associate's degree earn the most with the average annual earnings of $22,396, while those with less than high school education have the smallest earnings of $9,310.
| Educational Attainment | Male Income | Female Income |
| Less than High School | - | - |
| High School Diploma | $47,992 | $21,875 |
| College or Associate's Degree | $55,870 | $22,396 |
| Bachelor's Degree | - | - |
| Graduate Degree | - | - |
| Total | $47,803 | $20,268 |
Family Income in Lusk
Family Income Brackets in Lusk
According to the Lusk family income data, there are 100 families falling into the $100,000 to $149,999 income range, which is the most common income bracket and makes up 32.0% of all families. Conversely, the $200,000+ income bracket is the least frequent group with only 4 families (1.3%) belonging to this category.
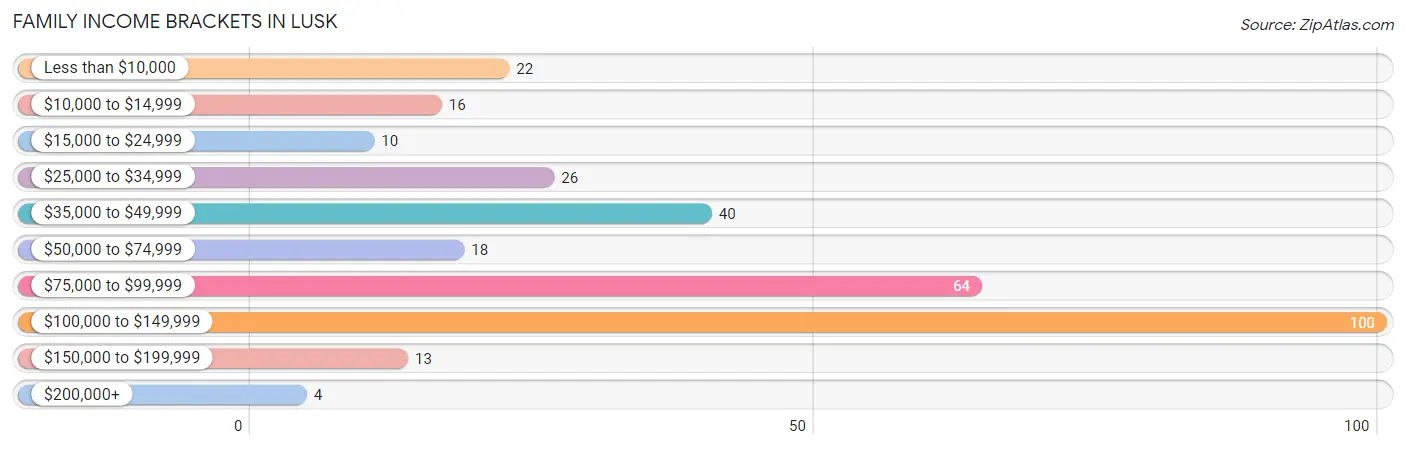
| Income Bracket | # Families | % Families |
| Less than $10,000 | 22 | 7.0% |
| $10,000 to $14,999 | 16 | 5.1% |
| $15,000 to $24,999 | 10 | 3.2% |
| $25,000 to $34,999 | 26 | 8.3% |
| $35,000 to $49,999 | 40 | 12.8% |
| $50,000 to $74,999 | 18 | 5.8% |
| $75,000 to $99,999 | 64 | 20.4% |
| $100,000 to $149,999 | 100 | 31.9% |
| $150,000 to $199,999 | 13 | 4.2% |
| $200,000+ | 4 | 1.3% |
Family Income by Famaliy Size in Lusk
5-person families (59 | 18.9%) account for the highest median family income in Lusk with $103,397 per family, while 2-person families (174 | 55.6%) have the highest median income of $36,875 per family member.
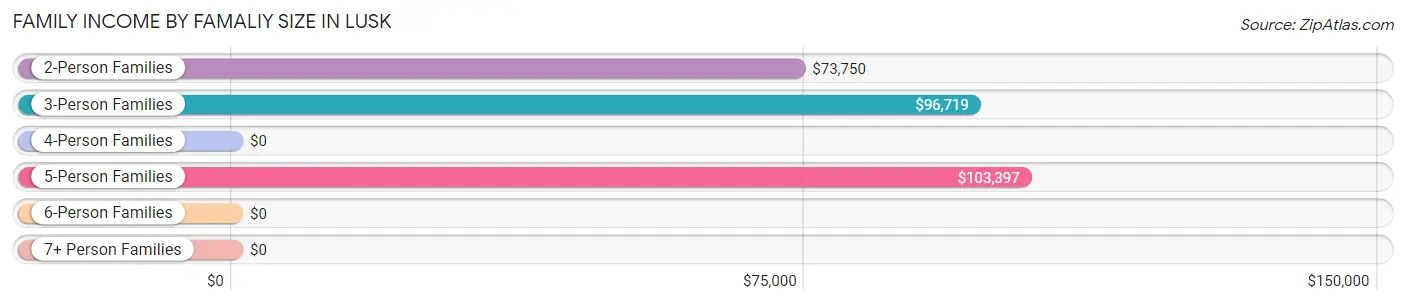
| Income Bracket | # Families | Median Income |
| 2-Person Families | 174 (55.6%) | $73,750 |
| 3-Person Families | 30 (9.6%) | $96,719 |
| 4-Person Families | 27 (8.6%) | $0 |
| 5-Person Families | 59 (18.9%) | $103,397 |
| 6-Person Families | 23 (7.3%) | $0 |
| 7+ Person Families | 0 (0.0%) | $0 |
| Total | 313 (100.0%) | $81,250 |
Family Income by Number of Earners in Lusk
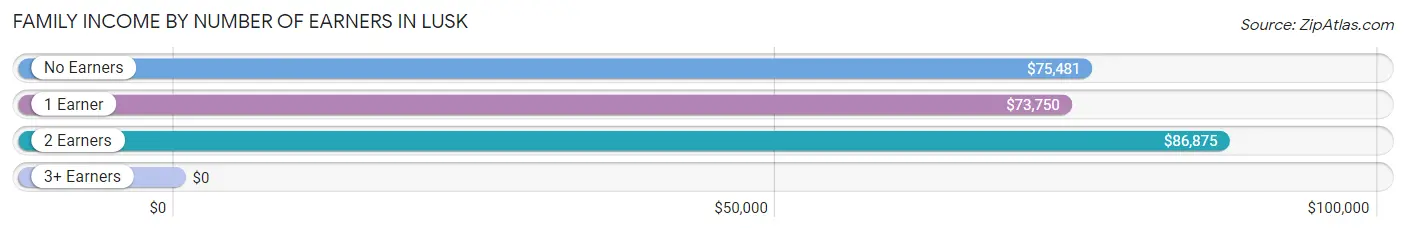
| Number of Earners | # Families | Median Income |
| No Earners | 39 (12.5%) | $75,481 |
| 1 Earner | 126 (40.3%) | $73,750 |
| 2 Earners | 143 (45.7%) | $86,875 |
| 3+ Earners | 5 (1.6%) | $0 |
| Total | 313 (100.0%) | $81,250 |
Household Income in Lusk
Household Income Brackets in Lusk
With 151 households falling in the category, the $15,000 to $24,999 income range is the most frequent in Lusk, accounting for 23.1% of all households. In contrast, only 10 households (1.5%) fall into the $200,000+ income bracket, making it the least populous group.
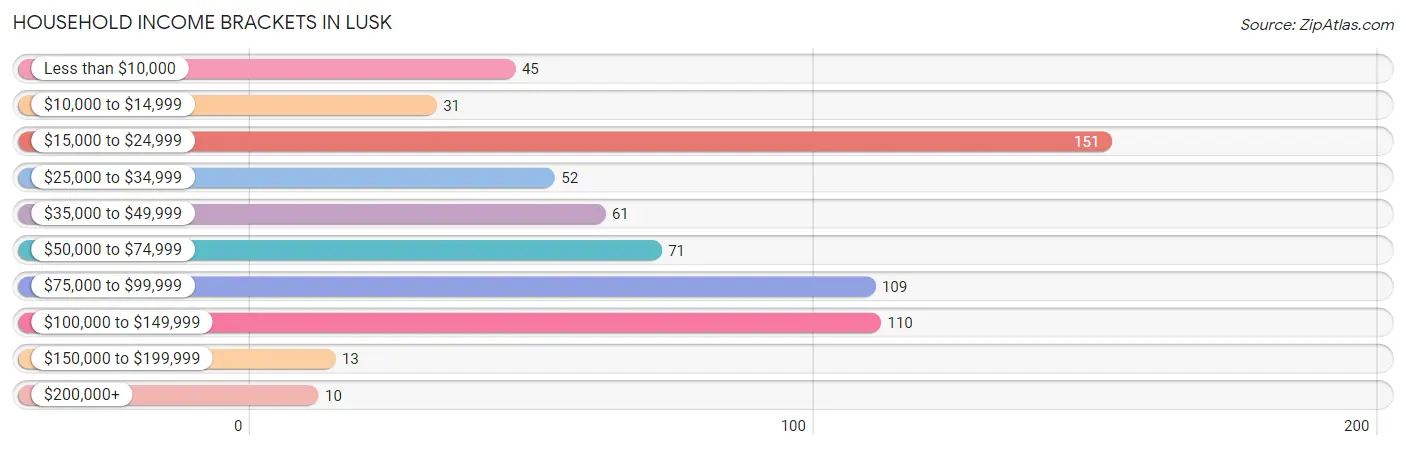
| Income Bracket | # Households | % Households |
| Less than $10,000 | 45 | 6.9% |
| $10,000 to $14,999 | 31 | 4.7% |
| $15,000 to $24,999 | 151 | 23.1% |
| $25,000 to $34,999 | 52 | 8.0% |
| $35,000 to $49,999 | 61 | 9.3% |
| $50,000 to $74,999 | 71 | 10.9% |
| $75,000 to $99,999 | 109 | 16.7% |
| $100,000 to $149,999 | 110 | 16.8% |
| $150,000 to $199,999 | 13 | 2.0% |
| $200,000+ | 10 | 1.5% |
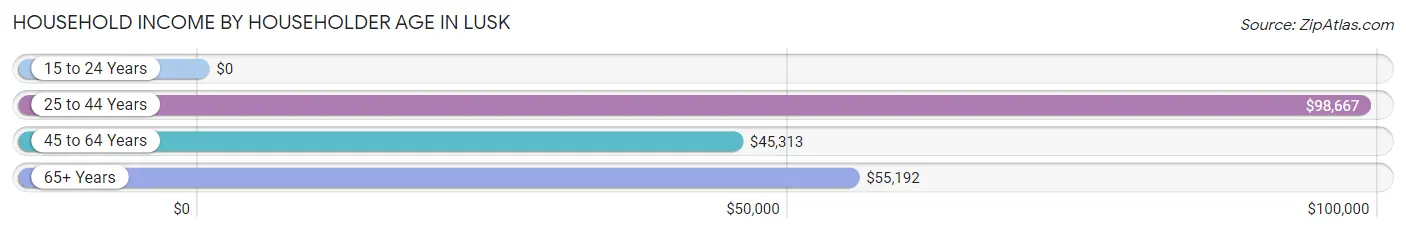
Household Income by Householder Age in Lusk
The median household income in Lusk is $46,797, with the highest median household income of $98,667 found in the 25 to 44 years age bracket for the primary householder. A total of 118 households (18.1%) fall into this category. Meanwhile, the 15 to 24 years age bracket for the primary householder has the lowest median household income of $0, with 67 households (10.3%) in this group.
| Income Bracket | # Households | Median Income |
| 15 to 24 Years | 67 (10.3%) | $0 |
| 25 to 44 Years | 118 (18.1%) | $98,667 |
| 45 to 64 Years | 234 (35.8%) | $45,313 |
| 65+ Years | 234 (35.8%) | $55,192 |
| Total | 653 (100.0%) | $46,797 |
Poverty in Lusk
Income Below Poverty by Sex and Age in Lusk
With 19.7% poverty level for males and 28.0% for females among the residents of Lusk, 15 year old males and 5 year old females are the most vulnerable to poverty, with 7 males (100.0%) and 14 females (100.0%) in their respective age groups living below the poverty level.
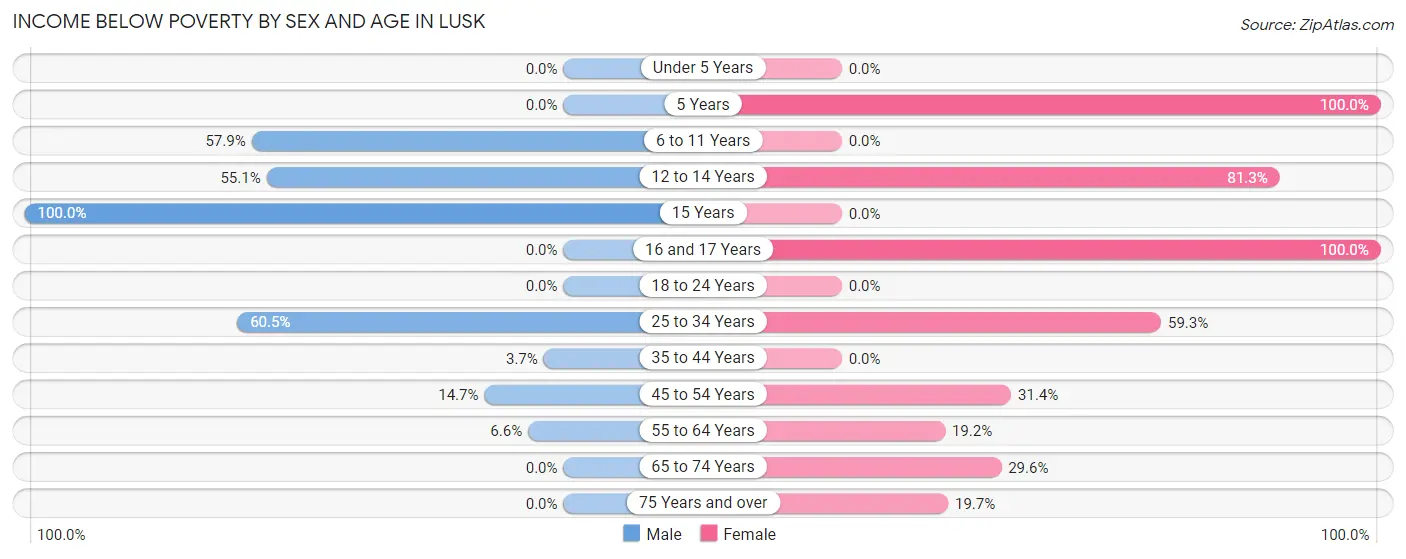
| Age Bracket | Male | Female |
| Under 5 Years | 0 (0.0%) | 0 (0.0%) |
| 5 Years | 0 (0.0%) | 14 (100.0%) |
| 6 to 11 Years | 33 (57.9%) | 0 (0.0%) |
| 12 to 14 Years | 27 (55.1%) | 26 (81.2%) |
| 15 Years | 7 (100.0%) | 0 (0.0%) |
| 16 and 17 Years | 0 (0.0%) | 32 (100.0%) |
| 18 to 24 Years | 0 (0.0%) | 0 (0.0%) |
| 25 to 34 Years | 23 (60.5%) | 32 (59.3%) |
| 35 to 44 Years | 3 (3.7%) | 0 (0.0%) |
| 45 to 54 Years | 16 (14.7%) | 22 (31.4%) |
| 55 to 64 Years | 4 (6.6%) | 27 (19.2%) |
| 65 to 74 Years | 0 (0.0%) | 29 (29.6%) |
| 75 Years and over | 0 (0.0%) | 14 (19.7%) |
| Total | 113 (19.7%) | 196 (28.0%) |
Income Above Poverty by Sex and Age in Lusk
According to the poverty statistics in Lusk, males aged under 5 years and females aged under 5 years are the age groups that are most secure financially, with 100.0% of males and 100.0% of females in these age groups living above the poverty line.
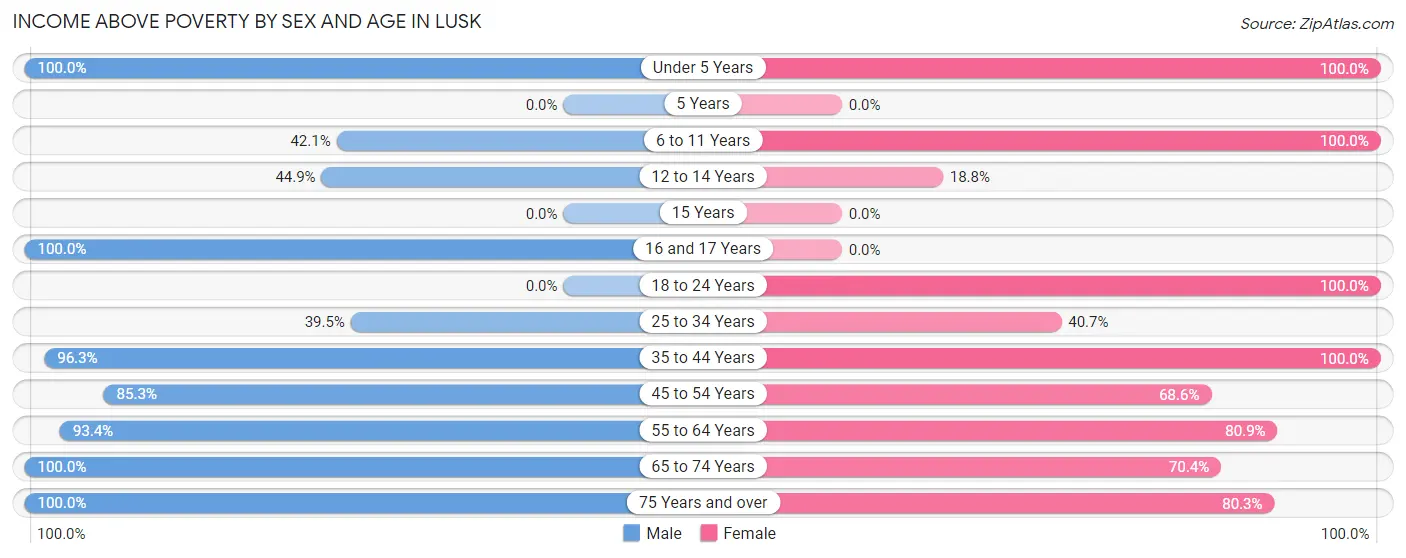
| Age Bracket | Male | Female |
| Under 5 Years | 14 (100.0%) | 13 (100.0%) |
| 5 Years | 0 (0.0%) | 0 (0.0%) |
| 6 to 11 Years | 24 (42.1%) | 59 (100.0%) |
| 12 to 14 Years | 22 (44.9%) | 6 (18.8%) |
| 15 Years | 0 (0.0%) | 0 (0.0%) |
| 16 and 17 Years | 23 (100.0%) | 0 (0.0%) |
| 18 to 24 Years | 0 (0.0%) | 76 (100.0%) |
| 25 to 34 Years | 15 (39.5%) | 22 (40.7%) |
| 35 to 44 Years | 79 (96.3%) | 41 (100.0%) |
| 45 to 54 Years | 93 (85.3%) | 48 (68.6%) |
| 55 to 64 Years | 57 (93.4%) | 114 (80.8%) |
| 65 to 74 Years | 94 (100.0%) | 69 (70.4%) |
| 75 Years and over | 40 (100.0%) | 57 (80.3%) |
| Total | 461 (80.3%) | 505 (72.0%) |
Income Below Poverty Among Married-Couple Families in Lusk
The poverty statistics for married-couple families in Lusk show that 11.1% or 26 of the total 235 families live below the poverty line. Families with 3 or 4 children have the highest poverty rate of 36.1%, comprising of 26 families. On the other hand, families with no children have the lowest poverty rate of 0.0%, which includes 0 families.
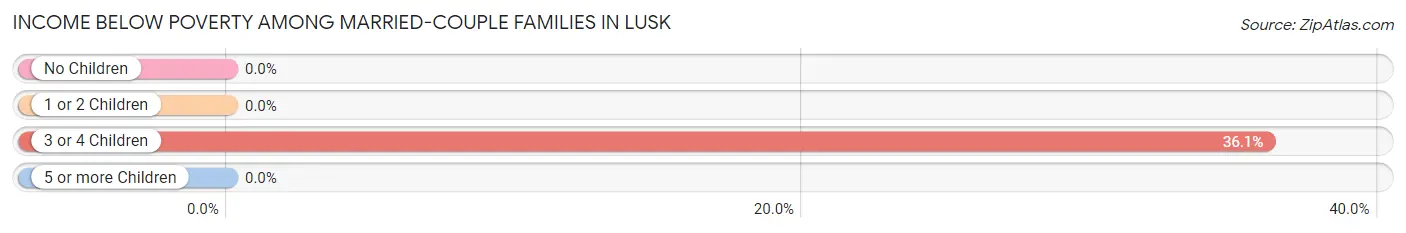
| Children | Above Poverty | Below Poverty |
| No Children | 141 (100.0%) | 0 (0.0%) |
| 1 or 2 Children | 22 (100.0%) | 0 (0.0%) |
| 3 or 4 Children | 46 (63.9%) | 26 (36.1%) |
| 5 or more Children | 0 (0.0%) | 0 (0.0%) |
| Total | 209 (88.9%) | 26 (11.1%) |
Income Below Poverty Among Single-Parent Households in Lusk
According to the poverty data in Lusk, 80.0% or 20 single-father households and 41.5% or 22 single-mother households are living below the poverty line. Among single-father households, those with 1 or 2 children have the highest poverty rate, with 20 households (100.0%) experiencing poverty. Likewise, among single-mother households, those with 1 or 2 children have the highest poverty rate, with 22 households (57.9%) falling below the poverty line.
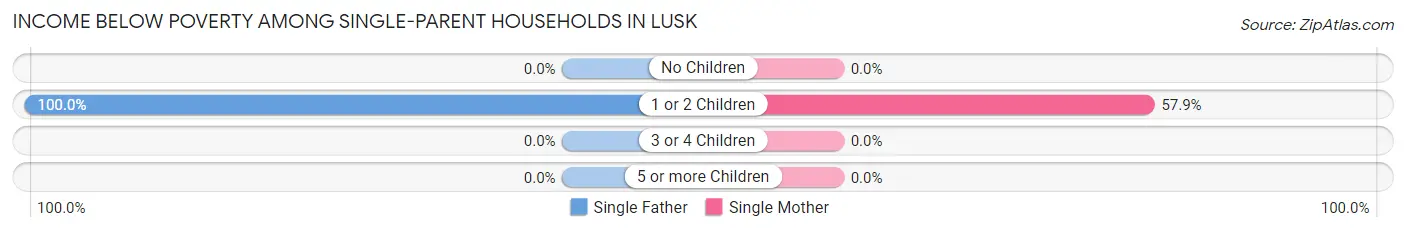
| Children | Single Father | Single Mother |
| No Children | 0 (0.0%) | 0 (0.0%) |
| 1 or 2 Children | 20 (100.0%) | 22 (57.9%) |
| 3 or 4 Children | 0 (0.0%) | 0 (0.0%) |
| 5 or more Children | 0 (0.0%) | 0 (0.0%) |
| Total | 20 (80.0%) | 22 (41.5%) |
Income Below Poverty Among Married-Couple vs Single-Parent Households in Lusk
The poverty data for Lusk shows that 26 of the married-couple family households (11.1%) and 42 of the single-parent households (53.8%) are living below the poverty level. Within the married-couple family households, those with 3 or 4 children have the highest poverty rate, with 26 households (36.1%) falling below the poverty line. Among the single-parent households, those with 1 or 2 children have the highest poverty rate, with 42 household (72.4%) living below poverty.
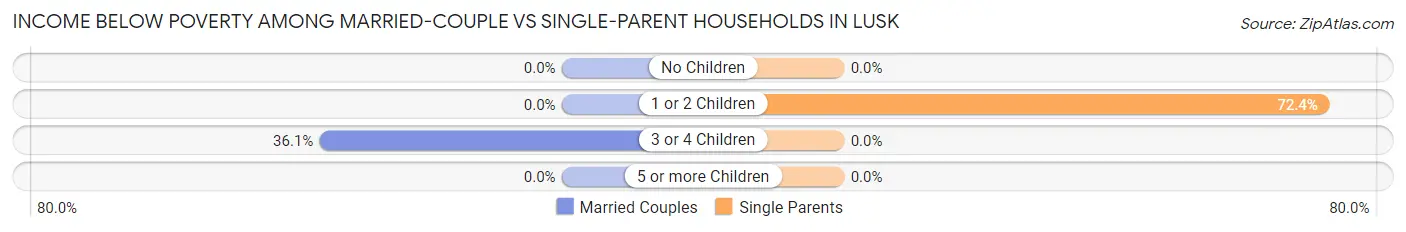
| Children | Married-Couple Families | Single-Parent Households |
| No Children | 0 (0.0%) | 0 (0.0%) |
| 1 or 2 Children | 0 (0.0%) | 42 (72.4%) |
| 3 or 4 Children | 26 (36.1%) | 0 (0.0%) |
| 5 or more Children | 0 (0.0%) | 0 (0.0%) |
| Total | 26 (11.1%) | 42 (53.8%) |
Race in Lusk
The most populous races in Lusk are White / Caucasian (1,365 | 90.7%), Hispanic or Latino (121 | 8.0%), and Native / Alaskan (65 | 4.3%).
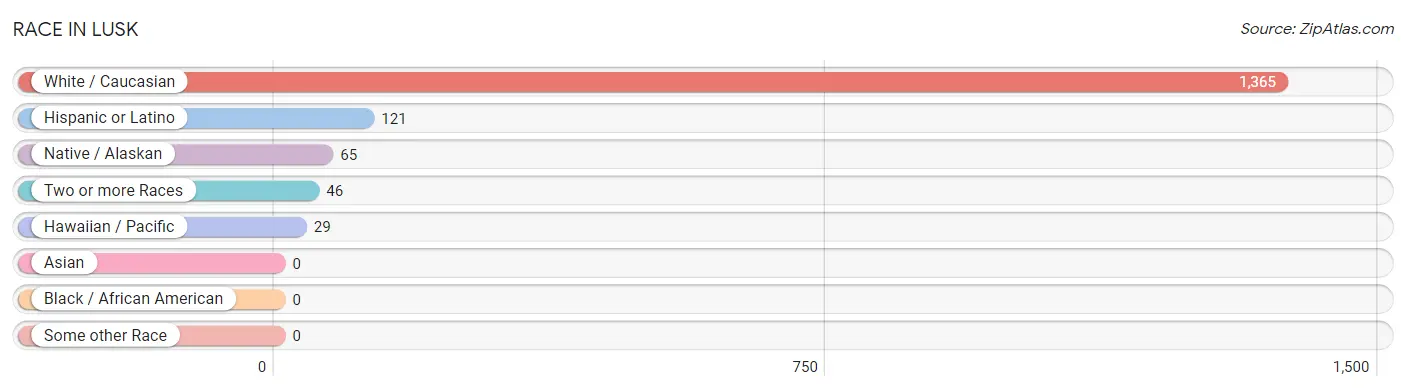
| Race | # Population | % Population |
| Asian | 0 | 0.0% |
| Black / African American | 0 | 0.0% |
| Hawaiian / Pacific | 29 | 1.9% |
| Hispanic or Latino | 121 | 8.0% |
| Native / Alaskan | 65 | 4.3% |
| White / Caucasian | 1,365 | 90.7% |
| Two or more Races | 46 | 3.1% |
| Some other Race | 0 | 0.0% |
| Total | 1,505 | 100.0% |
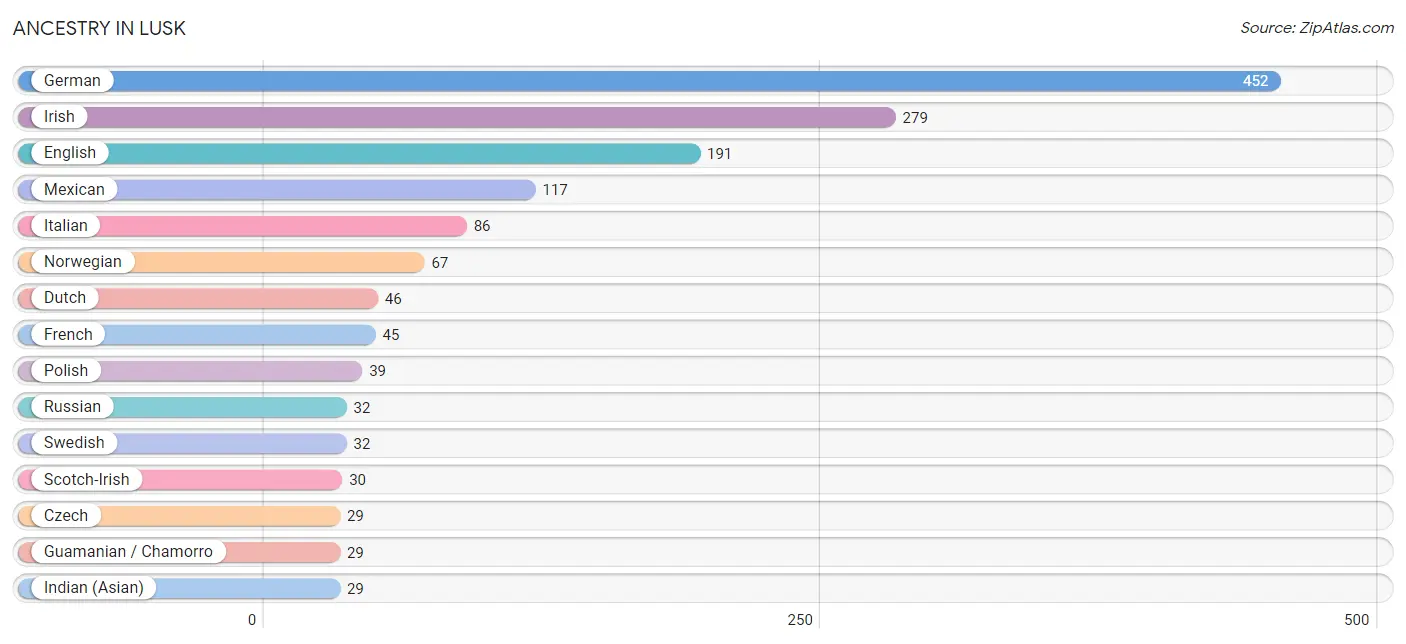
Ancestry in Lusk
The most populous ancestries reported in Lusk are German (452 | 30.0%), Irish (279 | 18.5%), English (191 | 12.7%), Mexican (117 | 7.8%), and Italian (86 | 5.7%), together accounting for 74.7% of all Lusk residents.
| Ancestry | # Population | % Population |
| American | 19 | 1.3% |
| Arapaho | 21 | 1.4% |
| Blackfeet | 4 | 0.3% |
| British | 28 | 1.9% |
| Celtic | 13 | 0.9% |
| Central American | 4 | 0.3% |
| Cherokee | 8 | 0.5% |
| Creek | 6 | 0.4% |
| Czech | 29 | 1.9% |
| Danish | 4 | 0.3% |
| Dutch | 46 | 3.1% |
| English | 191 | 12.7% |
| European | 3 | 0.2% |
| Finnish | 5 | 0.3% |
| French | 45 | 3.0% |
| German | 452 | 30.0% |
| Guamanian / Chamorro | 29 | 1.9% |
| Honduran | 4 | 0.3% |
| Indian (Asian) | 29 | 1.9% |
| Inupiat | 3 | 0.2% |
| Irish | 279 | 18.5% |
| Italian | 86 | 5.7% |
| Mexican | 117 | 7.8% |
| Northern European | 13 | 0.9% |
| Norwegian | 67 | 4.4% |
| Polish | 39 | 2.6% |
| Russian | 32 | 2.1% |
| Scotch-Irish | 30 | 2.0% |
| Scottish | 5 | 0.3% |
| Sioux | 8 | 0.5% |
| Swedish | 32 | 2.1% |
| Swiss | 14 | 0.9% |
| Welsh | 3 | 0.2% | View All 33 Rows |
Immigrants in Lusk

| Immigration Origin | # Population | % Population | View All 0 Rows |
Sex and Age in Lusk
Sex and Age in Lusk
The most populous age groups in Lusk are 40 to 44 Years (76 | 13.1%) for men and 60 to 64 Years (100 | 10.8%) for women.
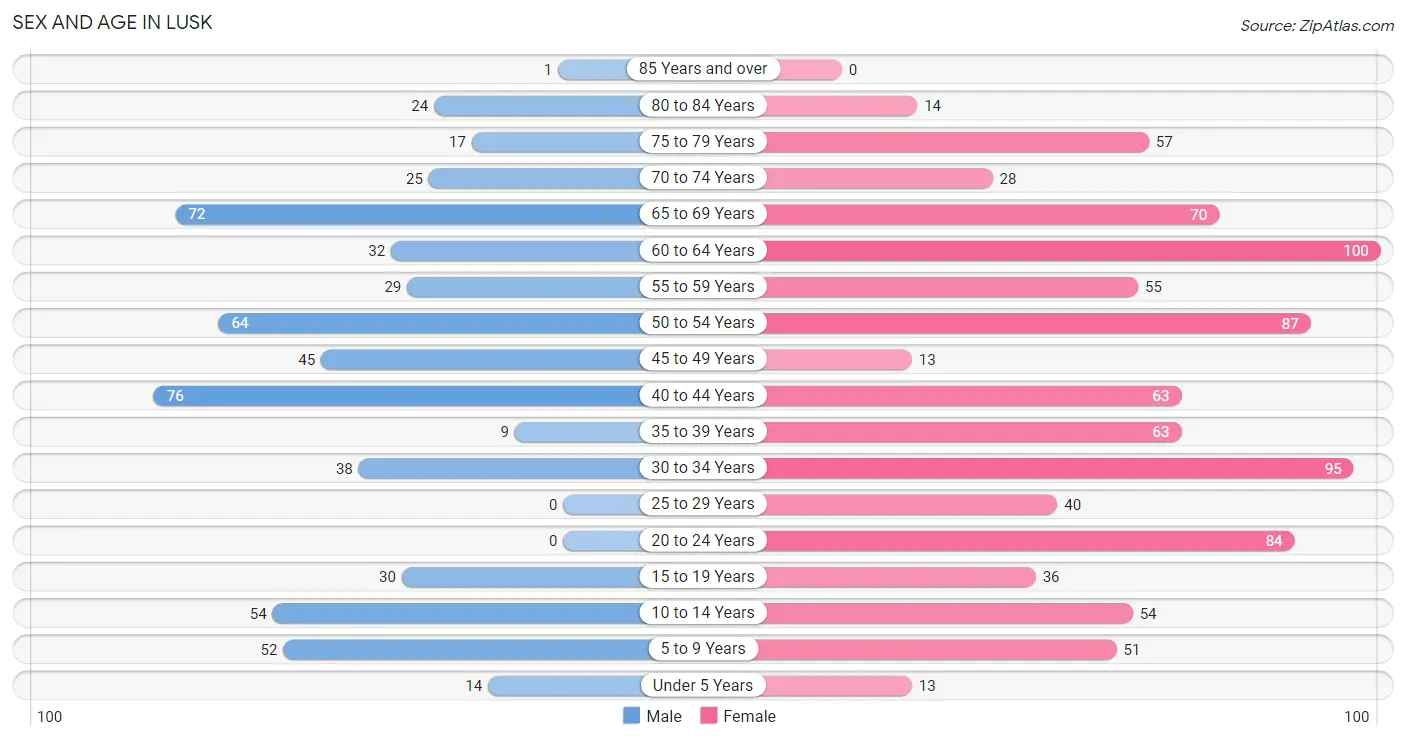
| Age Bracket | Male | Female |
| Under 5 Years | 14 (2.4%) | 13 (1.4%) |
| 5 to 9 Years | 52 (8.9%) | 51 (5.5%) |
| 10 to 14 Years | 54 (9.3%) | 54 (5.9%) |
| 15 to 19 Years | 30 (5.1%) | 36 (3.9%) |
| 20 to 24 Years | 0 (0.0%) | 84 (9.1%) |
| 25 to 29 Years | 0 (0.0%) | 40 (4.3%) |
| 30 to 34 Years | 38 (6.5%) | 95 (10.3%) |
| 35 to 39 Years | 9 (1.5%) | 63 (6.8%) |
| 40 to 44 Years | 76 (13.1%) | 63 (6.8%) |
| 45 to 49 Years | 45 (7.7%) | 13 (1.4%) |
| 50 to 54 Years | 64 (11.0%) | 87 (9.4%) |
| 55 to 59 Years | 29 (5.0%) | 55 (6.0%) |
| 60 to 64 Years | 32 (5.5%) | 100 (10.8%) |
| 65 to 69 Years | 72 (12.4%) | 70 (7.6%) |
| 70 to 74 Years | 25 (4.3%) | 28 (3.0%) |
| 75 to 79 Years | 17 (2.9%) | 57 (6.2%) |
| 80 to 84 Years | 24 (4.1%) | 14 (1.5%) |
| 85 Years and over | 1 (0.2%) | 0 (0.0%) |
| Total | 582 (100.0%) | 923 (100.0%) |
Families and Households in Lusk
Median Family Size in Lusk
The median family size in Lusk is 2.73 persons per family, with single female/mother families (53 | 16.9%) accounting for the largest median family size of 3.11 persons per family. On the other hand, single male/father families (25 | 8.0%) represent the smallest median family size with 1.88 persons per family.
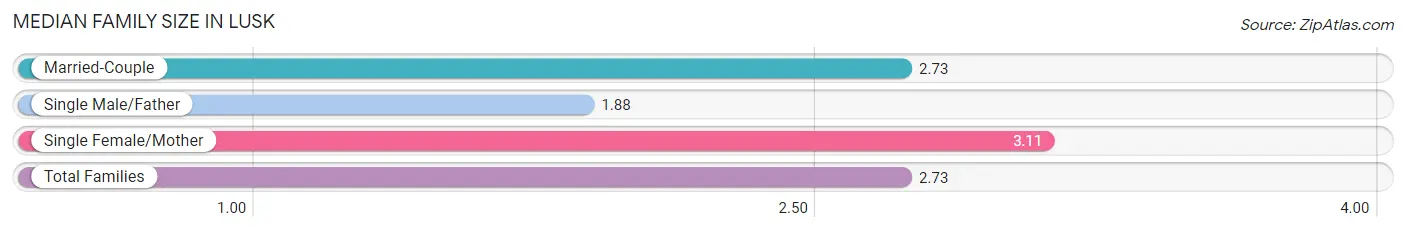
| Family Type | # Families | Family Size |
| Married-Couple | 235 (75.1%) | 2.73 |
| Single Male/Father | 25 (8.0%) | 1.88 |
| Single Female/Mother | 53 (16.9%) | 3.11 |
| Total Families | 313 (100.0%) | 2.73 |
Median Household Size in Lusk
The median household size in Lusk is 1.95 persons per household, with single female/mother households (53 | 8.1%) accounting for the largest median household size of 3.7 persons per household. non-family households (340 | 52.1%) represent the smallest median household size with 1.11 persons per household.
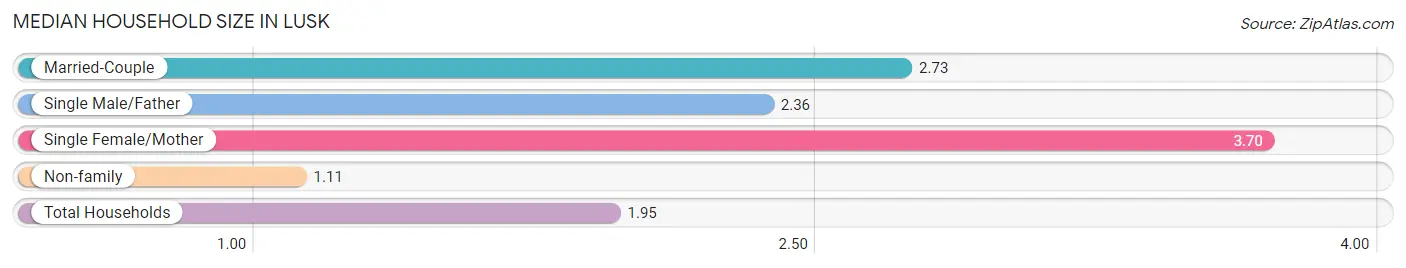
| Household Type | # Households | Household Size |
| Married-Couple | 235 (36.0%) | 2.73 |
| Single Male/Father | 25 (3.8%) | 2.36 |
| Single Female/Mother | 53 (8.1%) | 3.70 |
| Non-family | 340 (52.1%) | 1.11 |
| Total Households | 653 (100.0%) | 1.95 |
Household Size by Marriage Status in Lusk
Out of a total of 653 households in Lusk, 313 (47.9%) are family households, while 340 (52.1%) are nonfamily households. The most numerous type of family households are 2-person households, comprising 152, and the most common type of nonfamily households are 1-person households, comprising 289.
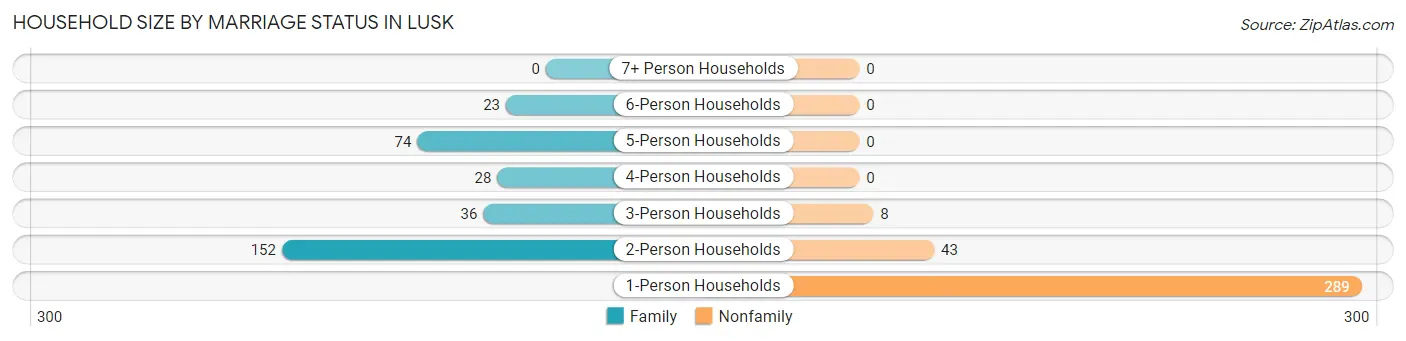
| Household Size | Family Households | Nonfamily Households |
| 1-Person Households | - | 289 (44.3%) |
| 2-Person Households | 152 (23.3%) | 43 (6.6%) |
| 3-Person Households | 36 (5.5%) | 8 (1.2%) |
| 4-Person Households | 28 (4.3%) | 0 (0.0%) |
| 5-Person Households | 74 (11.3%) | 0 (0.0%) |
| 6-Person Households | 23 (3.5%) | 0 (0.0%) |
| 7+ Person Households | 0 (0.0%) | 0 (0.0%) |
| Total | 313 (47.9%) | 340 (52.1%) |
Female Fertility in Lusk
Fertility by Age in Lusk
Average fertility rate in Lusk is 171.0 births per 1,000 women. Women in the age bracket of 20 to 34 years have the highest fertility rate with 306.0 births per 1,000 women. Women in the age bracket of 20 to 34 years acount for 94.4% of all women with births.
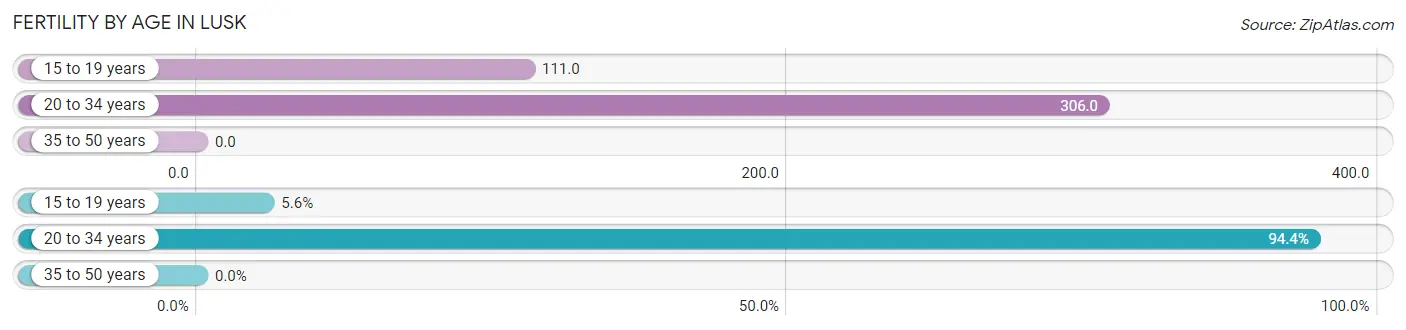
| Age Bracket | Women with Births | Births / 1,000 Women |
| 15 to 19 years | 4 (5.6%) | 111.0 |
| 20 to 34 years | 67 (94.4%) | 306.0 |
| 35 to 50 years | 0 (0.0%) | 0.0 |
| Total | 71 (100.0%) | 171.0 |
Fertility by Age by Marriage Status in Lusk
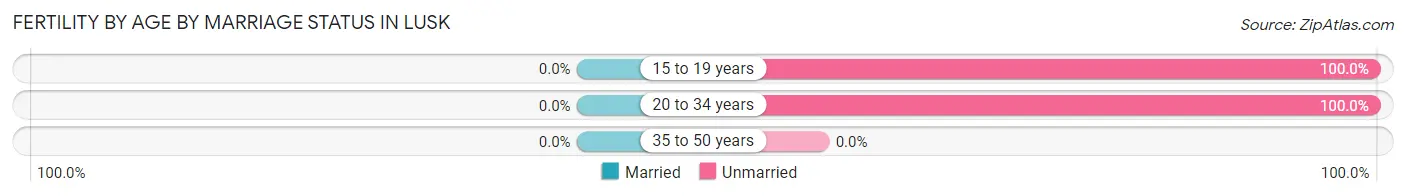
| Age Bracket | Married | Unmarried |
| 15 to 19 years | 0 (0.0%) | 4 (100.0%) |
| 20 to 34 years | 0 (0.0%) | 67 (100.0%) |
| 35 to 50 years | 0 (0.0%) | 0 (0.0%) |
| Total | 0 (0.0%) | 71 (100.0%) |
Fertility by Education in Lusk
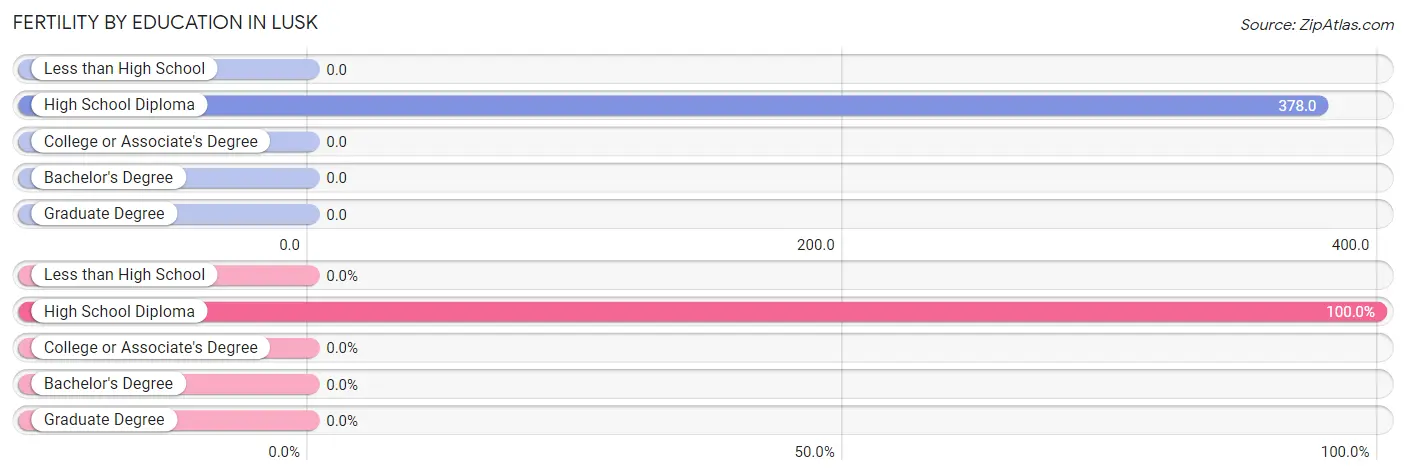
| Educational Attainment | Women with Births | Births / 1,000 Women |
| Less than High School | 0 (0.0%) | 0.0 |
| High School Diploma | 71 (100.0%) | 378.0 |
| College or Associate's Degree | 0 (0.0%) | 0.0 |
| Bachelor's Degree | 0 (0.0%) | 0.0 |
| Graduate Degree | 0 (0.0%) | 0.0 |
| Total | 71 (100.0%) | 171.0 |
Fertility by Education by Marriage Status in Lusk
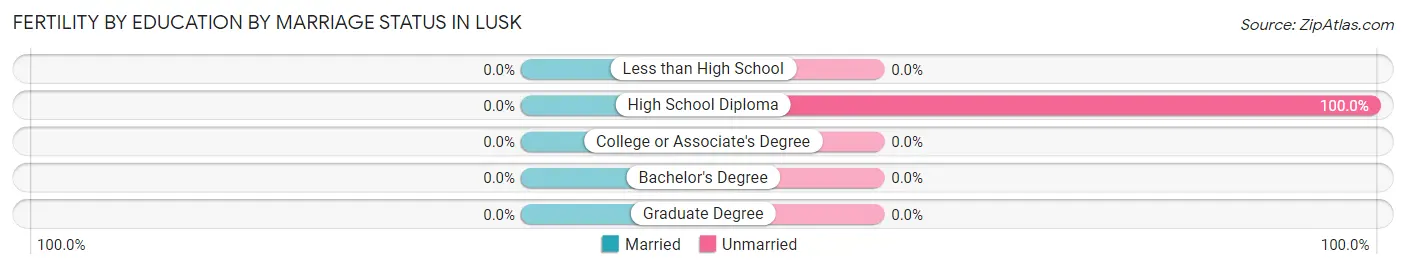
| Educational Attainment | Married | Unmarried |
| Less than High School | 0 (0.0%) | 0 (0.0%) |
| High School Diploma | 0 (0.0%) | 71 (100.0%) |
| College or Associate's Degree | 0 (0.0%) | 0 (0.0%) |
| Bachelor's Degree | 0 (0.0%) | 0 (0.0%) |
| Graduate Degree | 0 (0.0%) | 0 (0.0%) |
| Total | 0 (0.0%) | 71 (100.0%) |
Employment Characteristics in Lusk
Employment by Class of Employer in Lusk
Among the 599 employed individuals in Lusk, private company employees (281 | 46.9%), local government employees (104 | 17.4%), and state government employees (98 | 16.4%) make up the most common classes of employment.
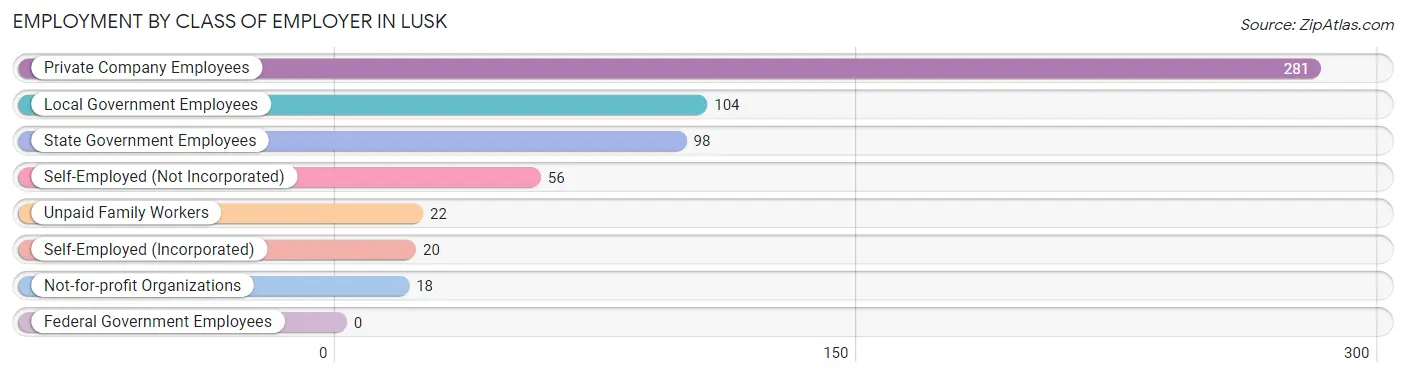
| Employer Class | # Employees | % Employees |
| Private Company Employees | 281 | 46.9% |
| Self-Employed (Incorporated) | 20 | 3.3% |
| Self-Employed (Not Incorporated) | 56 | 9.3% |
| Not-for-profit Organizations | 18 | 3.0% |
| Local Government Employees | 104 | 17.4% |
| State Government Employees | 98 | 16.4% |
| Federal Government Employees | 0 | 0.0% |
| Unpaid Family Workers | 22 | 3.7% |
| Total | 599 | 100.0% |
Employment Status by Age in Lusk
According to the labor force statistics for Lusk, out of the total population over 16 years of age (1,260), 53.1% or 669 individuals are in the labor force, with 9.3% or 62 of them unemployed. The age group with the highest labor force participation rate is 45 to 54 years, with 85.6% or 179 individuals in the labor force. Within the labor force, the 55 to 59 years age range has the highest percentage of unemployed individuals, with 33.3% or 11 of them being unemployed.
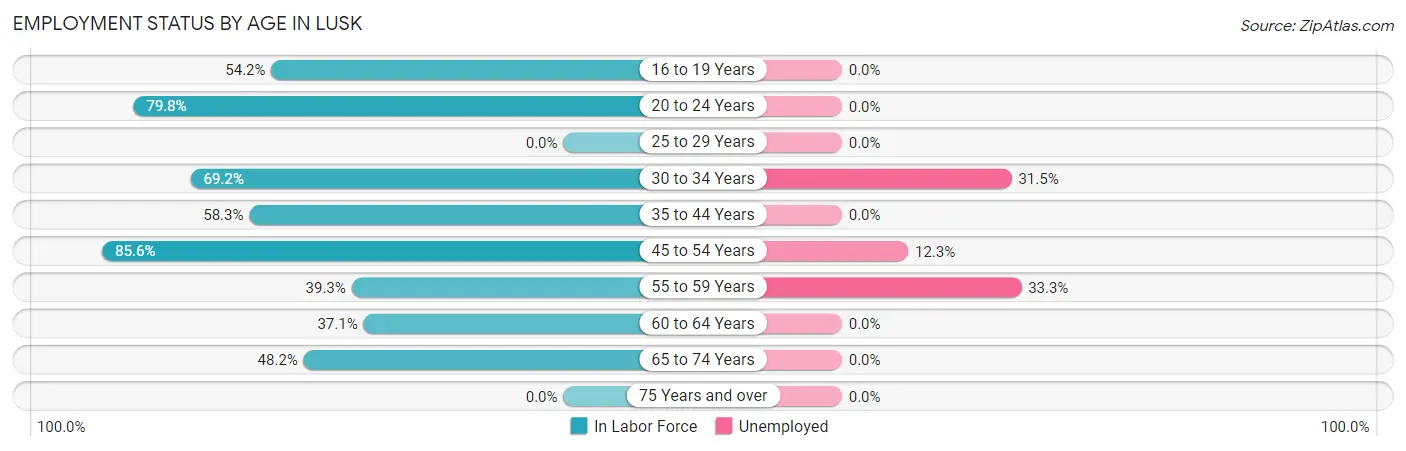
| Age Bracket | In Labor Force | Unemployed |
| 16 to 19 Years | 32 (54.2%) | 0 (0.0%) |
| 20 to 24 Years | 67 (79.8%) | 0 (0.0%) |
| 25 to 29 Years | 0 (0.0%) | 0 (0.0%) |
| 30 to 34 Years | 92 (69.2%) | 29 (31.5%) |
| 35 to 44 Years | 123 (58.3%) | 0 (0.0%) |
| 45 to 54 Years | 179 (85.6%) | 22 (12.3%) |
| 55 to 59 Years | 33 (39.3%) | 11 (33.3%) |
| 60 to 64 Years | 49 (37.1%) | 0 (0.0%) |
| 65 to 74 Years | 94 (48.2%) | 0 (0.0%) |
| 75 Years and over | 0 (0.0%) | 0 (0.0%) |
| Total | 669 (53.1%) | 62 (9.3%) |
Employment Status by Educational Attainment in Lusk
According to labor force statistics for Lusk, 58.8% of individuals (476) out of the total population between 25 and 64 years of age (809) are in the labor force, with 13.0% or 62 of them being unemployed. The group with the highest labor force participation rate are those with the educational attainment of bachelor's degree or higher, with 78.0% or 85 individuals in the labor force. Within the labor force, individuals with less than high school education have the highest percentage of unemployment, with 52.7% or 29 of them being unemployed.
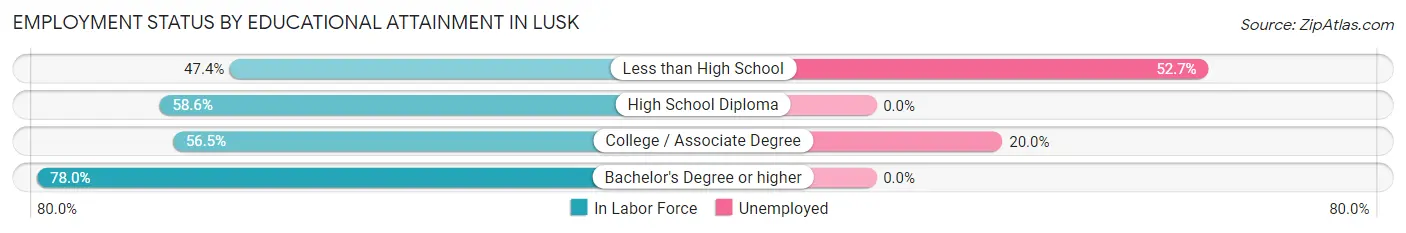
| Educational Attainment | In Labor Force | Unemployed |
| Less than High School | 55 (47.4%) | 61 (52.7%) |
| High School Diploma | 171 (58.6%) | 0 (0.0%) |
| College / Associate Degree | 165 (56.5%) | 58 (20.0%) |
| Bachelor's Degree or higher | 85 (78.0%) | 0 (0.0%) |
| Total | 476 (58.8%) | 105 (13.0%) |
Employment Occupations by Sex in Lusk
Management, Business, Science and Arts Occupations
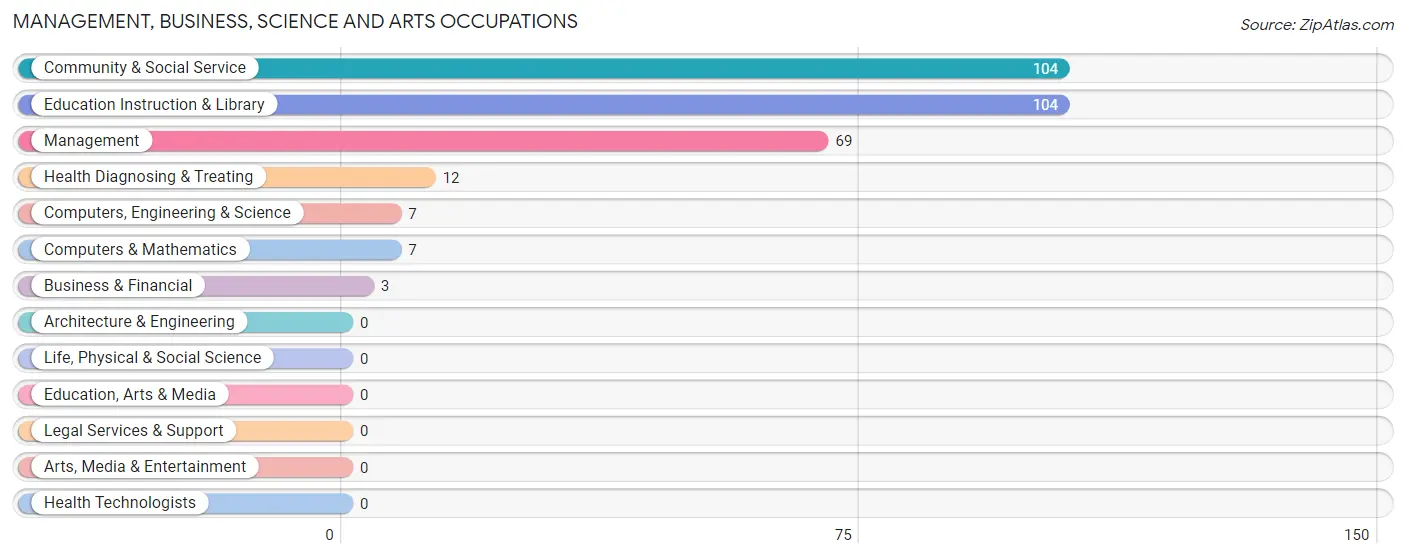
The most common Management, Business, Science and Arts occupations in Lusk are Community & Social Service (104 | 17.1%), Education Instruction & Library (104 | 17.1%), Management (69 | 11.4%), Health Diagnosing & Treating (12 | 2.0%), and Computers, Engineering & Science (7 | 1.1%).
Management, Business, Science and Arts Occupations by Sex
Within the Management, Business, Science and Arts occupations in Lusk, the most male-oriented occupations are Business & Financial (100.0%), Computers, Engineering & Science (100.0%), and Computers & Mathematics (100.0%), while the most female-oriented occupations are Health Diagnosing & Treating (100.0%), Management (66.7%), and Community & Social Service (42.3%).
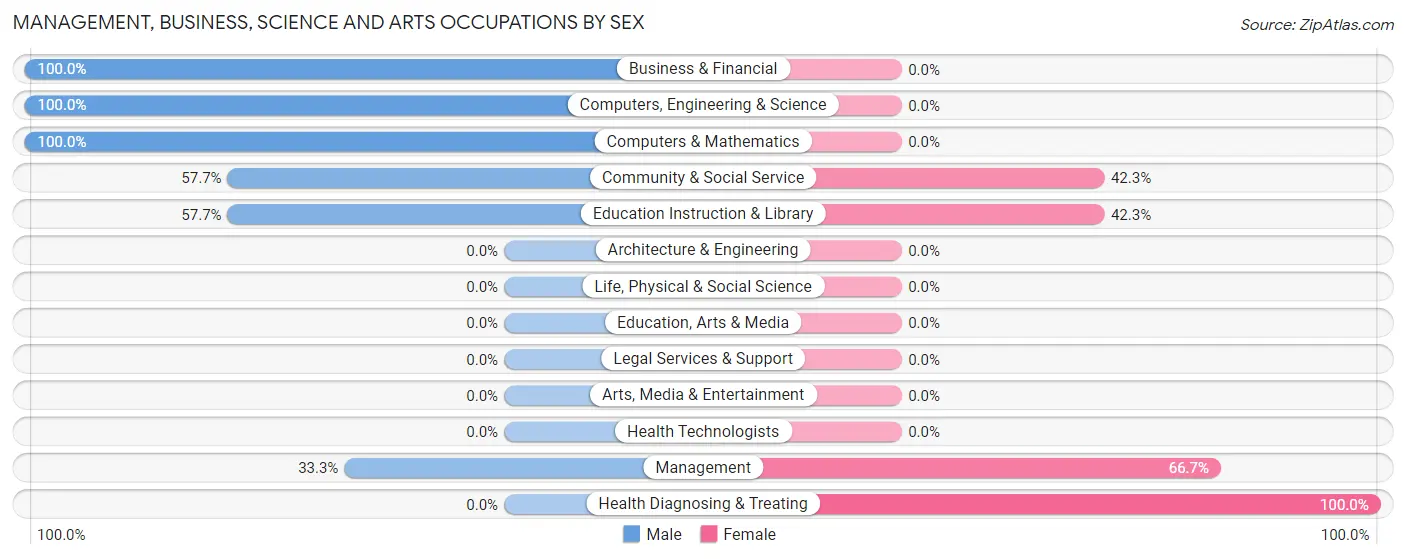
| Occupation | Male | Female |
| Management | 23 (33.3%) | 46 (66.7%) |
| Business & Financial | 3 (100.0%) | 0 (0.0%) |
| Computers, Engineering & Science | 7 (100.0%) | 0 (0.0%) |
| Computers & Mathematics | 7 (100.0%) | 0 (0.0%) |
| Architecture & Engineering | 0 (0.0%) | 0 (0.0%) |
| Life, Physical & Social Science | 0 (0.0%) | 0 (0.0%) |
| Community & Social Service | 60 (57.7%) | 44 (42.3%) |
| Education, Arts & Media | 0 (0.0%) | 0 (0.0%) |
| Legal Services & Support | 0 (0.0%) | 0 (0.0%) |
| Education Instruction & Library | 60 (57.7%) | 44 (42.3%) |
| Arts, Media & Entertainment | 0 (0.0%) | 0 (0.0%) |
| Health Diagnosing & Treating | 0 (0.0%) | 12 (100.0%) |
| Health Technologists | 0 (0.0%) | 0 (0.0%) |
| Total (Category) | 93 (47.7%) | 102 (52.3%) |
| Total (Overall) | 312 (51.4%) | 295 (48.6%) |
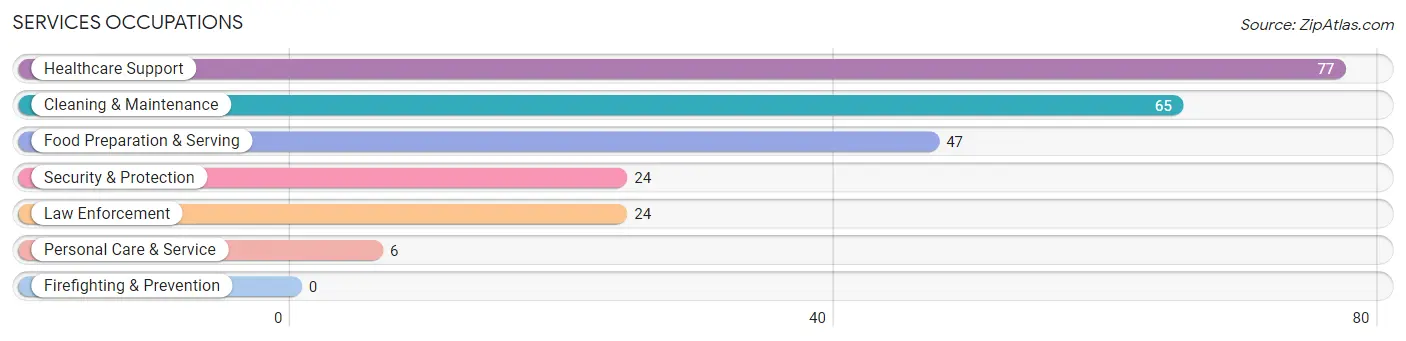
Services Occupations
The most common Services occupations in Lusk are Healthcare Support (77 | 12.7%), Cleaning & Maintenance (65 | 10.7%), Food Preparation & Serving (47 | 7.7%), Security & Protection (24 | 4.0%), and Law Enforcement (24 | 4.0%).
Services Occupations by Sex
Within the Services occupations in Lusk, the most male-oriented occupations are Cleaning & Maintenance (93.9%), Security & Protection (58.3%), and Law Enforcement (58.3%), while the most female-oriented occupations are Healthcare Support (100.0%), Food Preparation & Serving (100.0%), and Personal Care & Service (100.0%).
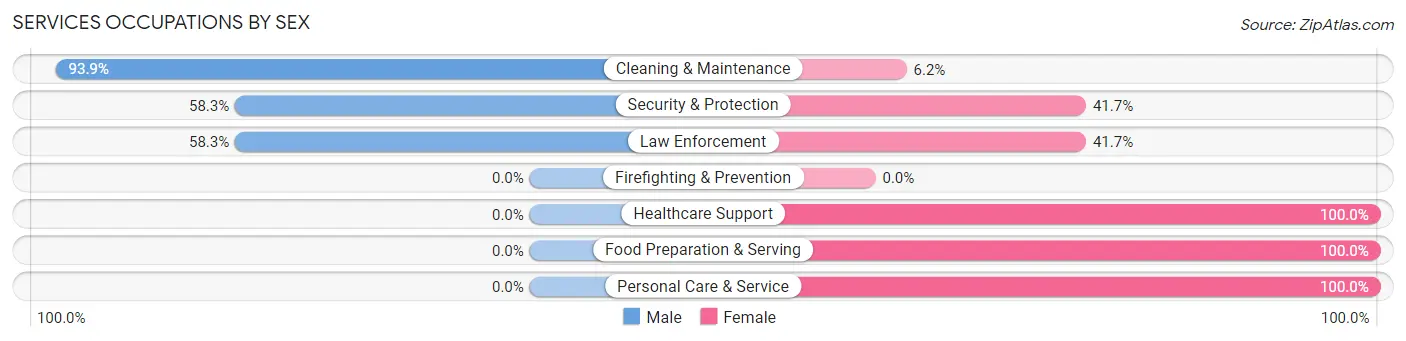
| Occupation | Male | Female |
| Healthcare Support | 0 (0.0%) | 77 (100.0%) |
| Security & Protection | 14 (58.3%) | 10 (41.7%) |
| Firefighting & Prevention | 0 (0.0%) | 0 (0.0%) |
| Law Enforcement | 14 (58.3%) | 10 (41.7%) |
| Food Preparation & Serving | 0 (0.0%) | 47 (100.0%) |
| Cleaning & Maintenance | 61 (93.9%) | 4 (6.1%) |
| Personal Care & Service | 0 (0.0%) | 6 (100.0%) |
| Total (Category) | 75 (34.3%) | 144 (65.7%) |
| Total (Overall) | 312 (51.4%) | 295 (48.6%) |
Sales and Office Occupations
The most common Sales and Office occupations in Lusk are Office & Administration (35 | 5.8%), and Sales & Related (17 | 2.8%).

Sales and Office Occupations by Sex

| Occupation | Male | Female |
| Sales & Related | 9 (52.9%) | 8 (47.1%) |
| Office & Administration | 32 (91.4%) | 3 (8.6%) |
| Total (Category) | 41 (78.8%) | 11 (21.1%) |
| Total (Overall) | 312 (51.4%) | 295 (48.6%) |
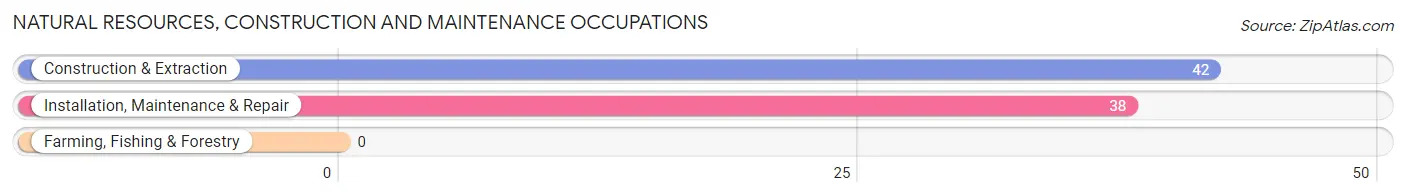
Natural Resources, Construction and Maintenance Occupations
The most common Natural Resources, Construction and Maintenance occupations in Lusk are Construction & Extraction (42 | 6.9%), and Installation, Maintenance & Repair (38 | 6.3%).
Natural Resources, Construction and Maintenance Occupations by Sex

| Occupation | Male | Female |
| Farming, Fishing & Forestry | 0 (0.0%) | 0 (0.0%) |
| Construction & Extraction | 42 (100.0%) | 0 (0.0%) |
| Installation, Maintenance & Repair | 23 (60.5%) | 15 (39.5%) |
| Total (Category) | 65 (81.2%) | 15 (18.8%) |
| Total (Overall) | 312 (51.4%) | 295 (48.6%) |
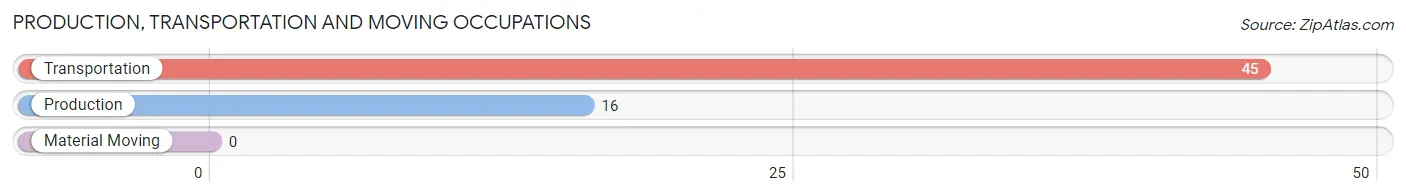
Production, Transportation and Moving Occupations
The most common Production, Transportation and Moving occupations in Lusk are Transportation (45 | 7.4%), and Production (16 | 2.6%).
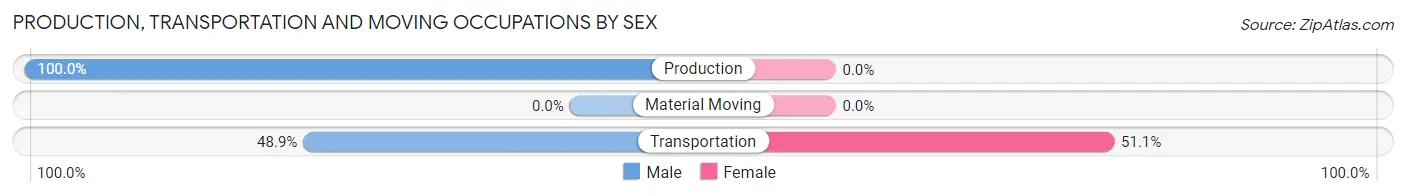
Production, Transportation and Moving Occupations by Sex
| Occupation | Male | Female |
| Production | 16 (100.0%) | 0 (0.0%) |
| Transportation | 22 (48.9%) | 23 (51.1%) |
| Material Moving | 0 (0.0%) | 0 (0.0%) |
| Total (Category) | 38 (62.3%) | 23 (37.7%) |
| Total (Overall) | 312 (51.4%) | 295 (48.6%) |
Employment Industries by Sex in Lusk
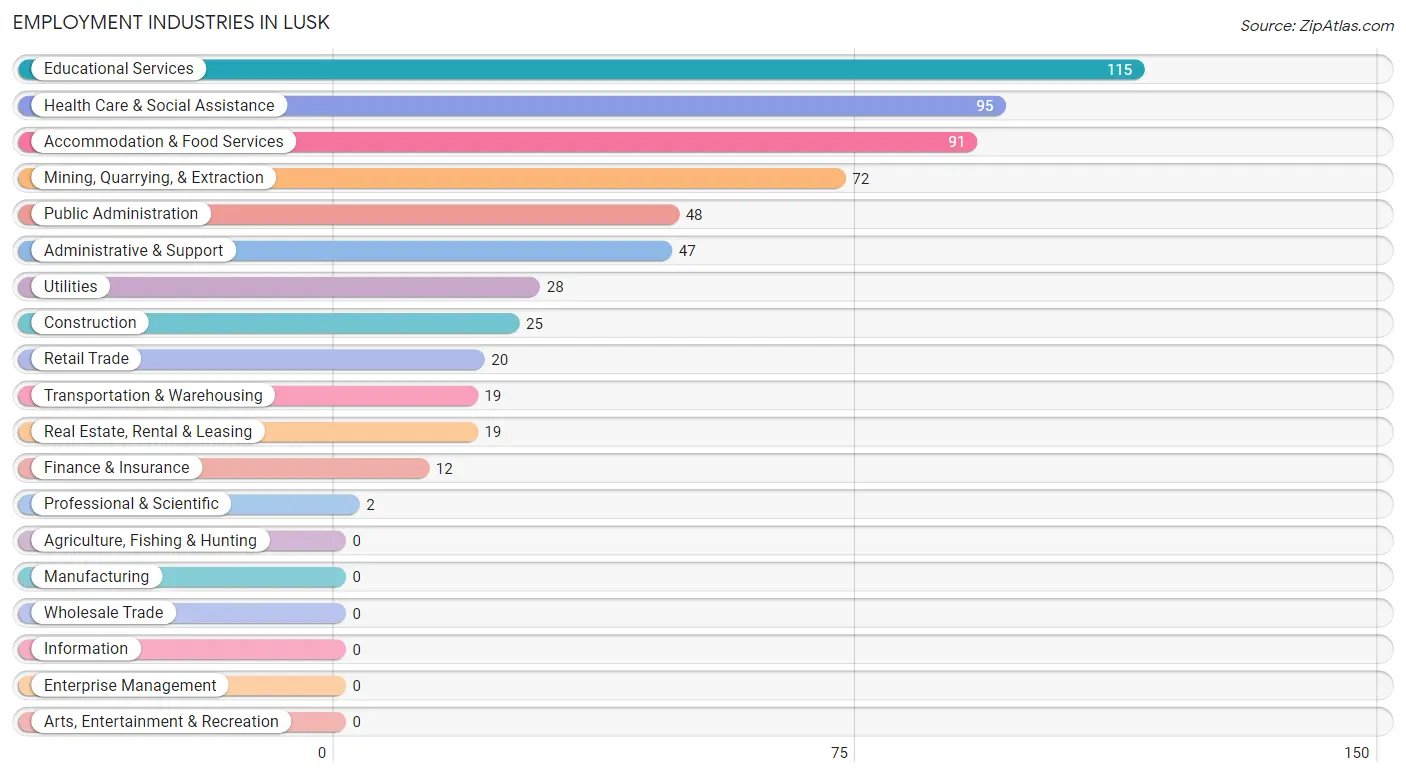
Employment Industries in Lusk
The major employment industries in Lusk include Educational Services (115 | 19.0%), Health Care & Social Assistance (95 | 15.7%), Accommodation & Food Services (91 | 15.0%), Mining, Quarrying, & Extraction (72 | 11.9%), and Public Administration (48 | 7.9%).
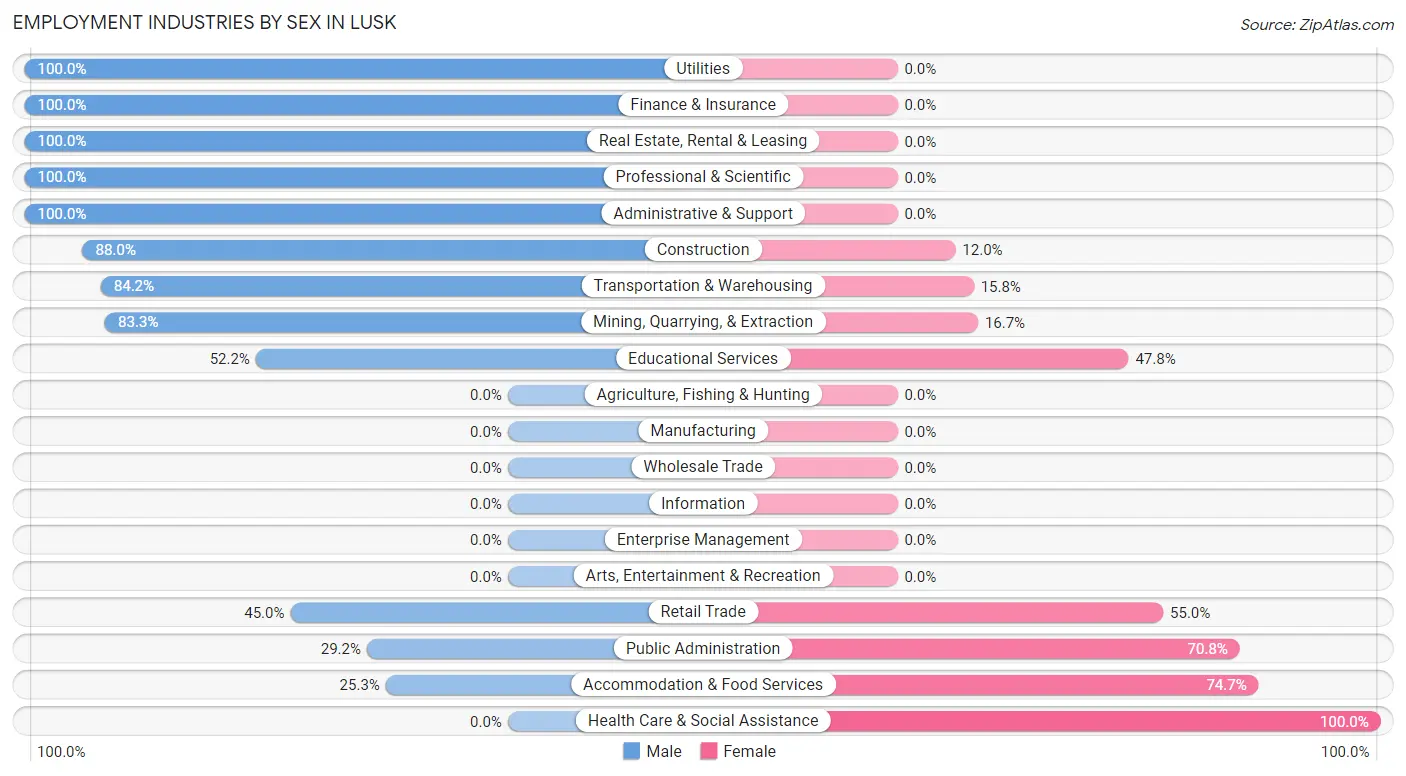
Employment Industries by Sex in Lusk
The Lusk industries that see more men than women are Utilities (100.0%), Finance & Insurance (100.0%), and Real Estate, Rental & Leasing (100.0%), whereas the industries that tend to have a higher number of women are Health Care & Social Assistance (100.0%), Accommodation & Food Services (74.7%), and Public Administration (70.8%).
| Industry | Male | Female |
| Agriculture, Fishing & Hunting | 0 (0.0%) | 0 (0.0%) |
| Mining, Quarrying, & Extraction | 60 (83.3%) | 12 (16.7%) |
| Construction | 22 (88.0%) | 3 (12.0%) |
| Manufacturing | 0 (0.0%) | 0 (0.0%) |
| Wholesale Trade | 0 (0.0%) | 0 (0.0%) |
| Retail Trade | 9 (45.0%) | 11 (55.0%) |
| Transportation & Warehousing | 16 (84.2%) | 3 (15.8%) |
| Utilities | 28 (100.0%) | 0 (0.0%) |
| Information | 0 (0.0%) | 0 (0.0%) |
| Finance & Insurance | 12 (100.0%) | 0 (0.0%) |
| Real Estate, Rental & Leasing | 19 (100.0%) | 0 (0.0%) |
| Professional & Scientific | 2 (100.0%) | 0 (0.0%) |
| Enterprise Management | 0 (0.0%) | 0 (0.0%) |
| Administrative & Support | 47 (100.0%) | 0 (0.0%) |
| Educational Services | 60 (52.2%) | 55 (47.8%) |
| Health Care & Social Assistance | 0 (0.0%) | 95 (100.0%) |
| Arts, Entertainment & Recreation | 0 (0.0%) | 0 (0.0%) |
| Accommodation & Food Services | 23 (25.3%) | 68 (74.7%) |
| Public Administration | 14 (29.2%) | 34 (70.8%) |
| Total | 312 (51.4%) | 295 (48.6%) |
Education in Lusk
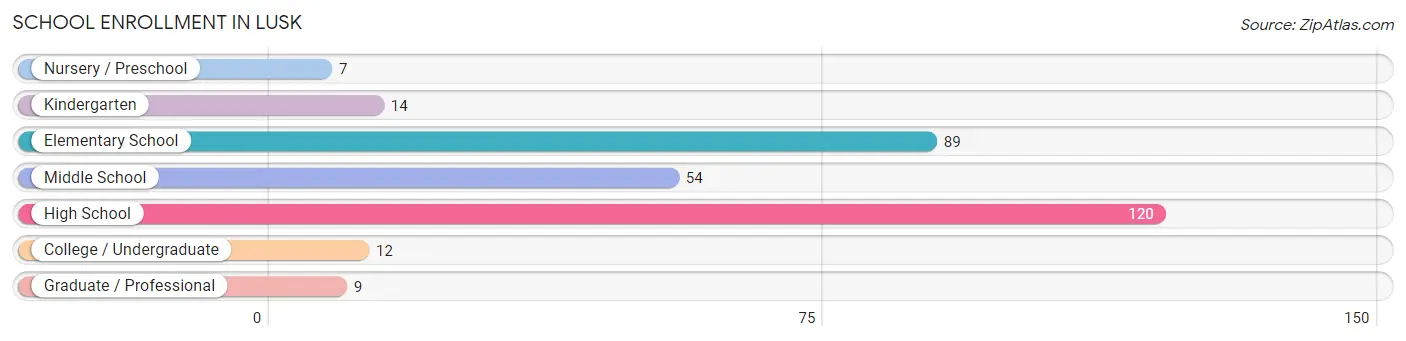
School Enrollment in Lusk
The most common levels of schooling among the 305 students in Lusk are high school (120 | 39.3%), elementary school (89 | 29.2%), and middle school (54 | 17.7%).
| School Level | # Students | % Students |
| Nursery / Preschool | 7 | 2.3% |
| Kindergarten | 14 | 4.6% |
| Elementary School | 89 | 29.2% |
| Middle School | 54 | 17.7% |
| High School | 120 | 39.3% |
| College / Undergraduate | 12 | 3.9% |
| Graduate / Professional | 9 | 2.9% |
| Total | 305 | 100.0% |
School Enrollment by Age by Funding Source in Lusk
Out of a total of 305 students who are enrolled in schools in Lusk, 32 (10.5%) attend a private institution, while the remaining 273 (89.5%) are enrolled in public schools. The age group of 35 years and over has the highest likelihood of being enrolled in private schools, with 9 (42.9% in the age bracket) enrolled. Conversely, the age group of 3 to 4 year olds has the lowest likelihood of being enrolled in a private school, with 7 (100.0% in the age bracket) attending a public institution.
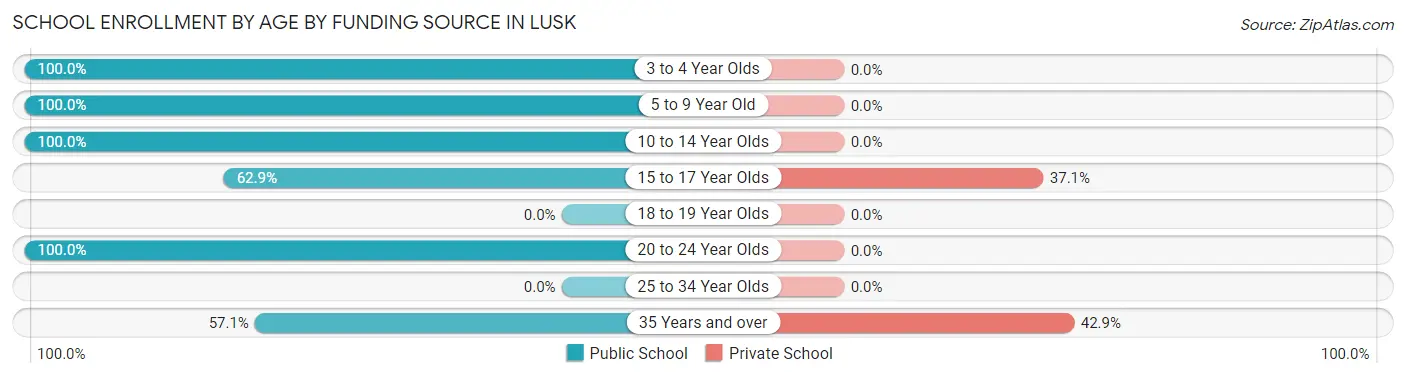
| Age Bracket | Public School | Private School |
| 3 to 4 Year Olds | 7 (100.0%) | 0 (0.0%) |
| 5 to 9 Year Old | 103 (100.0%) | 0 (0.0%) |
| 10 to 14 Year Olds | 108 (100.0%) | 0 (0.0%) |
| 15 to 17 Year Olds | 39 (62.9%) | 23 (37.1%) |
| 18 to 19 Year Olds | 0 (0.0%) | 0 (0.0%) |
| 20 to 24 Year Olds | 4 (100.0%) | 0 (0.0%) |
| 25 to 34 Year Olds | 0 (0.0%) | 0 (0.0%) |
| 35 Years and over | 12 (57.1%) | 9 (42.9%) |
| Total | 273 (89.5%) | 32 (10.5%) |
Educational Attainment by Field of Study in Lusk
Business (68 | 33.7%), education (34 | 16.8%), bio, nature & agricultural (21 | 10.4%), liberal arts & history (17 | 8.4%), and physical & health sciences (15 | 7.4%) are the most common fields of study among 202 individuals in Lusk who have obtained a bachelor's degree or higher.
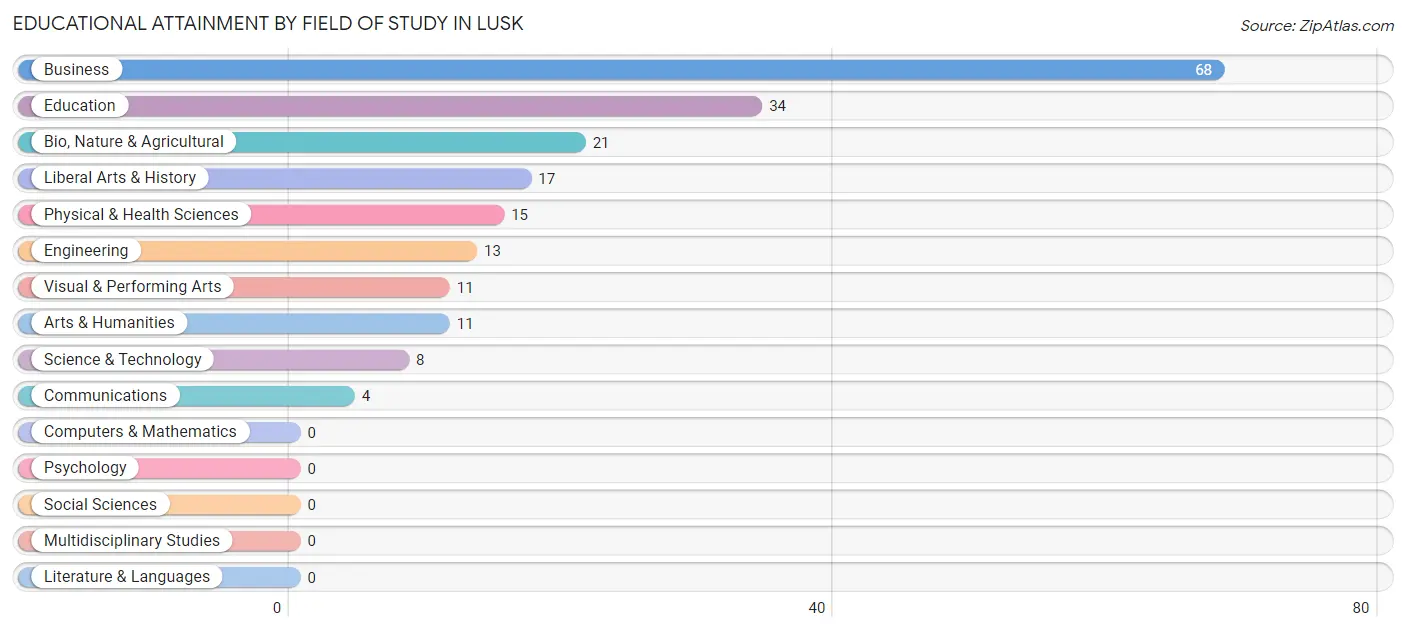
| Field of Study | # Graduates | % Graduates |
| Computers & Mathematics | 0 | 0.0% |
| Bio, Nature & Agricultural | 21 | 10.4% |
| Physical & Health Sciences | 15 | 7.4% |
| Psychology | 0 | 0.0% |
| Social Sciences | 0 | 0.0% |
| Engineering | 13 | 6.4% |
| Multidisciplinary Studies | 0 | 0.0% |
| Science & Technology | 8 | 4.0% |
| Business | 68 | 33.7% |
| Education | 34 | 16.8% |
| Literature & Languages | 0 | 0.0% |
| Liberal Arts & History | 17 | 8.4% |
| Visual & Performing Arts | 11 | 5.4% |
| Communications | 4 | 2.0% |
| Arts & Humanities | 11 | 5.4% |
| Total | 202 | 100.0% |
Transportation & Commute in Lusk
Vehicle Availability by Sex in Lusk
The most prevalent vehicle ownership categories in Lusk are males with 2 vehicles (104, accounting for 34.2%) and females with 2 vehicles (136, making up 35.2%).
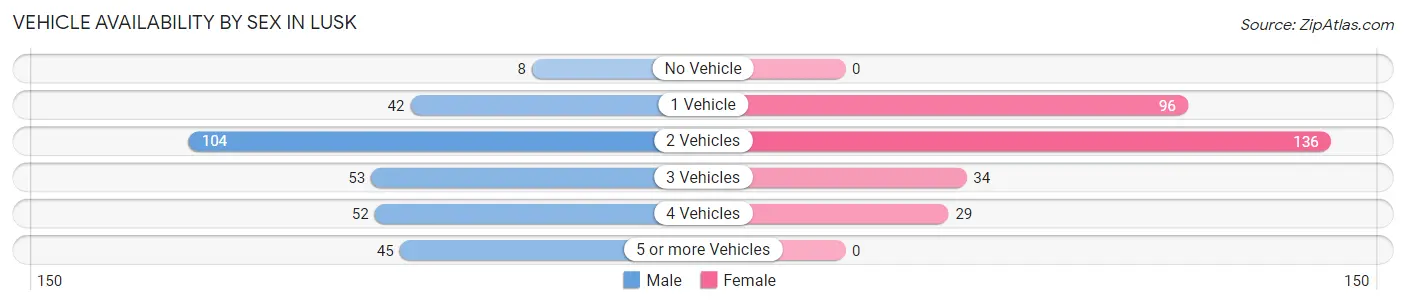
| Vehicles Available | Male | Female |
| No Vehicle | 8 (2.6%) | 0 (0.0%) |
| 1 Vehicle | 42 (13.8%) | 96 (32.5%) |
| 2 Vehicles | 104 (34.2%) | 136 (46.1%) |
| 3 Vehicles | 53 (17.4%) | 34 (11.5%) |
| 4 Vehicles | 52 (17.1%) | 29 (9.8%) |
| 5 or more Vehicles | 45 (14.8%) | 0 (0.0%) |
| Total | 304 (100.0%) | 295 (100.0%) |
Commute Time in Lusk
The most frequently occuring commute durations in Lusk are 5 to 9 minutes (182 commuters, 33.5%), less than 5 minutes (138 commuters, 25.4%), and 45 to 59 minutes (67 commuters, 12.3%).
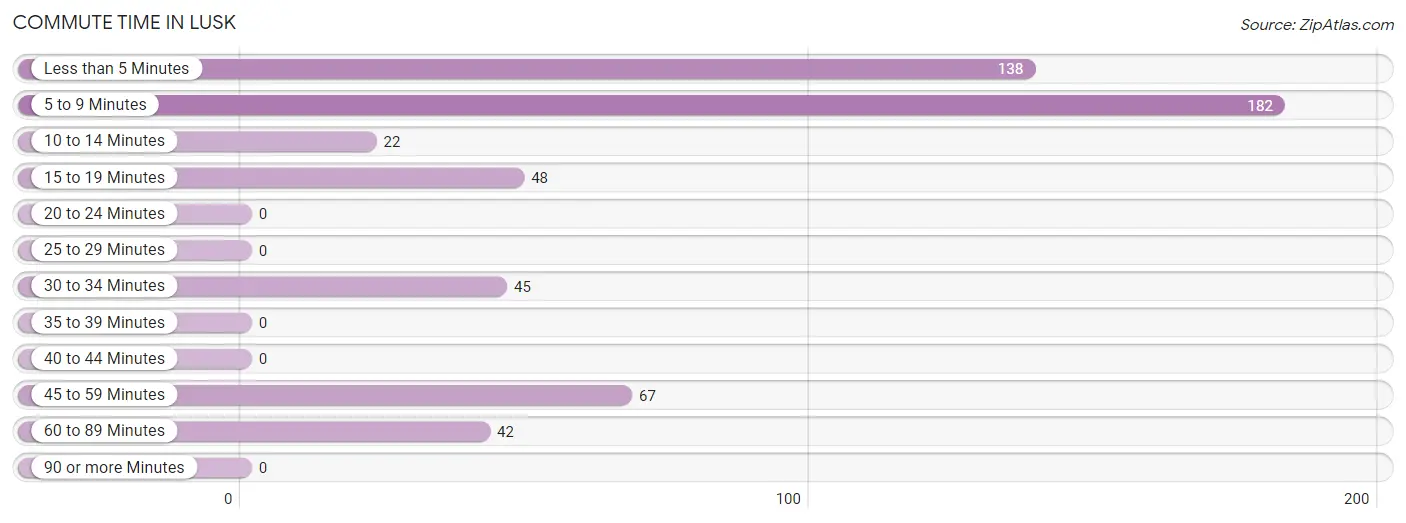
| Commute Time | # Commuters | % Commuters |
| Less than 5 Minutes | 138 | 25.4% |
| 5 to 9 Minutes | 182 | 33.5% |
| 10 to 14 Minutes | 22 | 4.0% |
| 15 to 19 Minutes | 48 | 8.8% |
| 20 to 24 Minutes | 0 | 0.0% |
| 25 to 29 Minutes | 0 | 0.0% |
| 30 to 34 Minutes | 45 | 8.3% |
| 35 to 39 Minutes | 0 | 0.0% |
| 40 to 44 Minutes | 0 | 0.0% |
| 45 to 59 Minutes | 67 | 12.3% |
| 60 to 89 Minutes | 42 | 7.7% |
| 90 or more Minutes | 0 | 0.0% |
Commute Time by Sex in Lusk
The most common commute times in Lusk are 5 to 9 minutes (117 commuters, 39.4%) for males and 45 to 59 minutes (67 commuters, 27.1%) for females.
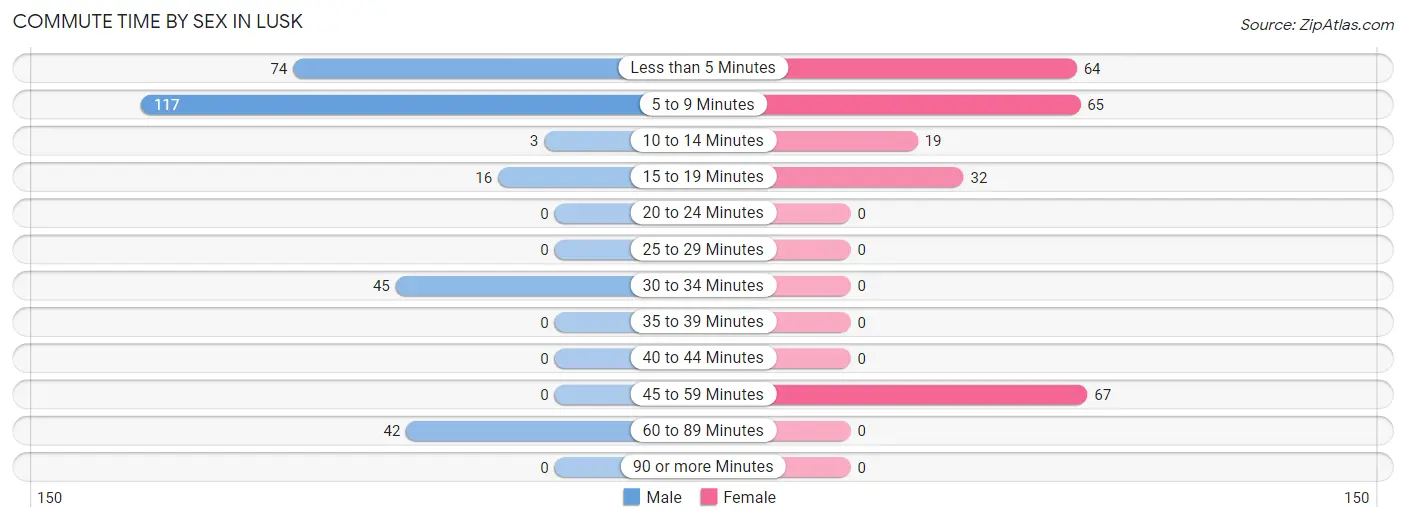
| Commute Time | Male | Female |
| Less than 5 Minutes | 74 (24.9%) | 64 (25.9%) |
| 5 to 9 Minutes | 117 (39.4%) | 65 (26.3%) |
| 10 to 14 Minutes | 3 (1.0%) | 19 (7.7%) |
| 15 to 19 Minutes | 16 (5.4%) | 32 (13.0%) |
| 20 to 24 Minutes | 0 (0.0%) | 0 (0.0%) |
| 25 to 29 Minutes | 0 (0.0%) | 0 (0.0%) |
| 30 to 34 Minutes | 45 (15.1%) | 0 (0.0%) |
| 35 to 39 Minutes | 0 (0.0%) | 0 (0.0%) |
| 40 to 44 Minutes | 0 (0.0%) | 0 (0.0%) |
| 45 to 59 Minutes | 0 (0.0%) | 67 (27.1%) |
| 60 to 89 Minutes | 42 (14.1%) | 0 (0.0%) |
| 90 or more Minutes | 0 (0.0%) | 0 (0.0%) |
Time of Departure to Work by Sex in Lusk
The most frequent times of departure to work in Lusk are 7:00 AM to 7:29 AM (67, 22.6%) for males and 5:30 AM to 5:59 AM (67, 27.1%) for females.
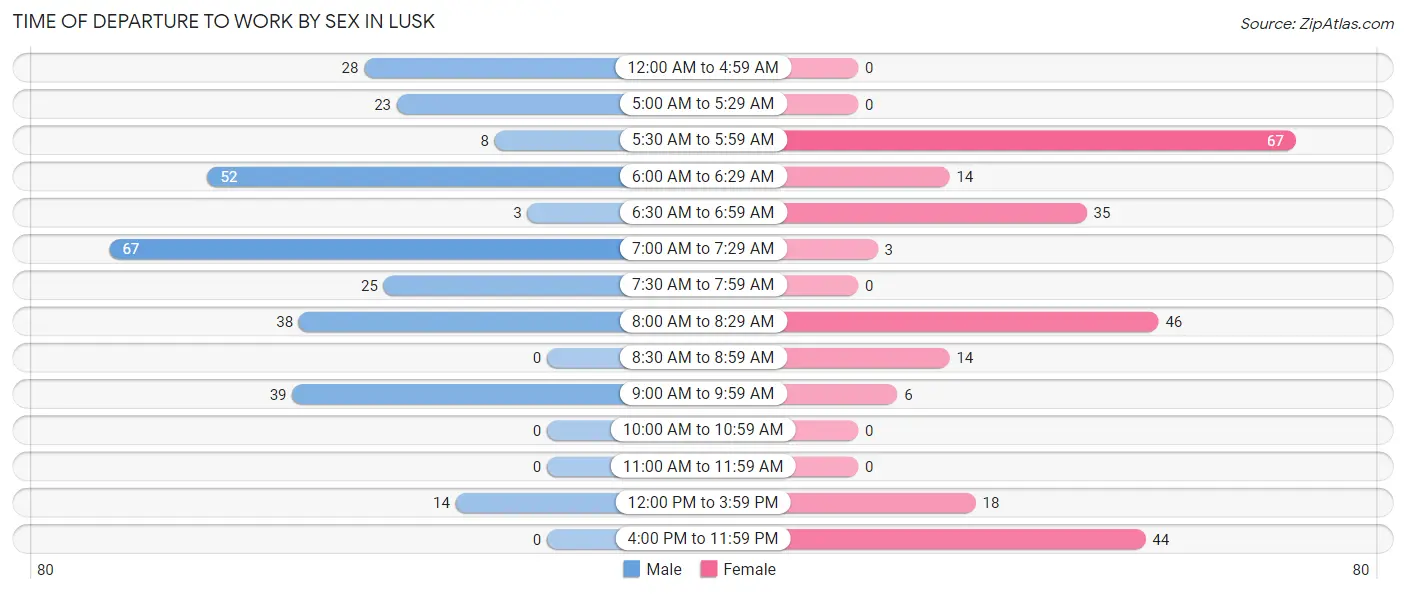
| Time of Departure | Male | Female |
| 12:00 AM to 4:59 AM | 28 (9.4%) | 0 (0.0%) |
| 5:00 AM to 5:29 AM | 23 (7.7%) | 0 (0.0%) |
| 5:30 AM to 5:59 AM | 8 (2.7%) | 67 (27.1%) |
| 6:00 AM to 6:29 AM | 52 (17.5%) | 14 (5.7%) |
| 6:30 AM to 6:59 AM | 3 (1.0%) | 35 (14.2%) |
| 7:00 AM to 7:29 AM | 67 (22.6%) | 3 (1.2%) |
| 7:30 AM to 7:59 AM | 25 (8.4%) | 0 (0.0%) |
| 8:00 AM to 8:29 AM | 38 (12.8%) | 46 (18.6%) |
| 8:30 AM to 8:59 AM | 0 (0.0%) | 14 (5.7%) |
| 9:00 AM to 9:59 AM | 39 (13.1%) | 6 (2.4%) |
| 10:00 AM to 10:59 AM | 0 (0.0%) | 0 (0.0%) |
| 11:00 AM to 11:59 AM | 0 (0.0%) | 0 (0.0%) |
| 12:00 PM to 3:59 PM | 14 (4.7%) | 18 (7.3%) |
| 4:00 PM to 11:59 PM | 0 (0.0%) | 44 (17.8%) |
| Total | 297 (100.0%) | 247 (100.0%) |
Housing Occupancy in Lusk
Occupancy by Ownership in Lusk
Of the total 653 dwellings in Lusk, owner-occupied units account for 409 (62.6%), while renter-occupied units make up 244 (37.4%).
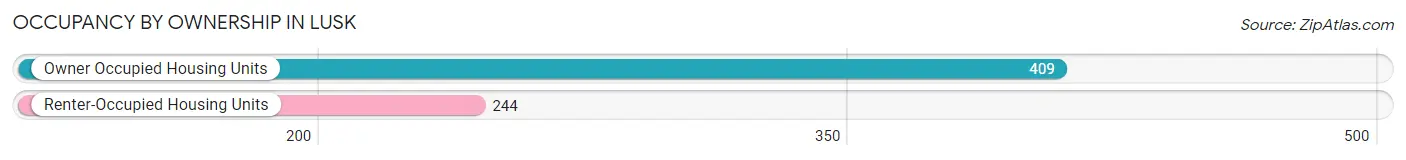
| Occupancy | # Housing Units | % Housing Units |
| Owner Occupied Housing Units | 409 | 62.6% |
| Renter-Occupied Housing Units | 244 | 37.4% |
| Total Occupied Housing Units | 653 | 100.0% |
Occupancy by Household Size in Lusk
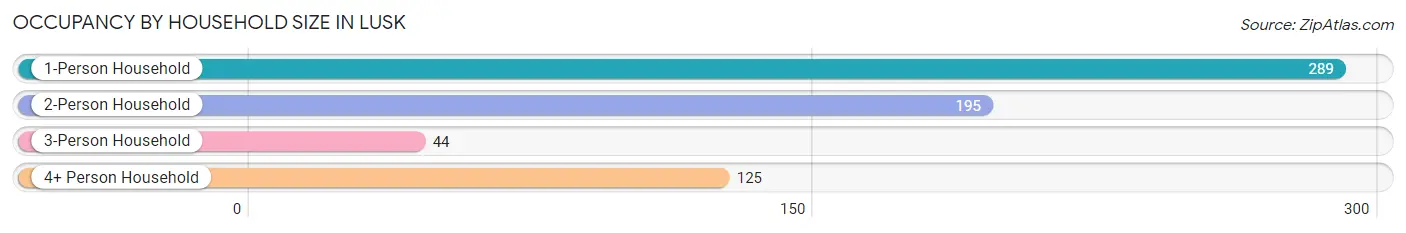
| Household Size | # Housing Units | % Housing Units |
| 1-Person Household | 289 | 44.3% |
| 2-Person Household | 195 | 29.9% |
| 3-Person Household | 44 | 6.7% |
| 4+ Person Household | 125 | 19.1% |
| Total Housing Units | 653 | 100.0% |
Occupancy by Ownership by Household Size in Lusk
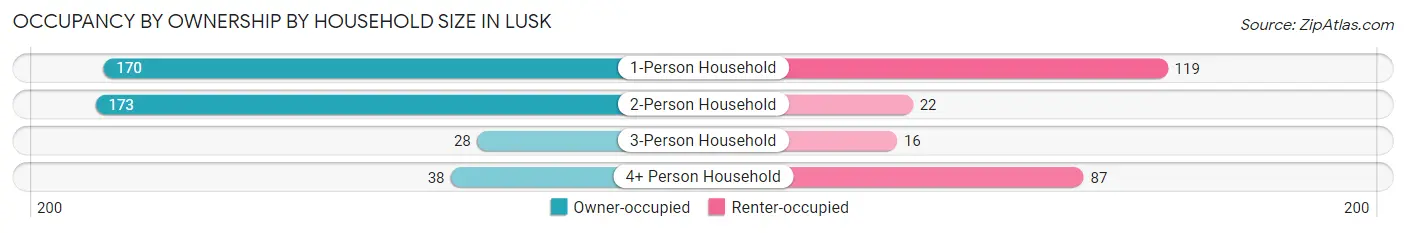
| Household Size | Owner-occupied | Renter-occupied |
| 1-Person Household | 170 (58.8%) | 119 (41.2%) |
| 2-Person Household | 173 (88.7%) | 22 (11.3%) |
| 3-Person Household | 28 (63.6%) | 16 (36.4%) |
| 4+ Person Household | 38 (30.4%) | 87 (69.6%) |
| Total Housing Units | 409 (62.6%) | 244 (37.4%) |
Occupancy by Educational Attainment in Lusk
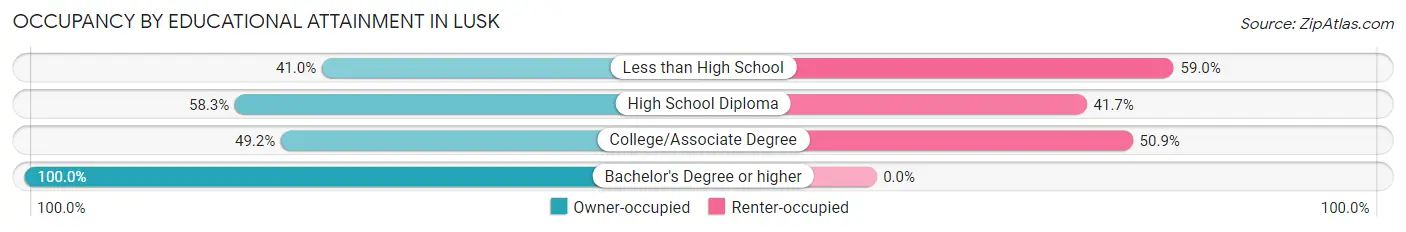
| Household Size | Owner-occupied | Renter-occupied |
| Less than High School | 16 (41.0%) | 23 (59.0%) |
| High School Diploma | 183 (58.3%) | 131 (41.7%) |
| College/Associate Degree | 87 (49.1%) | 90 (50.8%) |
| Bachelor's Degree or higher | 123 (100.0%) | 0 (0.0%) |
Occupancy by Age of Householder in Lusk
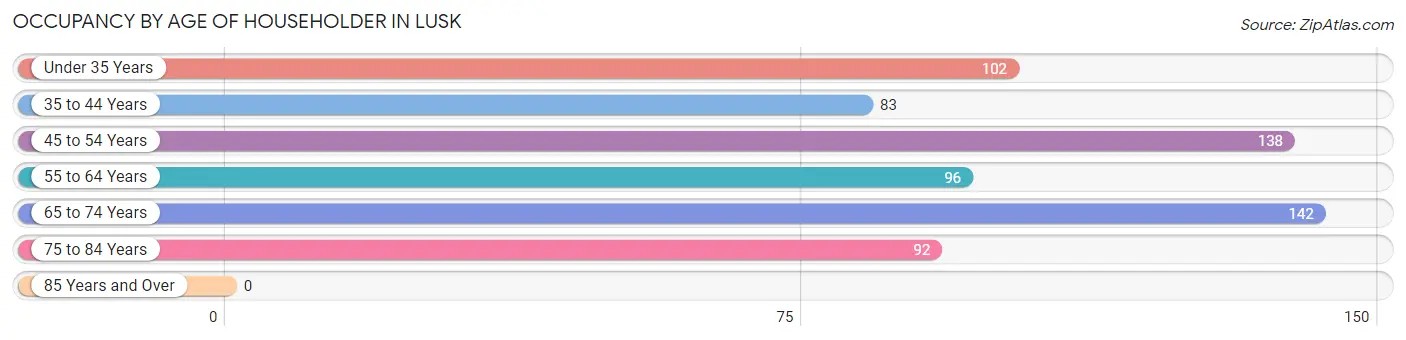
| Age Bracket | # Households | % Households |
| Under 35 Years | 102 | 15.6% |
| 35 to 44 Years | 83 | 12.7% |
| 45 to 54 Years | 138 | 21.1% |
| 55 to 64 Years | 96 | 14.7% |
| 65 to 74 Years | 142 | 21.7% |
| 75 to 84 Years | 92 | 14.1% |
| 85 Years and Over | 0 | 0.0% |
| Total | 653 | 100.0% |
Housing Finances in Lusk
Median Income by Occupancy in Lusk
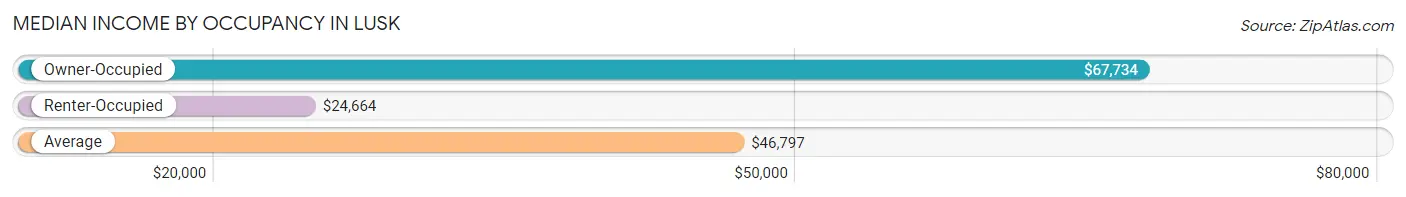
| Occupancy Type | # Households | Median Income |
| Owner-Occupied | 409 (62.6%) | $67,734 |
| Renter-Occupied | 244 (37.4%) | $24,664 |
| Average | 653 (100.0%) | $46,797 |
Occupancy by Householder Income Bracket in Lusk
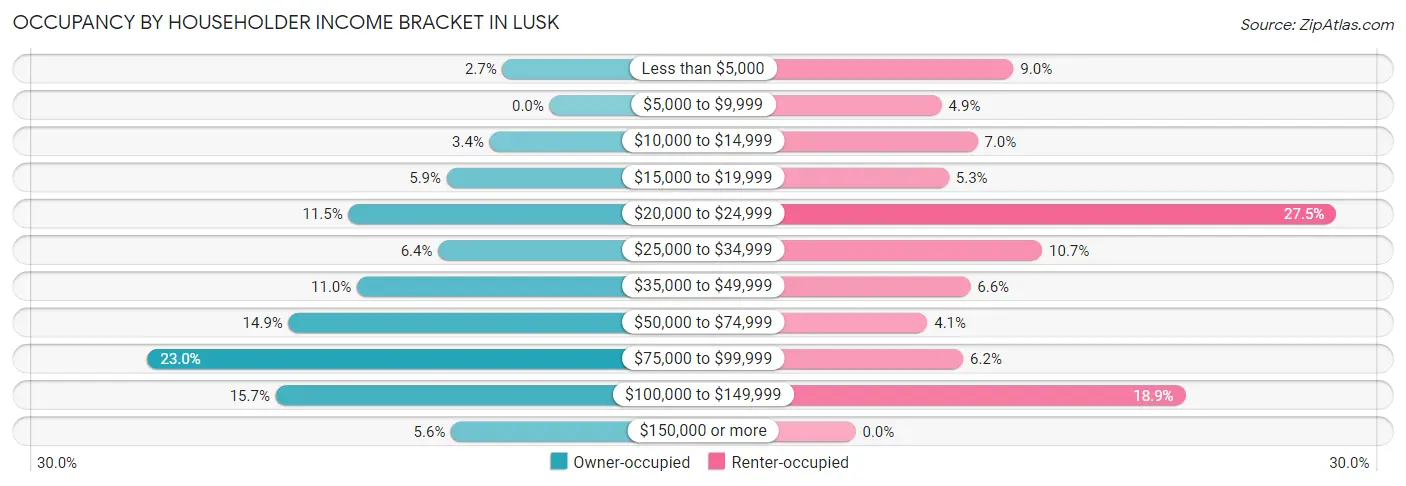
| Income Bracket | Owner-occupied | Renter-occupied |
| Less than $5,000 | 11 (2.7%) | 22 (9.0%) |
| $5,000 to $9,999 | 0 (0.0%) | 12 (4.9%) |
| $10,000 to $14,999 | 14 (3.4%) | 17 (7.0%) |
| $15,000 to $19,999 | 24 (5.9%) | 13 (5.3%) |
| $20,000 to $24,999 | 47 (11.5%) | 67 (27.5%) |
| $25,000 to $34,999 | 26 (6.4%) | 26 (10.7%) |
| $35,000 to $49,999 | 45 (11.0%) | 16 (6.6%) |
| $50,000 to $74,999 | 61 (14.9%) | 10 (4.1%) |
| $75,000 to $99,999 | 94 (23.0%) | 15 (6.1%) |
| $100,000 to $149,999 | 64 (15.7%) | 46 (18.9%) |
| $150,000 or more | 23 (5.6%) | 0 (0.0%) |
| Total | 409 (100.0%) | 244 (100.0%) |
Monthly Housing Cost Tiers in Lusk
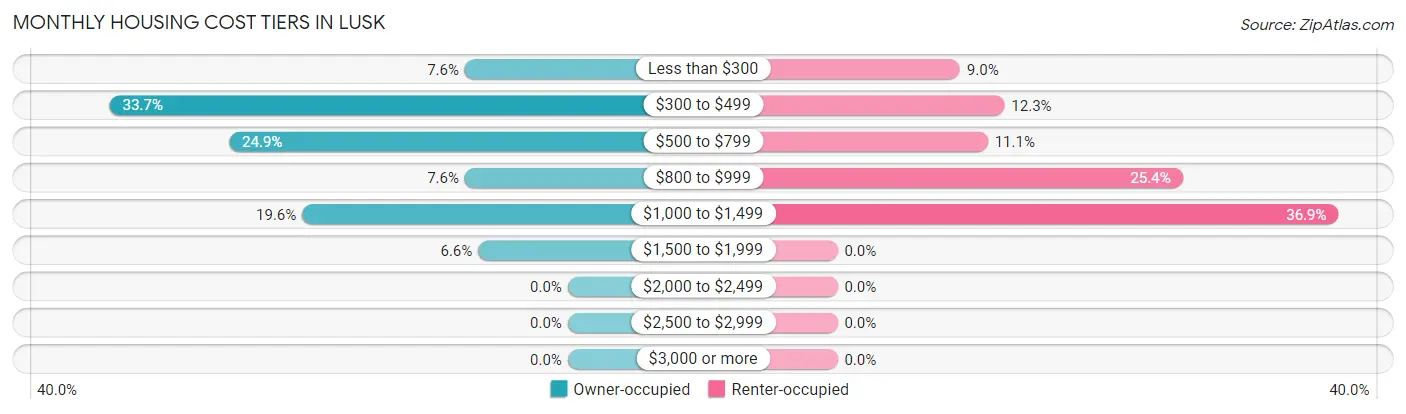
| Monthly Cost | Owner-occupied | Renter-occupied |
| Less than $300 | 31 (7.6%) | 22 (9.0%) |
| $300 to $499 | 138 (33.7%) | 30 (12.3%) |
| $500 to $799 | 102 (24.9%) | 27 (11.1%) |
| $800 to $999 | 31 (7.6%) | 62 (25.4%) |
| $1,000 to $1,499 | 80 (19.6%) | 90 (36.9%) |
| $1,500 to $1,999 | 27 (6.6%) | 0 (0.0%) |
| $2,000 to $2,499 | 0 (0.0%) | 0 (0.0%) |
| $2,500 to $2,999 | 0 (0.0%) | 0 (0.0%) |
| $3,000 or more | 0 (0.0%) | 0 (0.0%) |
| Total | 409 (100.0%) | 244 (100.0%) |
Physical Housing Characteristics in Lusk
Housing Structures in Lusk
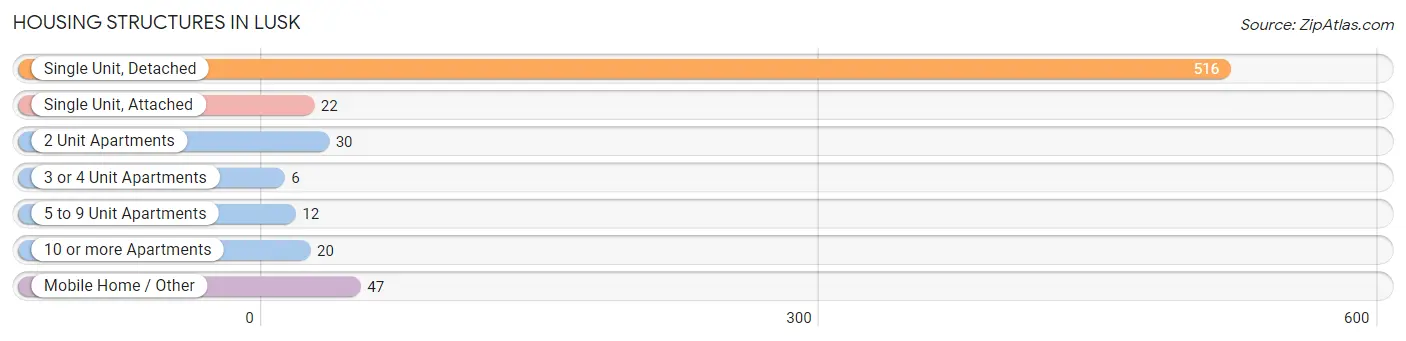
| Structure Type | # Housing Units | % Housing Units |
| Single Unit, Detached | 516 | 79.0% |
| Single Unit, Attached | 22 | 3.4% |
| 2 Unit Apartments | 30 | 4.6% |
| 3 or 4 Unit Apartments | 6 | 0.9% |
| 5 to 9 Unit Apartments | 12 | 1.8% |
| 10 or more Apartments | 20 | 3.1% |
| Mobile Home / Other | 47 | 7.2% |
| Total | 653 | 100.0% |
Housing Structures by Occupancy in Lusk
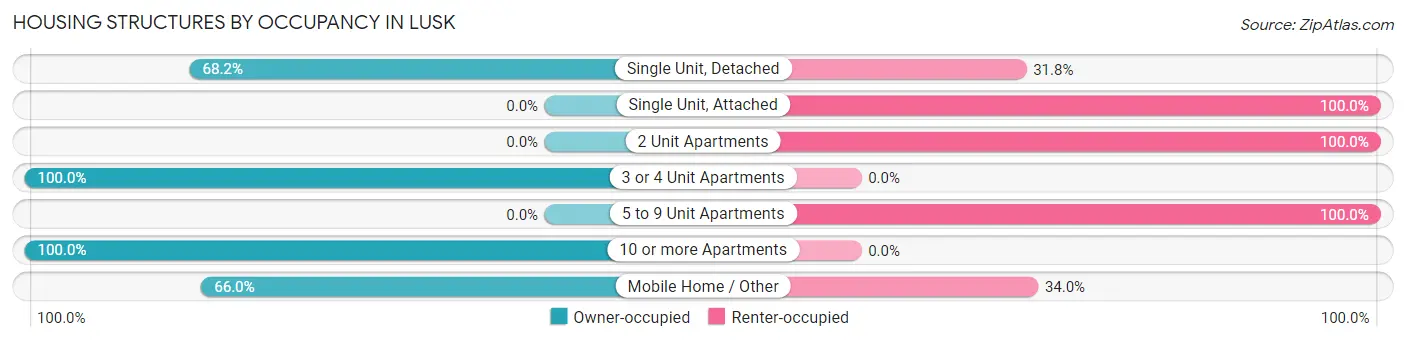
| Structure Type | Owner-occupied | Renter-occupied |
| Single Unit, Detached | 352 (68.2%) | 164 (31.8%) |
| Single Unit, Attached | 0 (0.0%) | 22 (100.0%) |
| 2 Unit Apartments | 0 (0.0%) | 30 (100.0%) |
| 3 or 4 Unit Apartments | 6 (100.0%) | 0 (0.0%) |
| 5 to 9 Unit Apartments | 0 (0.0%) | 12 (100.0%) |
| 10 or more Apartments | 20 (100.0%) | 0 (0.0%) |
| Mobile Home / Other | 31 (66.0%) | 16 (34.0%) |
| Total | 409 (62.6%) | 244 (37.4%) |
Housing Structures by Number of Rooms in Lusk
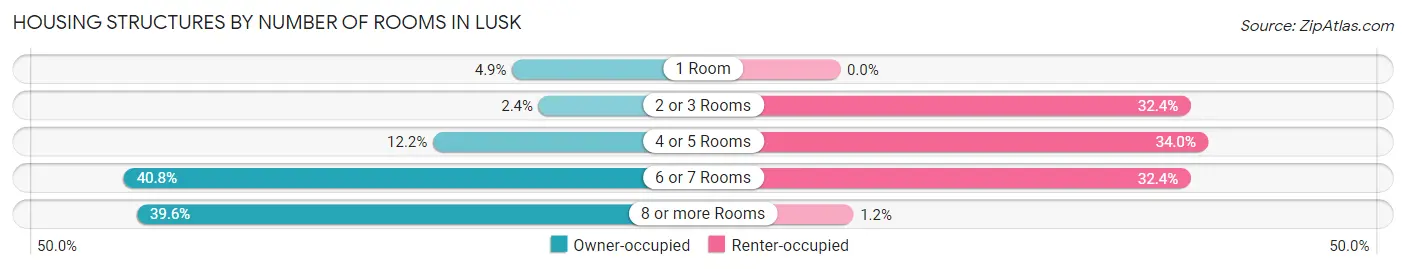
| Number of Rooms | Owner-occupied | Renter-occupied |
| 1 Room | 20 (4.9%) | 0 (0.0%) |
| 2 or 3 Rooms | 10 (2.4%) | 79 (32.4%) |
| 4 or 5 Rooms | 50 (12.2%) | 83 (34.0%) |
| 6 or 7 Rooms | 167 (40.8%) | 79 (32.4%) |
| 8 or more Rooms | 162 (39.6%) | 3 (1.2%) |
| Total | 409 (100.0%) | 244 (100.0%) |
Housing Structure by Heating Type in Lusk
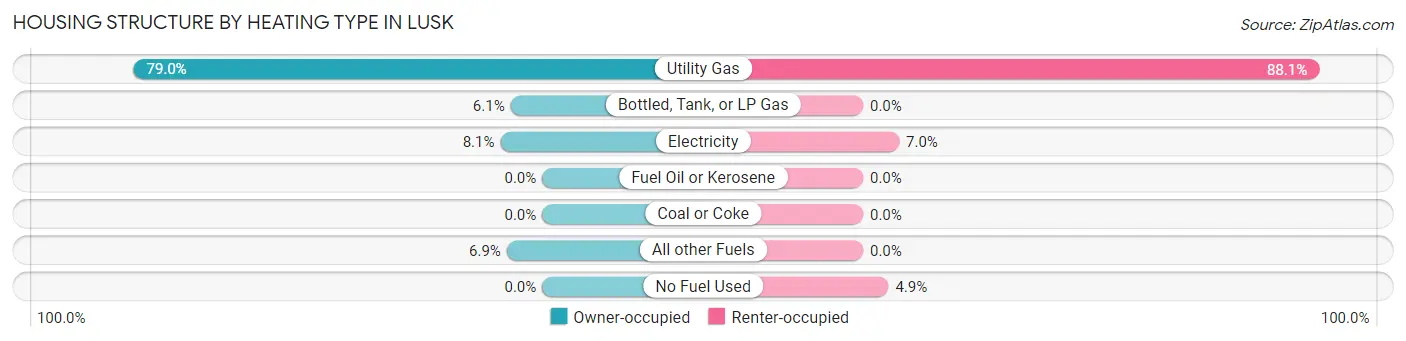
| Heating Type | Owner-occupied | Renter-occupied |
| Utility Gas | 323 (79.0%) | 215 (88.1%) |
| Bottled, Tank, or LP Gas | 25 (6.1%) | 0 (0.0%) |
| Electricity | 33 (8.1%) | 17 (7.0%) |
| Fuel Oil or Kerosene | 0 (0.0%) | 0 (0.0%) |
| Coal or Coke | 0 (0.0%) | 0 (0.0%) |
| All other Fuels | 28 (6.9%) | 0 (0.0%) |
| No Fuel Used | 0 (0.0%) | 12 (4.9%) |
| Total | 409 (100.0%) | 244 (100.0%) |
Household Vehicle Usage in Lusk
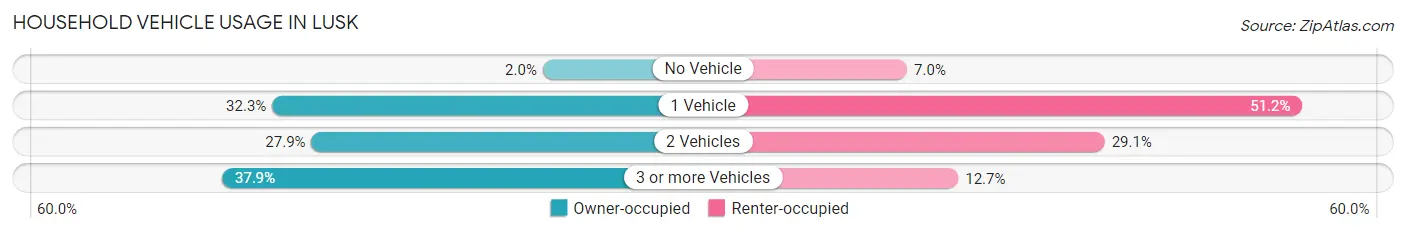
| Vehicles per Household | Owner-occupied | Renter-occupied |
| No Vehicle | 8 (2.0%) | 17 (7.0%) |
| 1 Vehicle | 132 (32.3%) | 125 (51.2%) |
| 2 Vehicles | 114 (27.9%) | 71 (29.1%) |
| 3 or more Vehicles | 155 (37.9%) | 31 (12.7%) |
| Total | 409 (100.0%) | 244 (100.0%) |
Real Estate & Mortgages in Lusk
Real Estate and Mortgage Overview in Lusk
| Characteristic | Without Mortgage | With Mortgage |
| Housing Units | 249 | 160 |
| Median Property Value | $216,500 | $132,500 |
| Median Household Income | $49,250 | $4 |
| Monthly Housing Costs | $425 | $0 |
| Real Estate Taxes | $798 | $0 |
Property Value by Mortgage Status in Lusk
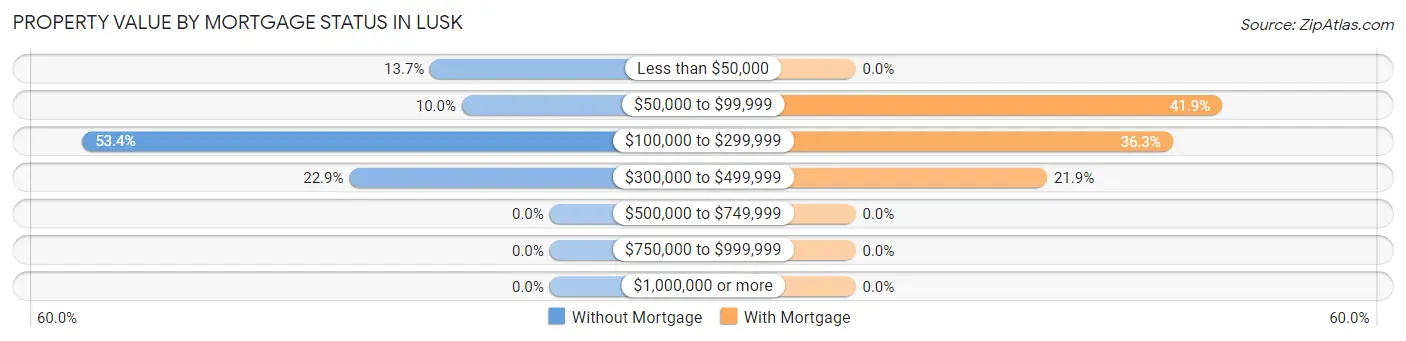
| Property Value | Without Mortgage | With Mortgage |
| Less than $50,000 | 34 (13.7%) | 0 (0.0%) |
| $50,000 to $99,999 | 25 (10.0%) | 67 (41.9%) |
| $100,000 to $299,999 | 133 (53.4%) | 58 (36.2%) |
| $300,000 to $499,999 | 57 (22.9%) | 35 (21.9%) |
| $500,000 to $749,999 | 0 (0.0%) | 0 (0.0%) |
| $750,000 to $999,999 | 0 (0.0%) | 0 (0.0%) |
| $1,000,000 or more | 0 (0.0%) | 0 (0.0%) |
| Total | 249 (100.0%) | 160 (100.0%) |
Household Income by Mortgage Status in Lusk
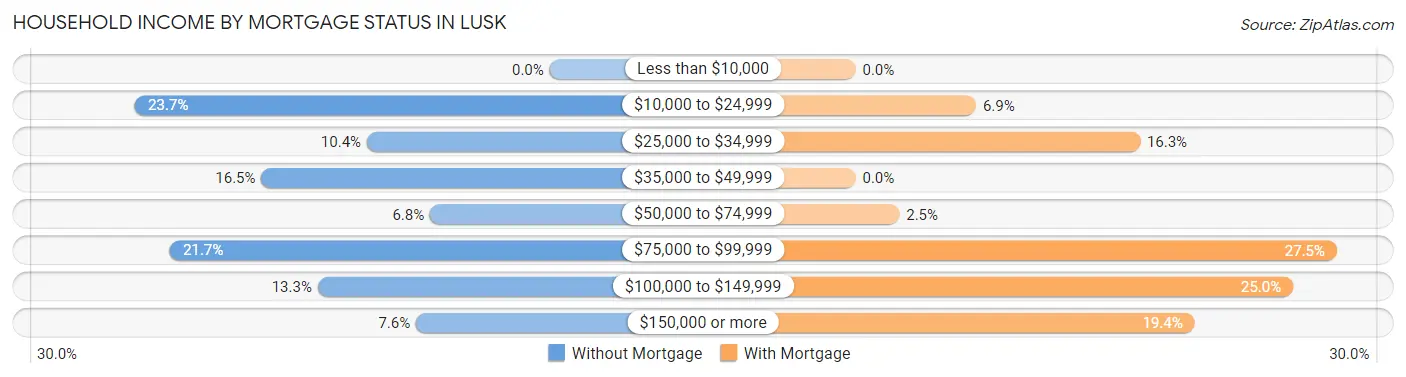
| Household Income | Without Mortgage | With Mortgage |
| Less than $10,000 | 0 (0.0%) | 0 (0.0%) |
| $10,000 to $24,999 | 59 (23.7%) | 11 (6.9%) |
| $25,000 to $34,999 | 26 (10.4%) | 26 (16.3%) |
| $35,000 to $49,999 | 41 (16.5%) | 0 (0.0%) |
| $50,000 to $74,999 | 17 (6.8%) | 4 (2.5%) |
| $75,000 to $99,999 | 54 (21.7%) | 44 (27.5%) |
| $100,000 to $149,999 | 33 (13.3%) | 40 (25.0%) |
| $150,000 or more | 19 (7.6%) | 31 (19.4%) |
| Total | 249 (100.0%) | 160 (100.0%) |
Property Value to Household Income Ratio in Lusk
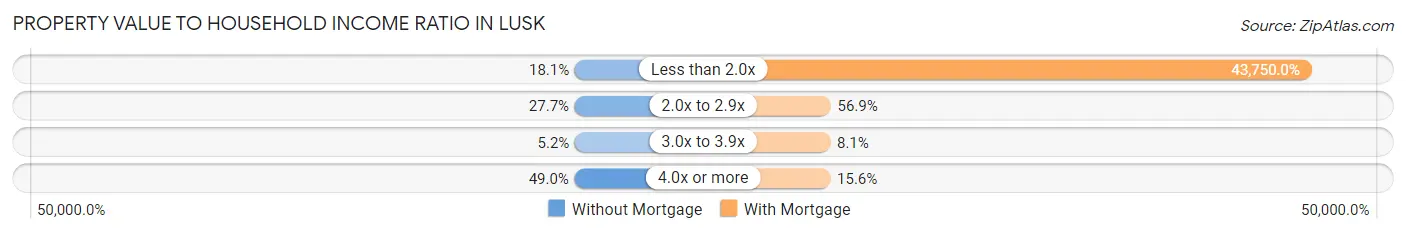
| Value-to-Income Ratio | Without Mortgage | With Mortgage |
| Less than 2.0x | 45 (18.1%) | 70,000 (43,750.0%) |
| 2.0x to 2.9x | 69 (27.7%) | 91 (56.9%) |
| 3.0x to 3.9x | 13 (5.2%) | 13 (8.1%) |
| 4.0x or more | 122 (49.0%) | 25 (15.6%) |
| Total | 249 (100.0%) | 160 (100.0%) |
Real Estate Taxes by Mortgage Status in Lusk
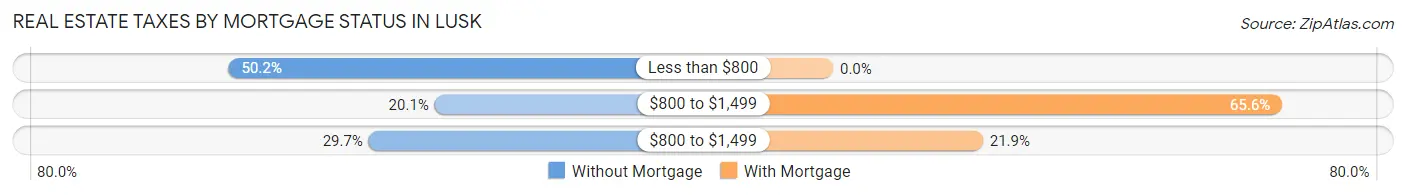
| Property Taxes | Without Mortgage | With Mortgage |
| Less than $800 | 125 (50.2%) | 0 (0.0%) |
| $800 to $1,499 | 50 (20.1%) | 105 (65.6%) |
| $800 to $1,499 | 74 (29.7%) | 35 (21.9%) |
| Total | 249 (100.0%) | 160 (100.0%) |
Health & Disability in Lusk
Health Insurance Coverage by Age in Lusk
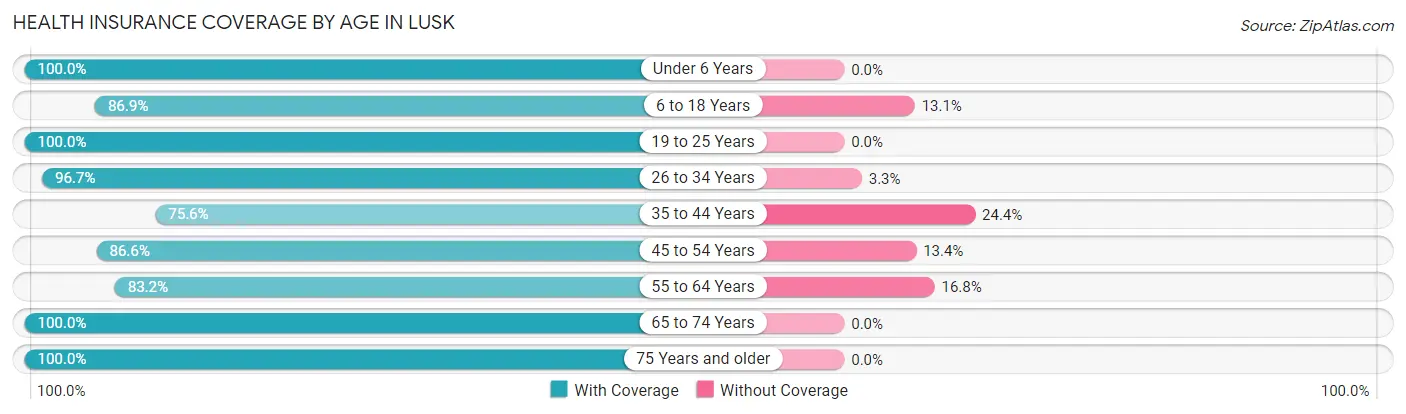
| Age Bracket | With Coverage | Without Coverage |
| Under 6 Years | 41 (100.0%) | 0 (0.0%) |
| 6 to 18 Years | 225 (86.9%) | 34 (13.1%) |
| 19 to 25 Years | 76 (100.0%) | 0 (0.0%) |
| 26 to 34 Years | 89 (96.7%) | 3 (3.3%) |
| 35 to 44 Years | 93 (75.6%) | 30 (24.4%) |
| 45 to 54 Years | 155 (86.6%) | 24 (13.4%) |
| 55 to 64 Years | 168 (83.2%) | 34 (16.8%) |
| 65 to 74 Years | 192 (100.0%) | 0 (0.0%) |
| 75 Years and older | 111 (100.0%) | 0 (0.0%) |
| Total | 1,150 (90.2%) | 125 (9.8%) |
Health Insurance Coverage by Citizenship Status in Lusk

| Citizenship Status | With Coverage | Without Coverage |
| Native Born | 41 (100.0%) | 0 (0.0%) |
| Foreign Born, Citizen | 225 (86.9%) | 34 (13.1%) |
| Foreign Born, not a Citizen | 76 (100.0%) | 0 (0.0%) |
Health Insurance Coverage by Household Income in Lusk
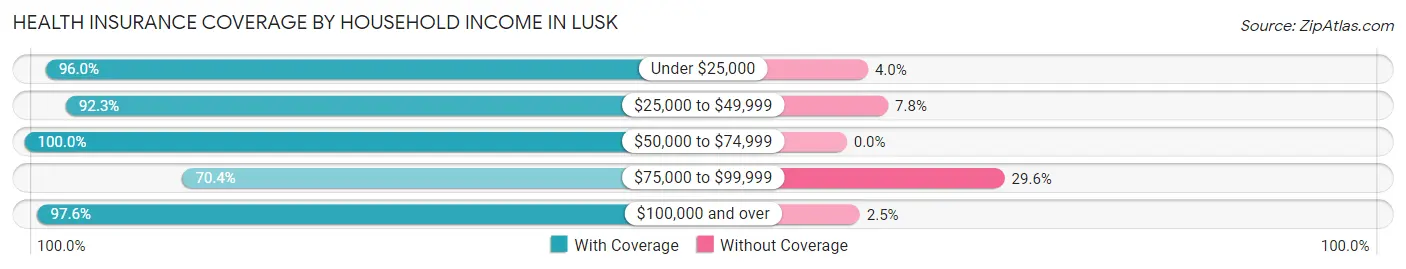
| Household Income | With Coverage | Without Coverage |
| Under $25,000 | 267 (96.0%) | 11 (4.0%) |
| $25,000 to $49,999 | 262 (92.2%) | 22 (7.7%) |
| $50,000 to $74,999 | 102 (100.0%) | 0 (0.0%) |
| $75,000 to $99,999 | 200 (70.4%) | 84 (29.6%) |
| $100,000 and over | 319 (97.6%) | 8 (2.5%) |
Public vs Private Health Insurance Coverage by Age in Lusk
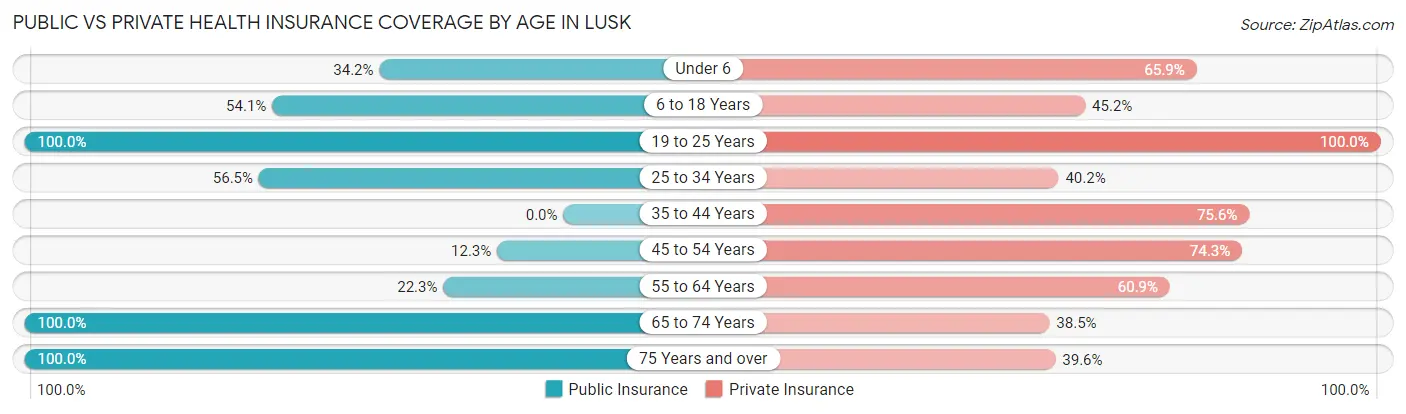
| Age Bracket | Public Insurance | Private Insurance |
| Under 6 | 14 (34.2%) | 27 (65.8%) |
| 6 to 18 Years | 140 (54.0%) | 117 (45.2%) |
| 19 to 25 Years | 76 (100.0%) | 76 (100.0%) |
| 25 to 34 Years | 52 (56.5%) | 37 (40.2%) |
| 35 to 44 Years | 0 (0.0%) | 93 (75.6%) |
| 45 to 54 Years | 22 (12.3%) | 133 (74.3%) |
| 55 to 64 Years | 45 (22.3%) | 123 (60.9%) |
| 65 to 74 Years | 192 (100.0%) | 74 (38.5%) |
| 75 Years and over | 111 (100.0%) | 44 (39.6%) |
| Total | 652 (51.1%) | 724 (56.8%) |
Disability Status by Sex by Age in Lusk
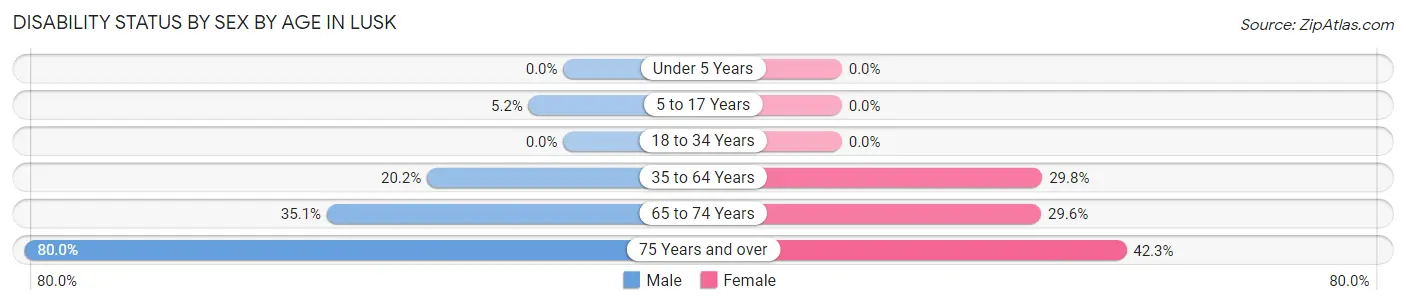
| Age Bracket | Male | Female |
| Under 5 Years | 0 (0.0%) | 0 (0.0%) |
| 5 to 17 Years | 7 (5.1%) | 0 (0.0%) |
| 18 to 34 Years | 0 (0.0%) | 0 (0.0%) |
| 35 to 64 Years | 51 (20.2%) | 75 (29.8%) |
| 65 to 74 Years | 33 (35.1%) | 29 (29.6%) |
| 75 Years and over | 32 (80.0%) | 30 (42.2%) |
Disability Class by Sex by Age in Lusk
Disability Class: Hearing Difficulty
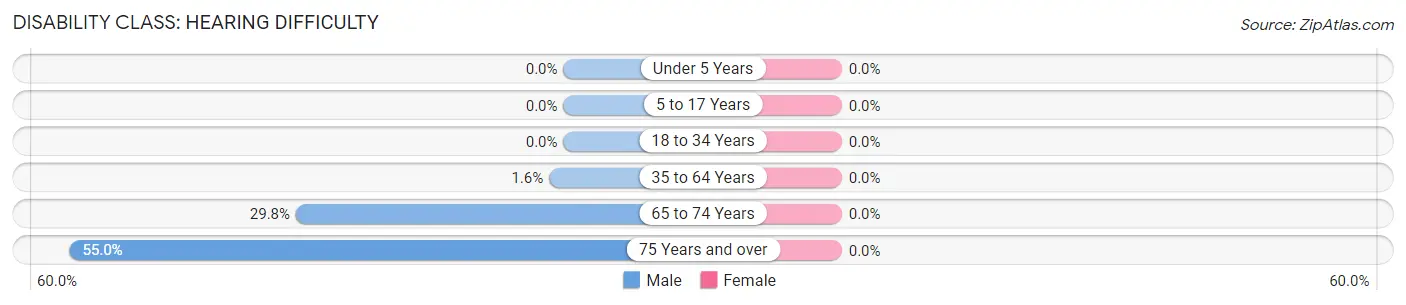
| Age Bracket | Male | Female |
| Under 5 Years | 0 (0.0%) | 0 (0.0%) |
| 5 to 17 Years | 0 (0.0%) | 0 (0.0%) |
| 18 to 34 Years | 0 (0.0%) | 0 (0.0%) |
| 35 to 64 Years | 4 (1.6%) | 0 (0.0%) |
| 65 to 74 Years | 28 (29.8%) | 0 (0.0%) |
| 75 Years and over | 22 (55.0%) | 0 (0.0%) |
Disability Class: Vision Difficulty
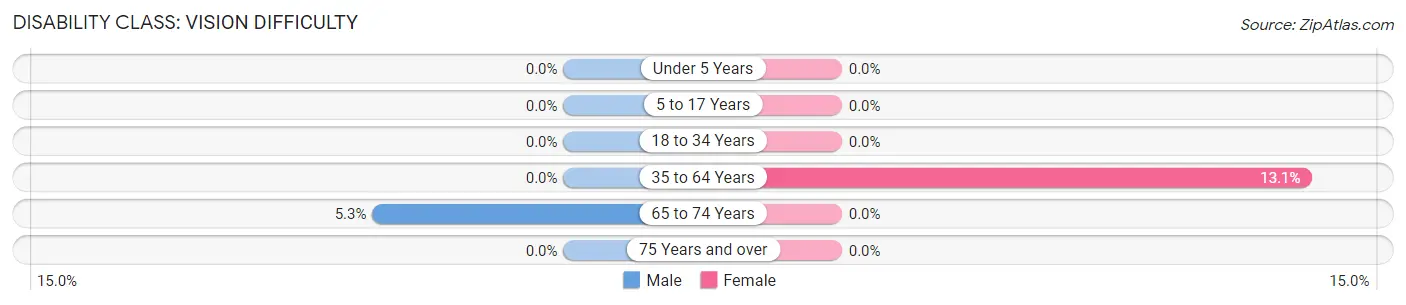
| Age Bracket | Male | Female |
| Under 5 Years | 0 (0.0%) | 0 (0.0%) |
| 5 to 17 Years | 0 (0.0%) | 0 (0.0%) |
| 18 to 34 Years | 0 (0.0%) | 0 (0.0%) |
| 35 to 64 Years | 0 (0.0%) | 33 (13.1%) |
| 65 to 74 Years | 5 (5.3%) | 0 (0.0%) |
| 75 Years and over | 0 (0.0%) | 0 (0.0%) |
Disability Class: Cognitive Difficulty
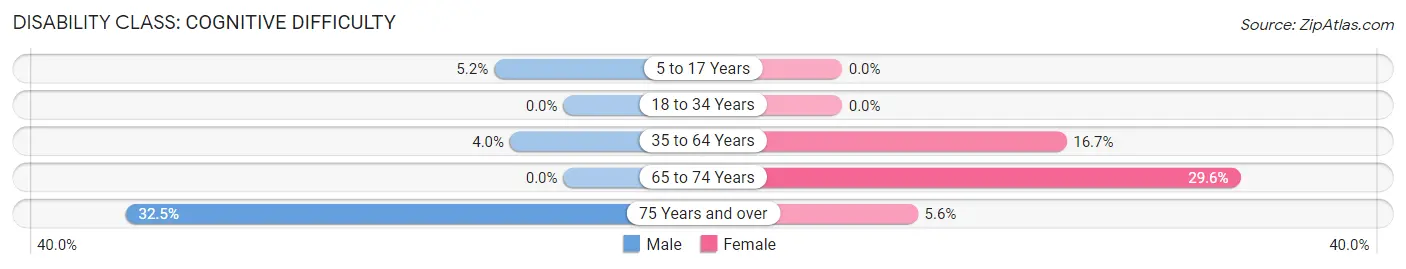
| Age Bracket | Male | Female |
| 5 to 17 Years | 7 (5.1%) | 0 (0.0%) |
| 18 to 34 Years | 0 (0.0%) | 0 (0.0%) |
| 35 to 64 Years | 10 (4.0%) | 42 (16.7%) |
| 65 to 74 Years | 0 (0.0%) | 29 (29.6%) |
| 75 Years and over | 13 (32.5%) | 4 (5.6%) |
Disability Class: Ambulatory Difficulty
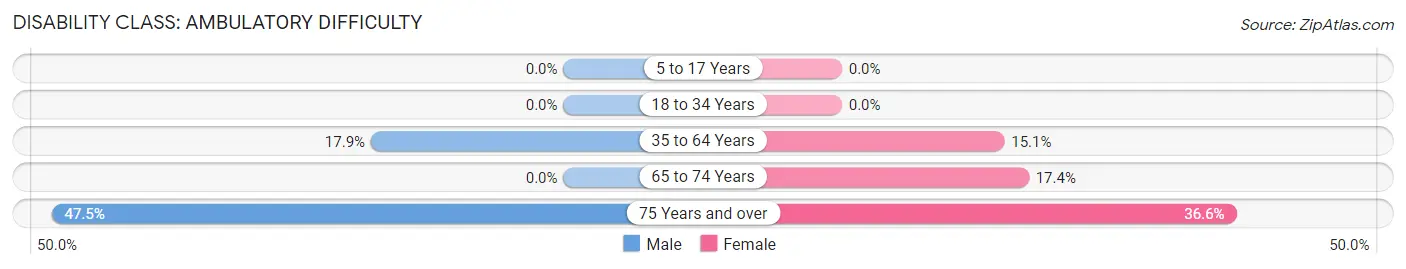
| Age Bracket | Male | Female |
| 5 to 17 Years | 0 (0.0%) | 0 (0.0%) |
| 18 to 34 Years | 0 (0.0%) | 0 (0.0%) |
| 35 to 64 Years | 45 (17.9%) | 38 (15.1%) |
| 65 to 74 Years | 0 (0.0%) | 17 (17.3%) |
| 75 Years and over | 19 (47.5%) | 26 (36.6%) |
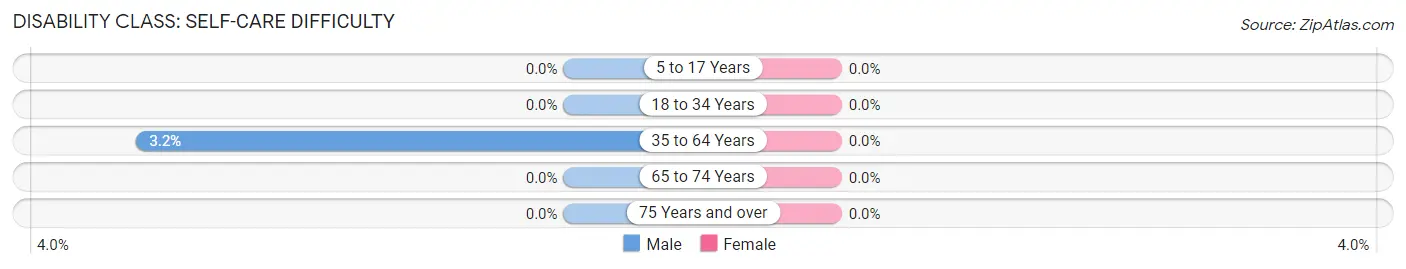
Disability Class: Self-Care Difficulty
| Age Bracket | Male | Female |
| 5 to 17 Years | 0 (0.0%) | 0 (0.0%) |
| 18 to 34 Years | 0 (0.0%) | 0 (0.0%) |
| 35 to 64 Years | 8 (3.2%) | 0 (0.0%) |
| 65 to 74 Years | 0 (0.0%) | 0 (0.0%) |
| 75 Years and over | 0 (0.0%) | 0 (0.0%) |
Technology Access in Lusk
Computing Device Access in Lusk
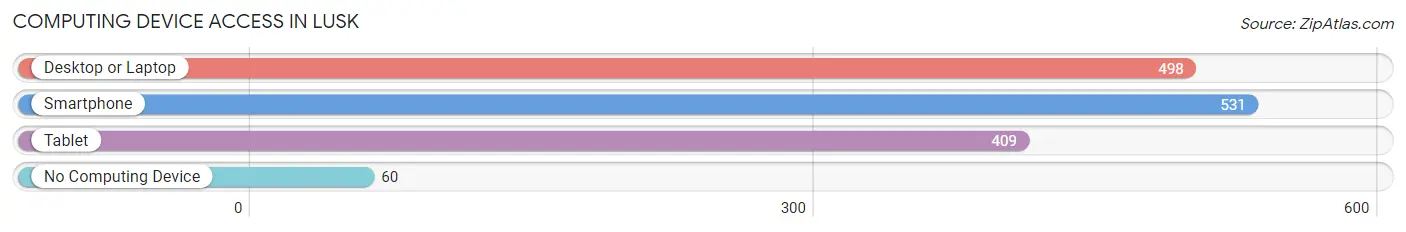
| Device Type | # Households | % Households |
| Desktop or Laptop | 498 | 76.3% |
| Smartphone | 531 | 81.3% |
| Tablet | 409 | 62.6% |
| No Computing Device | 60 | 9.2% |
| Total | 653 | 100.0% |
Internet Access in Lusk
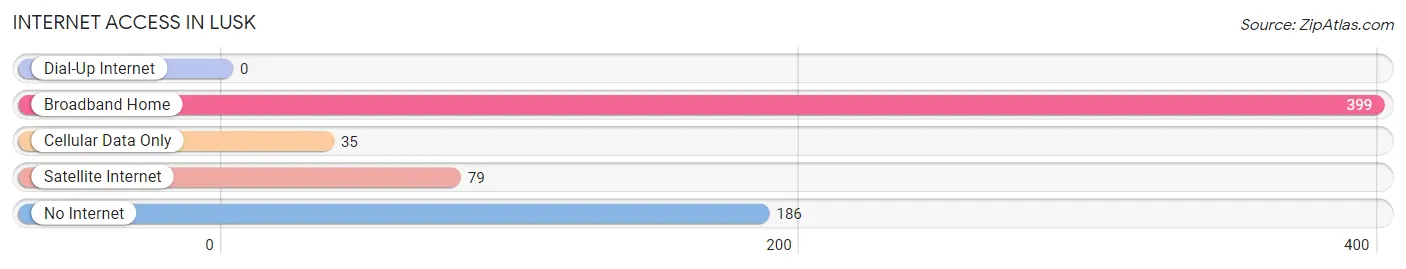
| Internet Type | # Households | % Households |
| Dial-Up Internet | 0 | 0.0% |
| Broadband Home | 399 | 61.1% |
| Cellular Data Only | 35 | 5.4% |
| Satellite Internet | 79 | 12.1% |
| No Internet | 186 | 28.5% |
| Total | 653 | 100.0% |
Lusk Summary
Lusk is a small town located in the northeastern corner of Wyoming, in the United States. It is the county seat of Niobrara County and is situated on the banks of the Niobrara River. The town was founded in 1886 and has a population of 1,400 people as of the 2010 census.
History
Lusk was founded in 1886 by a group of settlers from Nebraska. The town was named after Frank Lusk, a prominent rancher in the area. The town was incorporated in 1890 and quickly became a hub for the surrounding ranching and farming communities. The town was also a major stop on the Chicago, Burlington and Quincy Railroad, which ran through the area.
In the early 1900s, Lusk experienced a period of growth and prosperity. The town was home to several businesses, including a bank, a hotel, a newspaper, and a variety of stores. The town also had a school, a library, and a hospital.
In the 1920s, the town experienced a period of decline as the railroad industry began to decline. The Great Depression further exacerbated the town’s economic woes. However, the town was able to survive and eventually began to experience a period of growth in the 1950s and 1960s.
Geography
Lusk is located in the northeastern corner of Wyoming, in the United States. It is situated on the banks of the Niobrara River, which flows through the town. The town is located in the High Plains region of the state, and is surrounded by rolling hills and grasslands. The town is located approximately 60 miles from the state capital of Cheyenne.
Economy
The economy of Lusk is largely based on agriculture and ranching. The town is home to several large ranches, which produce beef, sheep, and other livestock. The town is also home to several small businesses, including restaurants, stores, and other services.
The town is also home to several oil and gas companies, which are involved in the exploration and production of oil and gas in the area. The town is also home to several wind farms, which generate electricity for the region.
Demographics
As of the 2010 census, the population of Lusk was 1,400 people. The town is predominantly white, with a small Hispanic population. The median household income in the town is $41,000, and the median home value is $90,000. The town has a low unemployment rate of 3.2%.
Conclusion
Lusk is a small town located in the northeastern corner of Wyoming, in the United States. It was founded in 1886 and has a population of 1,400 people as of the 2010 census. The town’s economy is largely based on agriculture and ranching, and it is also home to several oil and gas companies and wind farms. The town is predominantly white, with a small Hispanic population, and has a median household income of $41,000 and a median home value of $90,000.
Common Questions
What is Per Capita Income in Lusk?
Per Capita income in Lusk is $25,542.
What is the Median Family Income in Lusk?
Median Family Income in Lusk is $81,250.
What is the Median Household income in Lusk?
Median Household Income in Lusk is $46,797.
What is Income or Wage Gap in Lusk?
Income or Wage Gap in Lusk is 54.7%.
Women in Lusk earn 45.3 cents for every dollar earned by a man.
What is Inequality or Gini Index in Lusk?
Inequality or Gini Index in Lusk is 0.43.
What is the Total Population of Lusk?
Total Population of Lusk is 1,505.
What is the Total Male Population of Lusk?
Total Male Population of Lusk is 582.
What is the Total Female Population of Lusk?
Total Female Population of Lusk is 923.
What is the Ratio of Males per 100 Females in Lusk?
There are 63.06 Males per 100 Females in Lusk.
What is the Ratio of Females per 100 Males in Lusk?
There are 158.59 Females per 100 Males in Lusk.
What is the Median Population Age in Lusk?
Median Population Age in Lusk is 43.8 Years.
What is the Average Family Size in Lusk
Average Family Size in Lusk is 2.7 People.
What is the Average Household Size in Lusk
Average Household Size in Lusk is 1.9 People.
How Large is the Labor Force in Lusk?
There are 669 People in the Labor Forcein in Lusk.
What is the Percentage of People in the Labor Force in Lusk?
53.1% of People are in the Labor Force in Lusk.
What is the Unemployment Rate in Lusk?
Unemployment Rate in Lusk is 9.3%.