Lovell, WY Map & Demographics
Lovell Map
Lovell Overview
$32,268
PER CAPITA INCOME
$83,333
AVG FAMILY INCOME
$58,229
AVG HOUSEHOLD INCOME
47.3%
WAGE / INCOME GAP [ % ]
52.7¢/ $1
WAGE / INCOME GAP [ $ ]
0.41
INEQUALITY / GINI INDEX
2,178
TOTAL POPULATION
1,171
MALE POPULATION
1,007
FEMALE POPULATION
116.29
MALES / 100 FEMALES
85.99
FEMALES / 100 MALES
40.1
MEDIAN AGE
3.3
AVG FAMILY SIZE
2.5
AVG HOUSEHOLD SIZE
966
LABOR FORCE [ PEOPLE ]
58.6%
PERCENT IN LABOR FORCE
2.9%
UNEMPLOYMENT RATE
Lovell Zip Codes
Lovell Area Codes
Income in Lovell
Income Overview in Lovell
Per Capita Income in Lovell is $32,268, while median incomes of families and households are $83,333 and $58,229 respectively.
| Characteristic | Number | Measure |
| Per Capita Income | 2,178 | $32,268 |
| Median Family Income | 510 | $83,333 |
| Mean Family Income | 510 | $97,227 |
| Median Household Income | 855 | $58,229 |
| Mean Household Income | 855 | $75,998 |
| Income Deficit | 510 | $0 |
| Wage / Income Gap (%) | 2,178 | 47.32% |
| Wage / Income Gap ($) | 2,178 | 52.68¢ per $1 |
| Gini / Inequality Index | 2,178 | 0.41 |
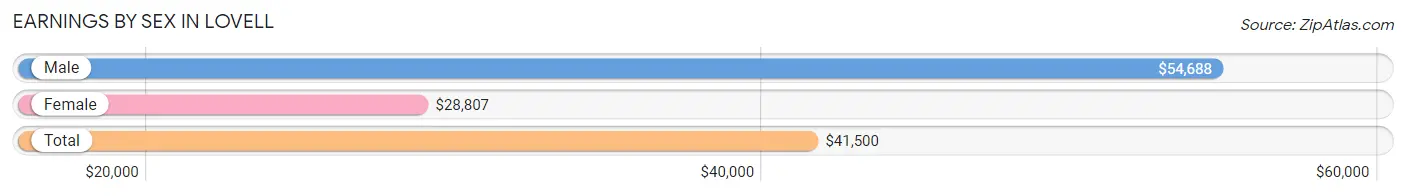
Earnings by Sex in Lovell
Average Earnings in Lovell are $41,500, $54,688 for men and $28,807 for women, a difference of 47.3%.
| Sex | Number | Average Earnings |
| Male | 579 (56.4%) | $54,688 |
| Female | 447 (43.6%) | $28,807 |
| Total | 1,026 (100.0%) | $41,500 |
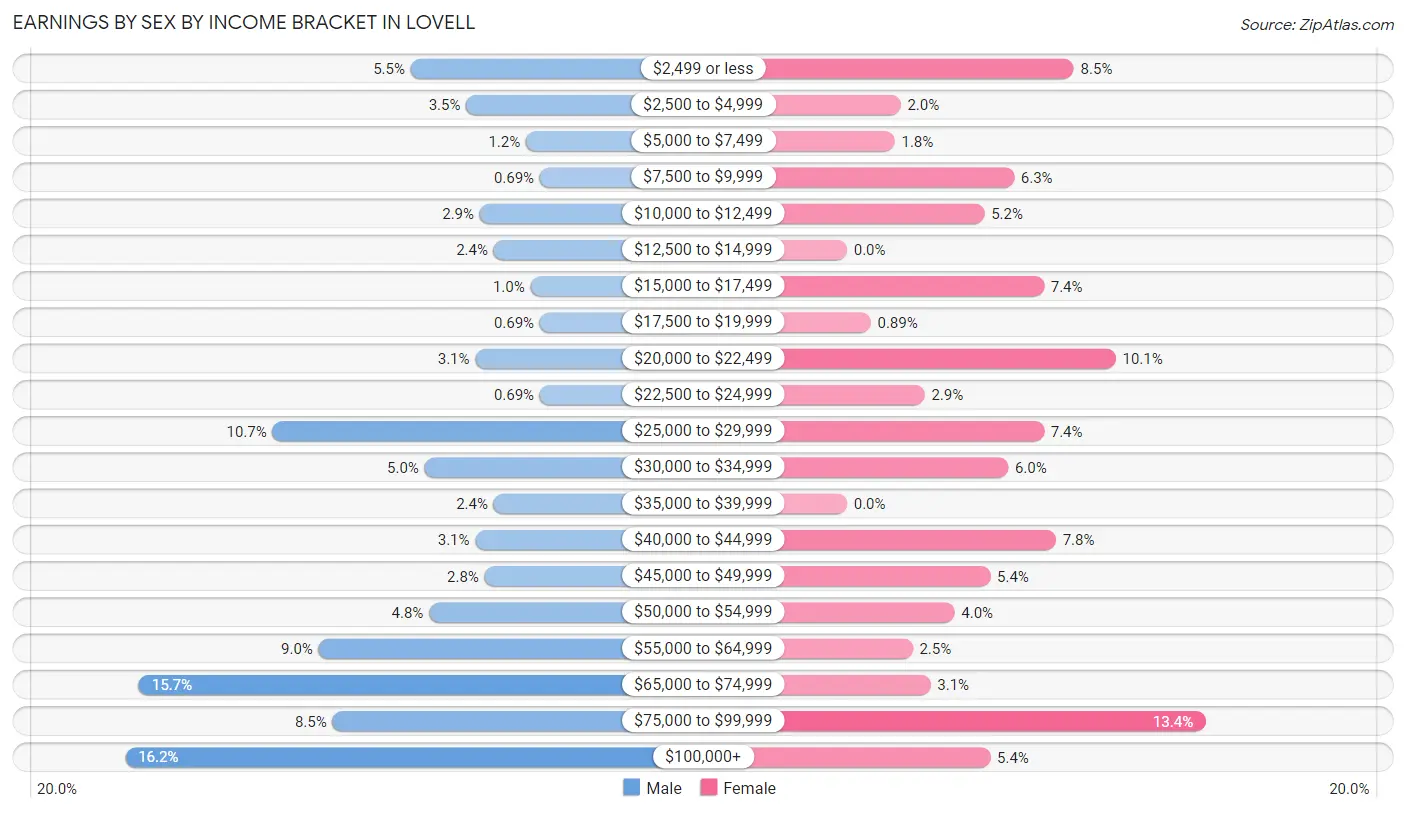
Earnings by Sex by Income Bracket in Lovell
The most common earnings brackets in Lovell are $100,000+ for men (94 | 16.2%) and $75,000 to $99,999 for women (60 | 13.4%).
| Income | Male | Female |
| $2,499 or less | 32 (5.5%) | 38 (8.5%) |
| $2,500 to $4,999 | 20 (3.5%) | 9 (2.0%) |
| $5,000 to $7,499 | 7 (1.2%) | 8 (1.8%) |
| $7,500 to $9,999 | 4 (0.7%) | 28 (6.3%) |
| $10,000 to $12,499 | 17 (2.9%) | 23 (5.1%) |
| $12,500 to $14,999 | 14 (2.4%) | 0 (0.0%) |
| $15,000 to $17,499 | 6 (1.0%) | 33 (7.4%) |
| $17,500 to $19,999 | 4 (0.7%) | 4 (0.9%) |
| $20,000 to $22,499 | 18 (3.1%) | 45 (10.1%) |
| $22,500 to $24,999 | 4 (0.7%) | 13 (2.9%) |
| $25,000 to $29,999 | 62 (10.7%) | 33 (7.4%) |
| $30,000 to $34,999 | 29 (5.0%) | 27 (6.0%) |
| $35,000 to $39,999 | 14 (2.4%) | 0 (0.0%) |
| $40,000 to $44,999 | 18 (3.1%) | 35 (7.8%) |
| $45,000 to $49,999 | 16 (2.8%) | 24 (5.4%) |
| $50,000 to $54,999 | 28 (4.8%) | 18 (4.0%) |
| $55,000 to $64,999 | 52 (9.0%) | 11 (2.5%) |
| $65,000 to $74,999 | 91 (15.7%) | 14 (3.1%) |
| $75,000 to $99,999 | 49 (8.5%) | 60 (13.4%) |
| $100,000+ | 94 (16.2%) | 24 (5.4%) |
| Total | 579 (100.0%) | 447 (100.0%) |
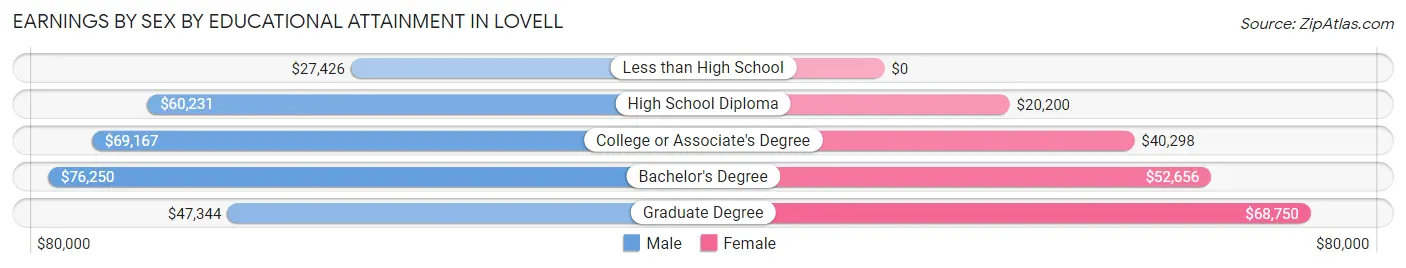
Earnings by Sex by Educational Attainment in Lovell
Average earnings in Lovell are $61,417 for men and $31,563 for women, a difference of 48.6%. Men with an educational attainment of bachelor's degree enjoy the highest average annual earnings of $76,250, while those with less than high school education earn the least with $27,426. Women with an educational attainment of graduate degree earn the most with the average annual earnings of $68,750, while those with high school diploma education have the smallest earnings of $20,200.
| Educational Attainment | Male Income | Female Income |
| Less than High School | $27,426 | $0 |
| High School Diploma | $60,231 | $20,200 |
| College or Associate's Degree | $69,167 | $40,298 |
| Bachelor's Degree | $76,250 | $52,656 |
| Graduate Degree | $47,344 | $68,750 |
| Total | $61,417 | $31,563 |
Family Income in Lovell
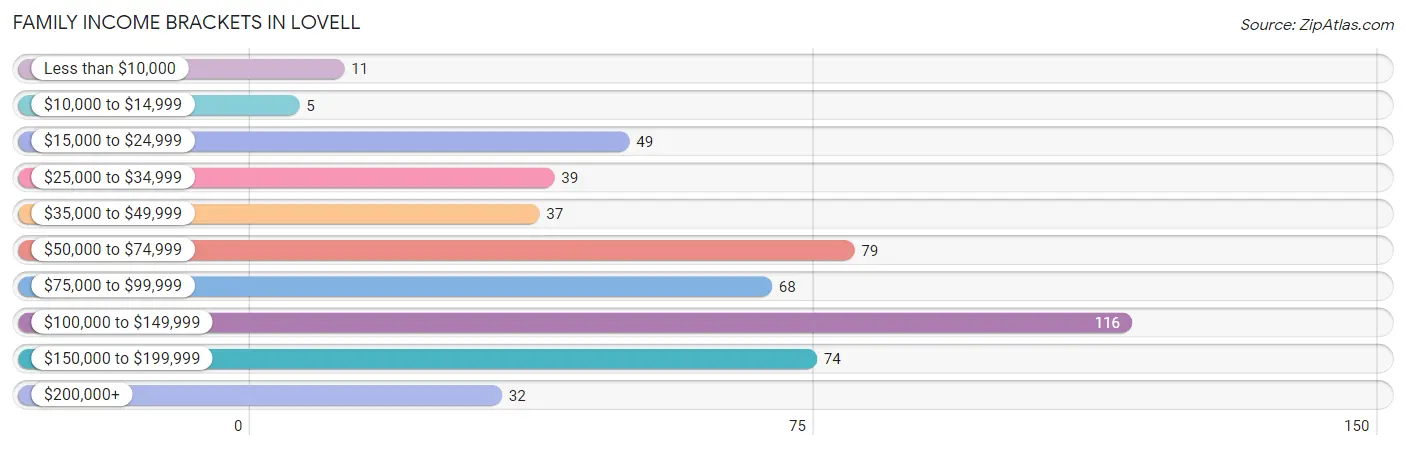
Family Income Brackets in Lovell
According to the Lovell family income data, there are 116 families falling into the $100,000 to $149,999 income range, which is the most common income bracket and makes up 22.8% of all families. Conversely, the $10,000 to $14,999 income bracket is the least frequent group with only 5 families (1.0%) belonging to this category.
| Income Bracket | # Families | % Families |
| Less than $10,000 | 11 | 2.2% |
| $10,000 to $14,999 | 5 | 1.0% |
| $15,000 to $24,999 | 49 | 9.6% |
| $25,000 to $34,999 | 39 | 7.6% |
| $35,000 to $49,999 | 37 | 7.3% |
| $50,000 to $74,999 | 79 | 15.5% |
| $75,000 to $99,999 | 68 | 13.3% |
| $100,000 to $149,999 | 116 | 22.7% |
| $150,000 to $199,999 | 74 | 14.5% |
| $200,000+ | 32 | 6.3% |
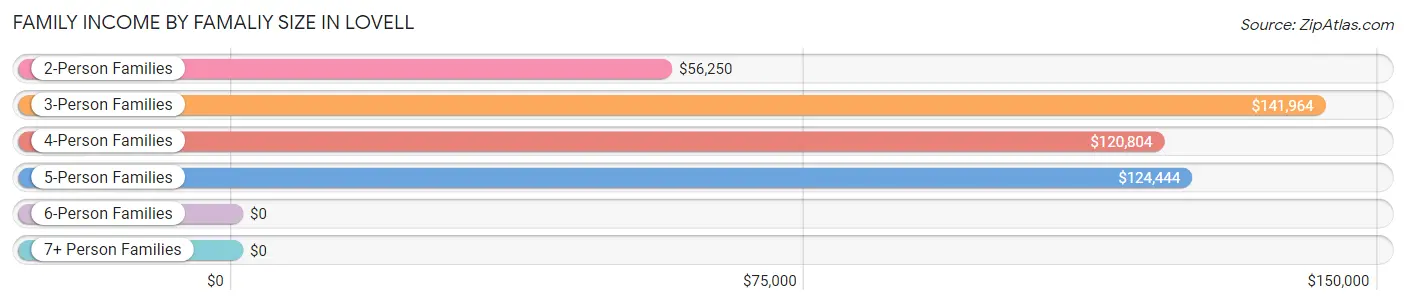
Family Income by Famaliy Size in Lovell
3-person families (63 | 12.3%) account for the highest median family income in Lovell with $141,964 per family, while 3-person families (63 | 12.3%) have the highest median income of $47,321 per family member.
| Income Bracket | # Families | Median Income |
| 2-Person Families | 249 (48.8%) | $56,250 |
| 3-Person Families | 63 (12.3%) | $141,964 |
| 4-Person Families | 119 (23.3%) | $120,804 |
| 5-Person Families | 68 (13.3%) | $124,444 |
| 6-Person Families | 0 (0.0%) | $0 |
| 7+ Person Families | 11 (2.2%) | $0 |
| Total | 510 (100.0%) | $83,333 |
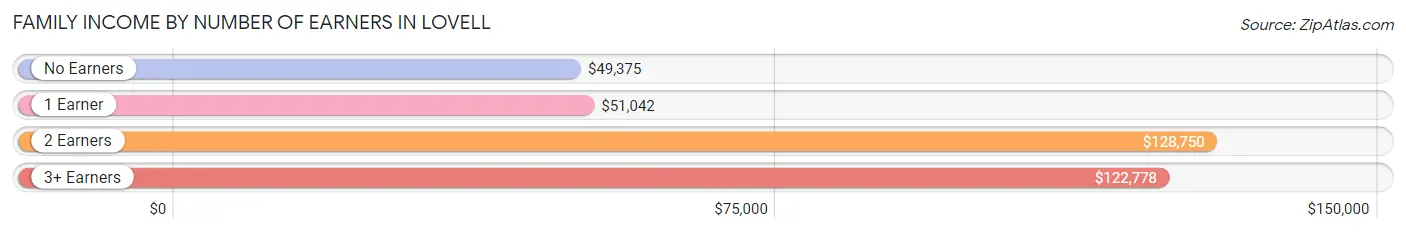
Family Income by Number of Earners in Lovell
The median family income in Lovell is $83,333, with families comprising 2 earners (232) having the highest median family income of $128,750, while families with no earners (55) have the lowest median family income of $49,375, accounting for 45.5% and 10.8% of families, respectively.
| Number of Earners | # Families | Median Income |
| No Earners | 55 (10.8%) | $49,375 |
| 1 Earner | 183 (35.9%) | $51,042 |
| 2 Earners | 232 (45.5%) | $128,750 |
| 3+ Earners | 40 (7.8%) | $122,778 |
| Total | 510 (100.0%) | $83,333 |
Household Income in Lovell
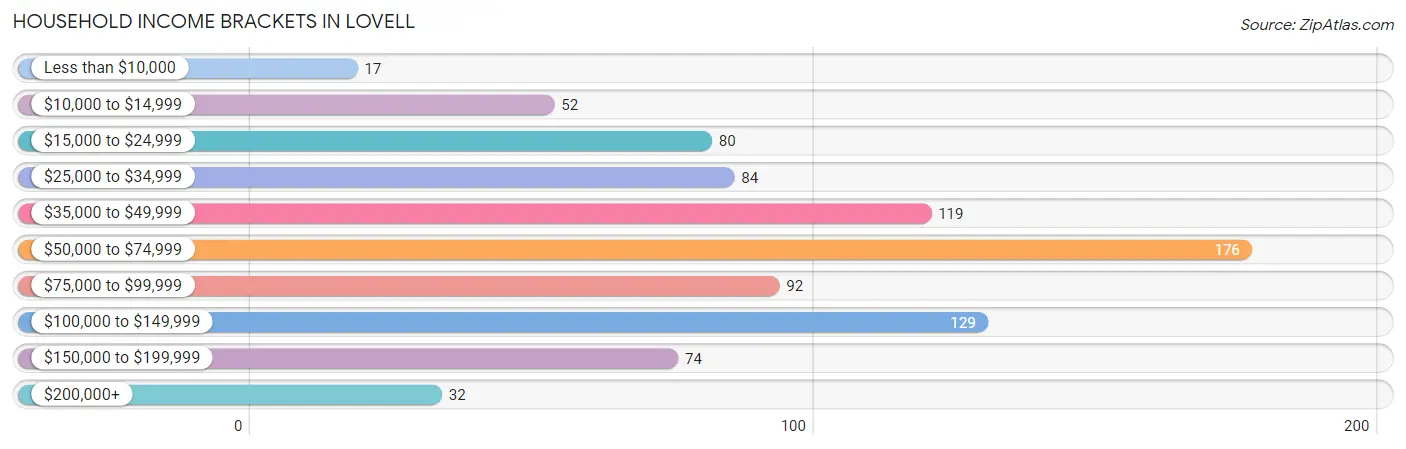
Household Income Brackets in Lovell
With 176 households falling in the category, the $50,000 to $74,999 income range is the most frequent in Lovell, accounting for 20.6% of all households. In contrast, only 17 households (2.0%) fall into the less than $10,000 income bracket, making it the least populous group.
| Income Bracket | # Households | % Households |
| Less than $10,000 | 17 | 2.0% |
| $10,000 to $14,999 | 52 | 6.1% |
| $15,000 to $24,999 | 80 | 9.4% |
| $25,000 to $34,999 | 84 | 9.8% |
| $35,000 to $49,999 | 119 | 13.9% |
| $50,000 to $74,999 | 176 | 20.6% |
| $75,000 to $99,999 | 92 | 10.8% |
| $100,000 to $149,999 | 129 | 15.1% |
| $150,000 to $199,999 | 74 | 8.7% |
| $200,000+ | 32 | 3.7% |
Household Income by Householder Age in Lovell
The median household income in Lovell is $58,229, with the highest median household income of $90,000 found in the 25 to 44 years age bracket for the primary householder. A total of 306 households (35.8%) fall into this category. Meanwhile, the 15 to 24 years age bracket for the primary householder has the lowest median household income of $0, with 16 households (1.9%) in this group.
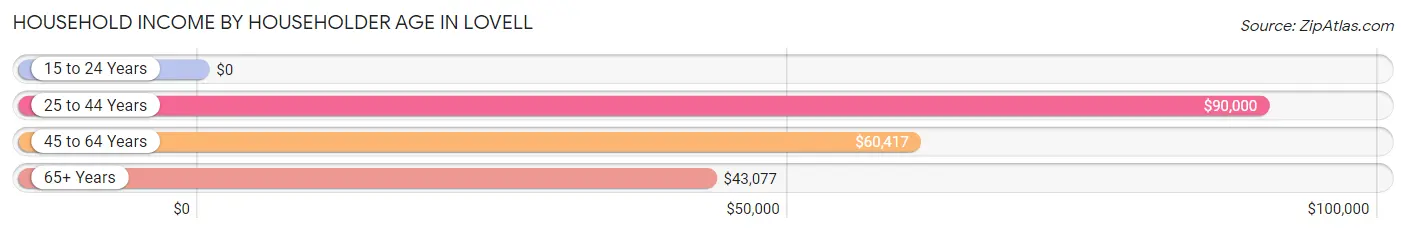
| Income Bracket | # Households | Median Income |
| 15 to 24 Years | 16 (1.9%) | $0 |
| 25 to 44 Years | 306 (35.8%) | $90,000 |
| 45 to 64 Years | 215 (25.2%) | $60,417 |
| 65+ Years | 318 (37.2%) | $43,077 |
| Total | 855 (100.0%) | $58,229 |
Poverty in Lovell
Income Below Poverty by Sex and Age in Lovell
With 7.6% poverty level for males and 19.0% for females among the residents of Lovell, under 5 year old males and 55 to 64 year old females are the most vulnerable to poverty, with 17 males (26.2%) and 38 females (30.2%) in their respective age groups living below the poverty level.
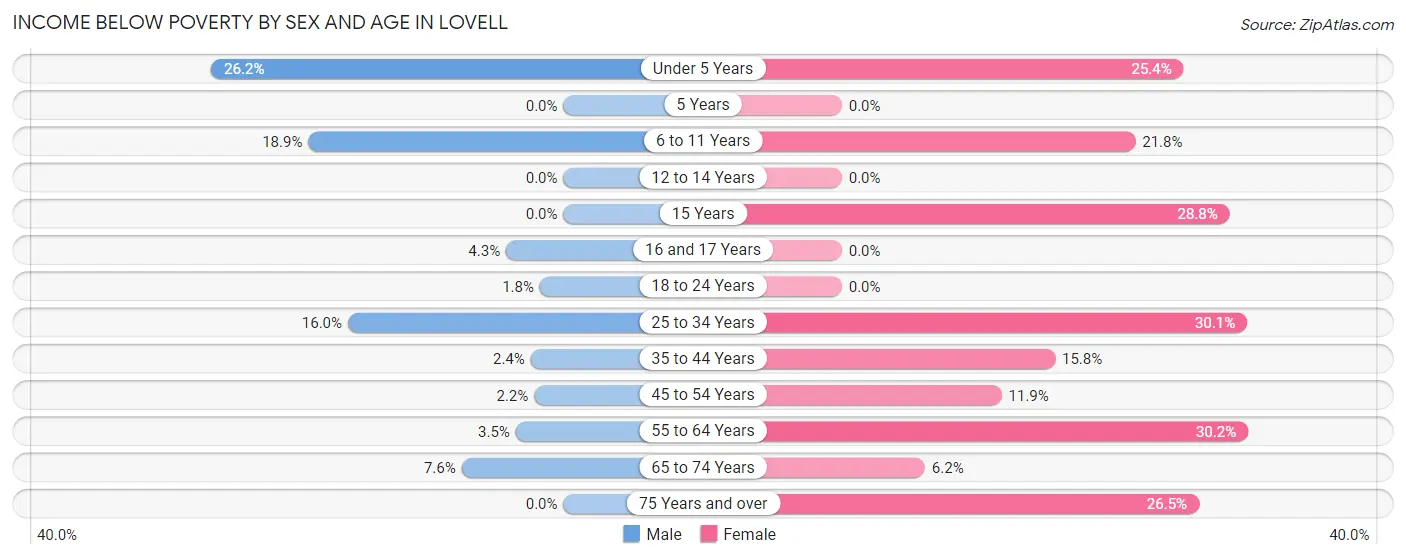
| Age Bracket | Male | Female |
| Under 5 Years | 17 (26.2%) | 17 (25.4%) |
| 5 Years | 0 (0.0%) | 0 (0.0%) |
| 6 to 11 Years | 25 (18.9%) | 17 (21.8%) |
| 12 to 14 Years | 0 (0.0%) | 0 (0.0%) |
| 15 Years | 0 (0.0%) | 19 (28.8%) |
| 16 and 17 Years | 2 (4.3%) | 0 (0.0%) |
| 18 to 24 Years | 1 (1.8%) | 0 (0.0%) |
| 25 to 34 Years | 16 (16.0%) | 34 (30.1%) |
| 35 to 44 Years | 5 (2.4%) | 22 (15.8%) |
| 45 to 54 Years | 2 (2.2%) | 14 (11.9%) |
| 55 to 64 Years | 4 (3.5%) | 38 (30.2%) |
| 65 to 74 Years | 13 (7.6%) | 5 (6.2%) |
| 75 Years and over | 0 (0.0%) | 22 (26.5%) |
| Total | 85 (7.6%) | 188 (19.0%) |
Income Above Poverty by Sex and Age in Lovell
According to the poverty statistics in Lovell, males aged 5 years and females aged 12 to 14 years are the age groups that are most secure financially, with 100.0% of males and 100.0% of females in these age groups living above the poverty line.
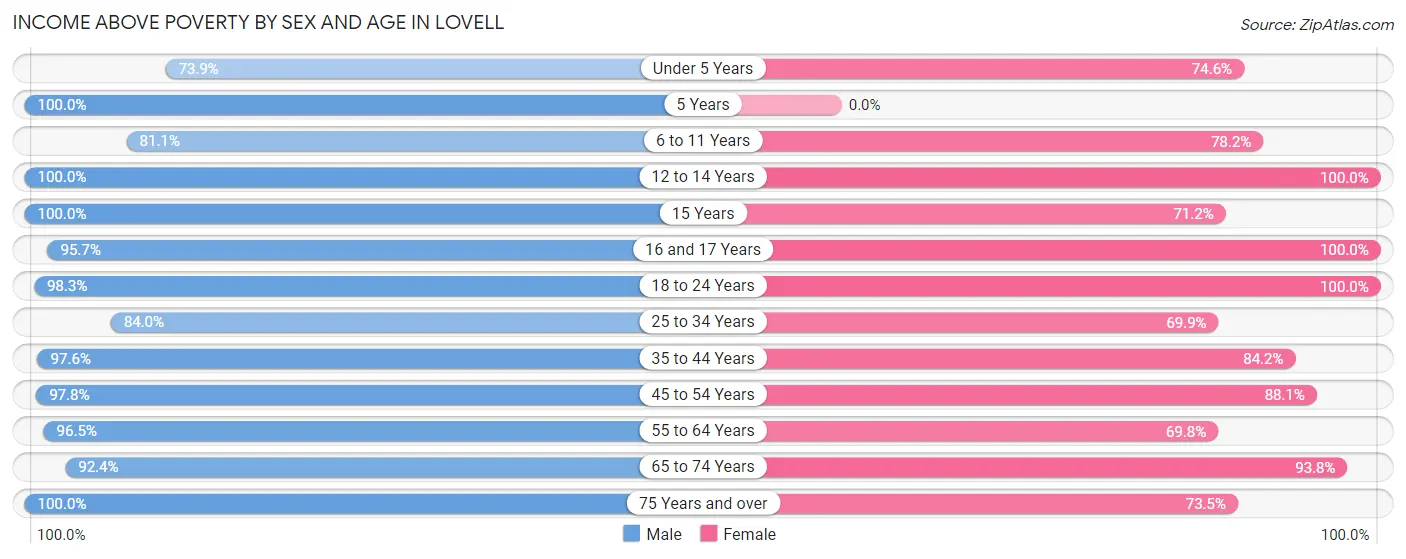
| Age Bracket | Male | Female |
| Under 5 Years | 48 (73.9%) | 50 (74.6%) |
| 5 Years | 15 (100.0%) | 0 (0.0%) |
| 6 to 11 Years | 107 (81.1%) | 61 (78.2%) |
| 12 to 14 Years | 28 (100.0%) | 62 (100.0%) |
| 15 Years | 17 (100.0%) | 47 (71.2%) |
| 16 and 17 Years | 45 (95.7%) | 7 (100.0%) |
| 18 to 24 Years | 56 (98.3%) | 48 (100.0%) |
| 25 to 34 Years | 84 (84.0%) | 79 (69.9%) |
| 35 to 44 Years | 201 (97.6%) | 117 (84.2%) |
| 45 to 54 Years | 90 (97.8%) | 104 (88.1%) |
| 55 to 64 Years | 109 (96.5%) | 88 (69.8%) |
| 65 to 74 Years | 159 (92.4%) | 76 (93.8%) |
| 75 Years and over | 75 (100.0%) | 61 (73.5%) |
| Total | 1,034 (92.4%) | 800 (81.0%) |
Income Below Poverty Among Married-Couple Families in Lovell
The poverty statistics for married-couple families in Lovell show that 7.1% or 30 of the total 420 families live below the poverty line. Families with 1 or 2 children have the highest poverty rate of 10.6%, comprising of 16 families. On the other hand, families with 3 or 4 children have the lowest poverty rate of 0.0%, which includes 0 families.
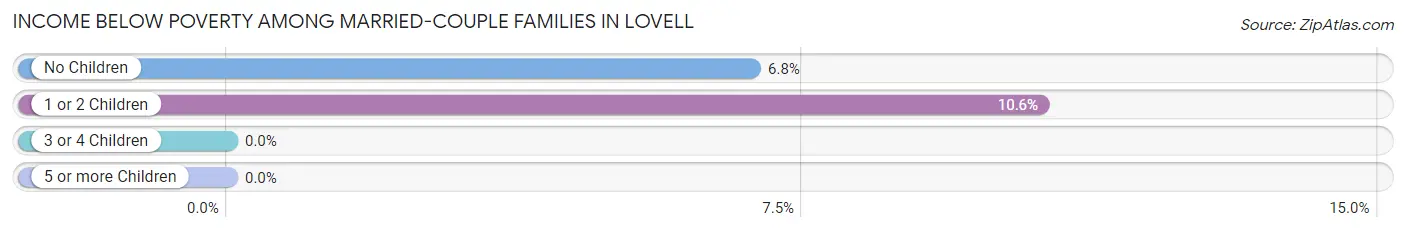
| Children | Above Poverty | Below Poverty |
| No Children | 191 (93.2%) | 14 (6.8%) |
| 1 or 2 Children | 135 (89.4%) | 16 (10.6%) |
| 3 or 4 Children | 53 (100.0%) | 0 (0.0%) |
| 5 or more Children | 11 (100.0%) | 0 (0.0%) |
| Total | 390 (92.9%) | 30 (7.1%) |
Income Below Poverty Among Single-Parent Households in Lovell
According to the poverty data in Lovell, 12.9% or 4 single-father households and 52.5% or 31 single-mother households are living below the poverty line. Among single-father households, those with 1 or 2 children have the highest poverty rate, with 4 households (21.0%) experiencing poverty. Likewise, among single-mother households, those with 1 or 2 children have the highest poverty rate, with 25 households (64.1%) falling below the poverty line.
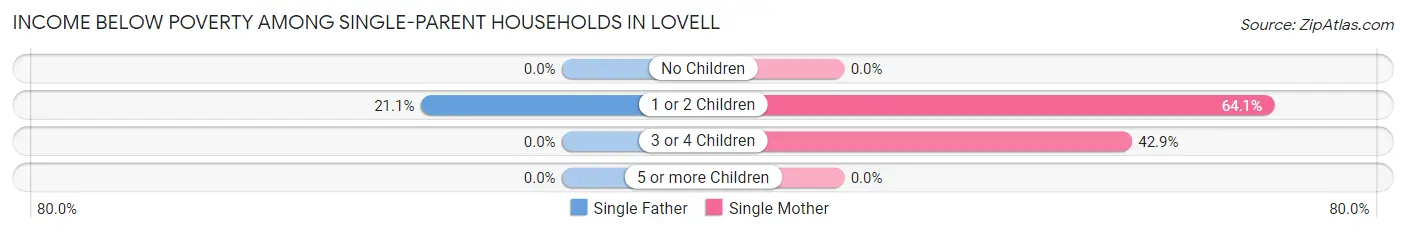
| Children | Single Father | Single Mother |
| No Children | 0 (0.0%) | 0 (0.0%) |
| 1 or 2 Children | 4 (21.0%) | 25 (64.1%) |
| 3 or 4 Children | 0 (0.0%) | 6 (42.9%) |
| 5 or more Children | 0 (0.0%) | 0 (0.0%) |
| Total | 4 (12.9%) | 31 (52.5%) |
Income Below Poverty Among Married-Couple vs Single-Parent Households in Lovell
The poverty data for Lovell shows that 30 of the married-couple family households (7.1%) and 35 of the single-parent households (38.9%) are living below the poverty level. Within the married-couple family households, those with 1 or 2 children have the highest poverty rate, with 16 households (10.6%) falling below the poverty line. Among the single-parent households, those with 1 or 2 children have the highest poverty rate, with 29 household (50.0%) living below poverty.
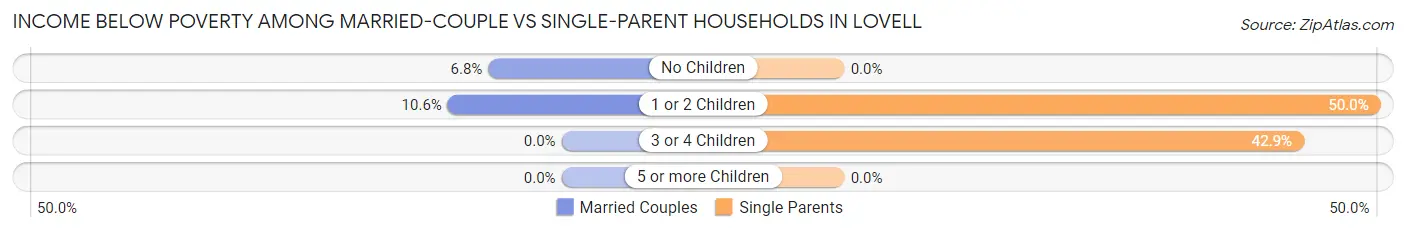
| Children | Married-Couple Families | Single-Parent Households |
| No Children | 14 (6.8%) | 0 (0.0%) |
| 1 or 2 Children | 16 (10.6%) | 29 (50.0%) |
| 3 or 4 Children | 0 (0.0%) | 6 (42.9%) |
| 5 or more Children | 0 (0.0%) | 0 (0.0%) |
| Total | 30 (7.1%) | 35 (38.9%) |
Race in Lovell
The most populous races in Lovell are White / Caucasian (2,082 | 95.6%), Hispanic or Latino (133 | 6.1%), and Some other Race (41 | 1.9%).
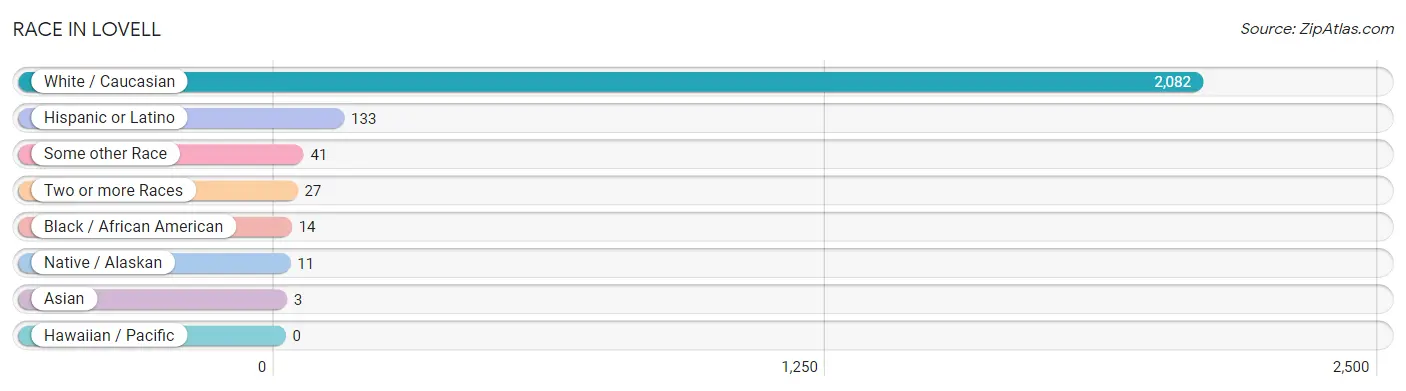
| Race | # Population | % Population |
| Asian | 3 | 0.1% |
| Black / African American | 14 | 0.6% |
| Hawaiian / Pacific | 0 | 0.0% |
| Hispanic or Latino | 133 | 6.1% |
| Native / Alaskan | 11 | 0.5% |
| White / Caucasian | 2,082 | 95.6% |
| Two or more Races | 27 | 1.2% |
| Some other Race | 41 | 1.9% |
| Total | 2,178 | 100.0% |
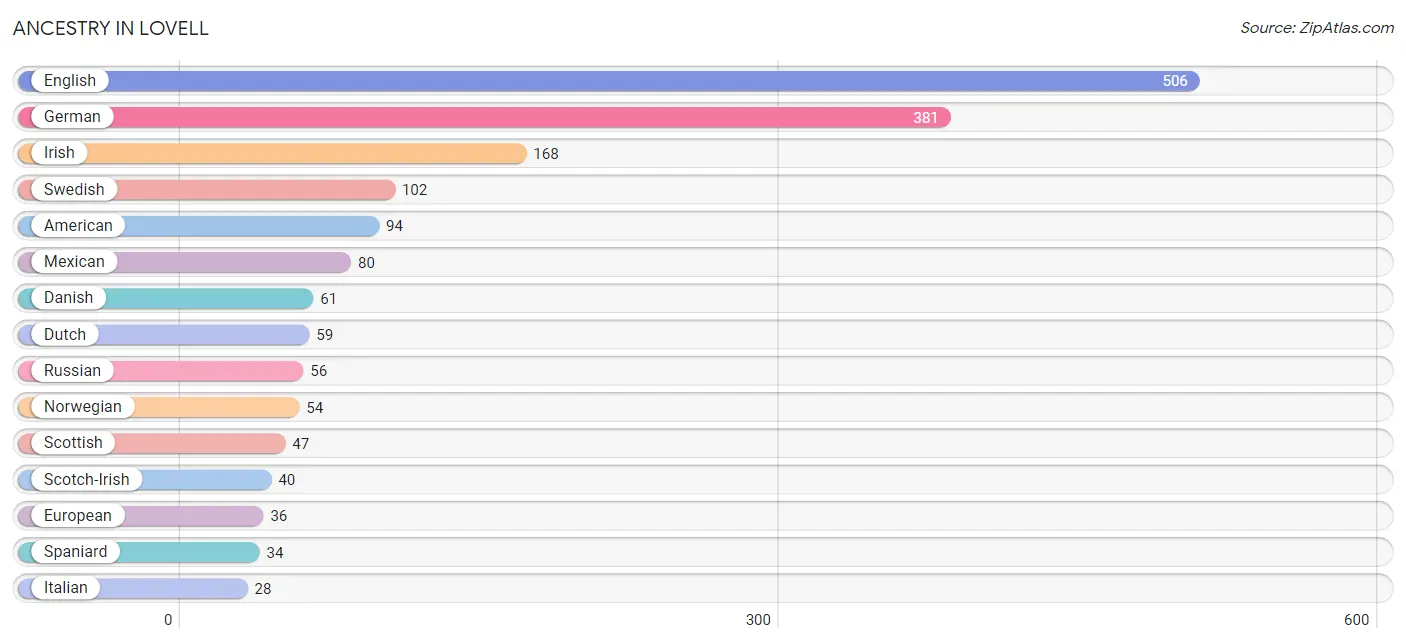
Ancestry in Lovell
The most populous ancestries reported in Lovell are English (506 | 23.2%), German (381 | 17.5%), Irish (168 | 7.7%), Swedish (102 | 4.7%), and American (94 | 4.3%), together accounting for 57.4% of all Lovell residents.
| Ancestry | # Population | % Population |
| American | 94 | 4.3% |
| Arapaho | 3 | 0.1% |
| Armenian | 5 | 0.2% |
| Austrian | 6 | 0.3% |
| British | 14 | 0.6% |
| Canadian | 4 | 0.2% |
| Choctaw | 8 | 0.4% |
| Crow | 3 | 0.1% |
| Cuban | 19 | 0.9% |
| Danish | 61 | 2.8% |
| Dutch | 59 | 2.7% |
| Eastern European | 13 | 0.6% |
| English | 506 | 23.2% |
| European | 36 | 1.7% |
| French | 17 | 0.8% |
| French Canadian | 5 | 0.2% |
| German | 381 | 17.5% |
| Irish | 168 | 7.7% |
| Italian | 28 | 1.3% |
| Korean | 1 | 0.1% |
| Lithuanian | 6 | 0.3% |
| Malaysian | 8 | 0.4% |
| Mexican | 80 | 3.7% |
| Norwegian | 54 | 2.5% |
| Pakistani | 2 | 0.1% |
| Polish | 7 | 0.3% |
| Portuguese | 19 | 0.9% |
| Potawatomi | 3 | 0.1% |
| Russian | 56 | 2.6% |
| Scotch-Irish | 40 | 1.8% |
| Scottish | 47 | 2.2% |
| Spaniard | 34 | 1.6% |
| Swedish | 102 | 4.7% |
| Swiss | 15 | 0.7% |
| Welsh | 7 | 0.3% | View All 35 Rows |
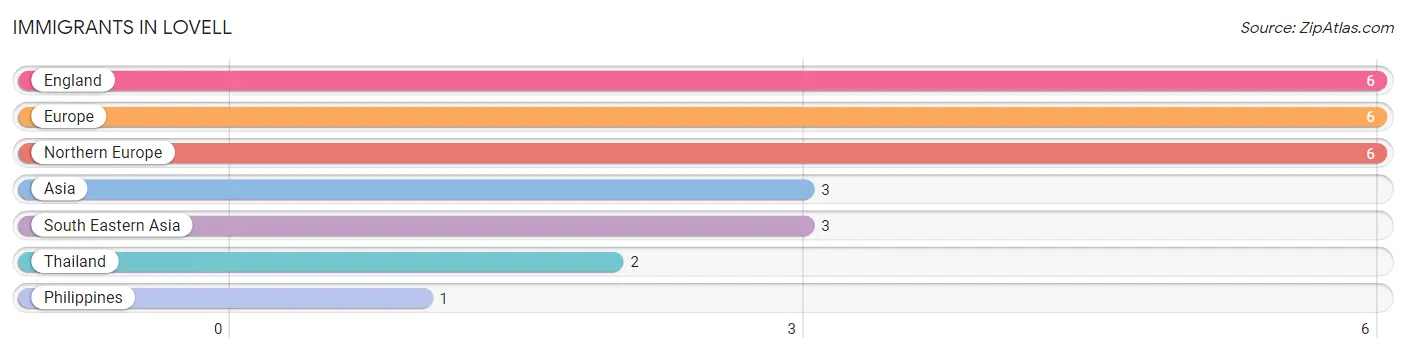
Immigrants in Lovell
The most numerous immigrant groups reported in Lovell came from England (6 | 0.3%), Europe (6 | 0.3%), Northern Europe (6 | 0.3%), Asia (3 | 0.1%), and South Eastern Asia (3 | 0.1%), together accounting for 1.1% of all Lovell residents.
| Immigration Origin | # Population | % Population |
| Asia | 3 | 0.1% |
| England | 6 | 0.3% |
| Europe | 6 | 0.3% |
| Northern Europe | 6 | 0.3% |
| Philippines | 1 | 0.1% |
| South Eastern Asia | 3 | 0.1% |
| Thailand | 2 | 0.1% | View All 7 Rows |
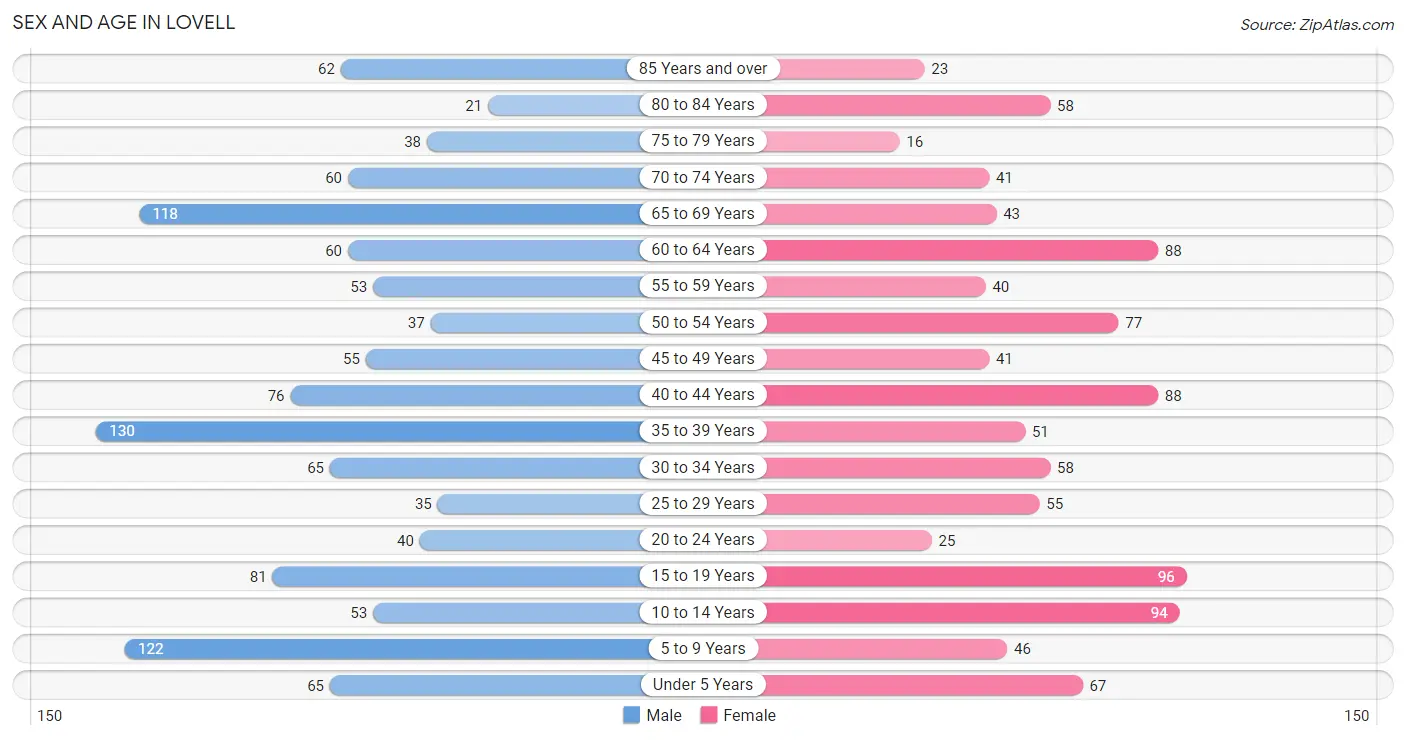
Sex and Age in Lovell
Sex and Age in Lovell
The most populous age groups in Lovell are 35 to 39 Years (130 | 11.1%) for men and 15 to 19 Years (96 | 9.5%) for women.
| Age Bracket | Male | Female |
| Under 5 Years | 65 (5.6%) | 67 (6.7%) |
| 5 to 9 Years | 122 (10.4%) | 46 (4.6%) |
| 10 to 14 Years | 53 (4.5%) | 94 (9.3%) |
| 15 to 19 Years | 81 (6.9%) | 96 (9.5%) |
| 20 to 24 Years | 40 (3.4%) | 25 (2.5%) |
| 25 to 29 Years | 35 (3.0%) | 55 (5.5%) |
| 30 to 34 Years | 65 (5.6%) | 58 (5.8%) |
| 35 to 39 Years | 130 (11.1%) | 51 (5.1%) |
| 40 to 44 Years | 76 (6.5%) | 88 (8.7%) |
| 45 to 49 Years | 55 (4.7%) | 41 (4.1%) |
| 50 to 54 Years | 37 (3.2%) | 77 (7.6%) |
| 55 to 59 Years | 53 (4.5%) | 40 (4.0%) |
| 60 to 64 Years | 60 (5.1%) | 88 (8.7%) |
| 65 to 69 Years | 118 (10.1%) | 43 (4.3%) |
| 70 to 74 Years | 60 (5.1%) | 41 (4.1%) |
| 75 to 79 Years | 38 (3.3%) | 16 (1.6%) |
| 80 to 84 Years | 21 (1.8%) | 58 (5.8%) |
| 85 Years and over | 62 (5.3%) | 23 (2.3%) |
| Total | 1,171 (100.0%) | 1,007 (100.0%) |
Families and Households in Lovell
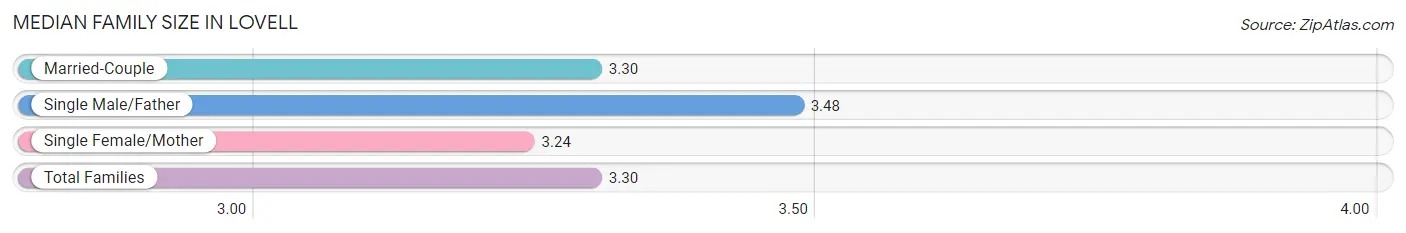
Median Family Size in Lovell
The median family size in Lovell is 3.30 persons per family, with single male/father families (31 | 6.1%) accounting for the largest median family size of 3.48 persons per family. On the other hand, single female/mother families (59 | 11.6%) represent the smallest median family size with 3.24 persons per family.
| Family Type | # Families | Family Size |
| Married-Couple | 420 (82.4%) | 3.30 |
| Single Male/Father | 31 (6.1%) | 3.48 |
| Single Female/Mother | 59 (11.6%) | 3.24 |
| Total Families | 510 (100.0%) | 3.30 |
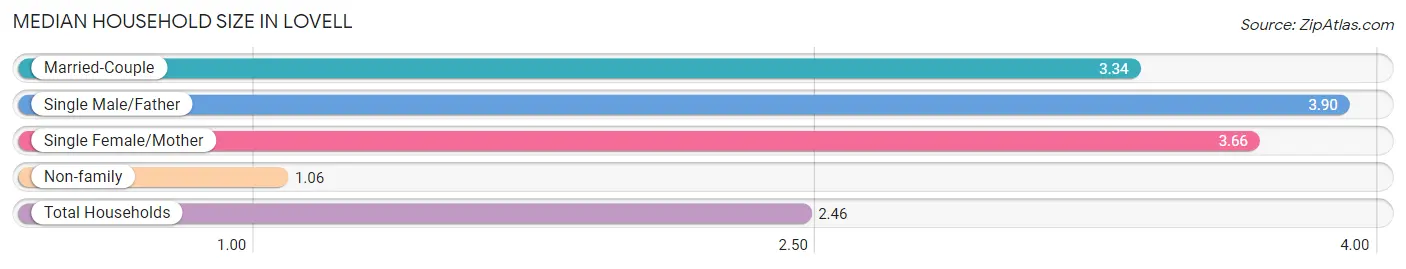
Median Household Size in Lovell
The median household size in Lovell is 2.46 persons per household, with single male/father households (31 | 3.6%) accounting for the largest median household size of 3.9 persons per household. non-family households (345 | 40.4%) represent the smallest median household size with 1.06 persons per household.
| Household Type | # Households | Household Size |
| Married-Couple | 420 (49.1%) | 3.34 |
| Single Male/Father | 31 (3.6%) | 3.90 |
| Single Female/Mother | 59 (6.9%) | 3.66 |
| Non-family | 345 (40.4%) | 1.06 |
| Total Households | 855 (100.0%) | 2.46 |
Household Size by Marriage Status in Lovell
Out of a total of 855 households in Lovell, 510 (59.7%) are family households, while 345 (40.4%) are nonfamily households. The most numerous type of family households are 2-person households, comprising 222, and the most common type of nonfamily households are 1-person households, comprising 311.
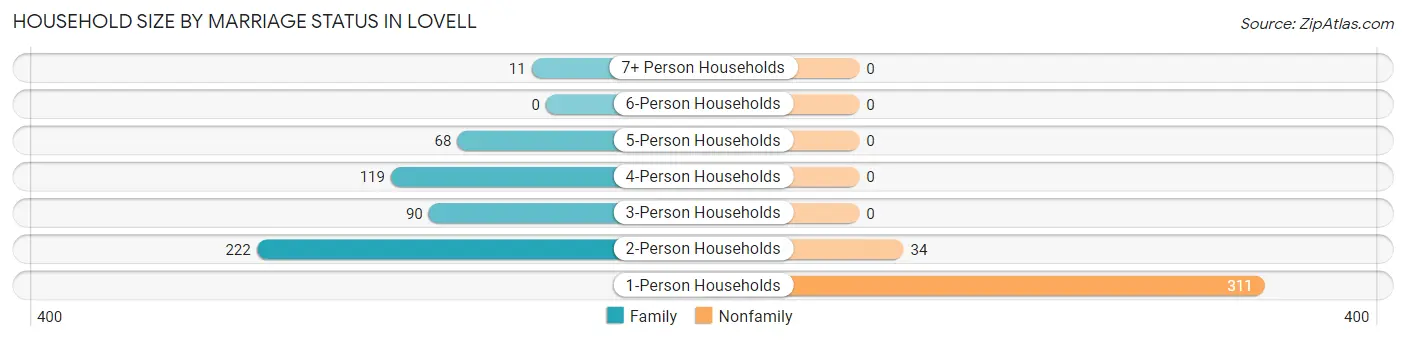
| Household Size | Family Households | Nonfamily Households |
| 1-Person Households | - | 311 (36.4%) |
| 2-Person Households | 222 (26.0%) | 34 (4.0%) |
| 3-Person Households | 90 (10.5%) | 0 (0.0%) |
| 4-Person Households | 119 (13.9%) | 0 (0.0%) |
| 5-Person Households | 68 (8.0%) | 0 (0.0%) |
| 6-Person Households | 0 (0.0%) | 0 (0.0%) |
| 7+ Person Households | 11 (1.3%) | 0 (0.0%) |
| Total | 510 (59.7%) | 345 (40.4%) |
Female Fertility in Lovell
Fertility by Age in Lovell
Average fertility rate in Lovell is 66.0 births per 1,000 women. Women in the age bracket of 20 to 34 years have the highest fertility rate with 159.0 births per 1,000 women. Women in the age bracket of 20 to 34 years acount for 78.6% of all women with births.
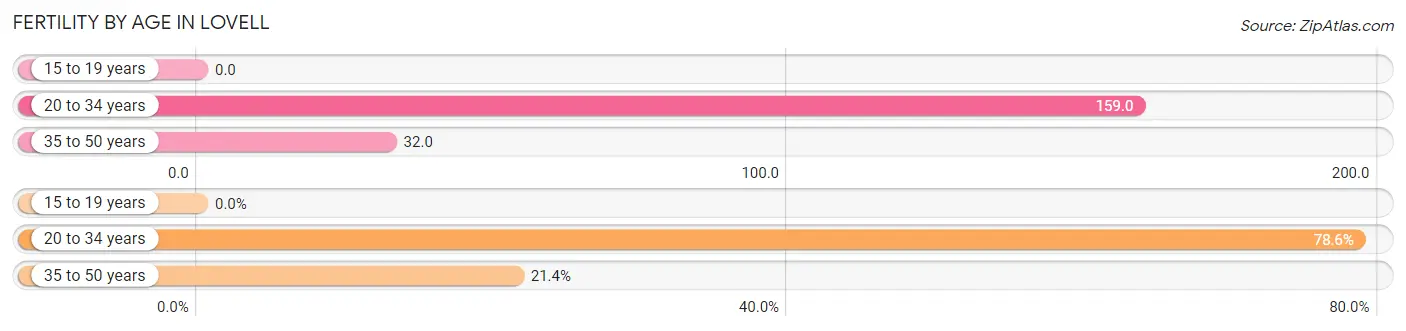
| Age Bracket | Women with Births | Births / 1,000 Women |
| 15 to 19 years | 0 (0.0%) | 0.0 |
| 20 to 34 years | 22 (78.6%) | 159.0 |
| 35 to 50 years | 6 (21.4%) | 32.0 |
| Total | 28 (100.0%) | 66.0 |
Fertility by Age by Marriage Status in Lovell
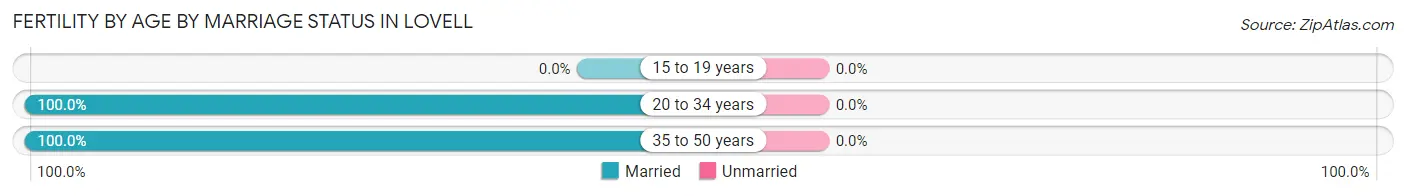
| Age Bracket | Married | Unmarried |
| 15 to 19 years | 0 (0.0%) | 0 (0.0%) |
| 20 to 34 years | 22 (100.0%) | 0 (0.0%) |
| 35 to 50 years | 6 (100.0%) | 0 (0.0%) |
| Total | 28 (100.0%) | 0 (0.0%) |
Fertility by Education in Lovell
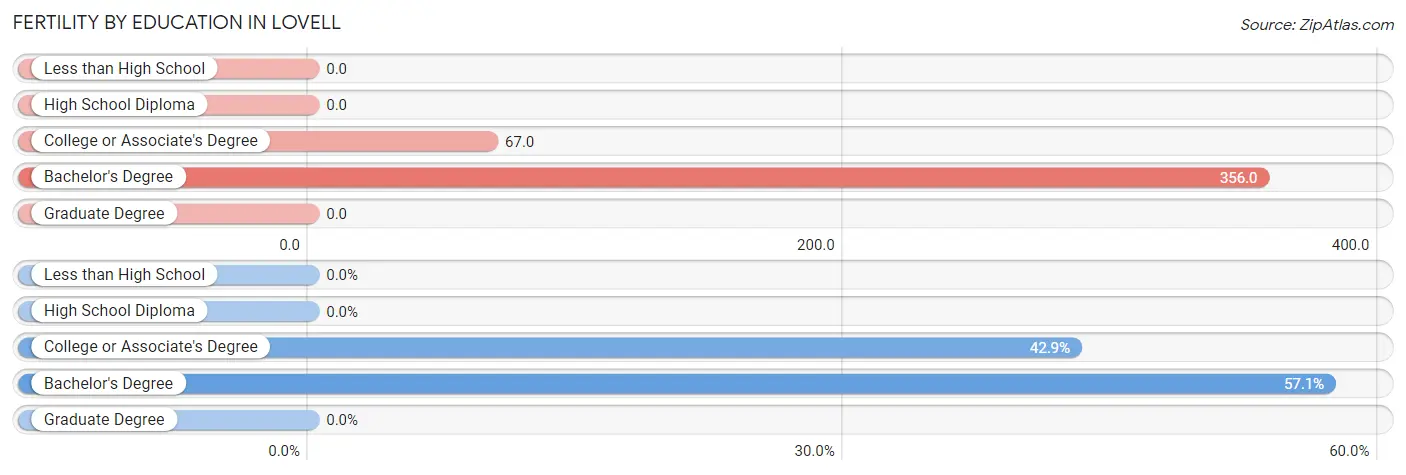
| Educational Attainment | Women with Births | Births / 1,000 Women |
| Less than High School | 0 (0.0%) | 0.0 |
| High School Diploma | 0 (0.0%) | 0.0 |
| College or Associate's Degree | 12 (42.9%) | 67.0 |
| Bachelor's Degree | 16 (57.1%) | 356.0 |
| Graduate Degree | 0 (0.0%) | 0.0 |
| Total | 28 (100.0%) | 66.0 |
Fertility by Education by Marriage Status in Lovell
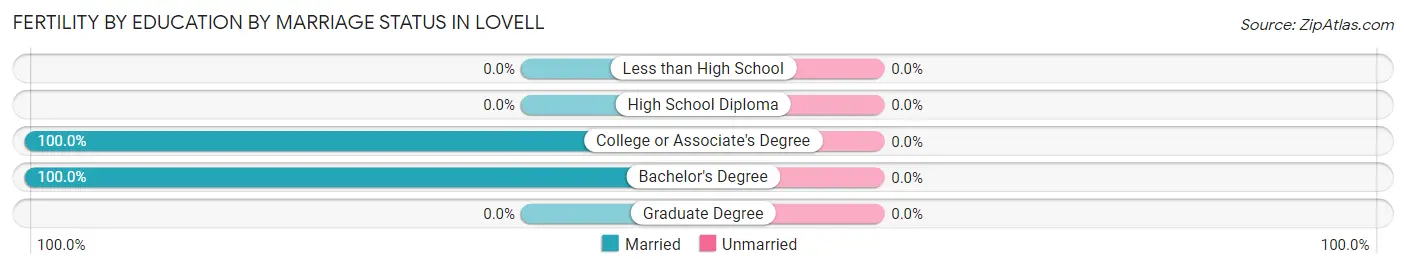
| Educational Attainment | Married | Unmarried |
| Less than High School | 0 (0.0%) | 0 (0.0%) |
| High School Diploma | 0 (0.0%) | 0 (0.0%) |
| College or Associate's Degree | 12 (100.0%) | 0 (0.0%) |
| Bachelor's Degree | 16 (100.0%) | 0 (0.0%) |
| Graduate Degree | 0 (0.0%) | 0 (0.0%) |
| Total | 28 (100.0%) | 0 (0.0%) |
Employment Characteristics in Lovell
Employment by Class of Employer in Lovell
Among the 915 employed individuals in Lovell, private company employees (598 | 65.4%), not-for-profit organizations (97 | 10.6%), and self-employed (not incorporated) (67 | 7.3%) make up the most common classes of employment.
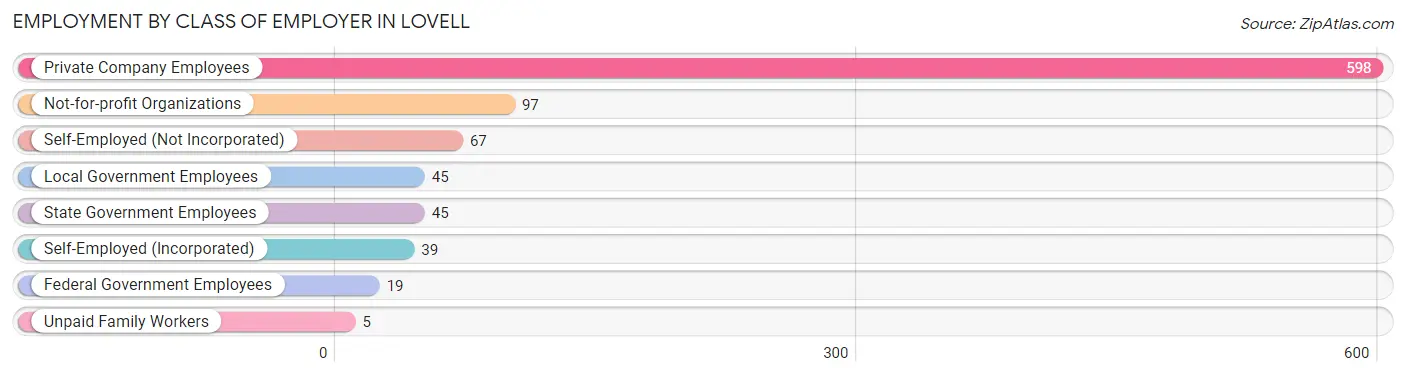
| Employer Class | # Employees | % Employees |
| Private Company Employees | 598 | 65.4% |
| Self-Employed (Incorporated) | 39 | 4.3% |
| Self-Employed (Not Incorporated) | 67 | 7.3% |
| Not-for-profit Organizations | 97 | 10.6% |
| Local Government Employees | 45 | 4.9% |
| State Government Employees | 45 | 4.9% |
| Federal Government Employees | 19 | 2.1% |
| Unpaid Family Workers | 5 | 0.5% |
| Total | 915 | 100.0% |
Employment Status by Age in Lovell
According to the labor force statistics for Lovell, out of the total population over 16 years of age (1,648), 58.6% or 966 individuals are in the labor force, with 2.9% or 28 of them unemployed. The age group with the highest labor force participation rate is 20 to 24 years, with 100.0% or 65 individuals in the labor force. Within the labor force, the 16 to 19 years age range has the highest percentage of unemployed individuals, with 17.3% or 9 of them being unemployed.
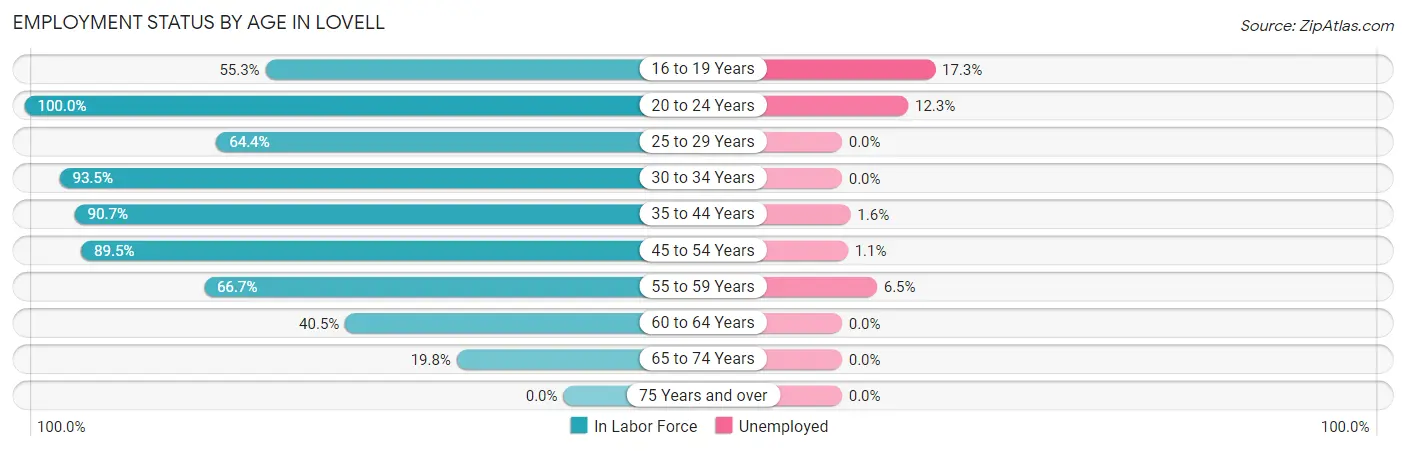
| Age Bracket | In Labor Force | Unemployed |
| 16 to 19 Years | 52 (55.3%) | 9 (17.3%) |
| 20 to 24 Years | 65 (100.0%) | 8 (12.3%) |
| 25 to 29 Years | 58 (64.4%) | 0 (0.0%) |
| 30 to 34 Years | 115 (93.5%) | 0 (0.0%) |
| 35 to 44 Years | 313 (90.7%) | 5 (1.6%) |
| 45 to 54 Years | 188 (89.5%) | 2 (1.1%) |
| 55 to 59 Years | 62 (66.7%) | 4 (6.5%) |
| 60 to 64 Years | 60 (40.5%) | 0 (0.0%) |
| 65 to 74 Years | 52 (19.8%) | 0 (0.0%) |
| 75 Years and over | 0 (0.0%) | 0 (0.0%) |
| Total | 966 (58.6%) | 28 (2.9%) |
Employment Status by Educational Attainment in Lovell
According to labor force statistics for Lovell, 78.9% of individuals (796) out of the total population between 25 and 64 years of age (1,009) are in the labor force, with 1.4% or 11 of them being unemployed. The group with the highest labor force participation rate are those with the educational attainment of bachelor's degree or higher, with 86.2% or 168 individuals in the labor force. Within the labor force, individuals with college / associate degree education have the highest percentage of unemployment, with 3.8% or 11 of them being unemployed.
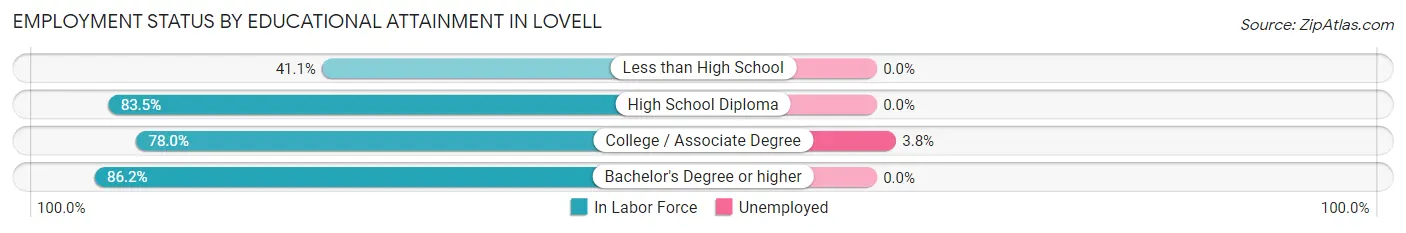
| Educational Attainment | In Labor Force | Unemployed |
| Less than High School | 30 (41.1%) | 0 (0.0%) |
| High School Diploma | 308 (83.5%) | 0 (0.0%) |
| College / Associate Degree | 290 (78.0%) | 14 (3.8%) |
| Bachelor's Degree or higher | 168 (86.2%) | 0 (0.0%) |
| Total | 796 (78.9%) | 14 (1.4%) |
Employment Occupations by Sex in Lovell
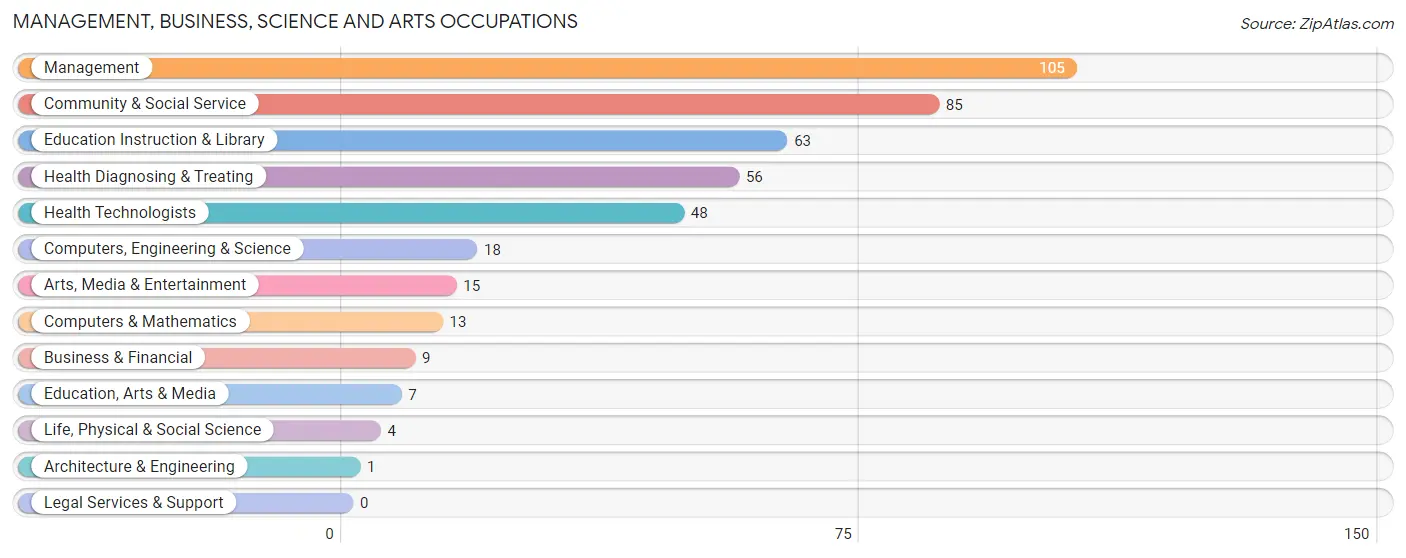
Management, Business, Science and Arts Occupations
The most common Management, Business, Science and Arts occupations in Lovell are Management (105 | 11.2%), Community & Social Service (85 | 9.1%), Education Instruction & Library (63 | 6.7%), Health Diagnosing & Treating (56 | 6.0%), and Health Technologists (48 | 5.1%).
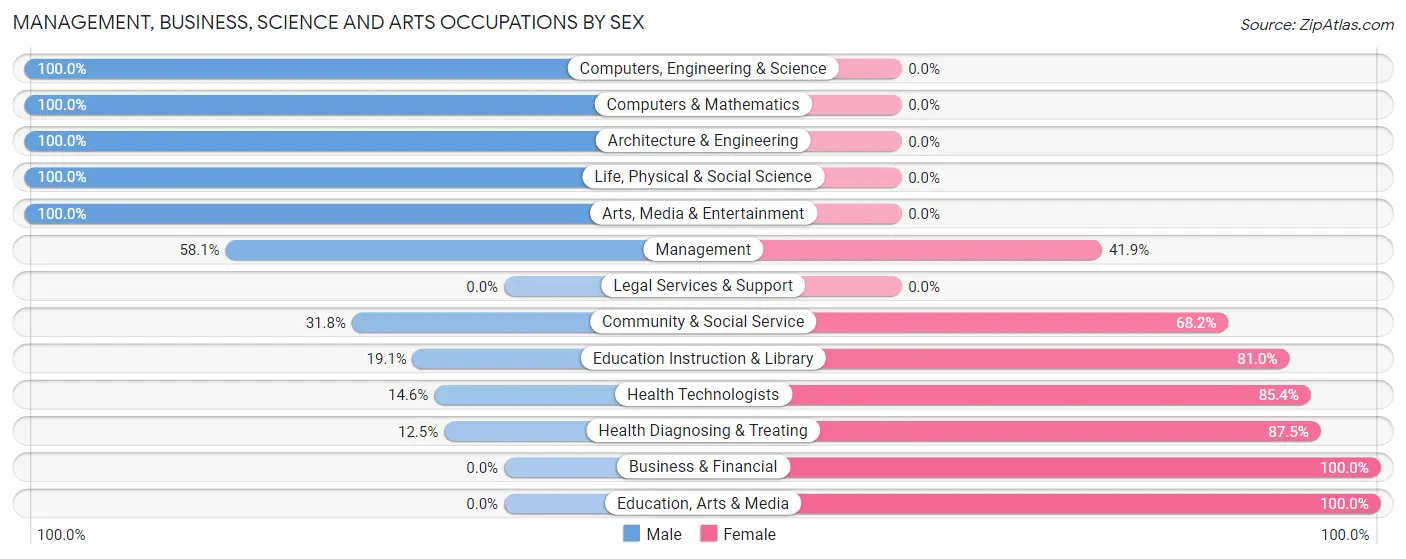
Management, Business, Science and Arts Occupations by Sex
Within the Management, Business, Science and Arts occupations in Lovell, the most male-oriented occupations are Computers, Engineering & Science (100.0%), Computers & Mathematics (100.0%), and Architecture & Engineering (100.0%), while the most female-oriented occupations are Business & Financial (100.0%), Education, Arts & Media (100.0%), and Health Diagnosing & Treating (87.5%).
| Occupation | Male | Female |
| Management | 61 (58.1%) | 44 (41.9%) |
| Business & Financial | 0 (0.0%) | 9 (100.0%) |
| Computers, Engineering & Science | 18 (100.0%) | 0 (0.0%) |
| Computers & Mathematics | 13 (100.0%) | 0 (0.0%) |
| Architecture & Engineering | 1 (100.0%) | 0 (0.0%) |
| Life, Physical & Social Science | 4 (100.0%) | 0 (0.0%) |
| Community & Social Service | 27 (31.8%) | 58 (68.2%) |
| Education, Arts & Media | 0 (0.0%) | 7 (100.0%) |
| Legal Services & Support | 0 (0.0%) | 0 (0.0%) |
| Education Instruction & Library | 12 (19.1%) | 51 (80.9%) |
| Arts, Media & Entertainment | 15 (100.0%) | 0 (0.0%) |
| Health Diagnosing & Treating | 7 (12.5%) | 49 (87.5%) |
| Health Technologists | 7 (14.6%) | 41 (85.4%) |
| Total (Category) | 113 (41.4%) | 160 (58.6%) |
| Total (Overall) | 528 (56.4%) | 409 (43.6%) |
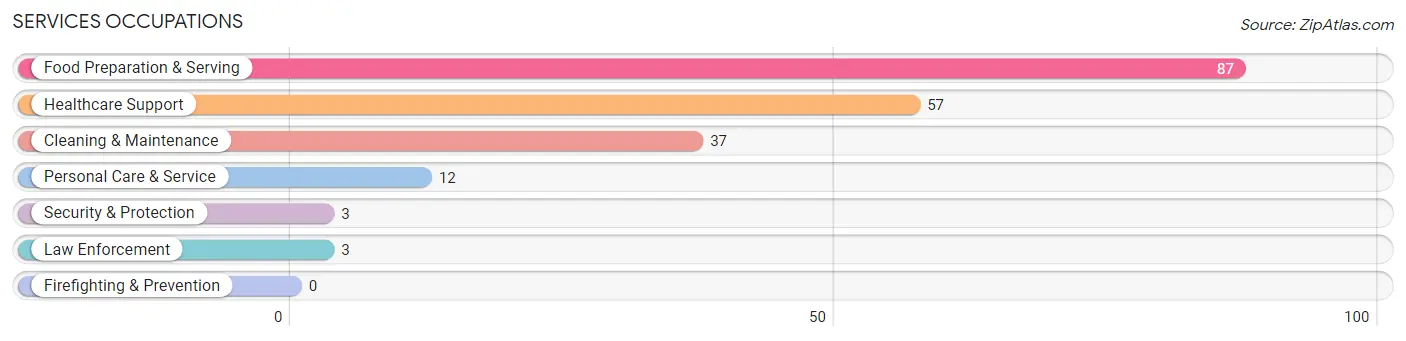
Services Occupations
The most common Services occupations in Lovell are Food Preparation & Serving (87 | 9.3%), Healthcare Support (57 | 6.1%), Cleaning & Maintenance (37 | 4.0%), Personal Care & Service (12 | 1.3%), and Security & Protection (3 | 0.3%).
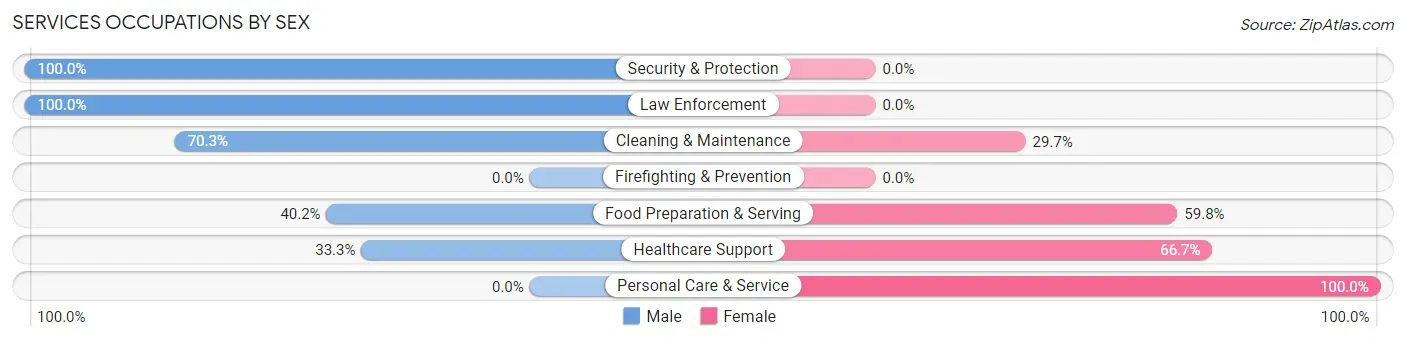
Services Occupations by Sex
Within the Services occupations in Lovell, the most male-oriented occupations are Security & Protection (100.0%), Law Enforcement (100.0%), and Cleaning & Maintenance (70.3%), while the most female-oriented occupations are Personal Care & Service (100.0%), Healthcare Support (66.7%), and Food Preparation & Serving (59.8%).
| Occupation | Male | Female |
| Healthcare Support | 19 (33.3%) | 38 (66.7%) |
| Security & Protection | 3 (100.0%) | 0 (0.0%) |
| Firefighting & Prevention | 0 (0.0%) | 0 (0.0%) |
| Law Enforcement | 3 (100.0%) | 0 (0.0%) |
| Food Preparation & Serving | 35 (40.2%) | 52 (59.8%) |
| Cleaning & Maintenance | 26 (70.3%) | 11 (29.7%) |
| Personal Care & Service | 0 (0.0%) | 12 (100.0%) |
| Total (Category) | 83 (42.3%) | 113 (57.7%) |
| Total (Overall) | 528 (56.4%) | 409 (43.6%) |
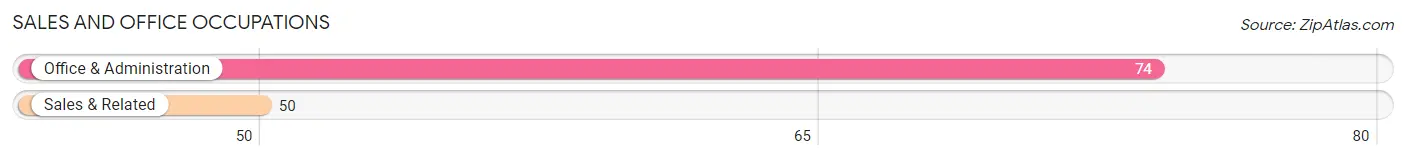
Sales and Office Occupations
The most common Sales and Office occupations in Lovell are Office & Administration (74 | 7.9%), and Sales & Related (50 | 5.3%).
Sales and Office Occupations by Sex
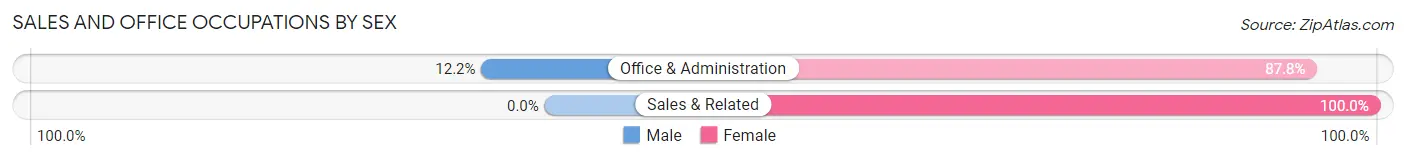
| Occupation | Male | Female |
| Sales & Related | 0 (0.0%) | 50 (100.0%) |
| Office & Administration | 9 (12.2%) | 65 (87.8%) |
| Total (Category) | 9 (7.3%) | 115 (92.7%) |
| Total (Overall) | 528 (56.4%) | 409 (43.6%) |
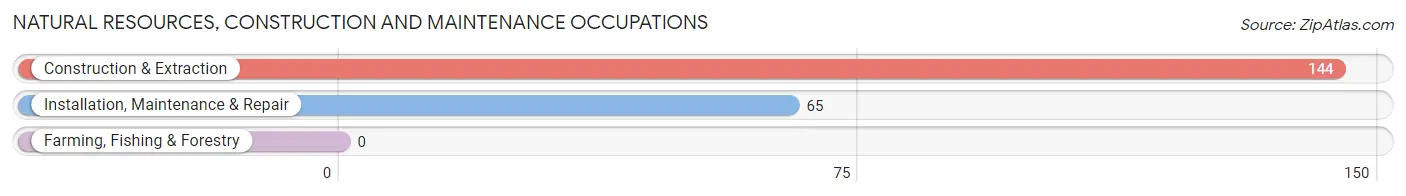
Natural Resources, Construction and Maintenance Occupations
The most common Natural Resources, Construction and Maintenance occupations in Lovell are Construction & Extraction (144 | 15.4%), and Installation, Maintenance & Repair (65 | 6.9%).
Natural Resources, Construction and Maintenance Occupations by Sex
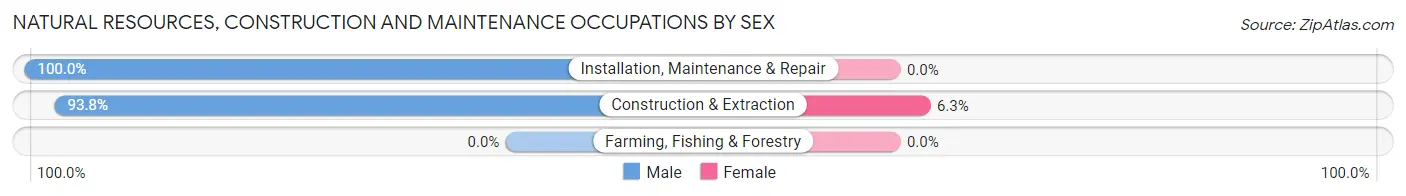
| Occupation | Male | Female |
| Farming, Fishing & Forestry | 0 (0.0%) | 0 (0.0%) |
| Construction & Extraction | 135 (93.8%) | 9 (6.2%) |
| Installation, Maintenance & Repair | 65 (100.0%) | 0 (0.0%) |
| Total (Category) | 200 (95.7%) | 9 (4.3%) |
| Total (Overall) | 528 (56.4%) | 409 (43.6%) |
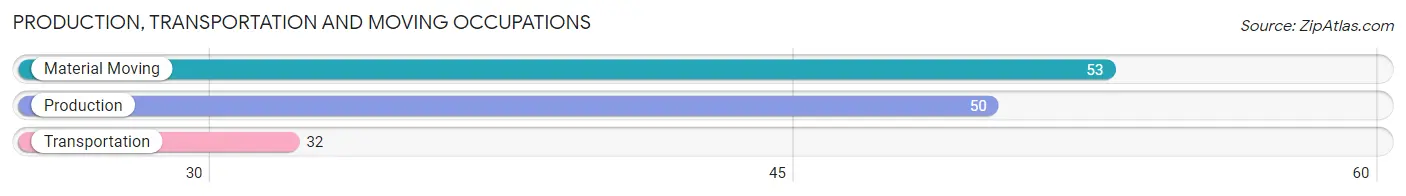
Production, Transportation and Moving Occupations
The most common Production, Transportation and Moving occupations in Lovell are Material Moving (53 | 5.7%), Production (50 | 5.3%), and Transportation (32 | 3.4%).
Production, Transportation and Moving Occupations by Sex
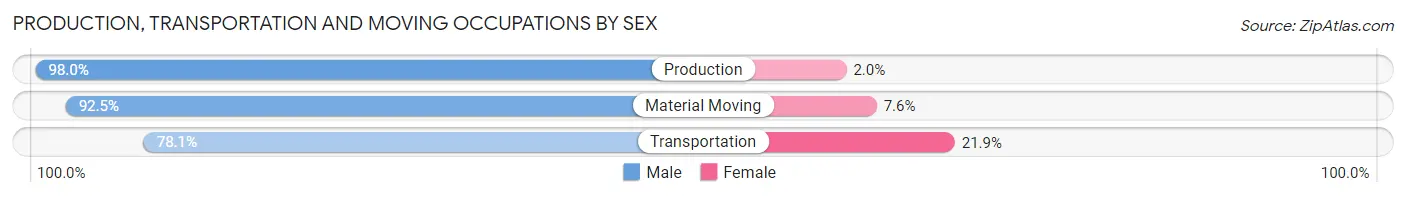
| Occupation | Male | Female |
| Production | 49 (98.0%) | 1 (2.0%) |
| Transportation | 25 (78.1%) | 7 (21.9%) |
| Material Moving | 49 (92.4%) | 4 (7.5%) |
| Total (Category) | 123 (91.1%) | 12 (8.9%) |
| Total (Overall) | 528 (56.4%) | 409 (43.6%) |
Employment Industries by Sex in Lovell
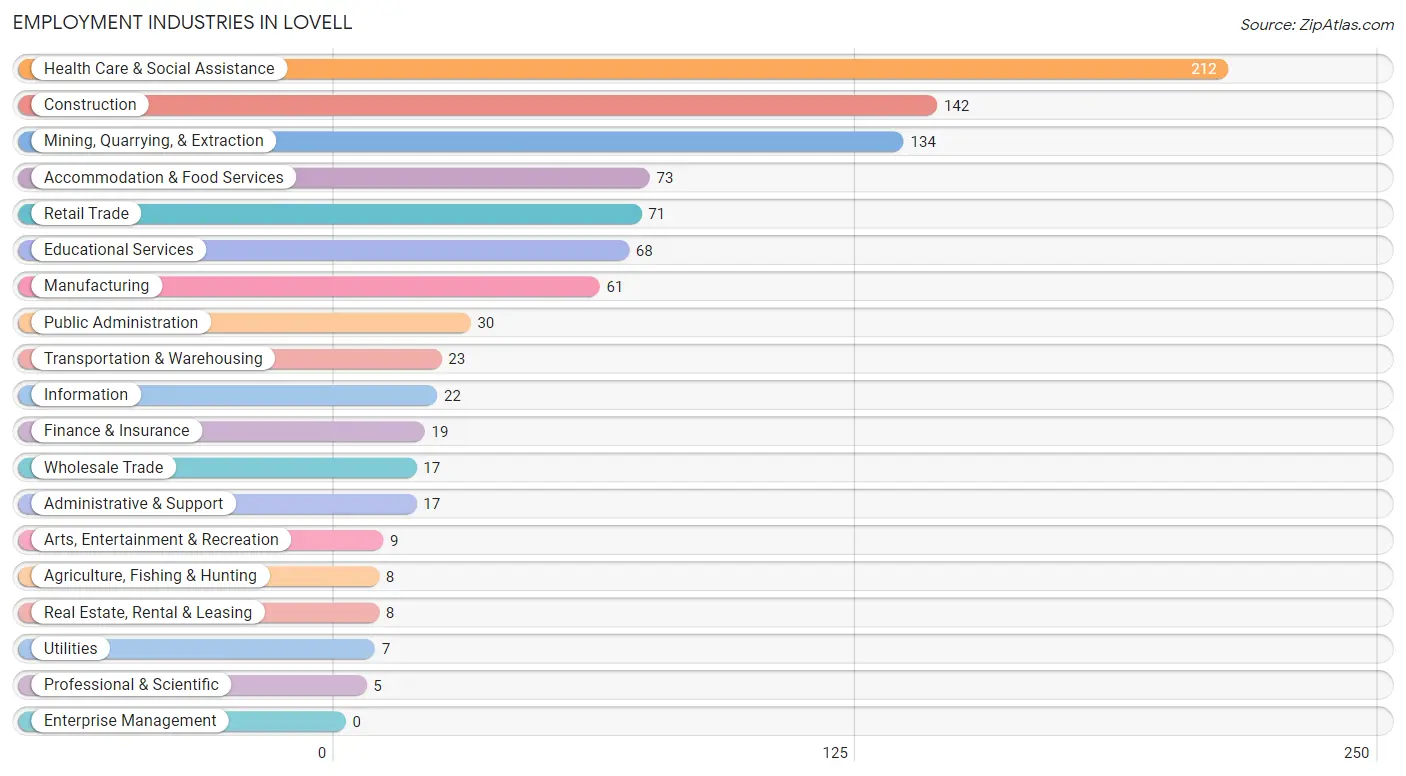
Employment Industries in Lovell
The major employment industries in Lovell include Health Care & Social Assistance (212 | 22.6%), Construction (142 | 15.1%), Mining, Quarrying, & Extraction (134 | 14.3%), Accommodation & Food Services (73 | 7.8%), and Retail Trade (71 | 7.6%).
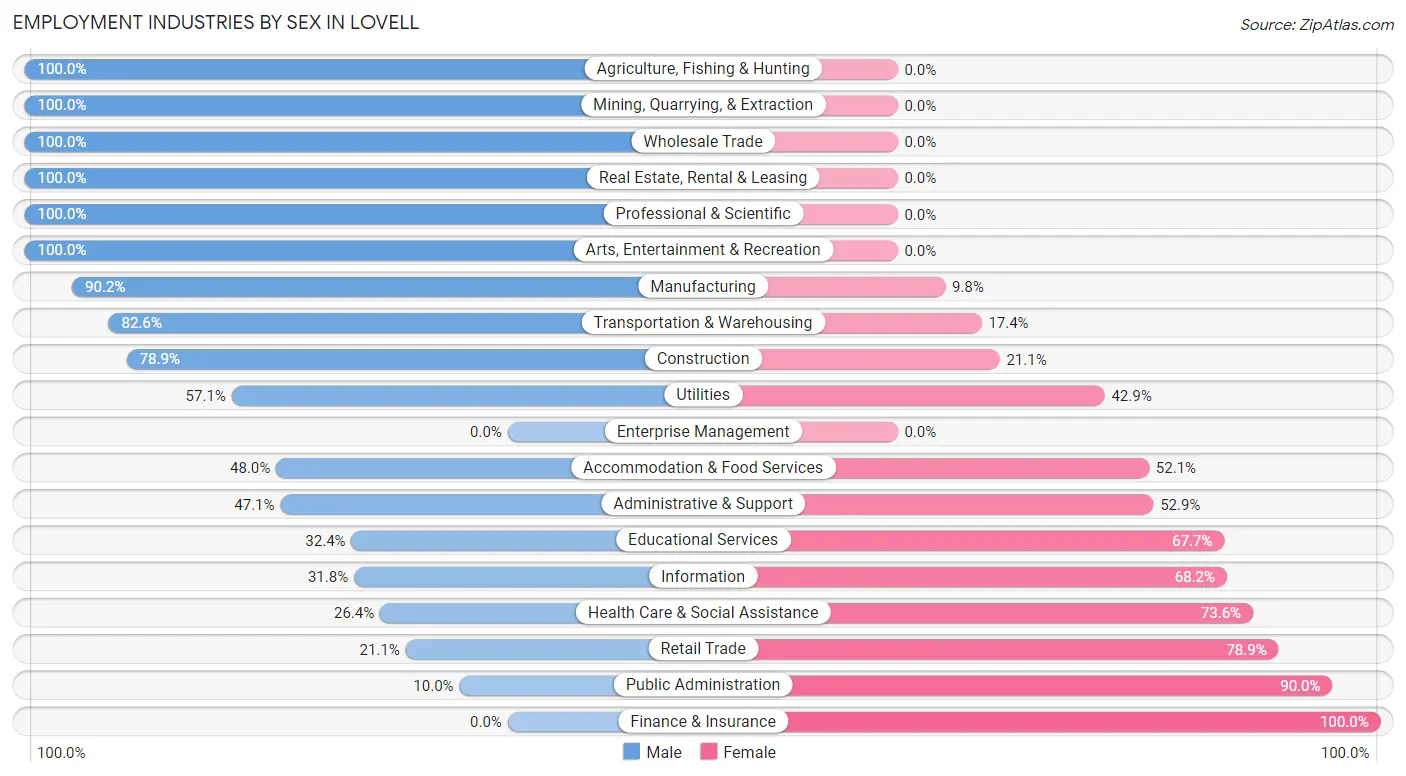
Employment Industries by Sex in Lovell
The Lovell industries that see more men than women are Agriculture, Fishing & Hunting (100.0%), Mining, Quarrying, & Extraction (100.0%), and Wholesale Trade (100.0%), whereas the industries that tend to have a higher number of women are Finance & Insurance (100.0%), Public Administration (90.0%), and Retail Trade (78.9%).
| Industry | Male | Female |
| Agriculture, Fishing & Hunting | 8 (100.0%) | 0 (0.0%) |
| Mining, Quarrying, & Extraction | 134 (100.0%) | 0 (0.0%) |
| Construction | 112 (78.9%) | 30 (21.1%) |
| Manufacturing | 55 (90.2%) | 6 (9.8%) |
| Wholesale Trade | 17 (100.0%) | 0 (0.0%) |
| Retail Trade | 15 (21.1%) | 56 (78.9%) |
| Transportation & Warehousing | 19 (82.6%) | 4 (17.4%) |
| Utilities | 4 (57.1%) | 3 (42.9%) |
| Information | 7 (31.8%) | 15 (68.2%) |
| Finance & Insurance | 0 (0.0%) | 19 (100.0%) |
| Real Estate, Rental & Leasing | 8 (100.0%) | 0 (0.0%) |
| Professional & Scientific | 5 (100.0%) | 0 (0.0%) |
| Enterprise Management | 0 (0.0%) | 0 (0.0%) |
| Administrative & Support | 8 (47.1%) | 9 (52.9%) |
| Educational Services | 22 (32.4%) | 46 (67.6%) |
| Health Care & Social Assistance | 56 (26.4%) | 156 (73.6%) |
| Arts, Entertainment & Recreation | 9 (100.0%) | 0 (0.0%) |
| Accommodation & Food Services | 35 (47.9%) | 38 (52.0%) |
| Public Administration | 3 (10.0%) | 27 (90.0%) |
| Total | 528 (56.4%) | 409 (43.6%) |
Education in Lovell
School Enrollment in Lovell
The most common levels of schooling among the 572 students in Lovell are high school (156 | 27.3%), middle school (149 | 26.1%), and elementary school (126 | 22.0%).
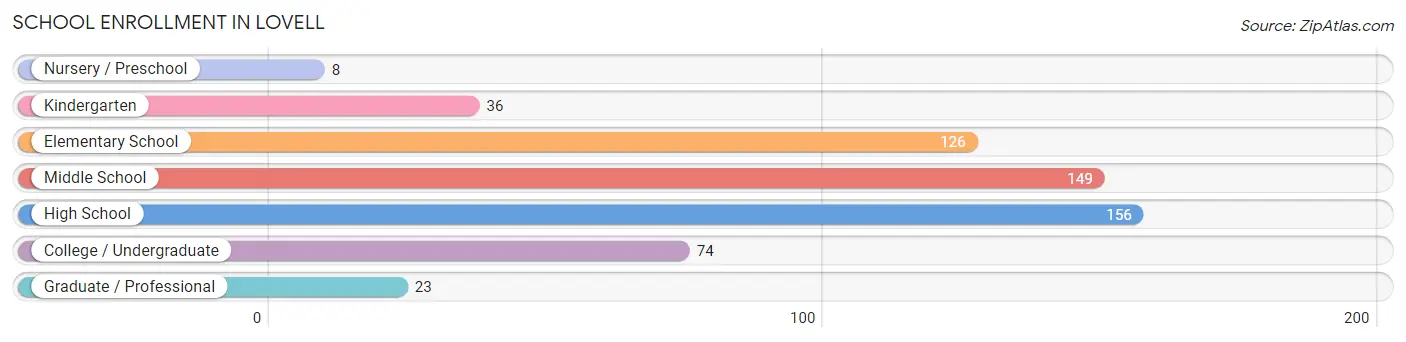
| School Level | # Students | % Students |
| Nursery / Preschool | 8 | 1.4% |
| Kindergarten | 36 | 6.3% |
| Elementary School | 126 | 22.0% |
| Middle School | 149 | 26.1% |
| High School | 156 | 27.3% |
| College / Undergraduate | 74 | 12.9% |
| Graduate / Professional | 23 | 4.0% |
| Total | 572 | 100.0% |
School Enrollment by Age by Funding Source in Lovell
Out of a total of 572 students who are enrolled in schools in Lovell, 10 (1.7%) attend a private institution, while the remaining 562 (98.3%) are enrolled in public schools. The age group of 35 years and over has the highest likelihood of being enrolled in private schools, with 8 (32.0% in the age bracket) enrolled. Conversely, the age group of 3 to 4 year olds has the lowest likelihood of being enrolled in a private school, with 6 (100.0% in the age bracket) attending a public institution.
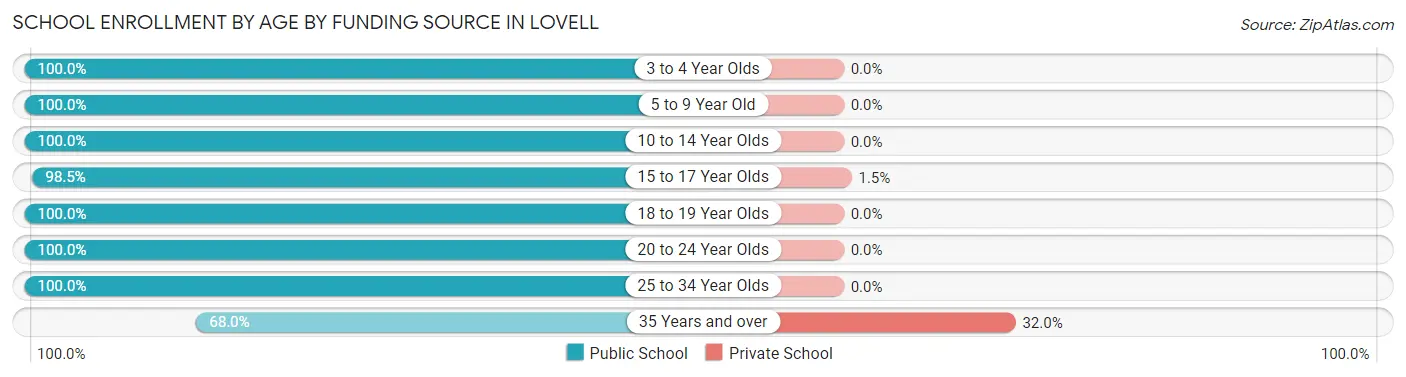
| Age Bracket | Public School | Private School |
| 3 to 4 Year Olds | 6 (100.0%) | 0 (0.0%) |
| 5 to 9 Year Old | 164 (100.0%) | 0 (0.0%) |
| 10 to 14 Year Olds | 147 (100.0%) | 0 (0.0%) |
| 15 to 17 Year Olds | 135 (98.5%) | 2 (1.5%) |
| 18 to 19 Year Olds | 40 (100.0%) | 0 (0.0%) |
| 20 to 24 Year Olds | 12 (100.0%) | 0 (0.0%) |
| 25 to 34 Year Olds | 41 (100.0%) | 0 (0.0%) |
| 35 Years and over | 17 (68.0%) | 8 (32.0%) |
| Total | 562 (98.3%) | 10 (1.7%) |
Educational Attainment by Field of Study in Lovell
Education (92 | 31.3%), arts & humanities (54 | 18.4%), business (23 | 7.8%), bio, nature & agricultural (21 | 7.1%), and liberal arts & history (19 | 6.5%) are the most common fields of study among 294 individuals in Lovell who have obtained a bachelor's degree or higher.
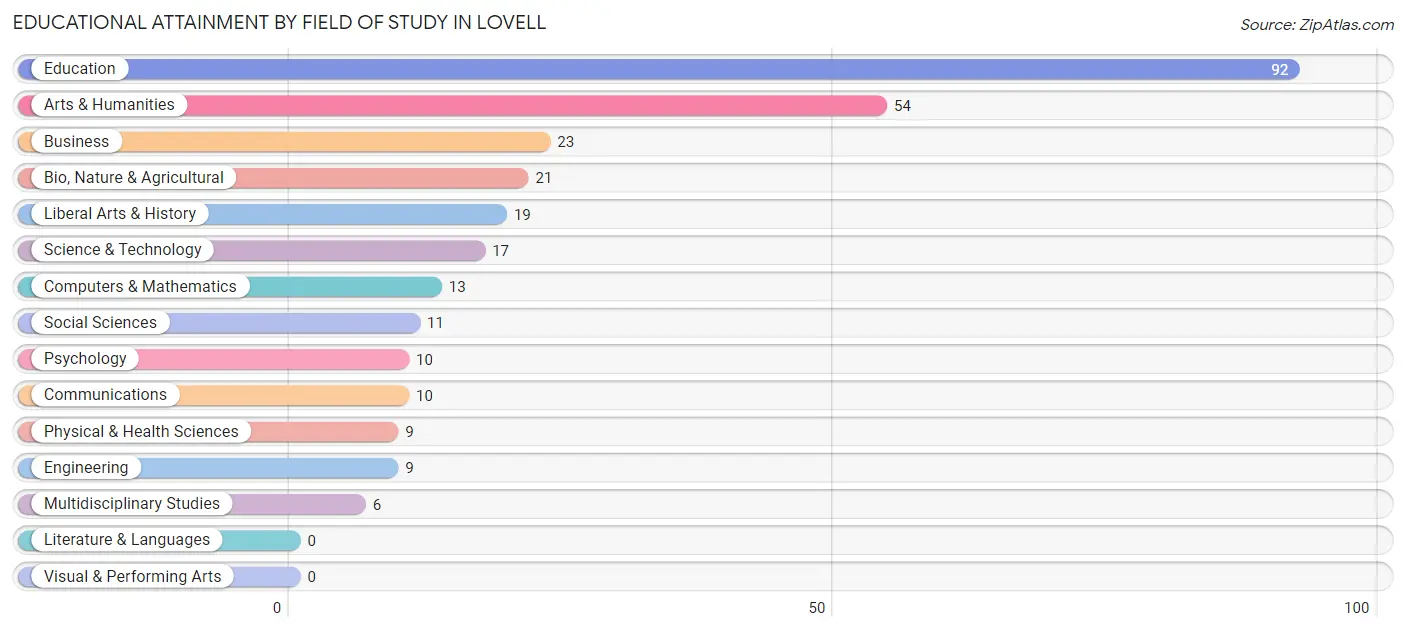
| Field of Study | # Graduates | % Graduates |
| Computers & Mathematics | 13 | 4.4% |
| Bio, Nature & Agricultural | 21 | 7.1% |
| Physical & Health Sciences | 9 | 3.1% |
| Psychology | 10 | 3.4% |
| Social Sciences | 11 | 3.7% |
| Engineering | 9 | 3.1% |
| Multidisciplinary Studies | 6 | 2.0% |
| Science & Technology | 17 | 5.8% |
| Business | 23 | 7.8% |
| Education | 92 | 31.3% |
| Literature & Languages | 0 | 0.0% |
| Liberal Arts & History | 19 | 6.5% |
| Visual & Performing Arts | 0 | 0.0% |
| Communications | 10 | 3.4% |
| Arts & Humanities | 54 | 18.4% |
| Total | 294 | 100.0% |
Transportation & Commute in Lovell
Vehicle Availability by Sex in Lovell
The most prevalent vehicle ownership categories in Lovell are males with 2 vehicles (187, accounting for 35.9%) and females with 2 vehicles (157, making up 47.5%).
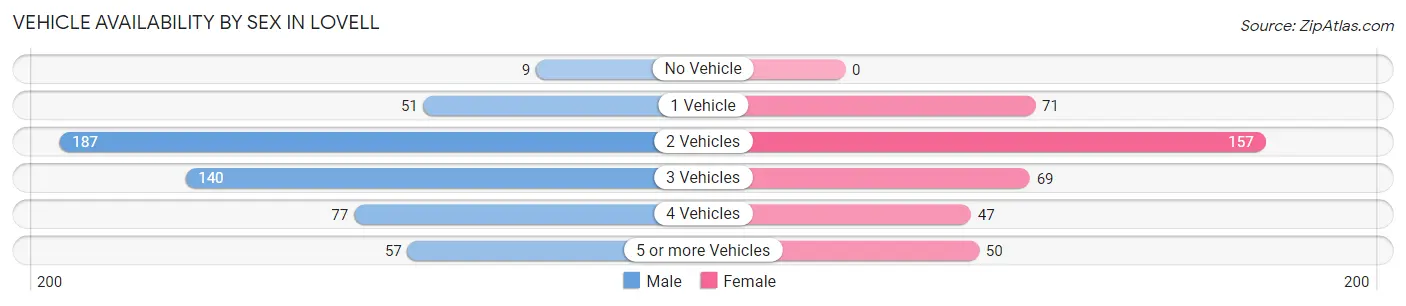
| Vehicles Available | Male | Female |
| No Vehicle | 9 (1.7%) | 0 (0.0%) |
| 1 Vehicle | 51 (9.8%) | 71 (18.0%) |
| 2 Vehicles | 187 (35.9%) | 157 (39.9%) |
| 3 Vehicles | 140 (26.9%) | 69 (17.5%) |
| 4 Vehicles | 77 (14.8%) | 47 (11.9%) |
| 5 or more Vehicles | 57 (10.9%) | 50 (12.7%) |
| Total | 521 (100.0%) | 394 (100.0%) |
Commute Time in Lovell
The most frequently occuring commute durations in Lovell are 5 to 9 minutes (255 commuters, 28.8%), less than 5 minutes (215 commuters, 24.3%), and 15 to 19 minutes (92 commuters, 10.4%).
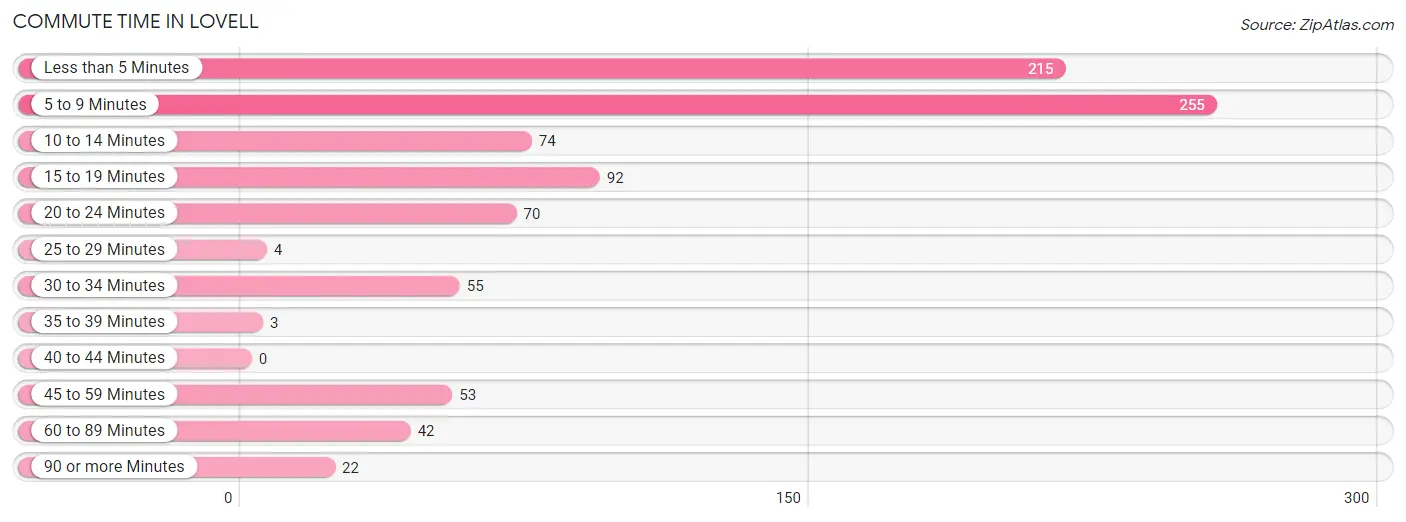
| Commute Time | # Commuters | % Commuters |
| Less than 5 Minutes | 215 | 24.3% |
| 5 to 9 Minutes | 255 | 28.8% |
| 10 to 14 Minutes | 74 | 8.4% |
| 15 to 19 Minutes | 92 | 10.4% |
| 20 to 24 Minutes | 70 | 7.9% |
| 25 to 29 Minutes | 4 | 0.4% |
| 30 to 34 Minutes | 55 | 6.2% |
| 35 to 39 Minutes | 3 | 0.3% |
| 40 to 44 Minutes | 0 | 0.0% |
| 45 to 59 Minutes | 53 | 6.0% |
| 60 to 89 Minutes | 42 | 4.8% |
| 90 or more Minutes | 22 | 2.5% |
Commute Time by Sex in Lovell
The most common commute times in Lovell are 5 to 9 minutes (142 commuters, 28.6%) for males and less than 5 minutes (131 commuters, 33.8%) for females.
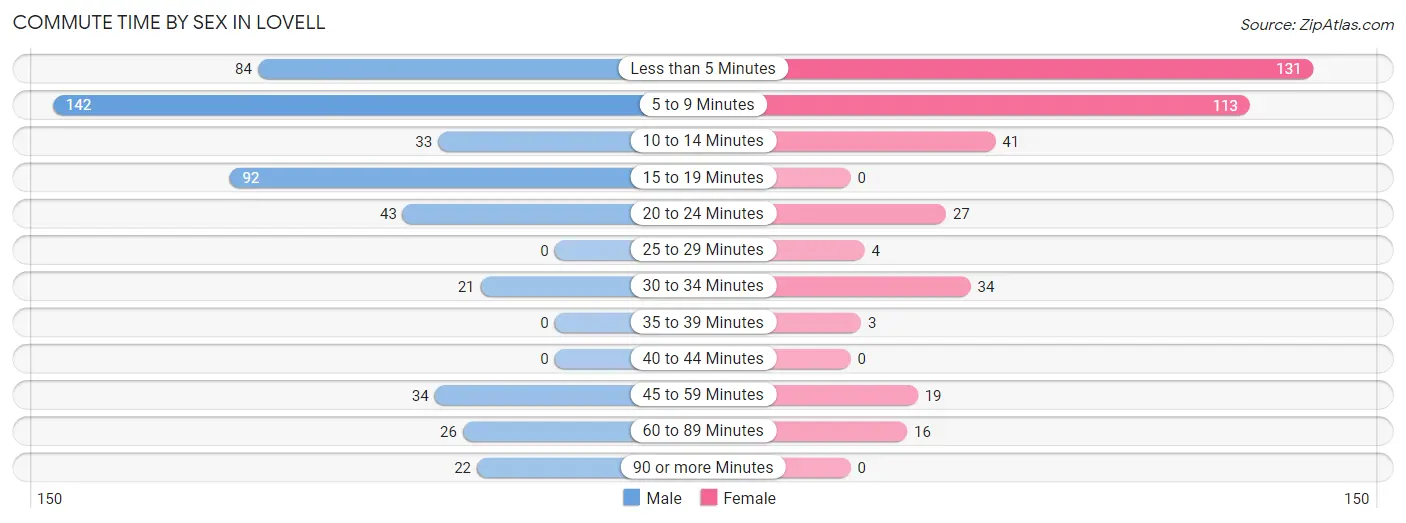
| Commute Time | Male | Female |
| Less than 5 Minutes | 84 (16.9%) | 131 (33.8%) |
| 5 to 9 Minutes | 142 (28.6%) | 113 (29.1%) |
| 10 to 14 Minutes | 33 (6.6%) | 41 (10.6%) |
| 15 to 19 Minutes | 92 (18.5%) | 0 (0.0%) |
| 20 to 24 Minutes | 43 (8.6%) | 27 (7.0%) |
| 25 to 29 Minutes | 0 (0.0%) | 4 (1.0%) |
| 30 to 34 Minutes | 21 (4.2%) | 34 (8.8%) |
| 35 to 39 Minutes | 0 (0.0%) | 3 (0.8%) |
| 40 to 44 Minutes | 0 (0.0%) | 0 (0.0%) |
| 45 to 59 Minutes | 34 (6.8%) | 19 (4.9%) |
| 60 to 89 Minutes | 26 (5.2%) | 16 (4.1%) |
| 90 or more Minutes | 22 (4.4%) | 0 (0.0%) |
Time of Departure to Work by Sex in Lovell
The most frequent times of departure to work in Lovell are 6:00 AM to 6:29 AM (79, 15.9%) for males and 7:30 AM to 7:59 AM (88, 22.7%) for females.
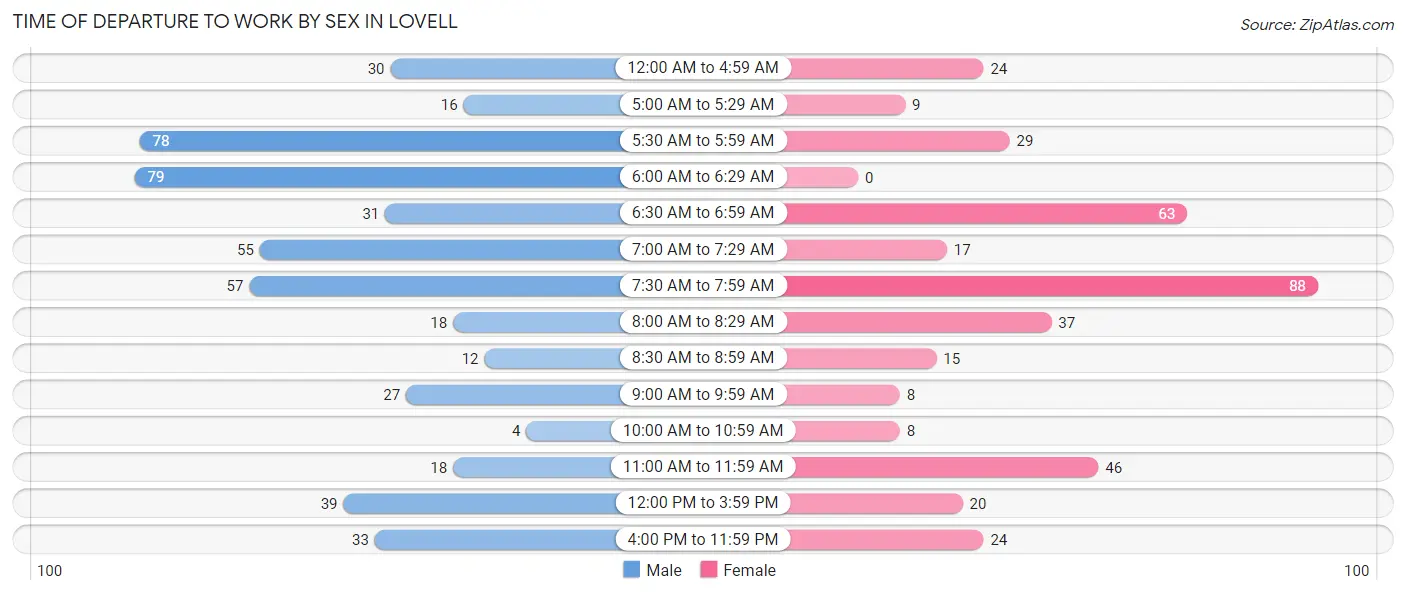
| Time of Departure | Male | Female |
| 12:00 AM to 4:59 AM | 30 (6.0%) | 24 (6.2%) |
| 5:00 AM to 5:29 AM | 16 (3.2%) | 9 (2.3%) |
| 5:30 AM to 5:59 AM | 78 (15.7%) | 29 (7.5%) |
| 6:00 AM to 6:29 AM | 79 (15.9%) | 0 (0.0%) |
| 6:30 AM to 6:59 AM | 31 (6.2%) | 63 (16.2%) |
| 7:00 AM to 7:29 AM | 55 (11.1%) | 17 (4.4%) |
| 7:30 AM to 7:59 AM | 57 (11.5%) | 88 (22.7%) |
| 8:00 AM to 8:29 AM | 18 (3.6%) | 37 (9.5%) |
| 8:30 AM to 8:59 AM | 12 (2.4%) | 15 (3.9%) |
| 9:00 AM to 9:59 AM | 27 (5.4%) | 8 (2.1%) |
| 10:00 AM to 10:59 AM | 4 (0.8%) | 8 (2.1%) |
| 11:00 AM to 11:59 AM | 18 (3.6%) | 46 (11.9%) |
| 12:00 PM to 3:59 PM | 39 (7.9%) | 20 (5.1%) |
| 4:00 PM to 11:59 PM | 33 (6.6%) | 24 (6.2%) |
| Total | 497 (100.0%) | 388 (100.0%) |
Housing Occupancy in Lovell
Occupancy by Ownership in Lovell
Of the total 855 dwellings in Lovell, owner-occupied units account for 625 (73.1%), while renter-occupied units make up 230 (26.9%).
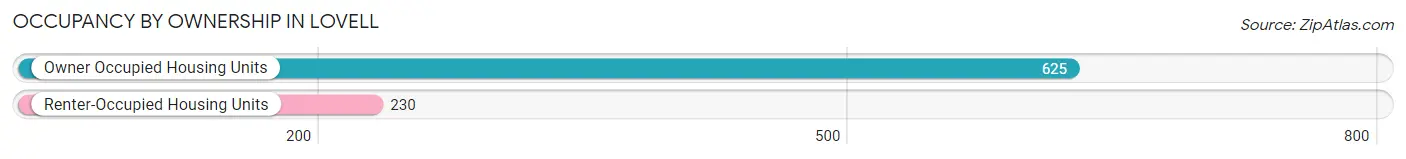
| Occupancy | # Housing Units | % Housing Units |
| Owner Occupied Housing Units | 625 | 73.1% |
| Renter-Occupied Housing Units | 230 | 26.9% |
| Total Occupied Housing Units | 855 | 100.0% |
Occupancy by Household Size in Lovell
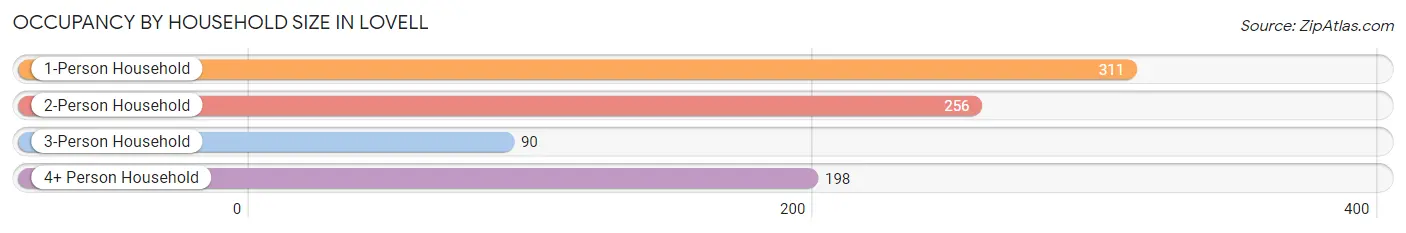
| Household Size | # Housing Units | % Housing Units |
| 1-Person Household | 311 | 36.4% |
| 2-Person Household | 256 | 29.9% |
| 3-Person Household | 90 | 10.5% |
| 4+ Person Household | 198 | 23.2% |
| Total Housing Units | 855 | 100.0% |
Occupancy by Ownership by Household Size in Lovell
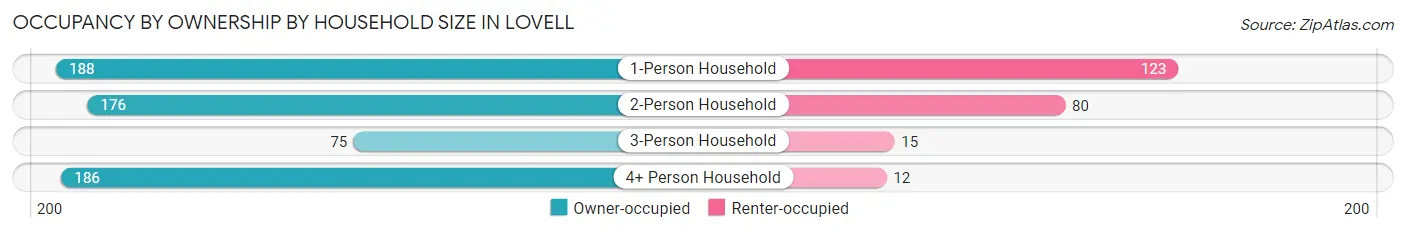
| Household Size | Owner-occupied | Renter-occupied |
| 1-Person Household | 188 (60.5%) | 123 (39.6%) |
| 2-Person Household | 176 (68.8%) | 80 (31.2%) |
| 3-Person Household | 75 (83.3%) | 15 (16.7%) |
| 4+ Person Household | 186 (93.9%) | 12 (6.1%) |
| Total Housing Units | 625 (73.1%) | 230 (26.9%) |
Occupancy by Educational Attainment in Lovell
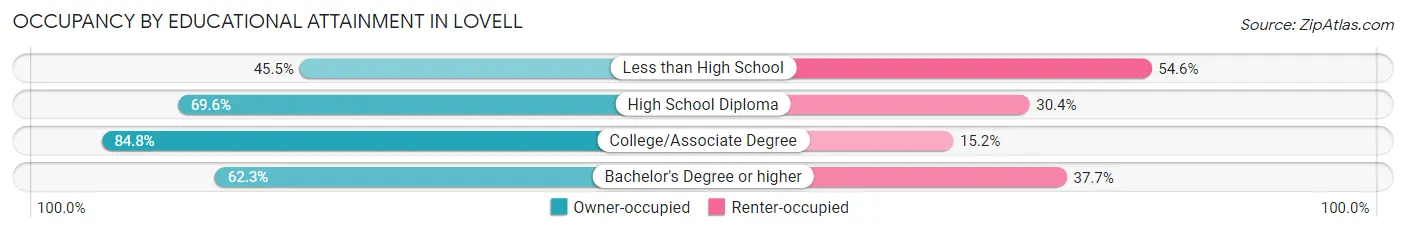
| Household Size | Owner-occupied | Renter-occupied |
| Less than High School | 25 (45.5%) | 30 (54.5%) |
| High School Diploma | 195 (69.6%) | 85 (30.4%) |
| College/Associate Degree | 306 (84.8%) | 55 (15.2%) |
| Bachelor's Degree or higher | 99 (62.3%) | 60 (37.7%) |
Occupancy by Age of Householder in Lovell
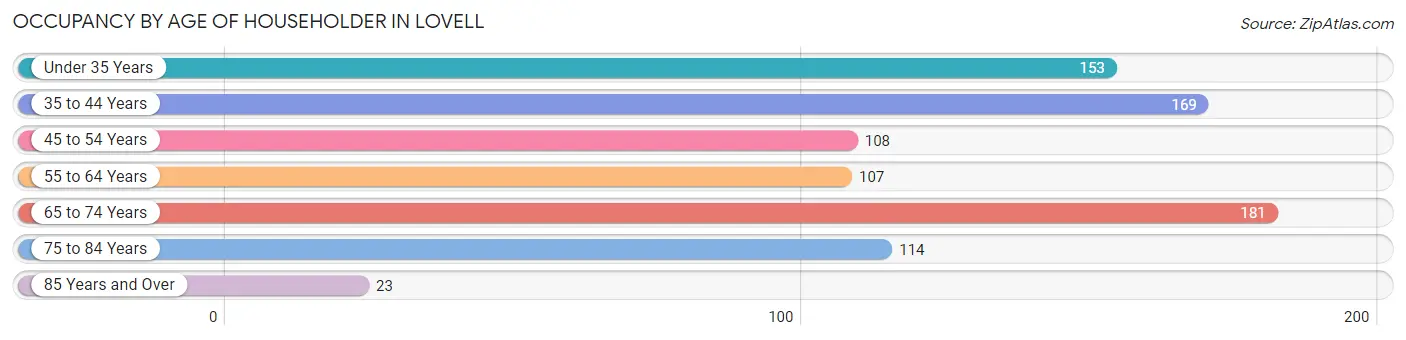
| Age Bracket | # Households | % Households |
| Under 35 Years | 153 | 17.9% |
| 35 to 44 Years | 169 | 19.8% |
| 45 to 54 Years | 108 | 12.6% |
| 55 to 64 Years | 107 | 12.5% |
| 65 to 74 Years | 181 | 21.2% |
| 75 to 84 Years | 114 | 13.3% |
| 85 Years and Over | 23 | 2.7% |
| Total | 855 | 100.0% |
Housing Finances in Lovell
Median Income by Occupancy in Lovell
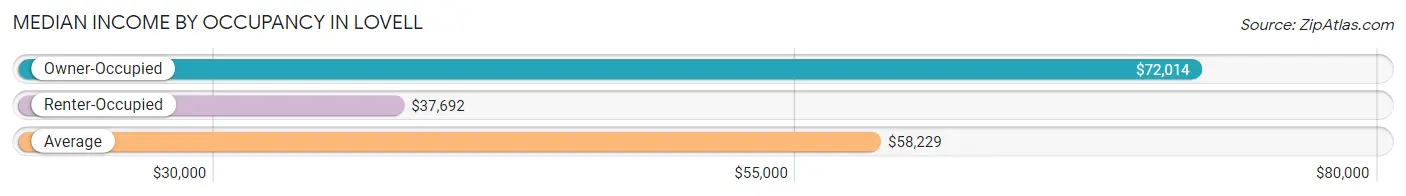
| Occupancy Type | # Households | Median Income |
| Owner-Occupied | 625 (73.1%) | $72,014 |
| Renter-Occupied | 230 (26.9%) | $37,692 |
| Average | 855 (100.0%) | $58,229 |
Occupancy by Householder Income Bracket in Lovell
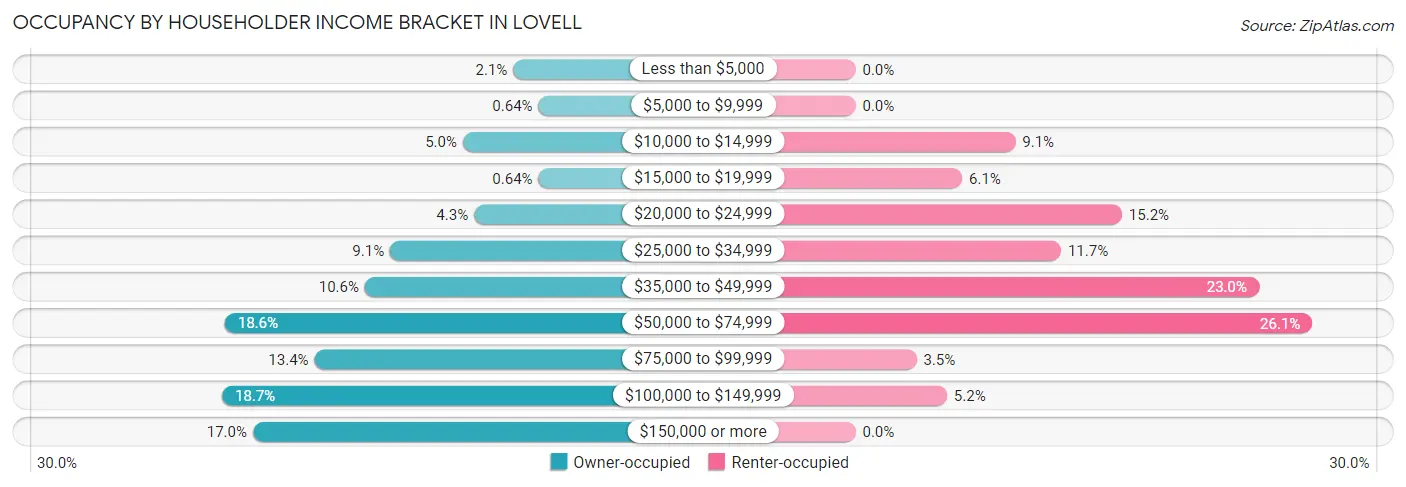
| Income Bracket | Owner-occupied | Renter-occupied |
| Less than $5,000 | 13 (2.1%) | 0 (0.0%) |
| $5,000 to $9,999 | 4 (0.6%) | 0 (0.0%) |
| $10,000 to $14,999 | 31 (5.0%) | 21 (9.1%) |
| $15,000 to $19,999 | 4 (0.6%) | 14 (6.1%) |
| $20,000 to $24,999 | 27 (4.3%) | 35 (15.2%) |
| $25,000 to $34,999 | 57 (9.1%) | 27 (11.7%) |
| $35,000 to $49,999 | 66 (10.6%) | 53 (23.0%) |
| $50,000 to $74,999 | 116 (18.6%) | 60 (26.1%) |
| $75,000 to $99,999 | 84 (13.4%) | 8 (3.5%) |
| $100,000 to $149,999 | 117 (18.7%) | 12 (5.2%) |
| $150,000 or more | 106 (17.0%) | 0 (0.0%) |
| Total | 625 (100.0%) | 230 (100.0%) |
Monthly Housing Cost Tiers in Lovell
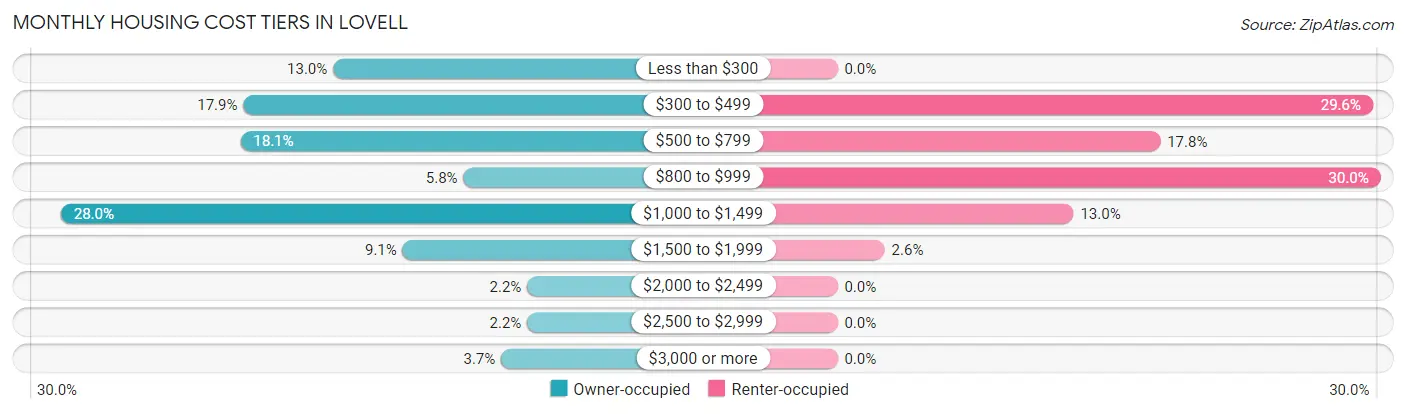
| Monthly Cost | Owner-occupied | Renter-occupied |
| Less than $300 | 81 (13.0%) | 0 (0.0%) |
| $300 to $499 | 112 (17.9%) | 68 (29.6%) |
| $500 to $799 | 113 (18.1%) | 41 (17.8%) |
| $800 to $999 | 36 (5.8%) | 69 (30.0%) |
| $1,000 to $1,499 | 175 (28.0%) | 30 (13.0%) |
| $1,500 to $1,999 | 57 (9.1%) | 6 (2.6%) |
| $2,000 to $2,499 | 14 (2.2%) | 0 (0.0%) |
| $2,500 to $2,999 | 14 (2.2%) | 0 (0.0%) |
| $3,000 or more | 23 (3.7%) | 0 (0.0%) |
| Total | 625 (100.0%) | 230 (100.0%) |
Physical Housing Characteristics in Lovell
Housing Structures in Lovell
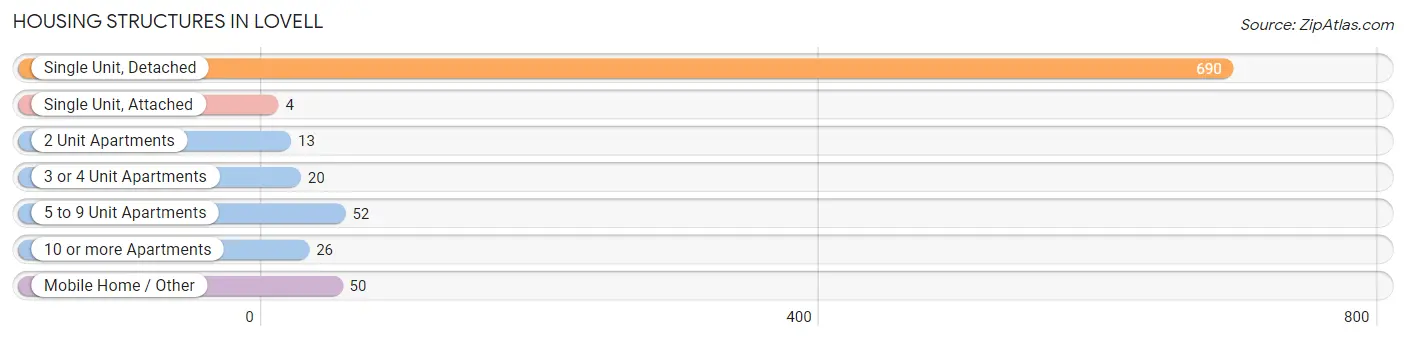
| Structure Type | # Housing Units | % Housing Units |
| Single Unit, Detached | 690 | 80.7% |
| Single Unit, Attached | 4 | 0.5% |
| 2 Unit Apartments | 13 | 1.5% |
| 3 or 4 Unit Apartments | 20 | 2.3% |
| 5 to 9 Unit Apartments | 52 | 6.1% |
| 10 or more Apartments | 26 | 3.0% |
| Mobile Home / Other | 50 | 5.9% |
| Total | 855 | 100.0% |
Housing Structures by Occupancy in Lovell
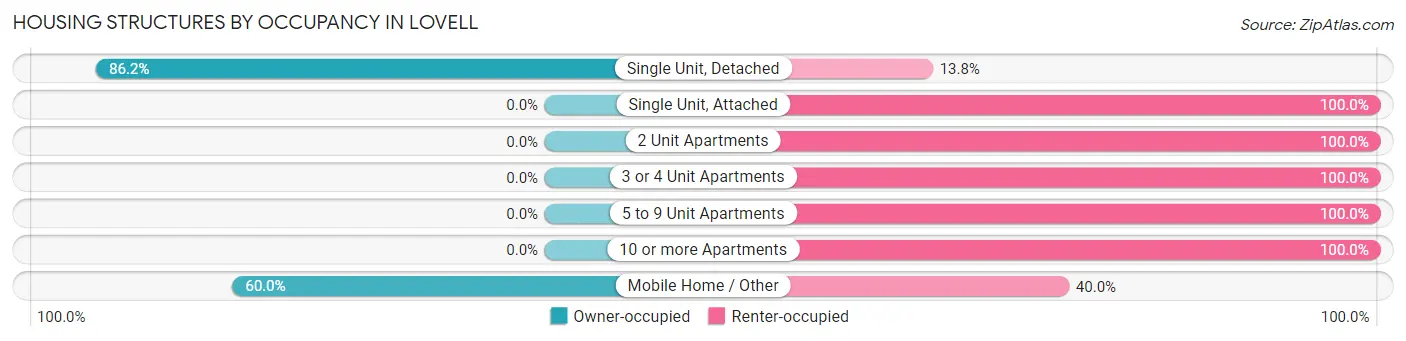
| Structure Type | Owner-occupied | Renter-occupied |
| Single Unit, Detached | 595 (86.2%) | 95 (13.8%) |
| Single Unit, Attached | 0 (0.0%) | 4 (100.0%) |
| 2 Unit Apartments | 0 (0.0%) | 13 (100.0%) |
| 3 or 4 Unit Apartments | 0 (0.0%) | 20 (100.0%) |
| 5 to 9 Unit Apartments | 0 (0.0%) | 52 (100.0%) |
| 10 or more Apartments | 0 (0.0%) | 26 (100.0%) |
| Mobile Home / Other | 30 (60.0%) | 20 (40.0%) |
| Total | 625 (73.1%) | 230 (26.9%) |
Housing Structures by Number of Rooms in Lovell
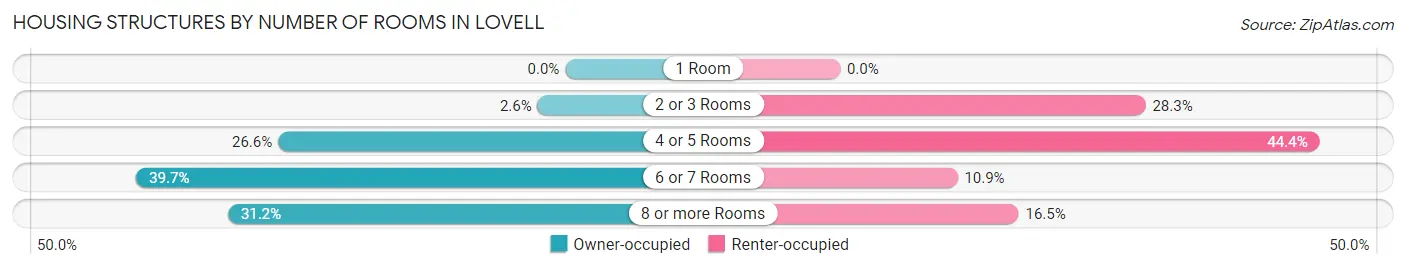
| Number of Rooms | Owner-occupied | Renter-occupied |
| 1 Room | 0 (0.0%) | 0 (0.0%) |
| 2 or 3 Rooms | 16 (2.6%) | 65 (28.3%) |
| 4 or 5 Rooms | 166 (26.6%) | 102 (44.4%) |
| 6 or 7 Rooms | 248 (39.7%) | 25 (10.9%) |
| 8 or more Rooms | 195 (31.2%) | 38 (16.5%) |
| Total | 625 (100.0%) | 230 (100.0%) |
Housing Structure by Heating Type in Lovell
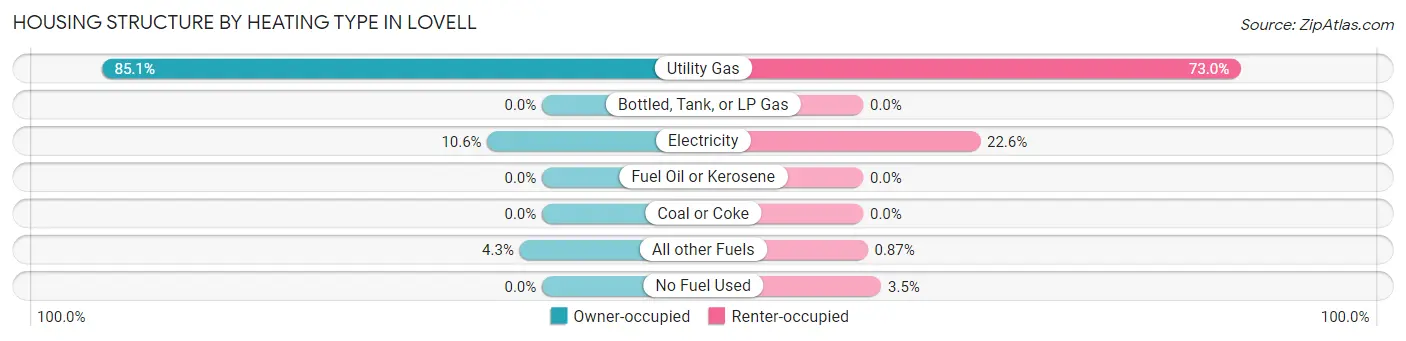
| Heating Type | Owner-occupied | Renter-occupied |
| Utility Gas | 532 (85.1%) | 168 (73.0%) |
| Bottled, Tank, or LP Gas | 0 (0.0%) | 0 (0.0%) |
| Electricity | 66 (10.6%) | 52 (22.6%) |
| Fuel Oil or Kerosene | 0 (0.0%) | 0 (0.0%) |
| Coal or Coke | 0 (0.0%) | 0 (0.0%) |
| All other Fuels | 27 (4.3%) | 2 (0.9%) |
| No Fuel Used | 0 (0.0%) | 8 (3.5%) |
| Total | 625 (100.0%) | 230 (100.0%) |
Household Vehicle Usage in Lovell
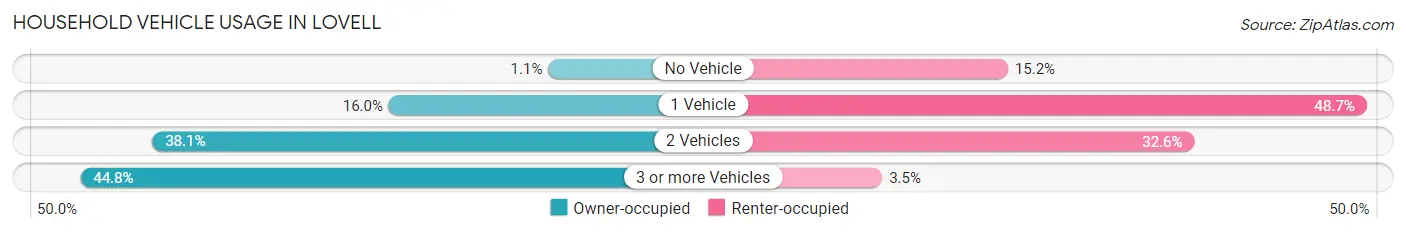
| Vehicles per Household | Owner-occupied | Renter-occupied |
| No Vehicle | 7 (1.1%) | 35 (15.2%) |
| 1 Vehicle | 100 (16.0%) | 112 (48.7%) |
| 2 Vehicles | 238 (38.1%) | 75 (32.6%) |
| 3 or more Vehicles | 280 (44.8%) | 8 (3.5%) |
| Total | 625 (100.0%) | 230 (100.0%) |
Real Estate & Mortgages in Lovell
Real Estate and Mortgage Overview in Lovell
| Characteristic | Without Mortgage | With Mortgage |
| Housing Units | 297 | 328 |
| Median Property Value | $160,400 | $194,800 |
| Median Household Income | $53,819 | $74 |
| Monthly Housing Costs | $396 | $16 |
| Real Estate Taxes | $1,150 | $10 |
Property Value by Mortgage Status in Lovell
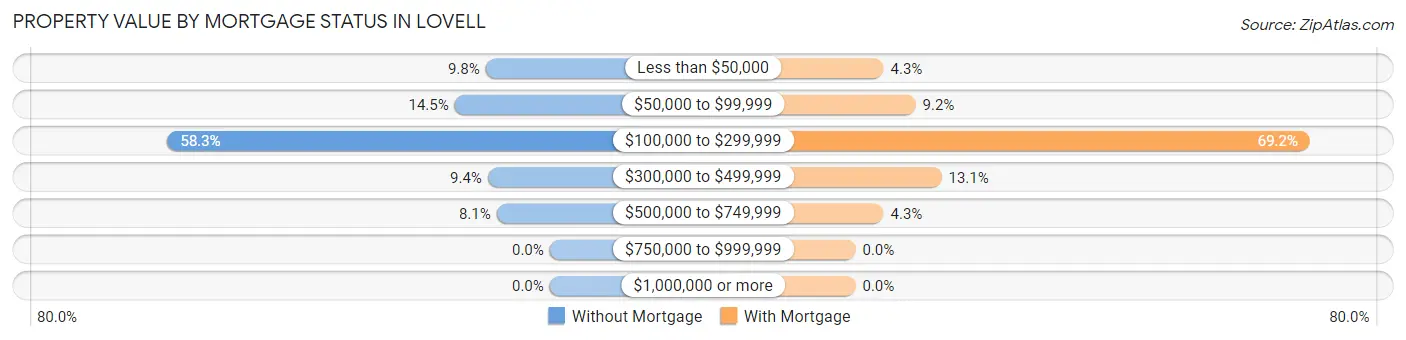
| Property Value | Without Mortgage | With Mortgage |
| Less than $50,000 | 29 (9.8%) | 14 (4.3%) |
| $50,000 to $99,999 | 43 (14.5%) | 30 (9.1%) |
| $100,000 to $299,999 | 173 (58.3%) | 227 (69.2%) |
| $300,000 to $499,999 | 28 (9.4%) | 43 (13.1%) |
| $500,000 to $749,999 | 24 (8.1%) | 14 (4.3%) |
| $750,000 to $999,999 | 0 (0.0%) | 0 (0.0%) |
| $1,000,000 or more | 0 (0.0%) | 0 (0.0%) |
| Total | 297 (100.0%) | 328 (100.0%) |
Household Income by Mortgage Status in Lovell
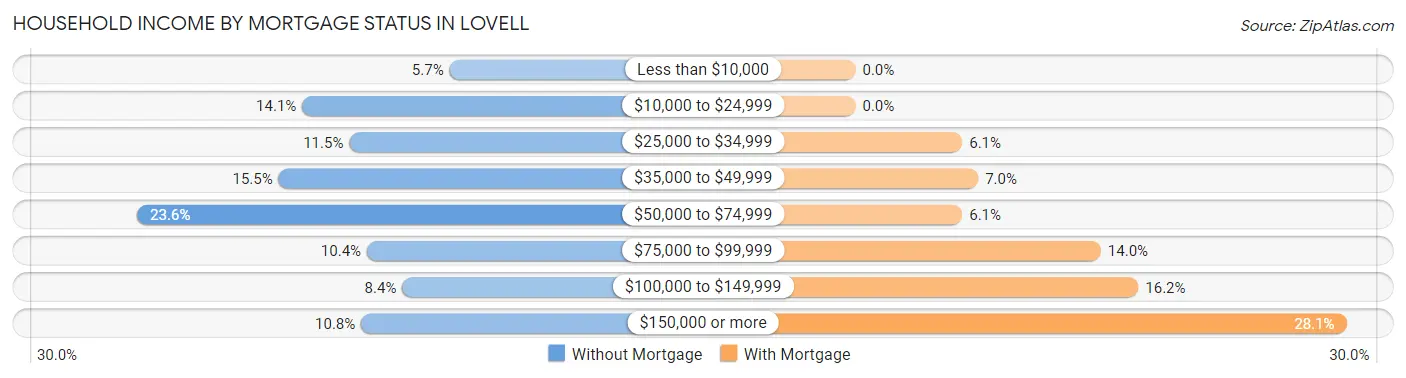
| Household Income | Without Mortgage | With Mortgage |
| Less than $10,000 | 17 (5.7%) | 0 (0.0%) |
| $10,000 to $24,999 | 42 (14.1%) | 0 (0.0%) |
| $25,000 to $34,999 | 34 (11.5%) | 20 (6.1%) |
| $35,000 to $49,999 | 46 (15.5%) | 23 (7.0%) |
| $50,000 to $74,999 | 70 (23.6%) | 20 (6.1%) |
| $75,000 to $99,999 | 31 (10.4%) | 46 (14.0%) |
| $100,000 to $149,999 | 25 (8.4%) | 53 (16.2%) |
| $150,000 or more | 32 (10.8%) | 92 (28.1%) |
| Total | 297 (100.0%) | 328 (100.0%) |
Property Value to Household Income Ratio in Lovell
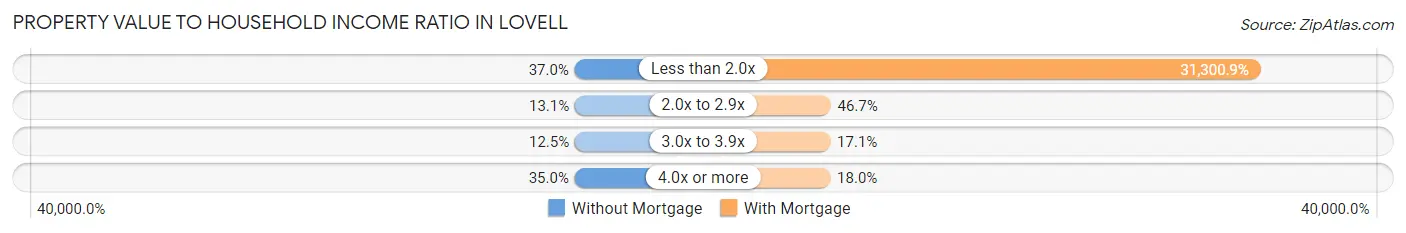
| Value-to-Income Ratio | Without Mortgage | With Mortgage |
| Less than 2.0x | 110 (37.0%) | 102,667 (31,300.9%) |
| 2.0x to 2.9x | 39 (13.1%) | 153 (46.7%) |
| 3.0x to 3.9x | 37 (12.5%) | 56 (17.1%) |
| 4.0x or more | 104 (35.0%) | 59 (18.0%) |
| Total | 297 (100.0%) | 328 (100.0%) |
Real Estate Taxes by Mortgage Status in Lovell
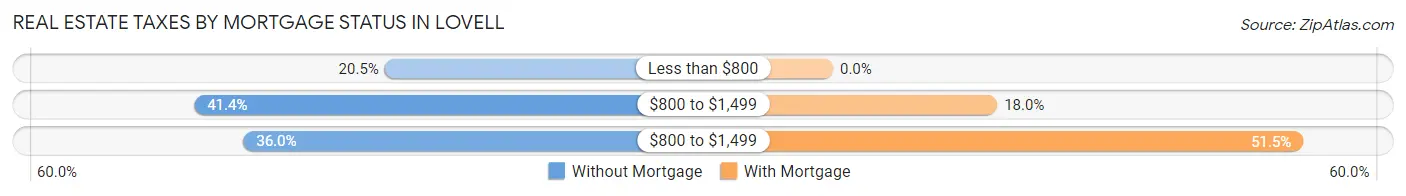
| Property Taxes | Without Mortgage | With Mortgage |
| Less than $800 | 61 (20.5%) | 0 (0.0%) |
| $800 to $1,499 | 123 (41.4%) | 59 (18.0%) |
| $800 to $1,499 | 107 (36.0%) | 169 (51.5%) |
| Total | 297 (100.0%) | 328 (100.0%) |
Health & Disability in Lovell
Health Insurance Coverage by Age in Lovell
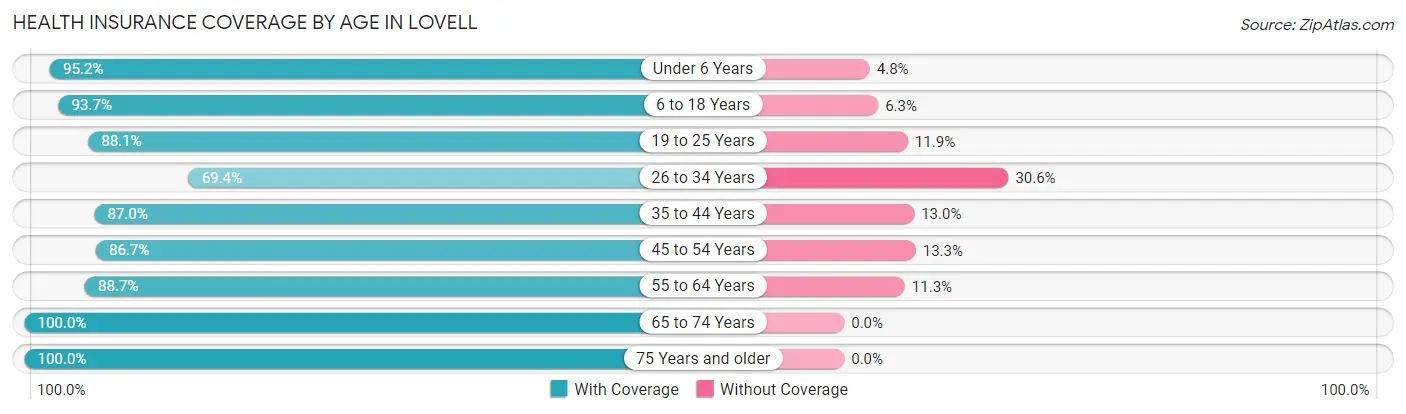
| Age Bracket | With Coverage | Without Coverage |
| Under 6 Years | 140 (95.2%) | 7 (4.8%) |
| 6 to 18 Years | 429 (93.7%) | 29 (6.3%) |
| 19 to 25 Years | 89 (88.1%) | 12 (11.9%) |
| 26 to 34 Years | 136 (69.4%) | 60 (30.6%) |
| 35 to 44 Years | 300 (87.0%) | 45 (13.0%) |
| 45 to 54 Years | 182 (86.7%) | 28 (13.3%) |
| 55 to 64 Years | 212 (88.7%) | 27 (11.3%) |
| 65 to 74 Years | 253 (100.0%) | 0 (0.0%) |
| 75 Years and older | 158 (100.0%) | 0 (0.0%) |
| Total | 1,899 (90.1%) | 208 (9.9%) |
Health Insurance Coverage by Citizenship Status in Lovell
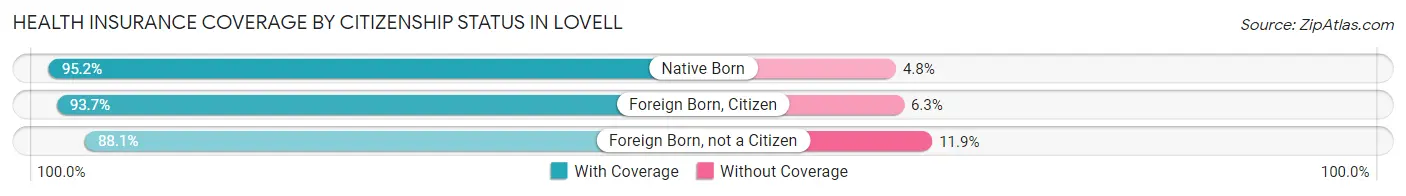
| Citizenship Status | With Coverage | Without Coverage |
| Native Born | 140 (95.2%) | 7 (4.8%) |
| Foreign Born, Citizen | 429 (93.7%) | 29 (6.3%) |
| Foreign Born, not a Citizen | 89 (88.1%) | 12 (11.9%) |
Health Insurance Coverage by Household Income in Lovell
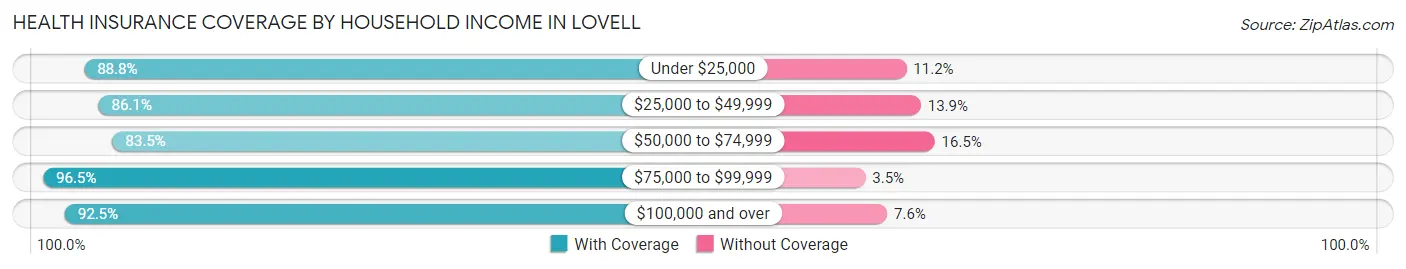
| Household Income | With Coverage | Without Coverage |
| Under $25,000 | 175 (88.8%) | 22 (11.2%) |
| $25,000 to $49,999 | 379 (86.1%) | 61 (13.9%) |
| $50,000 to $74,999 | 264 (83.5%) | 52 (16.5%) |
| $75,000 to $99,999 | 334 (96.5%) | 12 (3.5%) |
| $100,000 and over | 747 (92.4%) | 61 (7.5%) |
Public vs Private Health Insurance Coverage by Age in Lovell
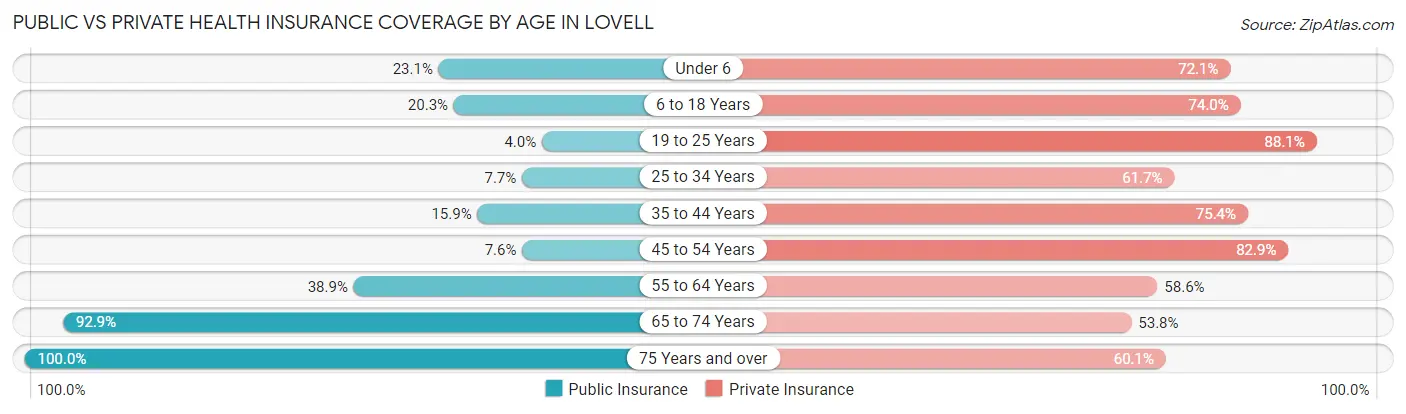
| Age Bracket | Public Insurance | Private Insurance |
| Under 6 | 34 (23.1%) | 106 (72.1%) |
| 6 to 18 Years | 93 (20.3%) | 339 (74.0%) |
| 19 to 25 Years | 4 (4.0%) | 89 (88.1%) |
| 25 to 34 Years | 15 (7.6%) | 121 (61.7%) |
| 35 to 44 Years | 55 (15.9%) | 260 (75.4%) |
| 45 to 54 Years | 16 (7.6%) | 174 (82.9%) |
| 55 to 64 Years | 93 (38.9%) | 140 (58.6%) |
| 65 to 74 Years | 235 (92.9%) | 136 (53.7%) |
| 75 Years and over | 158 (100.0%) | 95 (60.1%) |
| Total | 703 (33.4%) | 1,460 (69.3%) |
Disability Status by Sex by Age in Lovell
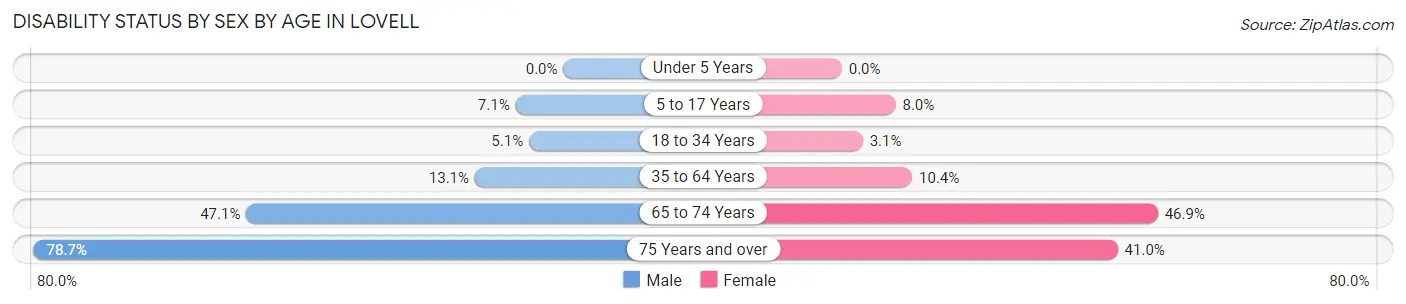
| Age Bracket | Male | Female |
| Under 5 Years | 0 (0.0%) | 0 (0.0%) |
| 5 to 17 Years | 17 (7.1%) | 17 (8.0%) |
| 18 to 34 Years | 8 (5.1%) | 5 (3.1%) |
| 35 to 64 Years | 54 (13.1%) | 40 (10.4%) |
| 65 to 74 Years | 81 (47.1%) | 38 (46.9%) |
| 75 Years and over | 59 (78.7%) | 34 (41.0%) |
Disability Class by Sex by Age in Lovell
Disability Class: Hearing Difficulty
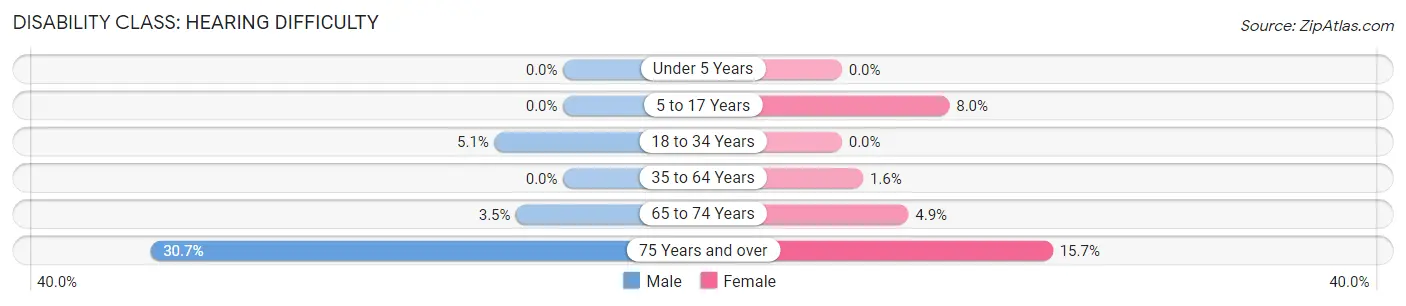
| Age Bracket | Male | Female |
| Under 5 Years | 0 (0.0%) | 0 (0.0%) |
| 5 to 17 Years | 0 (0.0%) | 17 (8.0%) |
| 18 to 34 Years | 8 (5.1%) | 0 (0.0%) |
| 35 to 64 Years | 0 (0.0%) | 6 (1.6%) |
| 65 to 74 Years | 6 (3.5%) | 4 (4.9%) |
| 75 Years and over | 23 (30.7%) | 13 (15.7%) |
Disability Class: Vision Difficulty
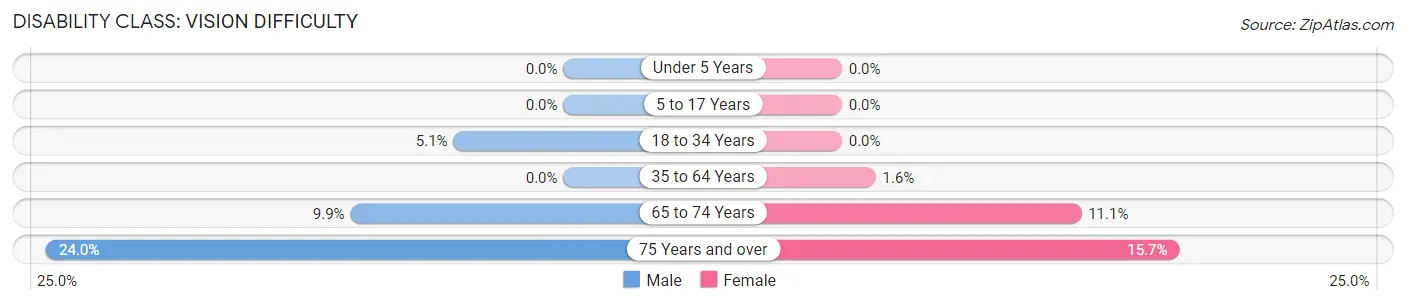
| Age Bracket | Male | Female |
| Under 5 Years | 0 (0.0%) | 0 (0.0%) |
| 5 to 17 Years | 0 (0.0%) | 0 (0.0%) |
| 18 to 34 Years | 8 (5.1%) | 0 (0.0%) |
| 35 to 64 Years | 0 (0.0%) | 6 (1.6%) |
| 65 to 74 Years | 17 (9.9%) | 9 (11.1%) |
| 75 Years and over | 18 (24.0%) | 13 (15.7%) |
Disability Class: Cognitive Difficulty
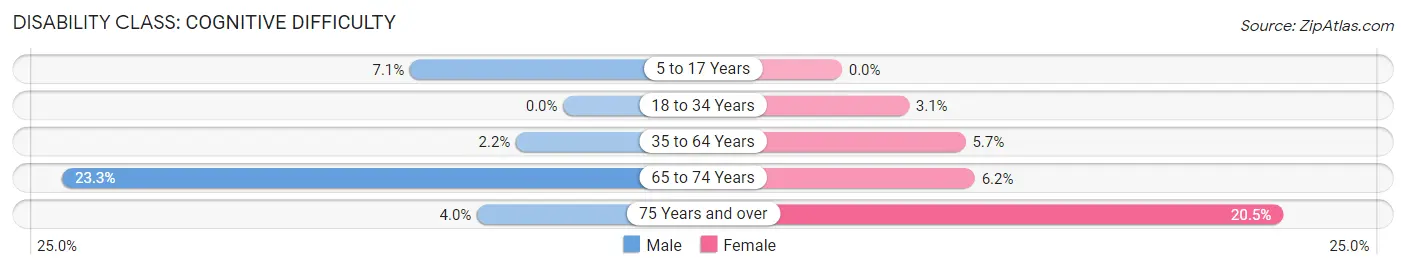
| Age Bracket | Male | Female |
| 5 to 17 Years | 17 (7.1%) | 0 (0.0%) |
| 18 to 34 Years | 0 (0.0%) | 5 (3.1%) |
| 35 to 64 Years | 9 (2.2%) | 22 (5.7%) |
| 65 to 74 Years | 40 (23.3%) | 5 (6.2%) |
| 75 Years and over | 3 (4.0%) | 17 (20.5%) |
Disability Class: Ambulatory Difficulty
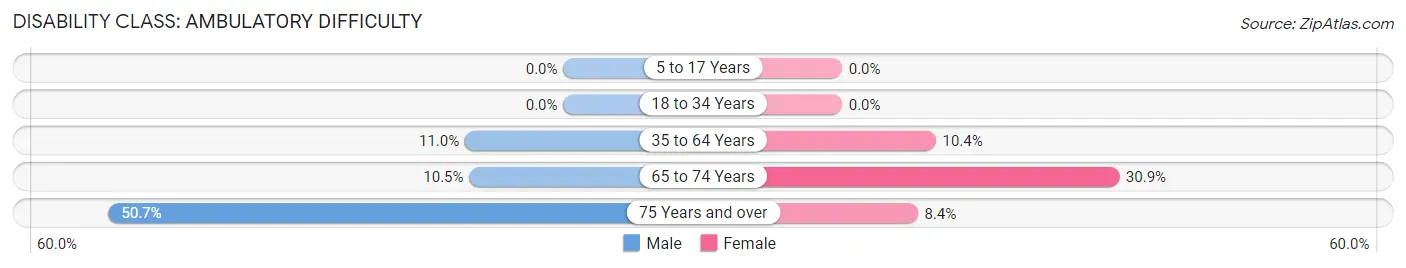
| Age Bracket | Male | Female |
| 5 to 17 Years | 0 (0.0%) | 0 (0.0%) |
| 18 to 34 Years | 0 (0.0%) | 0 (0.0%) |
| 35 to 64 Years | 45 (11.0%) | 40 (10.4%) |
| 65 to 74 Years | 18 (10.5%) | 25 (30.9%) |
| 75 Years and over | 38 (50.7%) | 7 (8.4%) |
Disability Class: Self-Care Difficulty
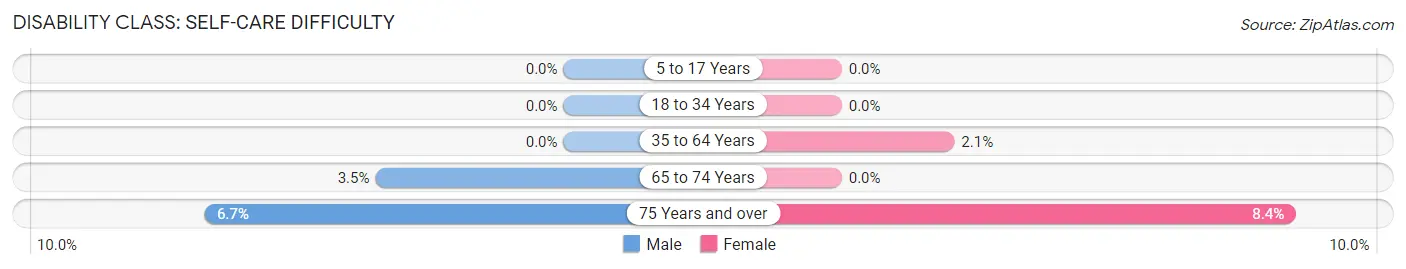
| Age Bracket | Male | Female |
| 5 to 17 Years | 0 (0.0%) | 0 (0.0%) |
| 18 to 34 Years | 0 (0.0%) | 0 (0.0%) |
| 35 to 64 Years | 0 (0.0%) | 8 (2.1%) |
| 65 to 74 Years | 6 (3.5%) | 0 (0.0%) |
| 75 Years and over | 5 (6.7%) | 7 (8.4%) |
Technology Access in Lovell
Computing Device Access in Lovell
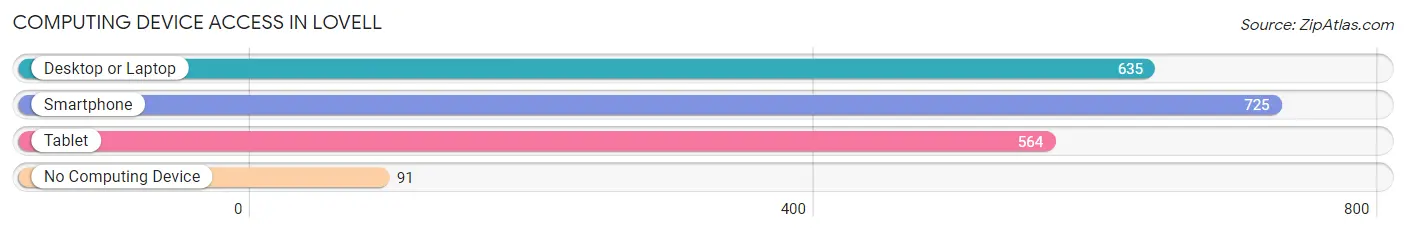
| Device Type | # Households | % Households |
| Desktop or Laptop | 635 | 74.3% |
| Smartphone | 725 | 84.8% |
| Tablet | 564 | 66.0% |
| No Computing Device | 91 | 10.6% |
| Total | 855 | 100.0% |
Internet Access in Lovell
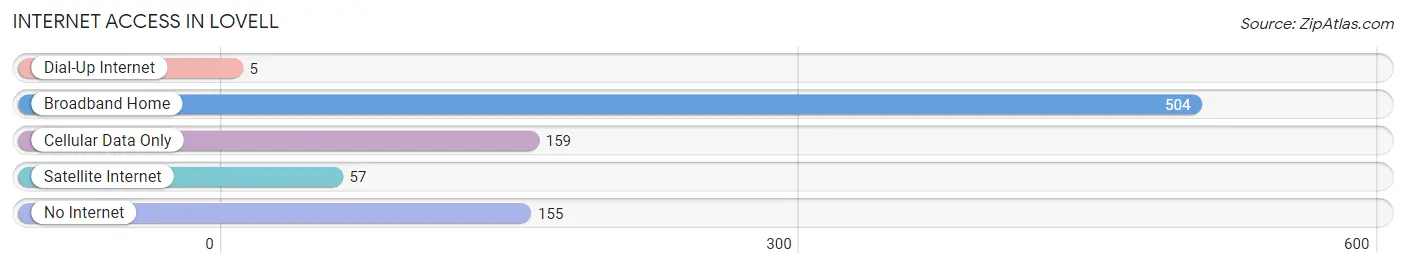
| Internet Type | # Households | % Households |
| Dial-Up Internet | 5 | 0.6% |
| Broadband Home | 504 | 59.0% |
| Cellular Data Only | 159 | 18.6% |
| Satellite Internet | 57 | 6.7% |
| No Internet | 155 | 18.1% |
| Total | 855 | 100.0% |
Lovell Summary
Lovell, Wyoming is a small town located in the northern part of the state, in Big Horn County. It is situated on the banks of the Bighorn River, and is surrounded by the Big Horn Mountains. The town was founded in 1884, and has a population of approximately 2,000 people.
The town of Lovell was named after William Lovell, a rancher who settled in the area in the late 1800s. The town was originally a trading post for the local Native American tribes, and was later used as a stopover for travelers on the Oregon Trail. The town was officially incorporated in 1887, and has since grown to become a thriving community.
The geography of Lovell is characterized by its location in the Big Horn Basin, which is a large, flat area surrounded by mountains. The town is located at an elevation of 4,400 feet, and is situated on the banks of the Bighorn River. The area is known for its wide open spaces, and is home to a variety of wildlife, including deer, elk, antelope, and bighorn sheep.
The economy of Lovell is largely based on agriculture and tourism. The town is home to several large ranches, and is a popular destination for hunters and fishermen. The town also has a thriving retail sector, with several stores and restaurants. The town is also home to a number of small businesses, including a local newspaper, a hardware store, and a variety of other services.
The demographics of Lovell are largely made up of white, non-Hispanic residents. The town has a median household income of $41,000, and the median age is 38. The town is also home to a large number of Native Americans, with the largest population being the Northern Arapaho tribe.
Lovell is a small town with a rich history and a vibrant economy. The town is home to a variety of businesses, and is a popular destination for tourists and outdoor enthusiasts. The town is also home to a diverse population, and is a great place to live and work.
Common Questions
What is Per Capita Income in Lovell?
Per Capita income in Lovell is $32,268.
What is the Median Family Income in Lovell?
Median Family Income in Lovell is $83,333.
What is the Median Household income in Lovell?
Median Household Income in Lovell is $58,229.
What is Income or Wage Gap in Lovell?
Income or Wage Gap in Lovell is 47.3%.
Women in Lovell earn 52.7 cents for every dollar earned by a man.
What is Inequality or Gini Index in Lovell?
Inequality or Gini Index in Lovell is 0.41.
What is the Total Population of Lovell?
Total Population of Lovell is 2,178.
What is the Total Male Population of Lovell?
Total Male Population of Lovell is 1,171.
What is the Total Female Population of Lovell?
Total Female Population of Lovell is 1,007.
What is the Ratio of Males per 100 Females in Lovell?
There are 116.29 Males per 100 Females in Lovell.
What is the Ratio of Females per 100 Males in Lovell?
There are 85.99 Females per 100 Males in Lovell.
What is the Median Population Age in Lovell?
Median Population Age in Lovell is 40.1 Years.
What is the Average Family Size in Lovell
Average Family Size in Lovell is 3.3 People.
What is the Average Household Size in Lovell
Average Household Size in Lovell is 2.5 People.
How Large is the Labor Force in Lovell?
There are 966 People in the Labor Forcein in Lovell.
What is the Percentage of People in the Labor Force in Lovell?
58.6% of People are in the Labor Force in Lovell.
What is the Unemployment Rate in Lovell?
Unemployment Rate in Lovell is 2.9%.