Hulett, WY Map & Demographics
Hulett Map
Hulett Overview
$41,627
PER CAPITA INCOME
$102,125
AVG FAMILY INCOME
$68,177
AVG HOUSEHOLD INCOME
48.5%
WAGE / INCOME GAP [ % ]
51.5¢/ $1
WAGE / INCOME GAP [ $ ]
0.41
INEQUALITY / GINI INDEX
414
TOTAL POPULATION
252
MALE POPULATION
162
FEMALE POPULATION
155.56
MALES / 100 FEMALES
64.29
FEMALES / 100 MALES
50.8
MEDIAN AGE
3.3
AVG FAMILY SIZE
2.1
AVG HOUSEHOLD SIZE
292
LABOR FORCE [ PEOPLE ]
83.4%
PERCENT IN LABOR FORCE
Hulett Zip Codes
Hulett Area Codes
Income in Hulett
Income Overview in Hulett
Per Capita Income in Hulett is $41,627, while median incomes of families and households are $102,125 and $68,177 respectively.
| Characteristic | Number | Measure |
| Per Capita Income | 414 | $41,627 |
| Median Family Income | 81 | $102,125 |
| Mean Family Income | 81 | $125,085 |
| Median Household Income | 193 | $68,177 |
| Mean Household Income | 193 | $79,122 |
| Income Deficit | 81 | $0 |
| Wage / Income Gap (%) | 414 | 48.45% |
| Wage / Income Gap ($) | 414 | 51.55¢ per $1 |
| Gini / Inequality Index | 414 | 0.41 |
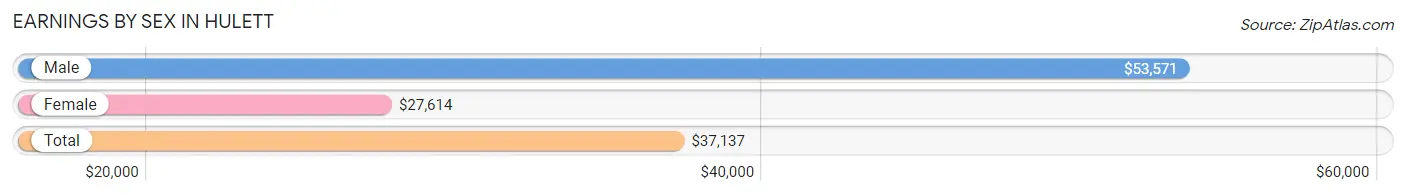
Earnings by Sex in Hulett
Average Earnings in Hulett are $37,137, $53,571 for men and $27,614 for women, a difference of 48.4%.
| Sex | Number | Average Earnings |
| Male | 182 (60.5%) | $53,571 |
| Female | 119 (39.5%) | $27,614 |
| Total | 301 (100.0%) | $37,137 |
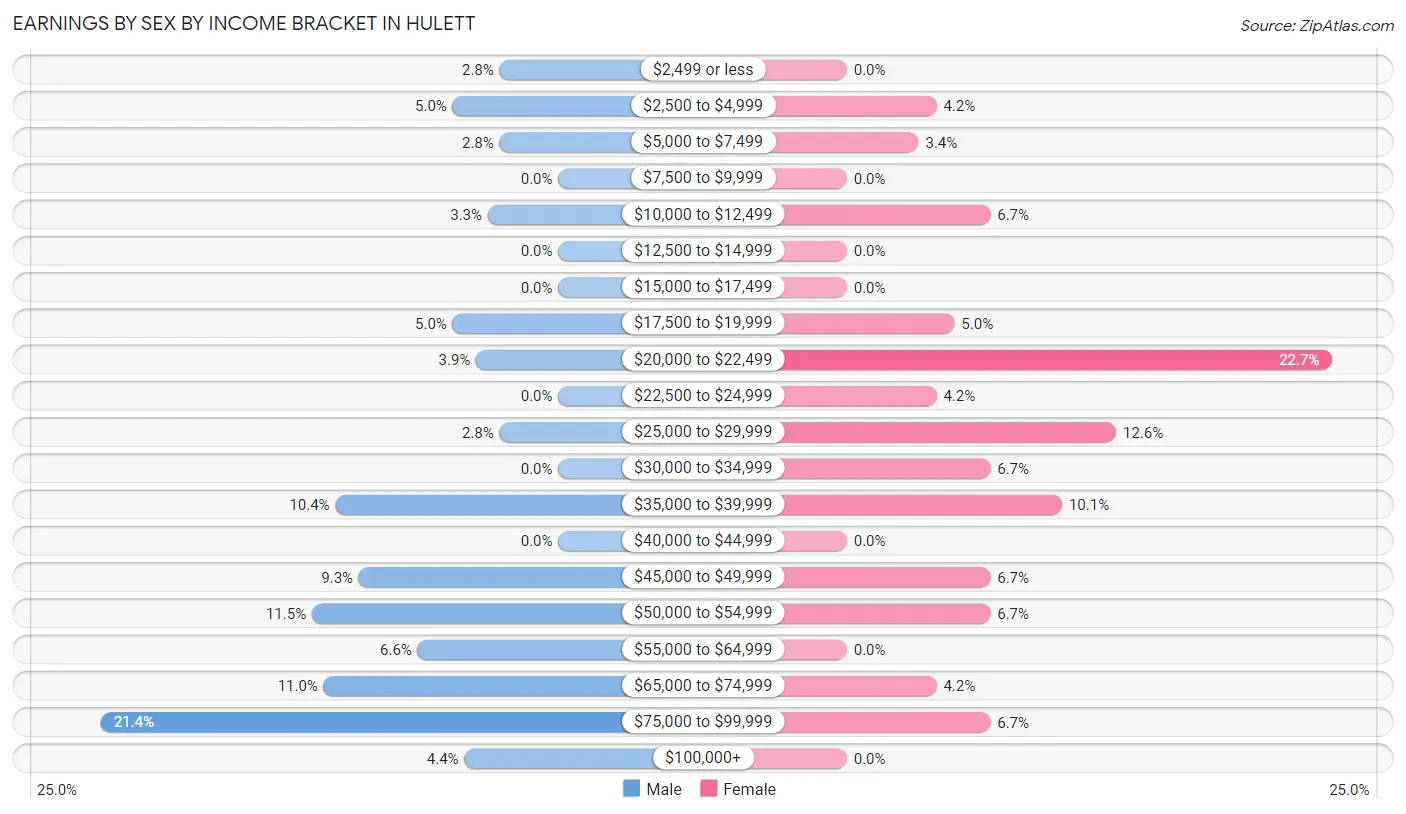
Earnings by Sex by Income Bracket in Hulett
The most common earnings brackets in Hulett are $75,000 to $99,999 for men (39 | 21.4%) and $20,000 to $22,499 for women (27 | 22.7%).
| Income | Male | Female |
| $2,499 or less | 5 (2.8%) | 0 (0.0%) |
| $2,500 to $4,999 | 9 (5.0%) | 5 (4.2%) |
| $5,000 to $7,499 | 5 (2.8%) | 4 (3.4%) |
| $7,500 to $9,999 | 0 (0.0%) | 0 (0.0%) |
| $10,000 to $12,499 | 6 (3.3%) | 8 (6.7%) |
| $12,500 to $14,999 | 0 (0.0%) | 0 (0.0%) |
| $15,000 to $17,499 | 0 (0.0%) | 0 (0.0%) |
| $17,500 to $19,999 | 9 (5.0%) | 6 (5.0%) |
| $20,000 to $22,499 | 7 (3.8%) | 27 (22.7%) |
| $22,500 to $24,999 | 0 (0.0%) | 5 (4.2%) |
| $25,000 to $29,999 | 5 (2.8%) | 15 (12.6%) |
| $30,000 to $34,999 | 0 (0.0%) | 8 (6.7%) |
| $35,000 to $39,999 | 19 (10.4%) | 12 (10.1%) |
| $40,000 to $44,999 | 0 (0.0%) | 0 (0.0%) |
| $45,000 to $49,999 | 17 (9.3%) | 8 (6.7%) |
| $50,000 to $54,999 | 21 (11.5%) | 8 (6.7%) |
| $55,000 to $64,999 | 12 (6.6%) | 0 (0.0%) |
| $65,000 to $74,999 | 20 (11.0%) | 5 (4.2%) |
| $75,000 to $99,999 | 39 (21.4%) | 8 (6.7%) |
| $100,000+ | 8 (4.4%) | 0 (0.0%) |
| Total | 182 (100.0%) | 119 (100.0%) |
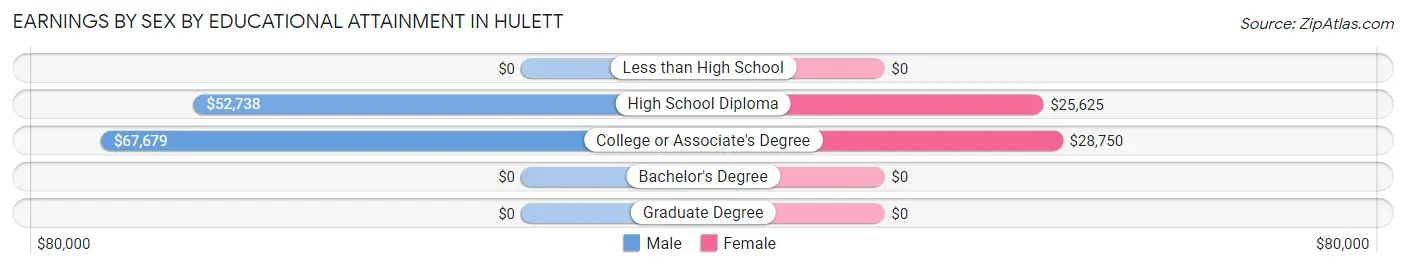
Earnings by Sex by Educational Attainment in Hulett
Average earnings in Hulett are $53,452 for men and $27,614 for women, a difference of 48.3%. Men with an educational attainment of college or associate's degree enjoy the highest average annual earnings of $67,679, while those with high school diploma education earn the least with $52,738. Women with an educational attainment of college or associate's degree earn the most with the average annual earnings of $28,750, while those with high school diploma education have the smallest earnings of $25,625.
| Educational Attainment | Male Income | Female Income |
| Less than High School | - | - |
| High School Diploma | $52,738 | $25,625 |
| College or Associate's Degree | $67,679 | $28,750 |
| Bachelor's Degree | - | - |
| Graduate Degree | - | - |
| Total | $53,452 | $27,614 |
Family Income in Hulett
Family Income Brackets in Hulett
According to the Hulett family income data, there are 38 families falling into the $100,000 to $149,999 income range, which is the most common income bracket and makes up 46.9% of all families.
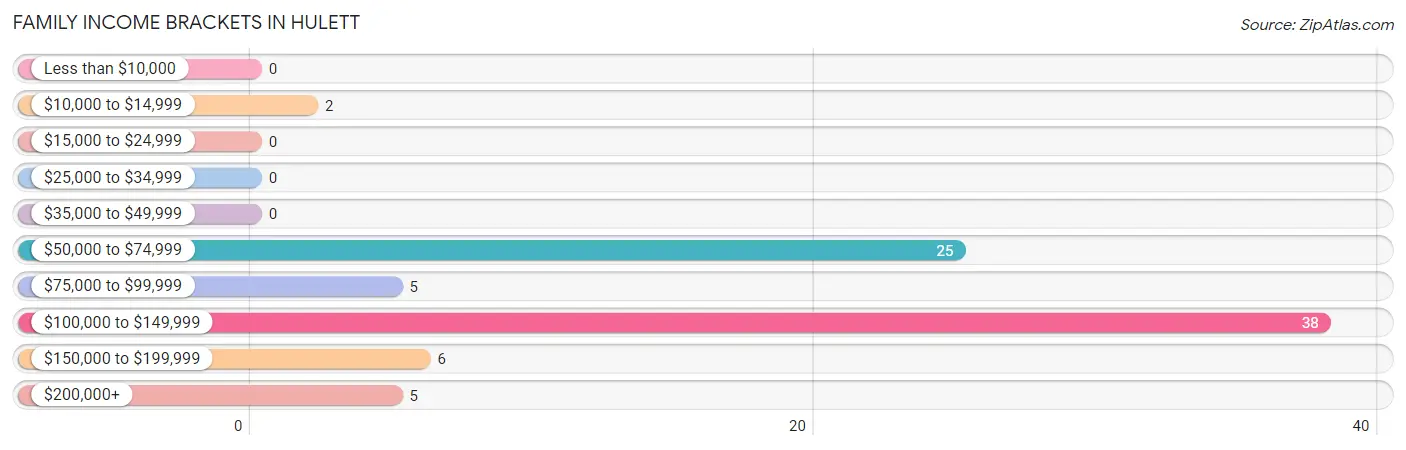
| Income Bracket | # Families | % Families |
| Less than $10,000 | 0 | 0.0% |
| $10,000 to $14,999 | 2 | 2.5% |
| $15,000 to $24,999 | 0 | 0.0% |
| $25,000 to $34,999 | 0 | 0.0% |
| $35,000 to $49,999 | 0 | 0.0% |
| $50,000 to $74,999 | 25 | 30.9% |
| $75,000 to $99,999 | 5 | 6.2% |
| $100,000 to $149,999 | 38 | 46.9% |
| $150,000 to $199,999 | 6 | 7.4% |
| $200,000+ | 5 | 6.2% |
Family Income by Famaliy Size in Hulett
4-person families (16 | 19.8%) account for the highest median family income in Hulett with $158,750 per family, while 2-person families (59 | 72.8%) have the highest median income of $45,625 per family member.
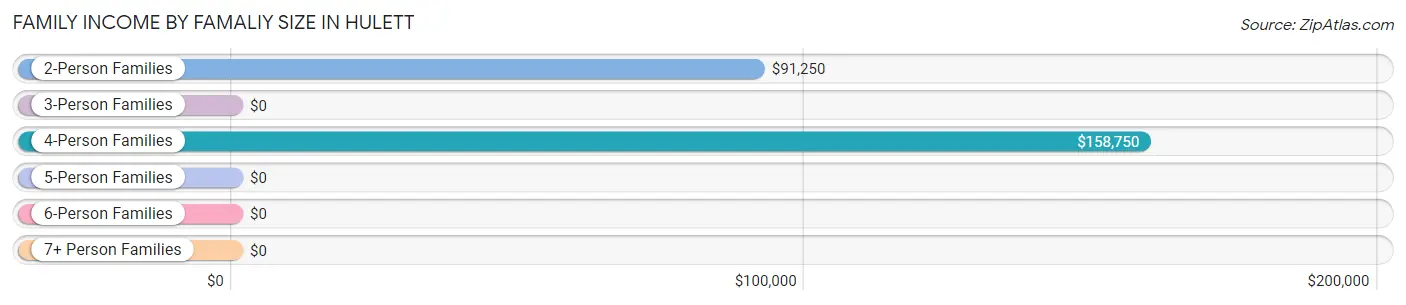
| Income Bracket | # Families | Median Income |
| 2-Person Families | 59 (72.8%) | $91,250 |
| 3-Person Families | 6 (7.4%) | $0 |
| 4-Person Families | 16 (19.8%) | $158,750 |
| 5-Person Families | 0 (0.0%) | $0 |
| 6-Person Families | 0 (0.0%) | $0 |
| 7+ Person Families | 0 (0.0%) | $0 |
| Total | 81 (100.0%) | $102,125 |
Family Income by Number of Earners in Hulett
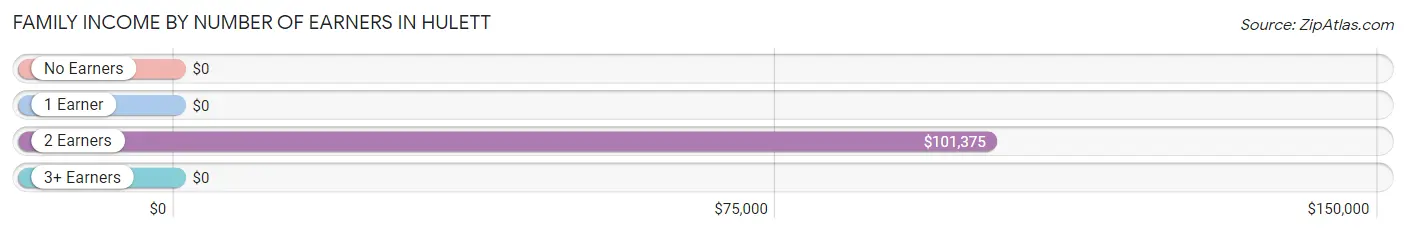
| Number of Earners | # Families | Median Income |
| No Earners | 2 (2.5%) | $0 |
| 1 Earner | 8 (9.9%) | $0 |
| 2 Earners | 71 (87.6%) | $101,375 |
| 3+ Earners | 0 (0.0%) | $0 |
| Total | 81 (100.0%) | $102,125 |
Household Income in Hulett
Household Income Brackets in Hulett
With 57 households falling in the category, the $50,000 to $74,999 income range is the most frequent in Hulett, accounting for 29.5% of all households. In contrast, only 2 households (1.0%) fall into the $10,000 to $14,999 income bracket, making it the least populous group.
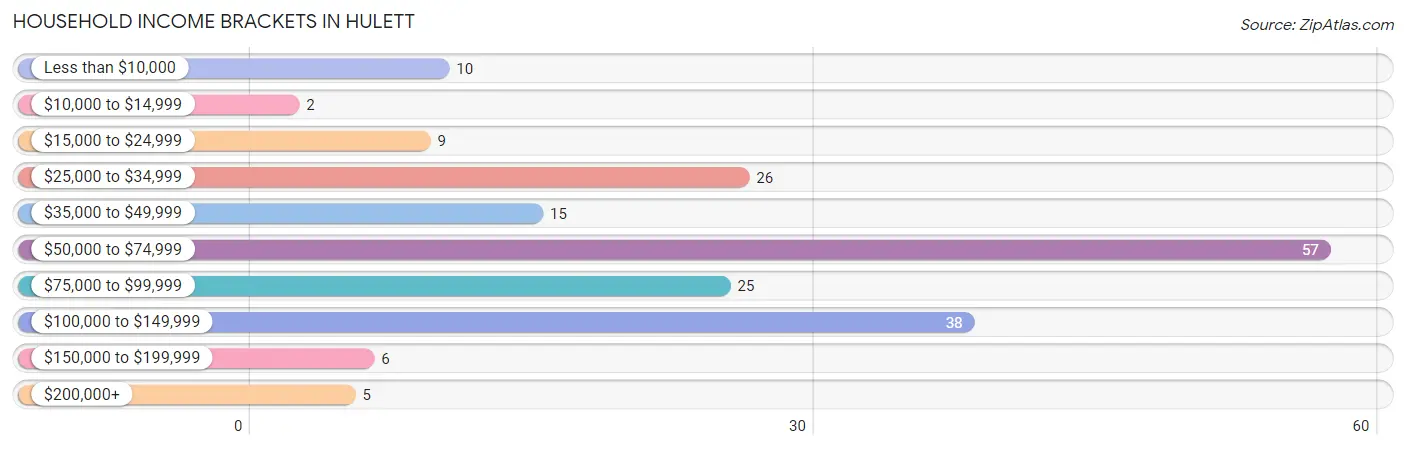
| Income Bracket | # Households | % Households |
| Less than $10,000 | 10 | 5.2% |
| $10,000 to $14,999 | 2 | 1.0% |
| $15,000 to $24,999 | 9 | 4.7% |
| $25,000 to $34,999 | 26 | 13.5% |
| $35,000 to $49,999 | 15 | 7.8% |
| $50,000 to $74,999 | 57 | 29.5% |
| $75,000 to $99,999 | 25 | 13.0% |
| $100,000 to $149,999 | 38 | 19.7% |
| $150,000 to $199,999 | 6 | 3.1% |
| $200,000+ | 5 | 2.6% |
Household Income by Householder Age in Hulett
The median household income in Hulett is $68,177, with the highest median household income of $71,500 found in the 45 to 64 years age bracket for the primary householder. A total of 114 households (59.1%) fall into this category.
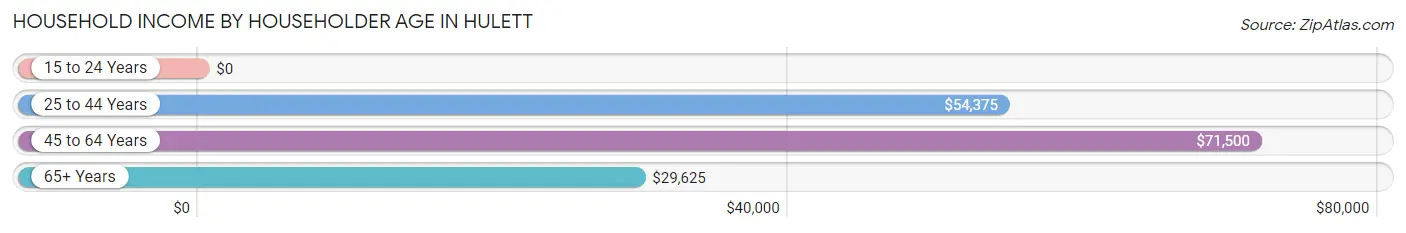
| Income Bracket | # Households | Median Income |
| 15 to 24 Years | 0 (0.0%) | $0 |
| 25 to 44 Years | 30 (15.5%) | $54,375 |
| 45 to 64 Years | 114 (59.1%) | $71,500 |
| 65+ Years | 49 (25.4%) | $29,625 |
| Total | 193 (100.0%) | $68,177 |
Poverty in Hulett
Income Below Poverty by Sex and Age in Hulett
With 0.4% poverty level for males and 7.4% for females among the residents of Hulett, 65 to 74 year old males and 55 to 64 year old females are the most vulnerable to poverty, with 1 males (6.7%) and 10 females (17.0%) in their respective age groups living below the poverty level.
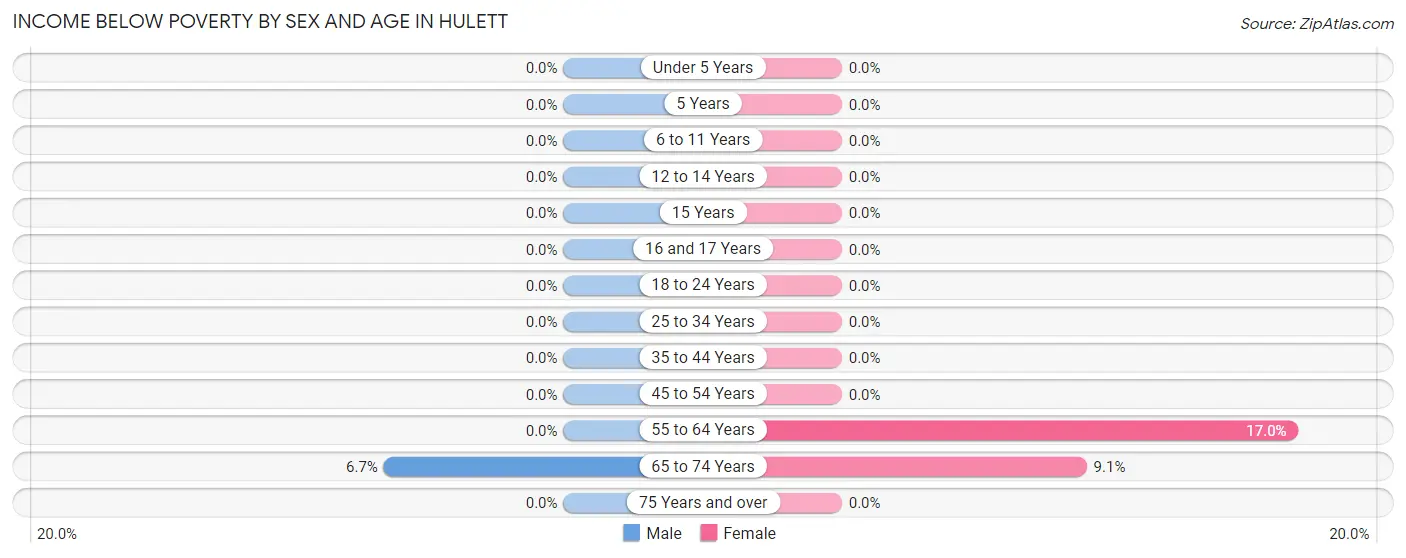
| Age Bracket | Male | Female |
| Under 5 Years | 0 (0.0%) | 0 (0.0%) |
| 5 Years | 0 (0.0%) | 0 (0.0%) |
| 6 to 11 Years | 0 (0.0%) | 0 (0.0%) |
| 12 to 14 Years | 0 (0.0%) | 0 (0.0%) |
| 15 Years | 0 (0.0%) | 0 (0.0%) |
| 16 and 17 Years | 0 (0.0%) | 0 (0.0%) |
| 18 to 24 Years | 0 (0.0%) | 0 (0.0%) |
| 25 to 34 Years | 0 (0.0%) | 0 (0.0%) |
| 35 to 44 Years | 0 (0.0%) | 0 (0.0%) |
| 45 to 54 Years | 0 (0.0%) | 0 (0.0%) |
| 55 to 64 Years | 0 (0.0%) | 10 (17.0%) |
| 65 to 74 Years | 1 (6.7%) | 2 (9.1%) |
| 75 Years and over | 0 (0.0%) | 0 (0.0%) |
| Total | 1 (0.4%) | 12 (7.4%) |
Income Above Poverty by Sex and Age in Hulett
According to the poverty statistics in Hulett, males aged 6 to 11 years and females aged under 5 years are the age groups that are most secure financially, with 100.0% of males and 100.0% of females in these age groups living above the poverty line.
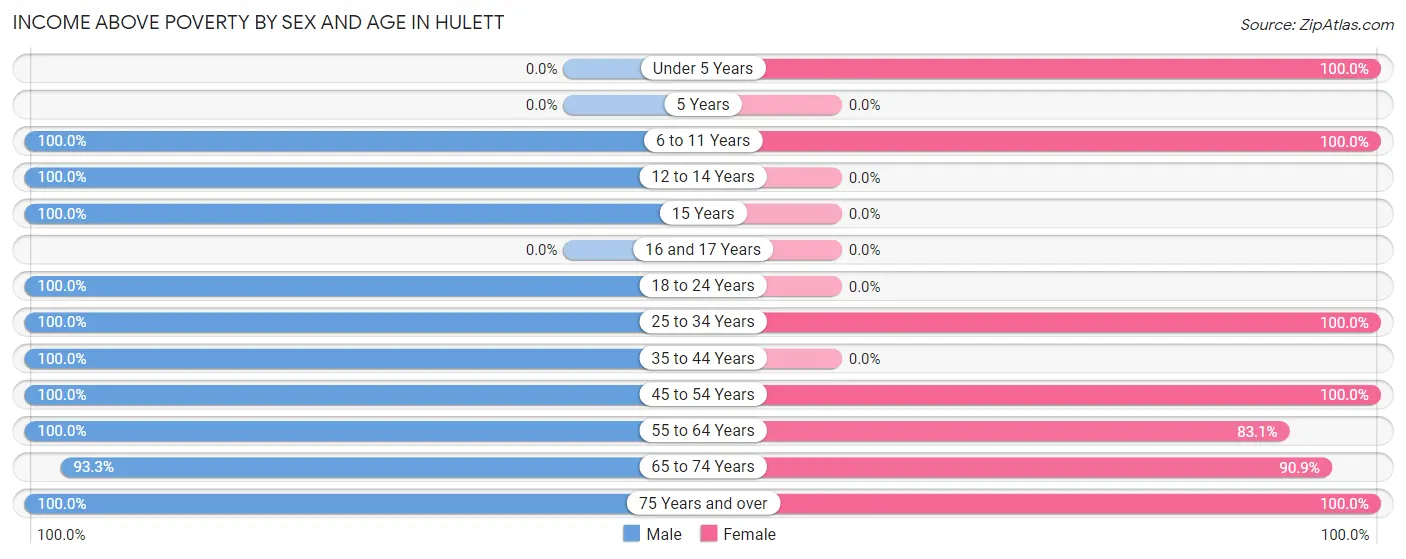
| Age Bracket | Male | Female |
| Under 5 Years | 0 (0.0%) | 8 (100.0%) |
| 5 Years | 0 (0.0%) | 0 (0.0%) |
| 6 to 11 Years | 36 (100.0%) | 8 (100.0%) |
| 12 to 14 Years | 7 (100.0%) | 0 (0.0%) |
| 15 Years | 5 (100.0%) | 0 (0.0%) |
| 16 and 17 Years | 0 (0.0%) | 0 (0.0%) |
| 18 to 24 Years | 20 (100.0%) | 0 (0.0%) |
| 25 to 34 Years | 37 (100.0%) | 5 (100.0%) |
| 35 to 44 Years | 17 (100.0%) | 0 (0.0%) |
| 45 to 54 Years | 60 (100.0%) | 49 (100.0%) |
| 55 to 64 Years | 46 (100.0%) | 49 (83.1%) |
| 65 to 74 Years | 14 (93.3%) | 20 (90.9%) |
| 75 Years and over | 9 (100.0%) | 11 (100.0%) |
| Total | 251 (99.6%) | 150 (92.6%) |
Income Below Poverty Among Married-Couple Families in Hulett
The poverty statistics for married-couple families in Hulett show that 2.7% or 2 of the total 75 families live below the poverty line. Families with no children have the highest poverty rate of 3.4%, comprising of 2 families. On the other hand, families with 1 or 2 children have the lowest poverty rate of 0.0%, which includes 0 families.
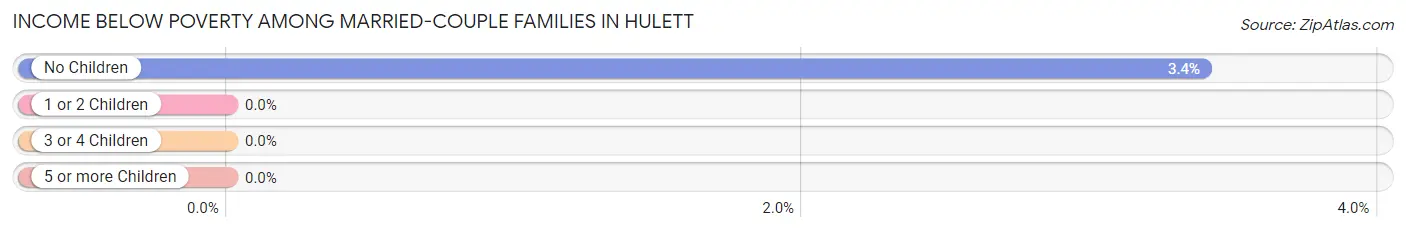
| Children | Above Poverty | Below Poverty |
| No Children | 57 (96.6%) | 2 (3.4%) |
| 1 or 2 Children | 16 (100.0%) | 0 (0.0%) |
| 3 or 4 Children | 0 (0.0%) | 0 (0.0%) |
| 5 or more Children | 0 (0.0%) | 0 (0.0%) |
| Total | 73 (97.3%) | 2 (2.7%) |
Income Below Poverty Among Single-Parent Households in Hulett
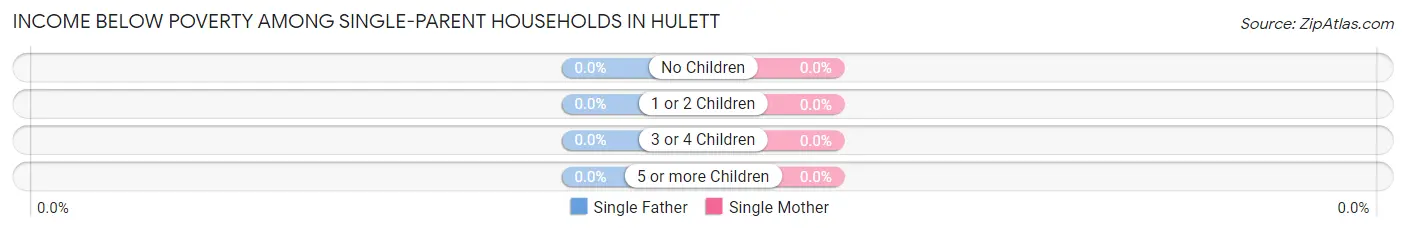
| Children | Single Father | Single Mother |
| No Children | 0 (0.0%) | 0 (0.0%) |
| 1 or 2 Children | 0 (0.0%) | 0 (0.0%) |
| 3 or 4 Children | 0 (0.0%) | 0 (0.0%) |
| 5 or more Children | 0 (0.0%) | 0 (0.0%) |
| Total | 0 (0.0%) | 0 (0.0%) |
Income Below Poverty Among Married-Couple vs Single-Parent Households in Hulett
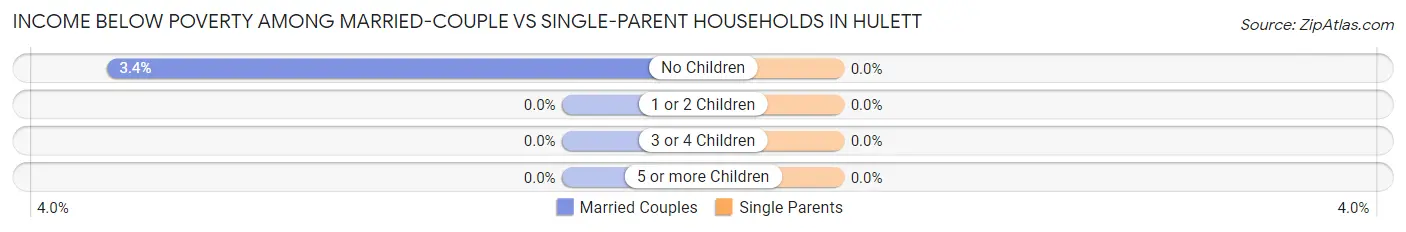
| Children | Married-Couple Families | Single-Parent Households |
| No Children | 2 (3.4%) | 0 (0.0%) |
| 1 or 2 Children | 0 (0.0%) | 0 (0.0%) |
| 3 or 4 Children | 0 (0.0%) | 0 (0.0%) |
| 5 or more Children | 0 (0.0%) | 0 (0.0%) |
| Total | 2 (2.7%) | 0 (0.0%) |
Race in Hulett
The most populous races in Hulett are White / Caucasian (277 | 66.9%), Two or more Races (123 | 29.7%), and Hispanic or Latino (65 | 15.7%).
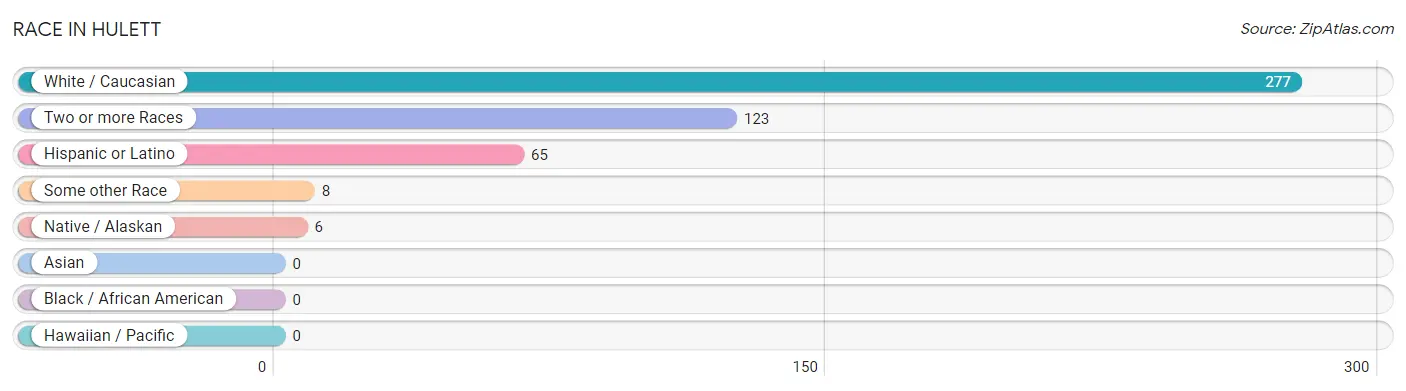
| Race | # Population | % Population |
| Asian | 0 | 0.0% |
| Black / African American | 0 | 0.0% |
| Hawaiian / Pacific | 0 | 0.0% |
| Hispanic or Latino | 65 | 15.7% |
| Native / Alaskan | 6 | 1.5% |
| White / Caucasian | 277 | 66.9% |
| Two or more Races | 123 | 29.7% |
| Some other Race | 8 | 1.9% |
| Total | 414 | 100.0% |
Ancestry in Hulett
The most populous ancestries reported in Hulett are German (127 | 30.7%), Central American (65 | 15.7%), Panamanian (65 | 15.7%), English (51 | 12.3%), and Irish (38 | 9.2%), together accounting for 83.6% of all Hulett residents.
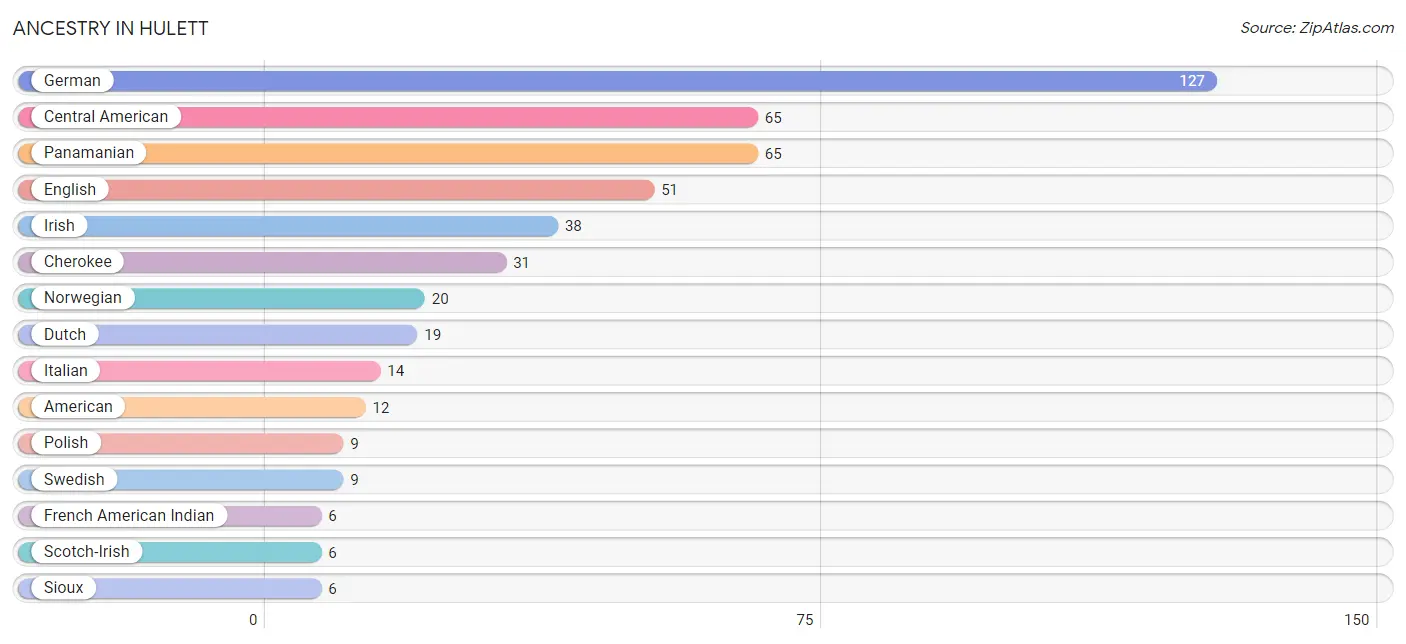
| Ancestry | # Population | % Population |
| American | 12 | 2.9% |
| Canadian | 5 | 1.2% |
| Central American | 65 | 15.7% |
| Cherokee | 31 | 7.5% |
| Dutch | 19 | 4.6% |
| English | 51 | 12.3% |
| French | 2 | 0.5% |
| French American Indian | 6 | 1.5% |
| German | 127 | 30.7% |
| Irish | 38 | 9.2% |
| Italian | 14 | 3.4% |
| Norwegian | 20 | 4.8% |
| Panamanian | 65 | 15.7% |
| Polish | 9 | 2.2% |
| Scotch-Irish | 6 | 1.5% |
| Shoshone | 5 | 1.2% |
| Sioux | 6 | 1.5% |
| Swedish | 9 | 2.2% | View All 18 Rows |
Immigrants in Hulett
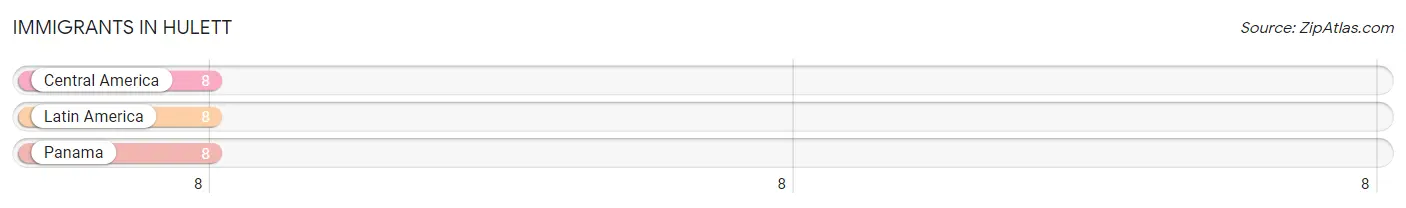
The most numerous immigrant groups reported in Hulett came from Central America (8 | 1.9%), Latin America (8 | 1.9%), and Panama (8 | 1.9%), together accounting for 5.8% of all Hulett residents.
| Immigration Origin | # Population | % Population |
| Central America | 8 | 1.9% |
| Latin America | 8 | 1.9% |
| Panama | 8 | 1.9% | View All 3 Rows |
Sex and Age in Hulett
Sex and Age in Hulett
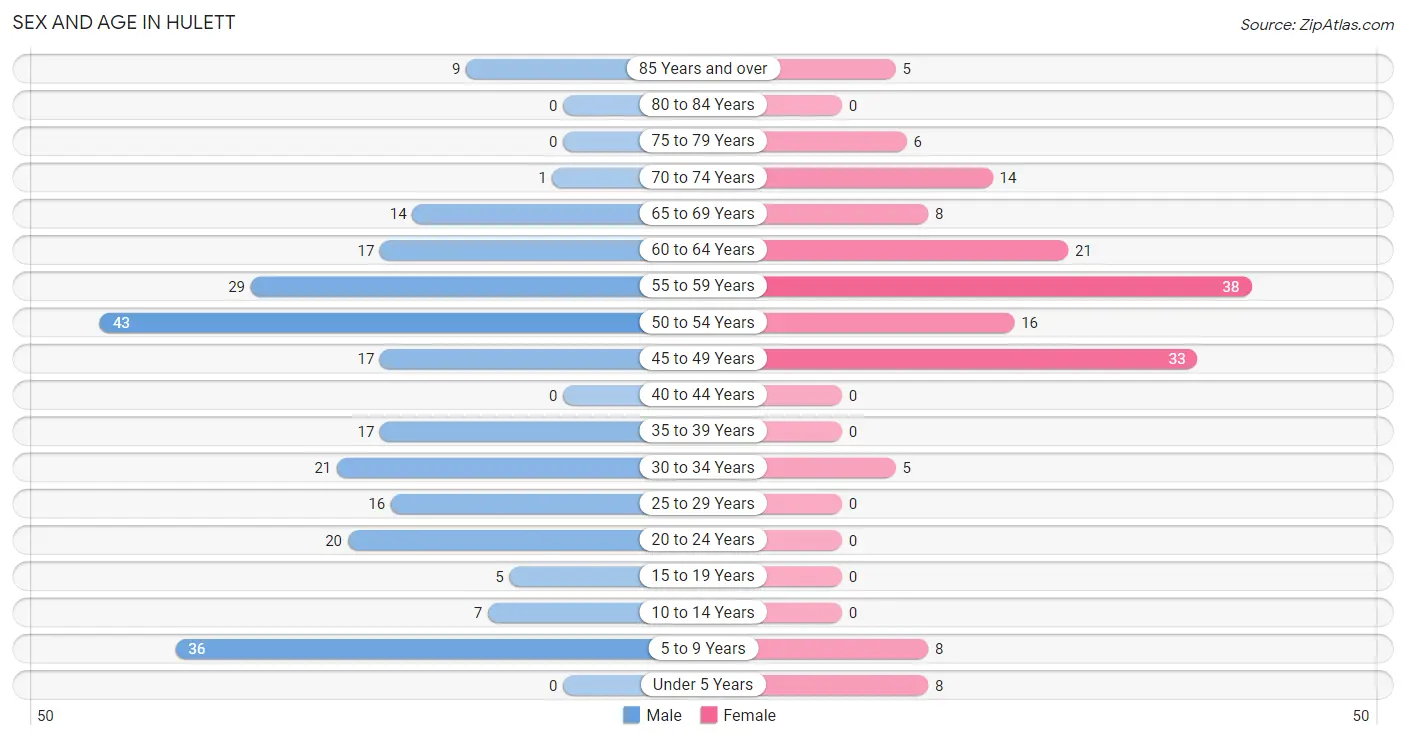
The most populous age groups in Hulett are 50 to 54 Years (43 | 17.1%) for men and 55 to 59 Years (38 | 23.5%) for women.
| Age Bracket | Male | Female |
| Under 5 Years | 0 (0.0%) | 8 (4.9%) |
| 5 to 9 Years | 36 (14.3%) | 8 (4.9%) |
| 10 to 14 Years | 7 (2.8%) | 0 (0.0%) |
| 15 to 19 Years | 5 (2.0%) | 0 (0.0%) |
| 20 to 24 Years | 20 (7.9%) | 0 (0.0%) |
| 25 to 29 Years | 16 (6.4%) | 0 (0.0%) |
| 30 to 34 Years | 21 (8.3%) | 5 (3.1%) |
| 35 to 39 Years | 17 (6.8%) | 0 (0.0%) |
| 40 to 44 Years | 0 (0.0%) | 0 (0.0%) |
| 45 to 49 Years | 17 (6.8%) | 33 (20.4%) |
| 50 to 54 Years | 43 (17.1%) | 16 (9.9%) |
| 55 to 59 Years | 29 (11.5%) | 38 (23.5%) |
| 60 to 64 Years | 17 (6.8%) | 21 (13.0%) |
| 65 to 69 Years | 14 (5.6%) | 8 (4.9%) |
| 70 to 74 Years | 1 (0.4%) | 14 (8.6%) |
| 75 to 79 Years | 0 (0.0%) | 6 (3.7%) |
| 80 to 84 Years | 0 (0.0%) | 0 (0.0%) |
| 85 Years and over | 9 (3.6%) | 5 (3.1%) |
| Total | 252 (100.0%) | 162 (100.0%) |
Families and Households in Hulett
Median Family Size in Hulett
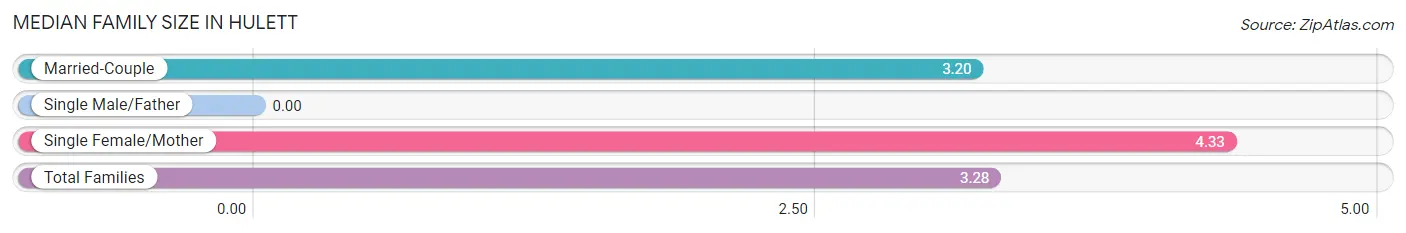
| Family Type | # Families | Family Size |
| Married-Couple | 75 (92.6%) | 3.20 |
| Single Male/Father | 0 (0.0%) | - |
| Single Female/Mother | 6 (7.4%) | 4.33 |
| Total Families | 81 (100.0%) | 3.28 |
Median Household Size in Hulett
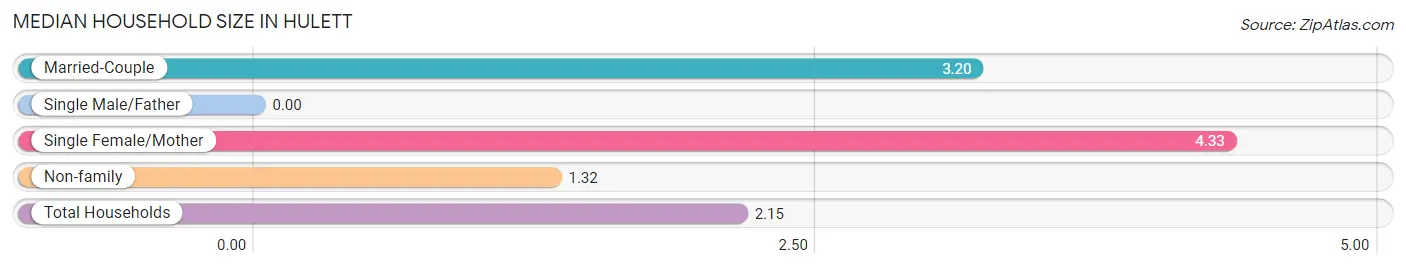
| Household Type | # Households | Household Size |
| Married-Couple | 75 (38.9%) | 3.20 |
| Single Male/Father | 0 (0.0%) | - |
| Single Female/Mother | 6 (3.1%) | 4.33 |
| Non-family | 112 (58.0%) | 1.32 |
| Total Households | 193 (100.0%) | 2.15 |
Household Size by Marriage Status in Hulett
Out of a total of 193 households in Hulett, 81 (42.0%) are family households, while 112 (58.0%) are nonfamily households. The most numerous type of family households are 2-person households, comprising 59, and the most common type of nonfamily households are 1-person households, comprising 87.
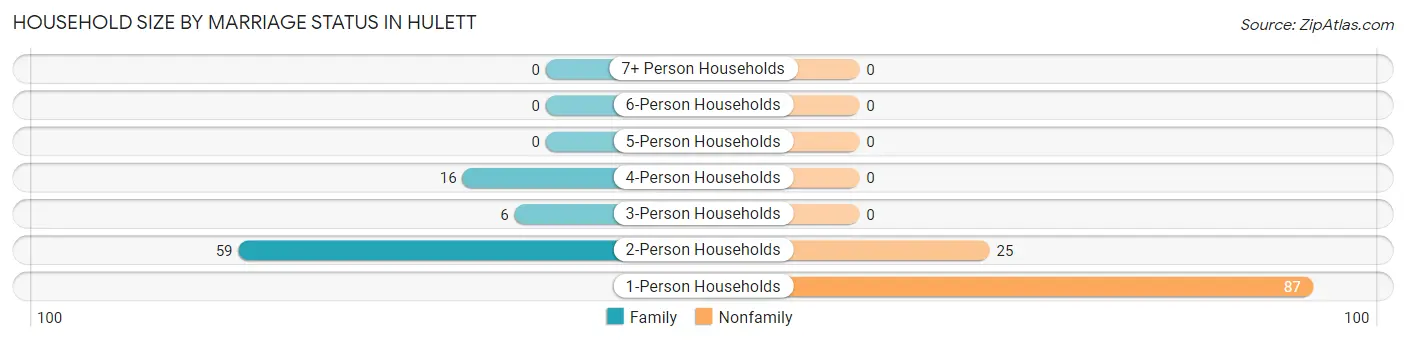
| Household Size | Family Households | Nonfamily Households |
| 1-Person Households | - | 87 (45.1%) |
| 2-Person Households | 59 (30.6%) | 25 (13.0%) |
| 3-Person Households | 6 (3.1%) | 0 (0.0%) |
| 4-Person Households | 16 (8.3%) | 0 (0.0%) |
| 5-Person Households | 0 (0.0%) | 0 (0.0%) |
| 6-Person Households | 0 (0.0%) | 0 (0.0%) |
| 7+ Person Households | 0 (0.0%) | 0 (0.0%) |
| Total | 81 (42.0%) | 112 (58.0%) |
Female Fertility in Hulett
Fertility by Age in Hulett
| Age Bracket | Women with Births | Births / 1,000 Women |
| 15 to 19 years | 0 (0.0%) | 0.0 |
| 20 to 34 years | 0 (0.0%) | 0.0 |
| 35 to 50 years | 0 (0.0%) | 0.0 |
| Total | 0 (0.0%) | 0.0 |
Fertility by Age by Marriage Status in Hulett
| Age Bracket | Married | Unmarried |
| 15 to 19 years | 0 (0.0%) | 0 (0.0%) |
| 20 to 34 years | 0 (0.0%) | 0 (0.0%) |
| 35 to 50 years | 0 (0.0%) | 0 (0.0%) |
| Total | 0 (0.0%) | 0 (0.0%) |
Fertility by Education in Hulett
| Educational Attainment | Women with Births | Births / 1,000 Women |
| Less than High School | 0 (0.0%) | 0.0 |
| High School Diploma | 0 (0.0%) | 0.0 |
| College or Associate's Degree | 0 (0.0%) | 0.0 |
| Bachelor's Degree | 0 (0.0%) | 0.0 |
| Graduate Degree | 0 (0.0%) | 0.0 |
| Total | 0 (0.0%) | 0.0 |
Fertility by Education by Marriage Status in Hulett
| Educational Attainment | Married | Unmarried |
| Less than High School | 0 (0.0%) | 0 (0.0%) |
| High School Diploma | 0 (0.0%) | 0 (0.0%) |
| College or Associate's Degree | 0 (0.0%) | 0 (0.0%) |
| Bachelor's Degree | 0 (0.0%) | 0 (0.0%) |
| Graduate Degree | 0 (0.0%) | 0 (0.0%) |
| Total | 0 (0.0%) | 0 (0.0%) |
Employment Characteristics in Hulett
Employment by Class of Employer in Hulett
Among the 265 employed individuals in Hulett, private company employees (178 | 67.2%), local government employees (49 | 18.5%), and self-employed (not incorporated) (12 | 4.5%) make up the most common classes of employment.
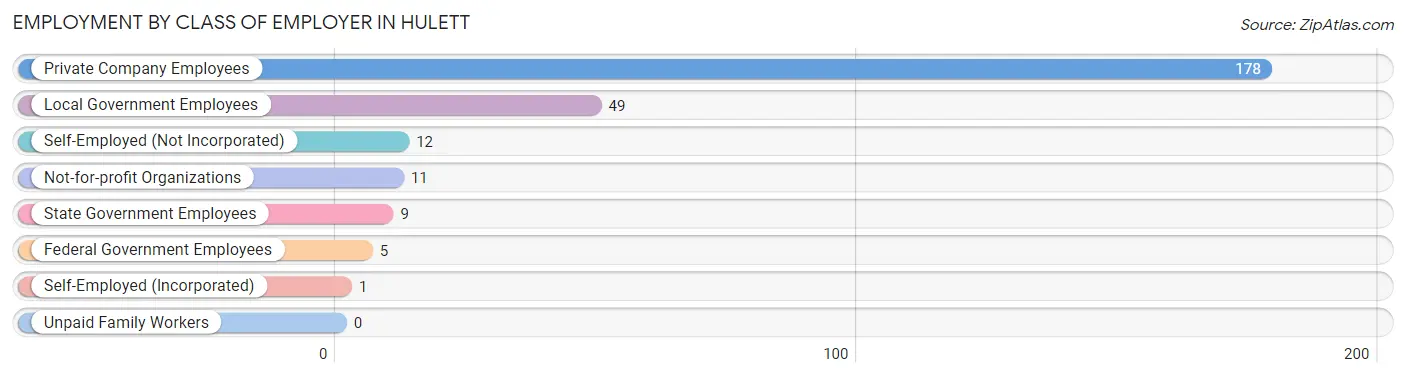
| Employer Class | # Employees | % Employees |
| Private Company Employees | 178 | 67.2% |
| Self-Employed (Incorporated) | 1 | 0.4% |
| Self-Employed (Not Incorporated) | 12 | 4.5% |
| Not-for-profit Organizations | 11 | 4.2% |
| Local Government Employees | 49 | 18.5% |
| State Government Employees | 9 | 3.4% |
| Federal Government Employees | 5 | 1.9% |
| Unpaid Family Workers | 0 | 0.0% |
| Total | 265 | 100.0% |
Employment Status by Age in Hulett
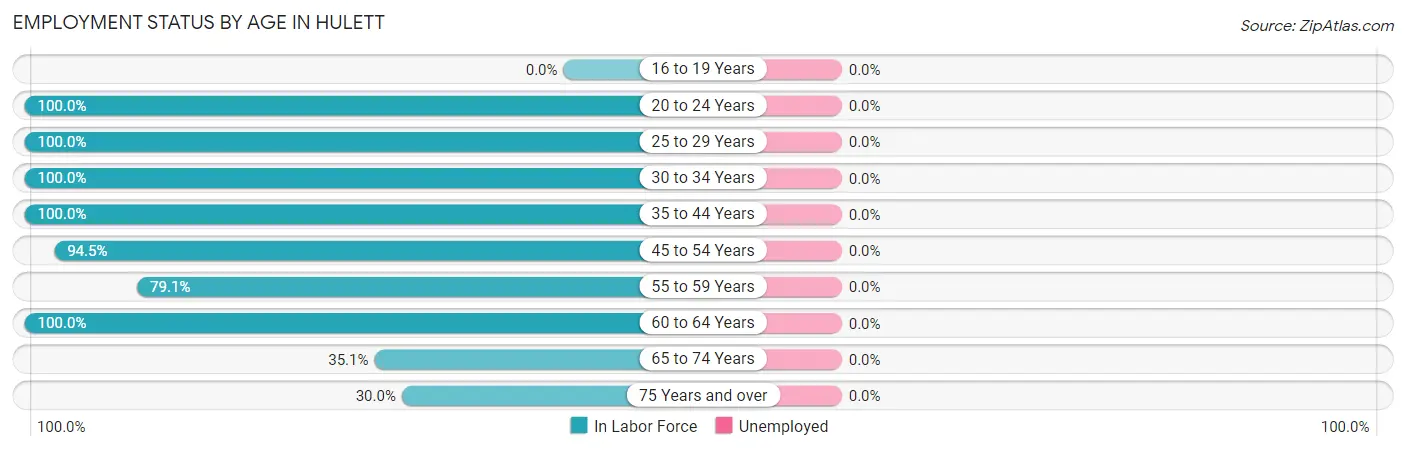
| Age Bracket | In Labor Force | Unemployed |
| 16 to 19 Years | 0 (0.0%) | 0 (0.0%) |
| 20 to 24 Years | 20 (100.0%) | 0 (0.0%) |
| 25 to 29 Years | 16 (100.0%) | 0 (0.0%) |
| 30 to 34 Years | 26 (100.0%) | 0 (0.0%) |
| 35 to 44 Years | 17 (100.0%) | 0 (0.0%) |
| 45 to 54 Years | 103 (94.5%) | 0 (0.0%) |
| 55 to 59 Years | 53 (79.1%) | 0 (0.0%) |
| 60 to 64 Years | 38 (100.0%) | 0 (0.0%) |
| 65 to 74 Years | 13 (35.1%) | 0 (0.0%) |
| 75 Years and over | 6 (30.0%) | 0 (0.0%) |
| Total | 292 (83.4%) | 0 (0.0%) |
Employment Status by Educational Attainment in Hulett
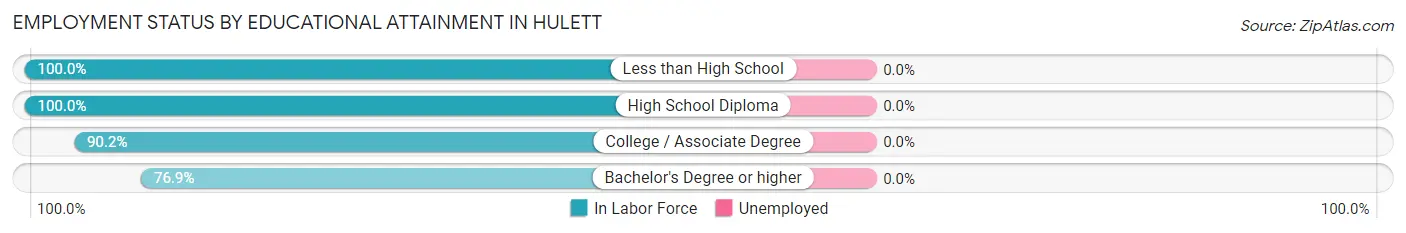
| Educational Attainment | In Labor Force | Unemployed |
| Less than High School | 2 (100.0%) | 0 (0.0%) |
| High School Diploma | 102 (100.0%) | 0 (0.0%) |
| College / Associate Degree | 129 (90.2%) | 0 (0.0%) |
| Bachelor's Degree or higher | 20 (76.9%) | 0 (0.0%) |
| Total | 253 (92.7%) | 0 (0.0%) |
Employment Occupations by Sex in Hulett
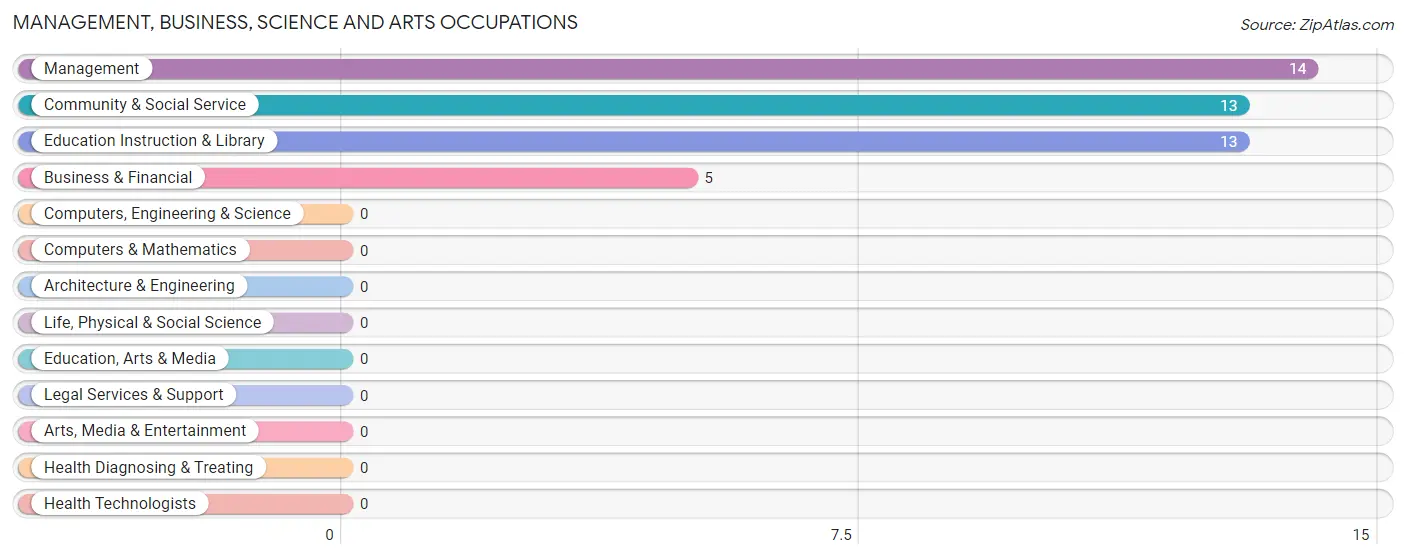
Management, Business, Science and Arts Occupations
The most common Management, Business, Science and Arts occupations in Hulett are Management (14 | 4.8%), Community & Social Service (13 | 4.4%), Education Instruction & Library (13 | 4.4%), and Business & Financial (5 | 1.7%).
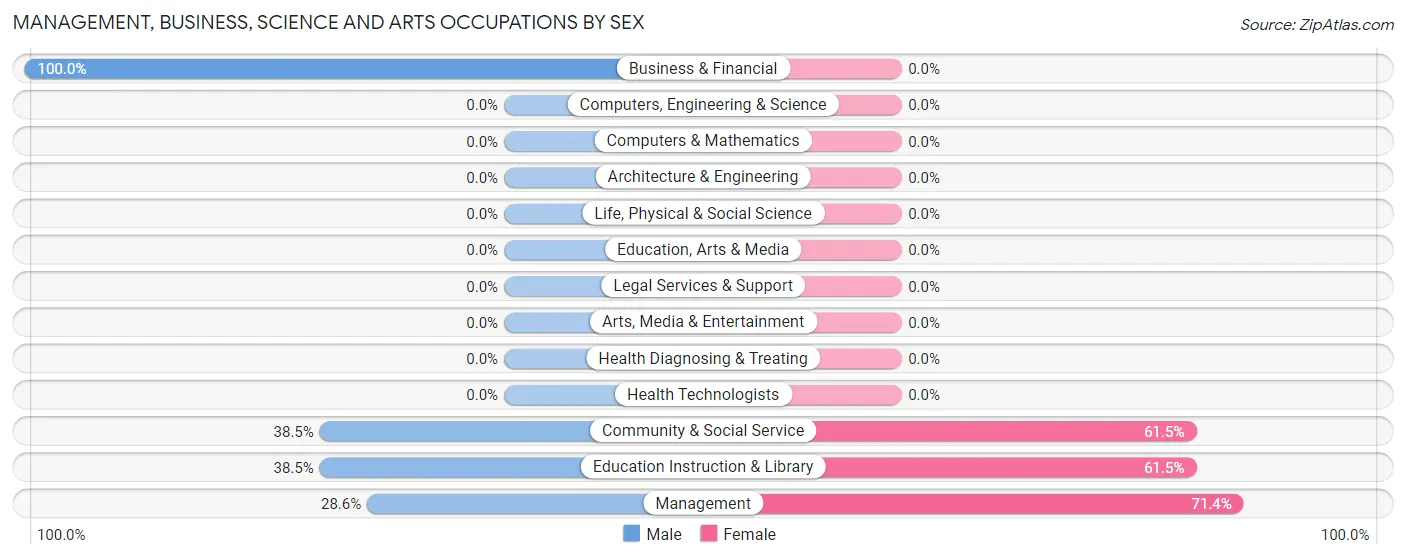
Management, Business, Science and Arts Occupations by Sex
Within the Management, Business, Science and Arts occupations in Hulett, the most male-oriented occupations are Business & Financial (100.0%), Community & Social Service (38.5%), and Education Instruction & Library (38.5%), while the most female-oriented occupations are Management (71.4%), Community & Social Service (61.5%), and Education Instruction & Library (61.5%).
| Occupation | Male | Female |
| Management | 4 (28.6%) | 10 (71.4%) |
| Business & Financial | 5 (100.0%) | 0 (0.0%) |
| Computers, Engineering & Science | 0 (0.0%) | 0 (0.0%) |
| Computers & Mathematics | 0 (0.0%) | 0 (0.0%) |
| Architecture & Engineering | 0 (0.0%) | 0 (0.0%) |
| Life, Physical & Social Science | 0 (0.0%) | 0 (0.0%) |
| Community & Social Service | 5 (38.5%) | 8 (61.5%) |
| Education, Arts & Media | 0 (0.0%) | 0 (0.0%) |
| Legal Services & Support | 0 (0.0%) | 0 (0.0%) |
| Education Instruction & Library | 5 (38.5%) | 8 (61.5%) |
| Arts, Media & Entertainment | 0 (0.0%) | 0 (0.0%) |
| Health Diagnosing & Treating | 0 (0.0%) | 0 (0.0%) |
| Health Technologists | 0 (0.0%) | 0 (0.0%) |
| Total (Category) | 14 (43.8%) | 18 (56.2%) |
| Total (Overall) | 177 (60.6%) | 115 (39.4%) |
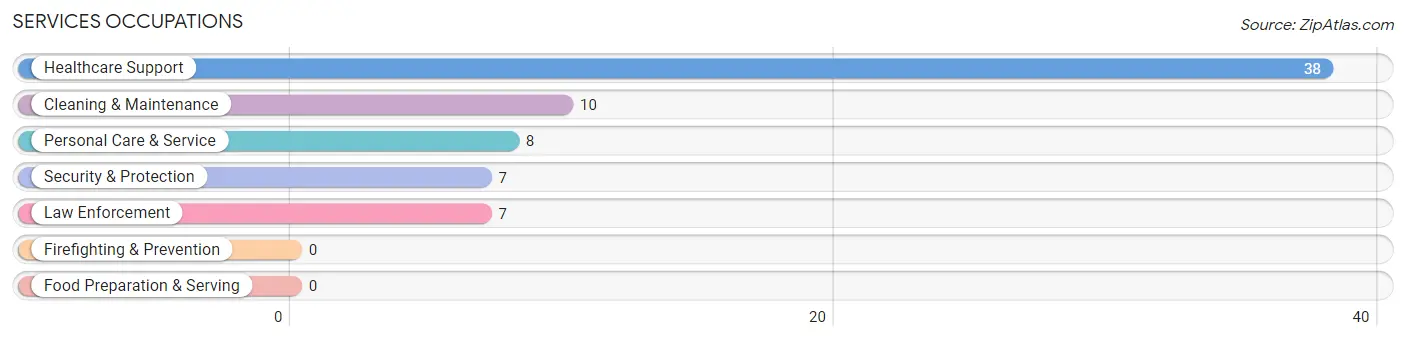
Services Occupations
The most common Services occupations in Hulett are Healthcare Support (38 | 13.0%), Cleaning & Maintenance (10 | 3.4%), Personal Care & Service (8 | 2.7%), Security & Protection (7 | 2.4%), and Law Enforcement (7 | 2.4%).
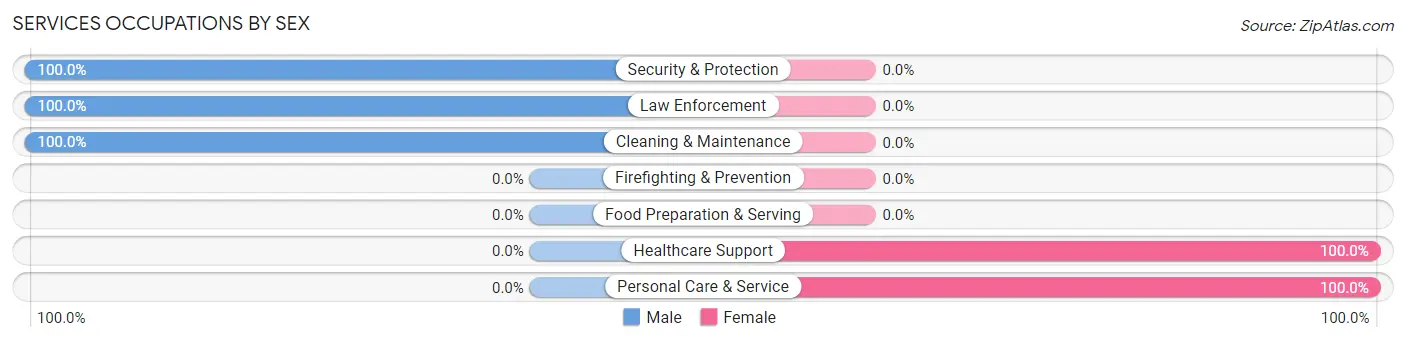
Services Occupations by Sex
Within the Services occupations in Hulett, the most male-oriented occupations are Security & Protection (100.0%), Law Enforcement (100.0%), and Cleaning & Maintenance (100.0%), while the most female-oriented occupations are Healthcare Support (100.0%), and Personal Care & Service (100.0%).
| Occupation | Male | Female |
| Healthcare Support | 0 (0.0%) | 38 (100.0%) |
| Security & Protection | 7 (100.0%) | 0 (0.0%) |
| Firefighting & Prevention | 0 (0.0%) | 0 (0.0%) |
| Law Enforcement | 7 (100.0%) | 0 (0.0%) |
| Food Preparation & Serving | 0 (0.0%) | 0 (0.0%) |
| Cleaning & Maintenance | 10 (100.0%) | 0 (0.0%) |
| Personal Care & Service | 0 (0.0%) | 8 (100.0%) |
| Total (Category) | 17 (27.0%) | 46 (73.0%) |
| Total (Overall) | 177 (60.6%) | 115 (39.4%) |
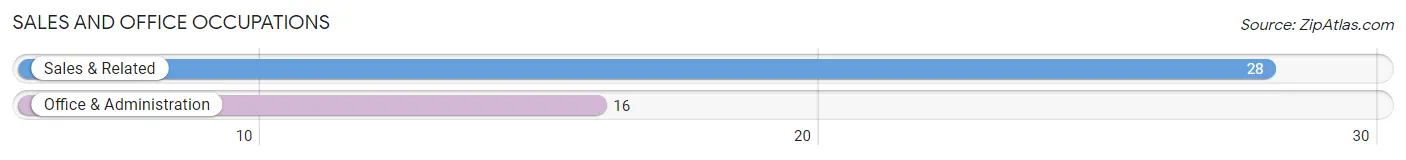
Sales and Office Occupations
The most common Sales and Office occupations in Hulett are Sales & Related (28 | 9.6%), and Office & Administration (16 | 5.5%).
Sales and Office Occupations by Sex
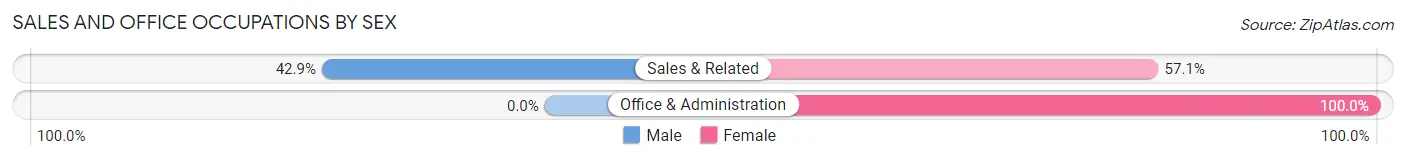
| Occupation | Male | Female |
| Sales & Related | 12 (42.9%) | 16 (57.1%) |
| Office & Administration | 0 (0.0%) | 16 (100.0%) |
| Total (Category) | 12 (27.3%) | 32 (72.7%) |
| Total (Overall) | 177 (60.6%) | 115 (39.4%) |
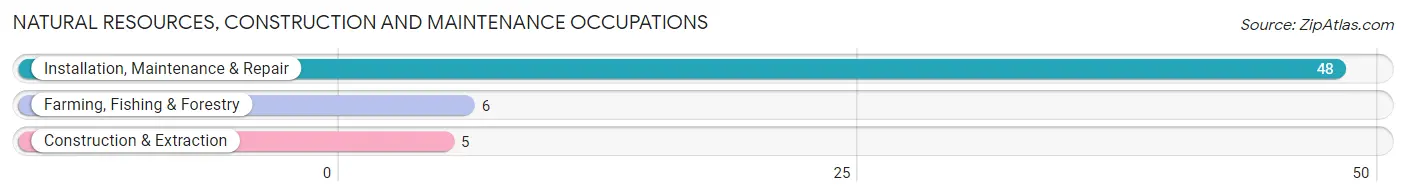
Natural Resources, Construction and Maintenance Occupations
The most common Natural Resources, Construction and Maintenance occupations in Hulett are Installation, Maintenance & Repair (48 | 16.4%), Farming, Fishing & Forestry (6 | 2.1%), and Construction & Extraction (5 | 1.7%).
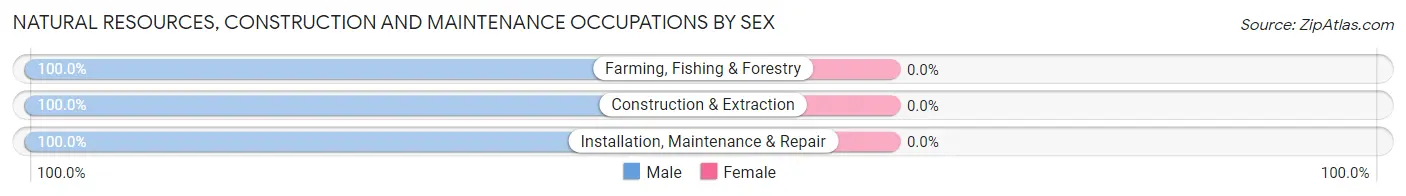
Natural Resources, Construction and Maintenance Occupations by Sex
| Occupation | Male | Female |
| Farming, Fishing & Forestry | 6 (100.0%) | 0 (0.0%) |
| Construction & Extraction | 5 (100.0%) | 0 (0.0%) |
| Installation, Maintenance & Repair | 48 (100.0%) | 0 (0.0%) |
| Total (Category) | 59 (100.0%) | 0 (0.0%) |
| Total (Overall) | 177 (60.6%) | 115 (39.4%) |
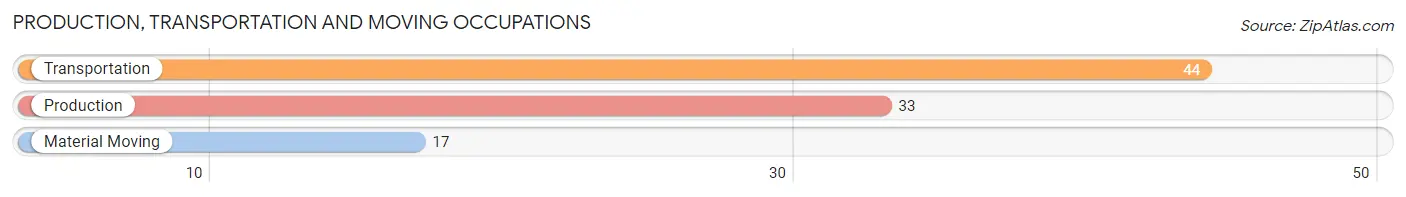
Production, Transportation and Moving Occupations
The most common Production, Transportation and Moving occupations in Hulett are Transportation (44 | 15.1%), Production (33 | 11.3%), and Material Moving (17 | 5.8%).
Production, Transportation and Moving Occupations by Sex
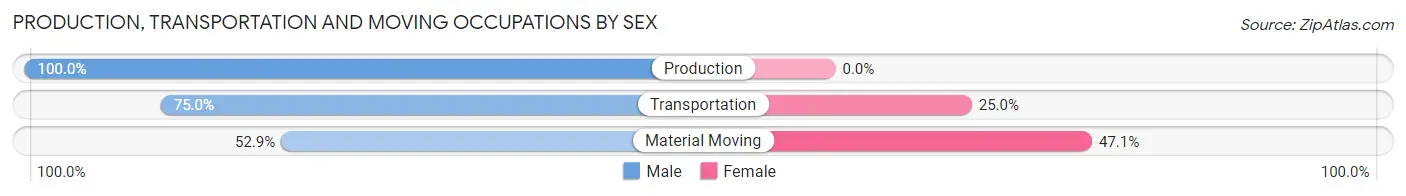
| Occupation | Male | Female |
| Production | 33 (100.0%) | 0 (0.0%) |
| Transportation | 33 (75.0%) | 11 (25.0%) |
| Material Moving | 9 (52.9%) | 8 (47.1%) |
| Total (Category) | 75 (79.8%) | 19 (20.2%) |
| Total (Overall) | 177 (60.6%) | 115 (39.4%) |
Employment Industries by Sex in Hulett
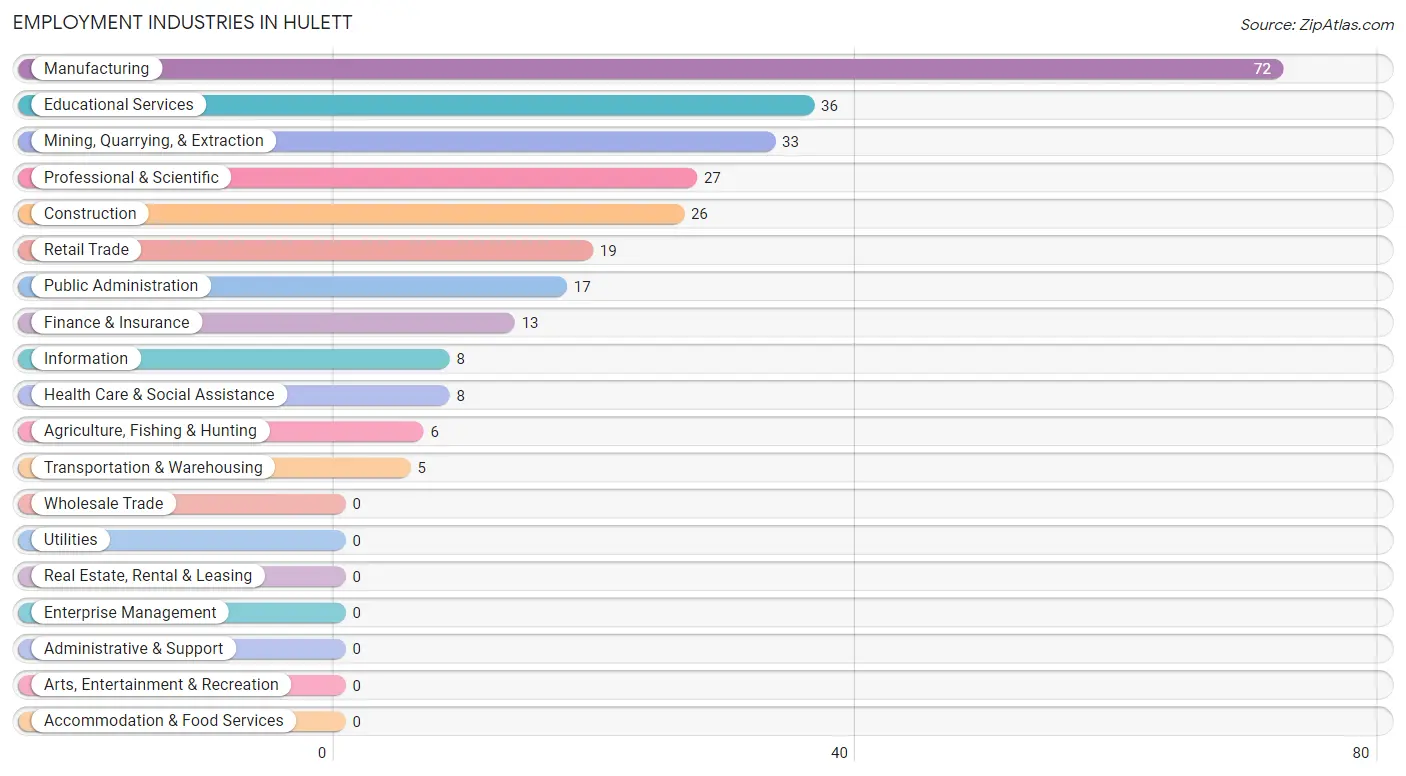
Employment Industries in Hulett
The major employment industries in Hulett include Manufacturing (72 | 24.7%), Educational Services (36 | 12.3%), Mining, Quarrying, & Extraction (33 | 11.3%), Professional & Scientific (27 | 9.2%), and Construction (26 | 8.9%).
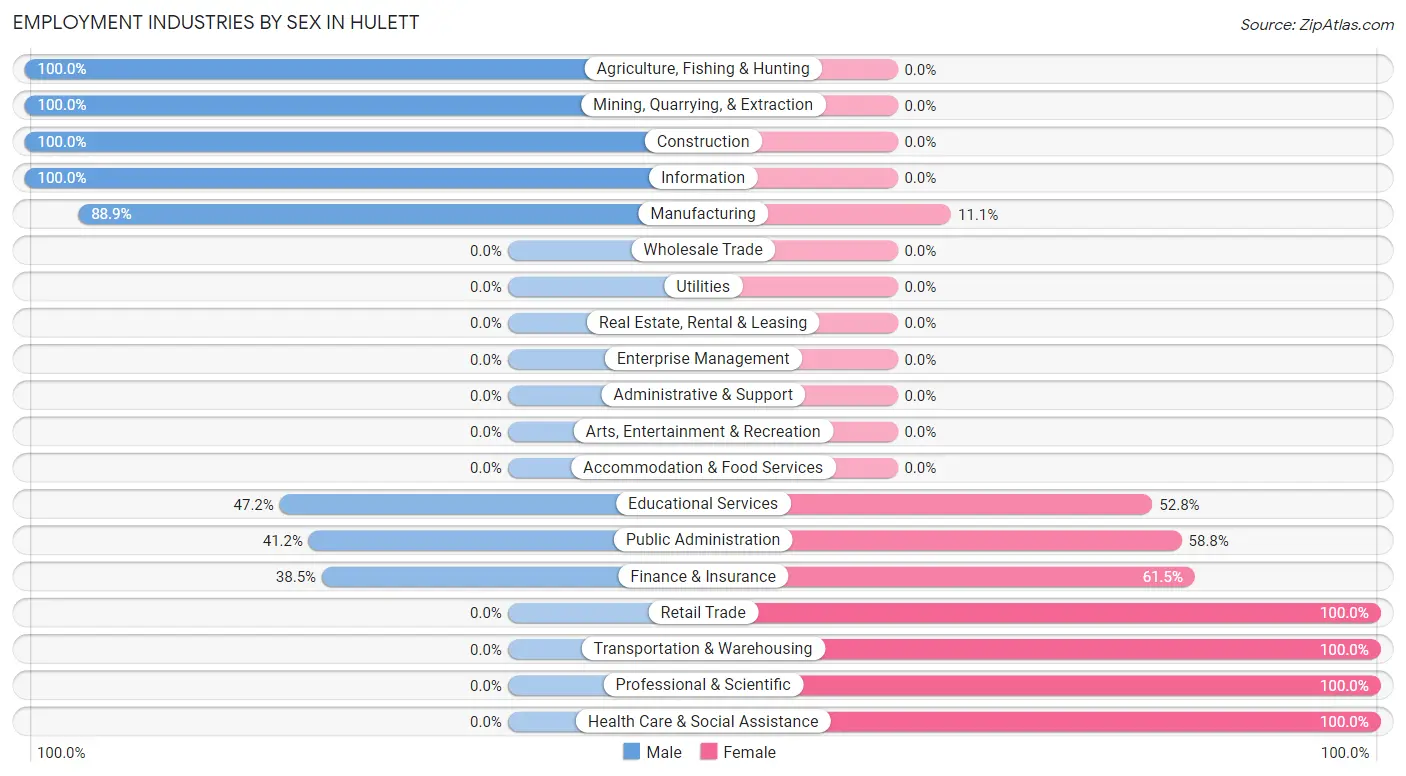
Employment Industries by Sex in Hulett
The Hulett industries that see more men than women are Agriculture, Fishing & Hunting (100.0%), Mining, Quarrying, & Extraction (100.0%), and Construction (100.0%), whereas the industries that tend to have a higher number of women are Retail Trade (100.0%), Transportation & Warehousing (100.0%), and Professional & Scientific (100.0%).
| Industry | Male | Female |
| Agriculture, Fishing & Hunting | 6 (100.0%) | 0 (0.0%) |
| Mining, Quarrying, & Extraction | 33 (100.0%) | 0 (0.0%) |
| Construction | 26 (100.0%) | 0 (0.0%) |
| Manufacturing | 64 (88.9%) | 8 (11.1%) |
| Wholesale Trade | 0 (0.0%) | 0 (0.0%) |
| Retail Trade | 0 (0.0%) | 19 (100.0%) |
| Transportation & Warehousing | 0 (0.0%) | 5 (100.0%) |
| Utilities | 0 (0.0%) | 0 (0.0%) |
| Information | 8 (100.0%) | 0 (0.0%) |
| Finance & Insurance | 5 (38.5%) | 8 (61.5%) |
| Real Estate, Rental & Leasing | 0 (0.0%) | 0 (0.0%) |
| Professional & Scientific | 0 (0.0%) | 27 (100.0%) |
| Enterprise Management | 0 (0.0%) | 0 (0.0%) |
| Administrative & Support | 0 (0.0%) | 0 (0.0%) |
| Educational Services | 17 (47.2%) | 19 (52.8%) |
| Health Care & Social Assistance | 0 (0.0%) | 8 (100.0%) |
| Arts, Entertainment & Recreation | 0 (0.0%) | 0 (0.0%) |
| Accommodation & Food Services | 0 (0.0%) | 0 (0.0%) |
| Public Administration | 7 (41.2%) | 10 (58.8%) |
| Total | 177 (60.6%) | 115 (39.4%) |
Education in Hulett
School Enrollment in Hulett
The most common levels of schooling among the 86 students in Hulett are kindergarten (36 | 41.9%), college / undergraduate (20 | 23.3%), and high school (12 | 14.0%).
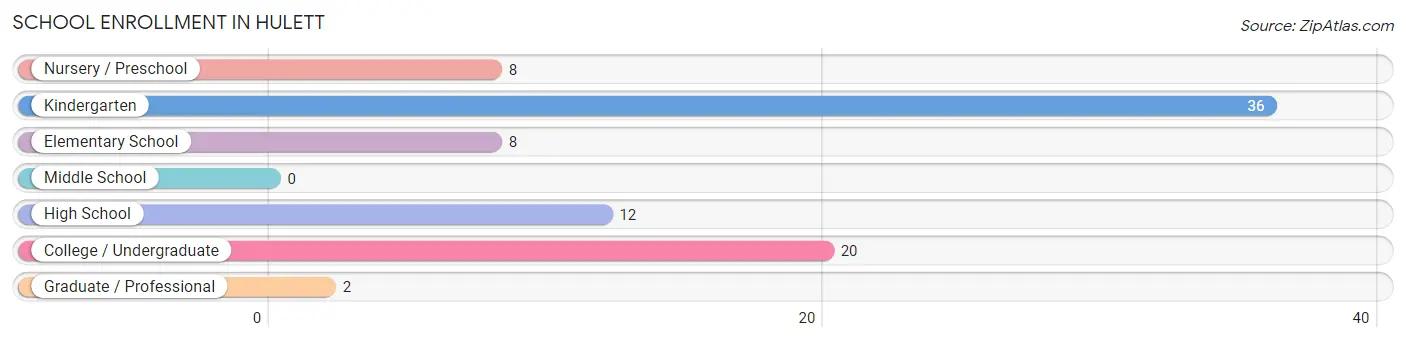
| School Level | # Students | % Students |
| Nursery / Preschool | 8 | 9.3% |
| Kindergarten | 36 | 41.9% |
| Elementary School | 8 | 9.3% |
| Middle School | 0 | 0.0% |
| High School | 12 | 14.0% |
| College / Undergraduate | 20 | 23.3% |
| Graduate / Professional | 2 | 2.3% |
| Total | 86 | 100.0% |
School Enrollment by Age by Funding Source in Hulett
Out of a total of 86 students who are enrolled in schools in Hulett, 20 (23.3%) attend a private institution, while the remaining 66 (76.7%) are enrolled in public schools. The age group of 10 to 14 year olds has the highest likelihood of being enrolled in private schools, with 7 (100.0% in the age bracket) enrolled. Conversely, the age group of 3 to 4 year olds has the lowest likelihood of being enrolled in a private school, with 8 (100.0% in the age bracket) attending a public institution.
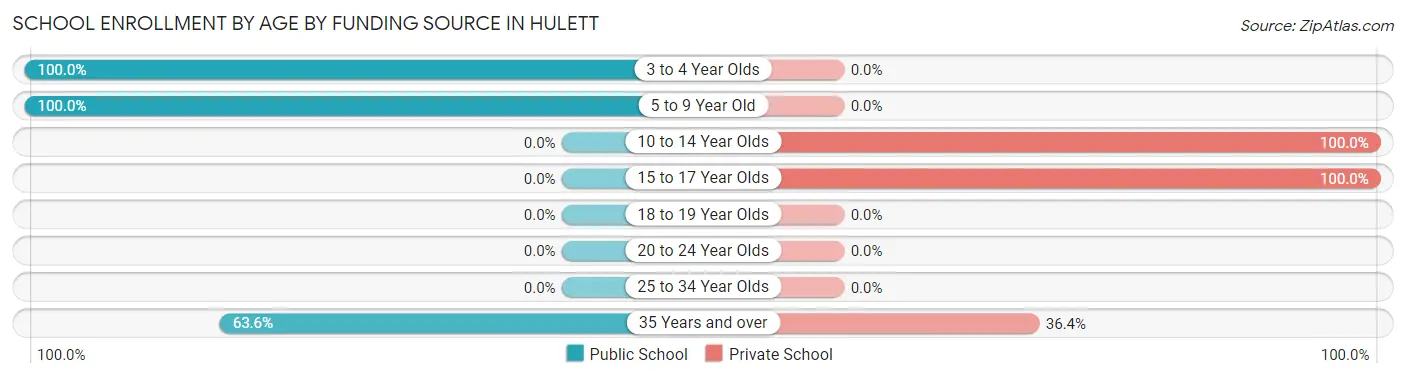
| Age Bracket | Public School | Private School |
| 3 to 4 Year Olds | 8 (100.0%) | 0 (0.0%) |
| 5 to 9 Year Old | 44 (100.0%) | 0 (0.0%) |
| 10 to 14 Year Olds | 0 (0.0%) | 7 (100.0%) |
| 15 to 17 Year Olds | 0 (0.0%) | 5 (100.0%) |
| 18 to 19 Year Olds | 0 (0.0%) | 0 (0.0%) |
| 20 to 24 Year Olds | 0 (0.0%) | 0 (0.0%) |
| 25 to 34 Year Olds | 0 (0.0%) | 0 (0.0%) |
| 35 Years and over | 14 (63.6%) | 8 (36.4%) |
| Total | 66 (76.7%) | 20 (23.3%) |
Educational Attainment by Field of Study in Hulett
Education (19 | 44.2%), bio, nature & agricultural (6 | 14.0%), visual & performing arts (6 | 14.0%), arts & humanities (6 | 14.0%), and social sciences (5 | 11.6%) are the most common fields of study among 43 individuals in Hulett who have obtained a bachelor's degree or higher.
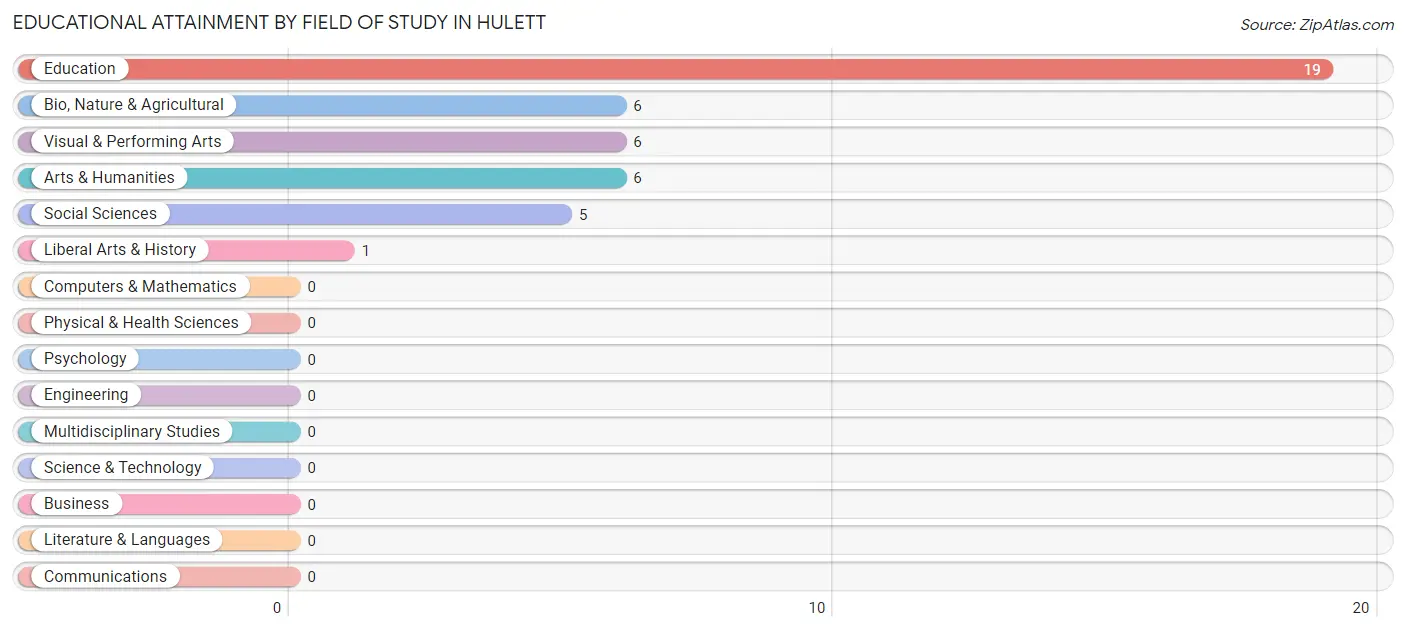
| Field of Study | # Graduates | % Graduates |
| Computers & Mathematics | 0 | 0.0% |
| Bio, Nature & Agricultural | 6 | 14.0% |
| Physical & Health Sciences | 0 | 0.0% |
| Psychology | 0 | 0.0% |
| Social Sciences | 5 | 11.6% |
| Engineering | 0 | 0.0% |
| Multidisciplinary Studies | 0 | 0.0% |
| Science & Technology | 0 | 0.0% |
| Business | 0 | 0.0% |
| Education | 19 | 44.2% |
| Literature & Languages | 0 | 0.0% |
| Liberal Arts & History | 1 | 2.3% |
| Visual & Performing Arts | 6 | 14.0% |
| Communications | 0 | 0.0% |
| Arts & Humanities | 6 | 14.0% |
| Total | 43 | 100.0% |
Transportation & Commute in Hulett
Vehicle Availability by Sex in Hulett
The most prevalent vehicle ownership categories in Hulett are males with 2 vehicles (81, accounting for 45.8%) and females with 2 vehicles (38, making up 92.0%).
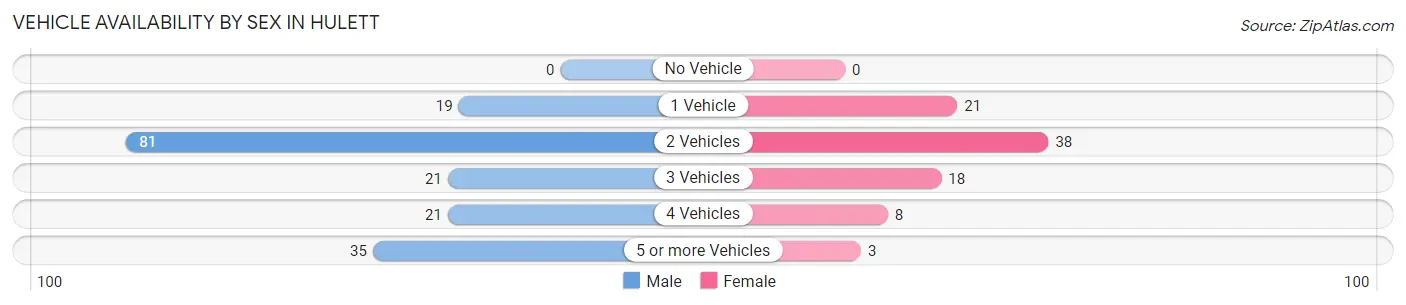
| Vehicles Available | Male | Female |
| No Vehicle | 0 (0.0%) | 0 (0.0%) |
| 1 Vehicle | 19 (10.7%) | 21 (23.9%) |
| 2 Vehicles | 81 (45.8%) | 38 (43.2%) |
| 3 Vehicles | 21 (11.9%) | 18 (20.4%) |
| 4 Vehicles | 21 (11.9%) | 8 (9.1%) |
| 5 or more Vehicles | 35 (19.8%) | 3 (3.4%) |
| Total | 177 (100.0%) | 88 (100.0%) |
Commute Time in Hulett
The most frequently occuring commute durations in Hulett are less than 5 minutes (121 commuters, 51.5%), 5 to 9 minutes (39 commuters, 16.6%), and 30 to 34 minutes (21 commuters, 8.9%).
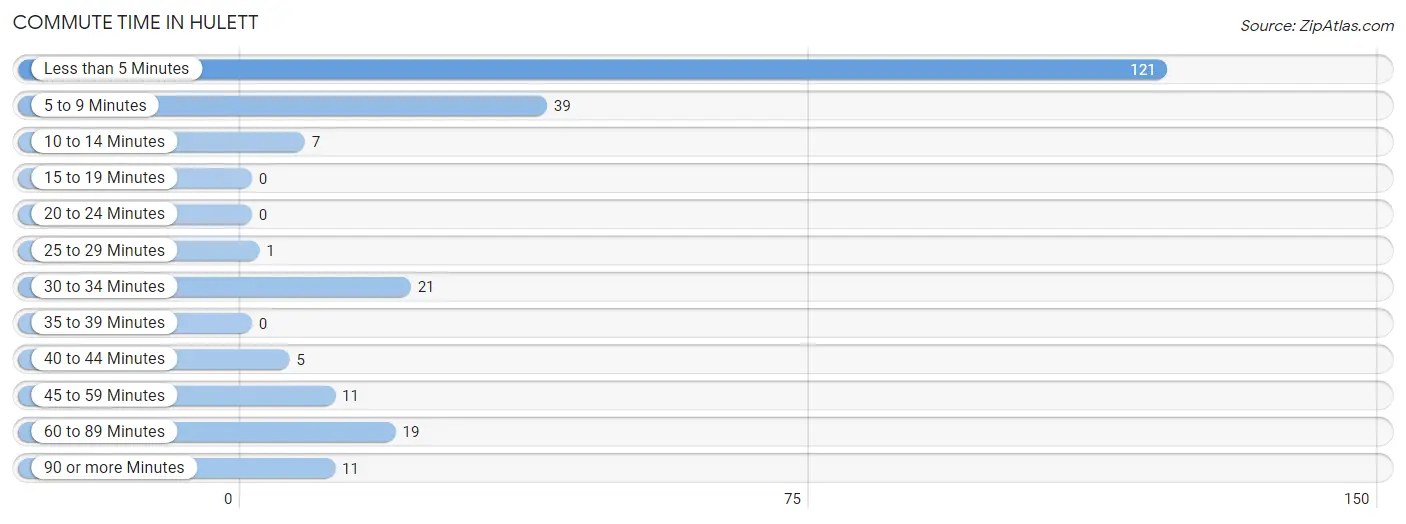
| Commute Time | # Commuters | % Commuters |
| Less than 5 Minutes | 121 | 51.5% |
| 5 to 9 Minutes | 39 | 16.6% |
| 10 to 14 Minutes | 7 | 3.0% |
| 15 to 19 Minutes | 0 | 0.0% |
| 20 to 24 Minutes | 0 | 0.0% |
| 25 to 29 Minutes | 1 | 0.4% |
| 30 to 34 Minutes | 21 | 8.9% |
| 35 to 39 Minutes | 0 | 0.0% |
| 40 to 44 Minutes | 5 | 2.1% |
| 45 to 59 Minutes | 11 | 4.7% |
| 60 to 89 Minutes | 19 | 8.1% |
| 90 or more Minutes | 11 | 4.7% |
Commute Time by Sex in Hulett
The most common commute times in Hulett are less than 5 minutes (83 commuters, 49.4%) for males and less than 5 minutes (38 commuters, 56.7%) for females.
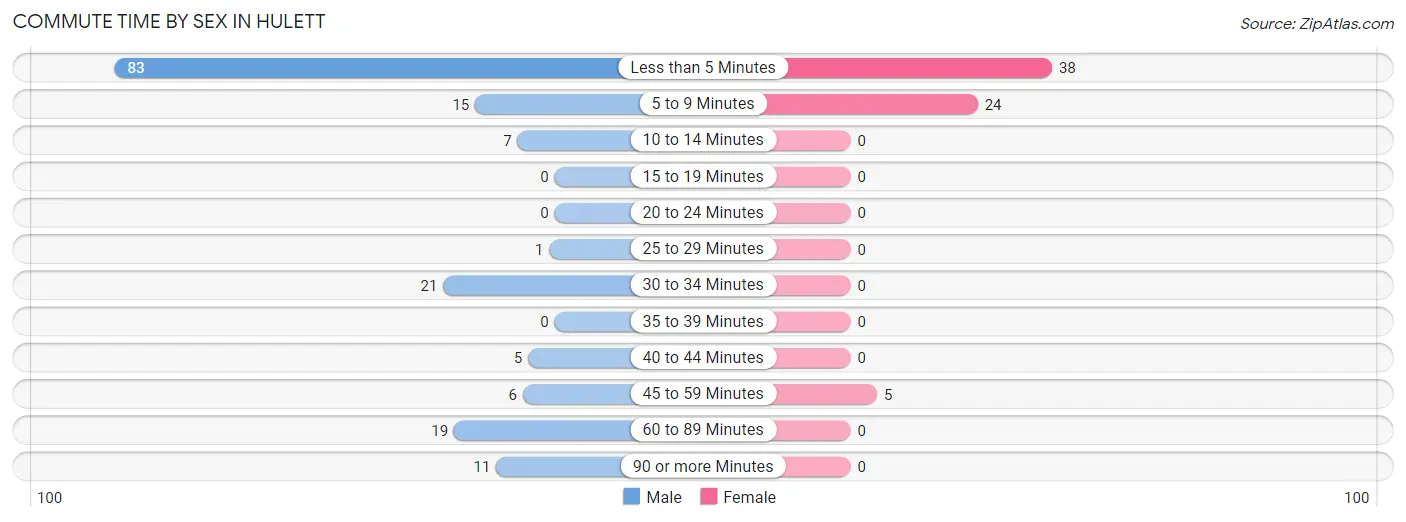
| Commute Time | Male | Female |
| Less than 5 Minutes | 83 (49.4%) | 38 (56.7%) |
| 5 to 9 Minutes | 15 (8.9%) | 24 (35.8%) |
| 10 to 14 Minutes | 7 (4.2%) | 0 (0.0%) |
| 15 to 19 Minutes | 0 (0.0%) | 0 (0.0%) |
| 20 to 24 Minutes | 0 (0.0%) | 0 (0.0%) |
| 25 to 29 Minutes | 1 (0.6%) | 0 (0.0%) |
| 30 to 34 Minutes | 21 (12.5%) | 0 (0.0%) |
| 35 to 39 Minutes | 0 (0.0%) | 0 (0.0%) |
| 40 to 44 Minutes | 5 (3.0%) | 0 (0.0%) |
| 45 to 59 Minutes | 6 (3.6%) | 5 (7.5%) |
| 60 to 89 Minutes | 19 (11.3%) | 0 (0.0%) |
| 90 or more Minutes | 11 (6.6%) | 0 (0.0%) |
Time of Departure to Work by Sex in Hulett
The most frequent times of departure to work in Hulett are 12:00 AM to 4:59 AM (29, 17.3%) for males and 7:00 AM to 7:29 AM (18, 26.9%) for females.
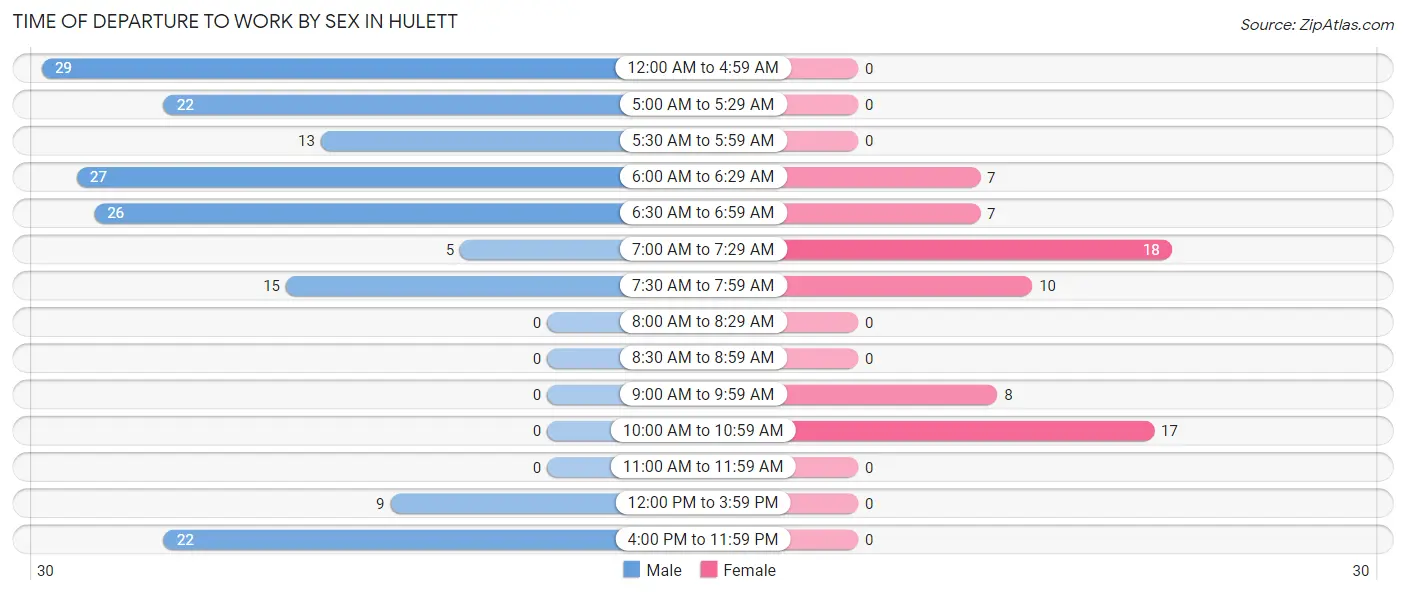
| Time of Departure | Male | Female |
| 12:00 AM to 4:59 AM | 29 (17.3%) | 0 (0.0%) |
| 5:00 AM to 5:29 AM | 22 (13.1%) | 0 (0.0%) |
| 5:30 AM to 5:59 AM | 13 (7.7%) | 0 (0.0%) |
| 6:00 AM to 6:29 AM | 27 (16.1%) | 7 (10.4%) |
| 6:30 AM to 6:59 AM | 26 (15.5%) | 7 (10.4%) |
| 7:00 AM to 7:29 AM | 5 (3.0%) | 18 (26.9%) |
| 7:30 AM to 7:59 AM | 15 (8.9%) | 10 (14.9%) |
| 8:00 AM to 8:29 AM | 0 (0.0%) | 0 (0.0%) |
| 8:30 AM to 8:59 AM | 0 (0.0%) | 0 (0.0%) |
| 9:00 AM to 9:59 AM | 0 (0.0%) | 8 (11.9%) |
| 10:00 AM to 10:59 AM | 0 (0.0%) | 17 (25.4%) |
| 11:00 AM to 11:59 AM | 0 (0.0%) | 0 (0.0%) |
| 12:00 PM to 3:59 PM | 9 (5.4%) | 0 (0.0%) |
| 4:00 PM to 11:59 PM | 22 (13.1%) | 0 (0.0%) |
| Total | 168 (100.0%) | 67 (100.0%) |
Housing Occupancy in Hulett
Occupancy by Ownership in Hulett
Of the total 193 dwellings in Hulett, owner-occupied units account for 146 (75.6%), while renter-occupied units make up 47 (24.3%).
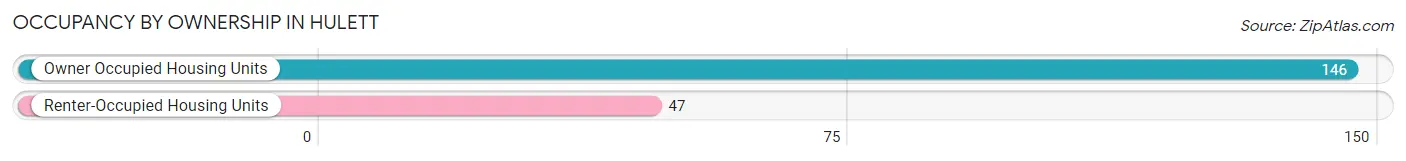
| Occupancy | # Housing Units | % Housing Units |
| Owner Occupied Housing Units | 146 | 75.6% |
| Renter-Occupied Housing Units | 47 | 24.3% |
| Total Occupied Housing Units | 193 | 100.0% |
Occupancy by Household Size in Hulett
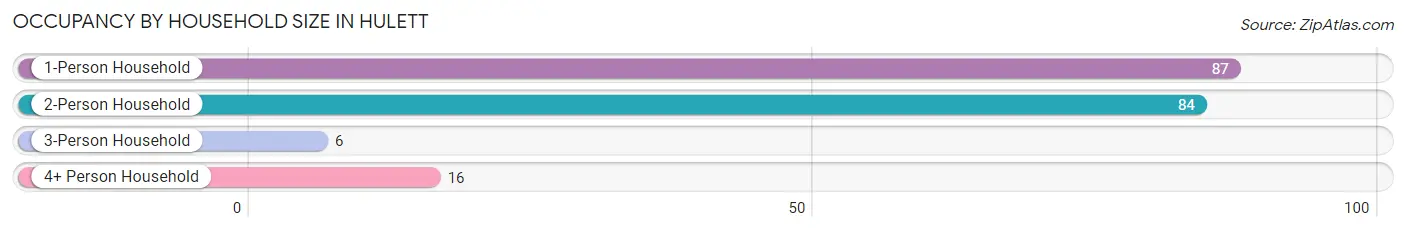
| Household Size | # Housing Units | % Housing Units |
| 1-Person Household | 87 | 45.1% |
| 2-Person Household | 84 | 43.5% |
| 3-Person Household | 6 | 3.1% |
| 4+ Person Household | 16 | 8.3% |
| Total Housing Units | 193 | 100.0% |
Occupancy by Ownership by Household Size in Hulett
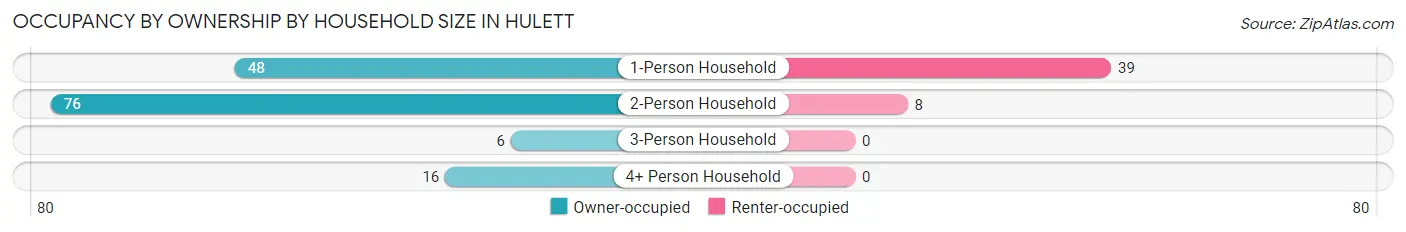
| Household Size | Owner-occupied | Renter-occupied |
| 1-Person Household | 48 (55.2%) | 39 (44.8%) |
| 2-Person Household | 76 (90.5%) | 8 (9.5%) |
| 3-Person Household | 6 (100.0%) | 0 (0.0%) |
| 4+ Person Household | 16 (100.0%) | 0 (0.0%) |
| Total Housing Units | 146 (75.6%) | 47 (24.3%) |
Occupancy by Educational Attainment in Hulett
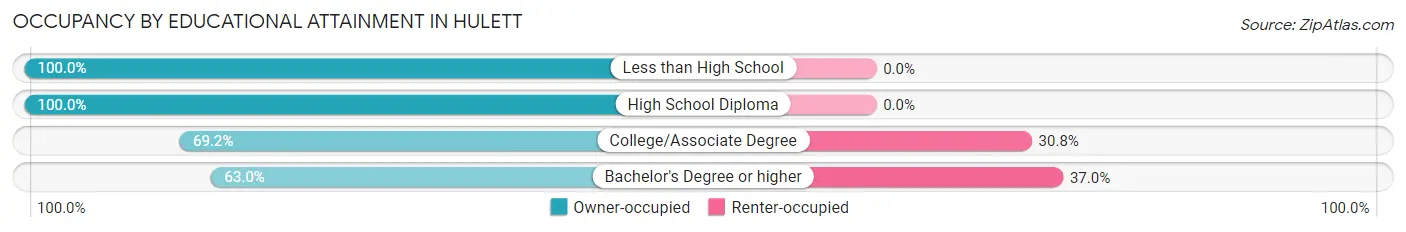
| Household Size | Owner-occupied | Renter-occupied |
| Less than High School | 9 (100.0%) | 0 (0.0%) |
| High School Diploma | 37 (100.0%) | 0 (0.0%) |
| College/Associate Degree | 83 (69.2%) | 37 (30.8%) |
| Bachelor's Degree or higher | 17 (63.0%) | 10 (37.0%) |
Occupancy by Age of Householder in Hulett
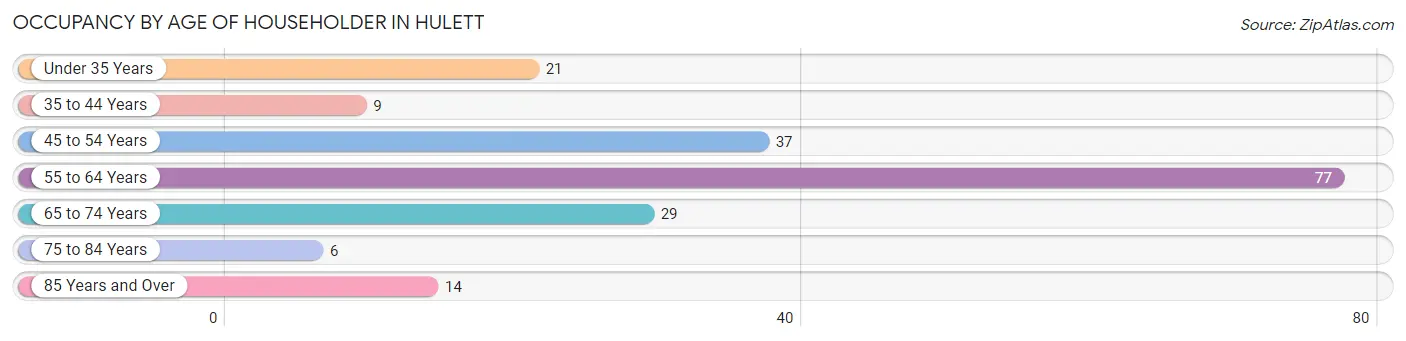
| Age Bracket | # Households | % Households |
| Under 35 Years | 21 | 10.9% |
| 35 to 44 Years | 9 | 4.7% |
| 45 to 54 Years | 37 | 19.2% |
| 55 to 64 Years | 77 | 39.9% |
| 65 to 74 Years | 29 | 15.0% |
| 75 to 84 Years | 6 | 3.1% |
| 85 Years and Over | 14 | 7.2% |
| Total | 193 | 100.0% |
Housing Finances in Hulett
Median Income by Occupancy in Hulett

| Occupancy Type | # Households | Median Income |
| Owner-Occupied | 146 (75.6%) | $69,706 |
| Renter-Occupied | 47 (24.3%) | $0 |
| Average | 193 (100.0%) | $68,177 |
Occupancy by Householder Income Bracket in Hulett
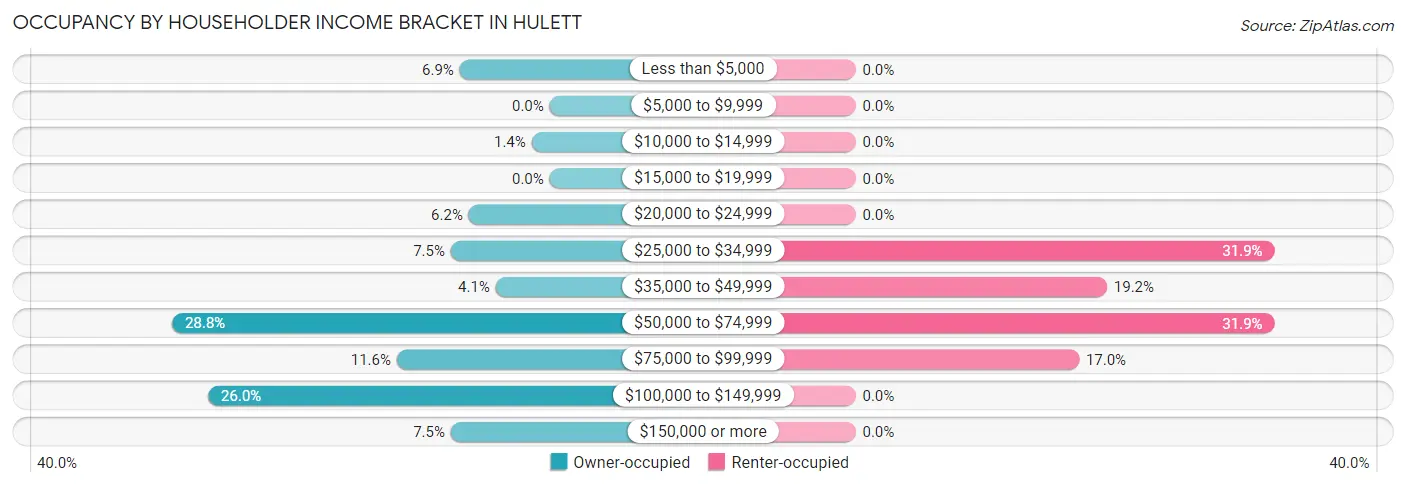
| Income Bracket | Owner-occupied | Renter-occupied |
| Less than $5,000 | 10 (6.9%) | 0 (0.0%) |
| $5,000 to $9,999 | 0 (0.0%) | 0 (0.0%) |
| $10,000 to $14,999 | 2 (1.4%) | 0 (0.0%) |
| $15,000 to $19,999 | 0 (0.0%) | 0 (0.0%) |
| $20,000 to $24,999 | 9 (6.2%) | 0 (0.0%) |
| $25,000 to $34,999 | 11 (7.5%) | 15 (31.9%) |
| $35,000 to $49,999 | 6 (4.1%) | 9 (19.2%) |
| $50,000 to $74,999 | 42 (28.8%) | 15 (31.9%) |
| $75,000 to $99,999 | 17 (11.6%) | 8 (17.0%) |
| $100,000 to $149,999 | 38 (26.0%) | 0 (0.0%) |
| $150,000 or more | 11 (7.5%) | 0 (0.0%) |
| Total | 146 (100.0%) | 47 (100.0%) |
Monthly Housing Cost Tiers in Hulett
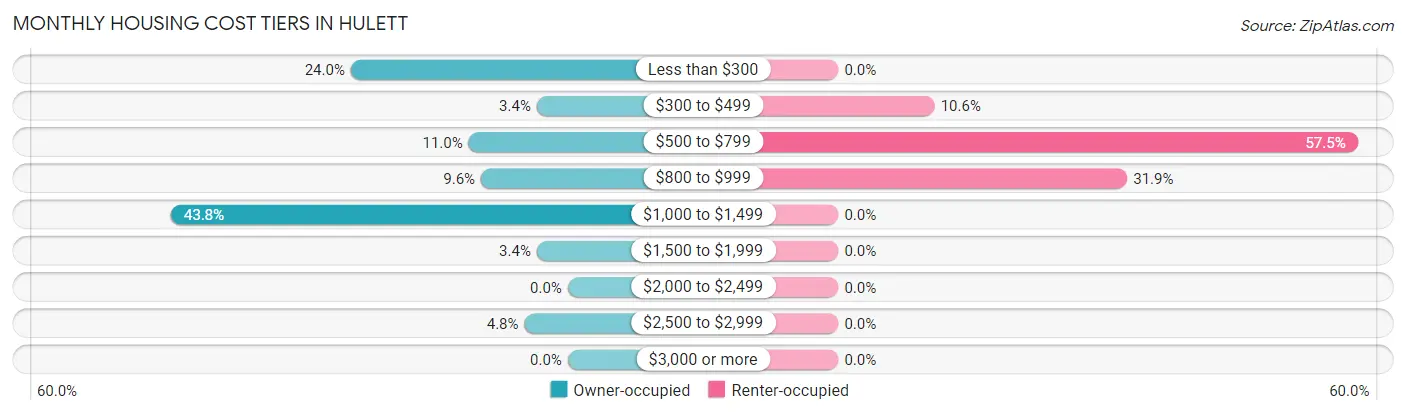
| Monthly Cost | Owner-occupied | Renter-occupied |
| Less than $300 | 35 (24.0%) | 0 (0.0%) |
| $300 to $499 | 5 (3.4%) | 5 (10.6%) |
| $500 to $799 | 16 (11.0%) | 27 (57.5%) |
| $800 to $999 | 14 (9.6%) | 15 (31.9%) |
| $1,000 to $1,499 | 64 (43.8%) | 0 (0.0%) |
| $1,500 to $1,999 | 5 (3.4%) | 0 (0.0%) |
| $2,000 to $2,499 | 0 (0.0%) | 0 (0.0%) |
| $2,500 to $2,999 | 7 (4.8%) | 0 (0.0%) |
| $3,000 or more | 0 (0.0%) | 0 (0.0%) |
| Total | 146 (100.0%) | 47 (100.0%) |
Physical Housing Characteristics in Hulett
Housing Structures in Hulett
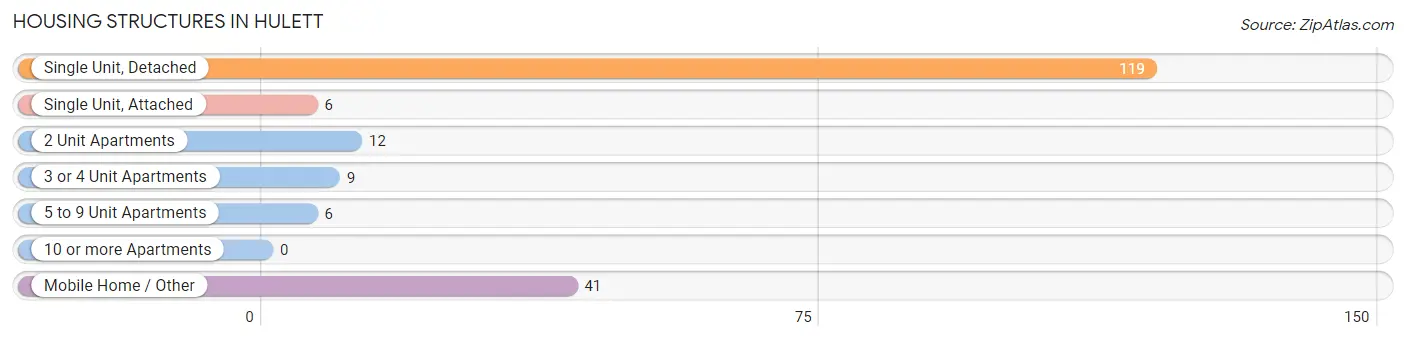
| Structure Type | # Housing Units | % Housing Units |
| Single Unit, Detached | 119 | 61.7% |
| Single Unit, Attached | 6 | 3.1% |
| 2 Unit Apartments | 12 | 6.2% |
| 3 or 4 Unit Apartments | 9 | 4.7% |
| 5 to 9 Unit Apartments | 6 | 3.1% |
| 10 or more Apartments | 0 | 0.0% |
| Mobile Home / Other | 41 | 21.2% |
| Total | 193 | 100.0% |
Housing Structures by Occupancy in Hulett
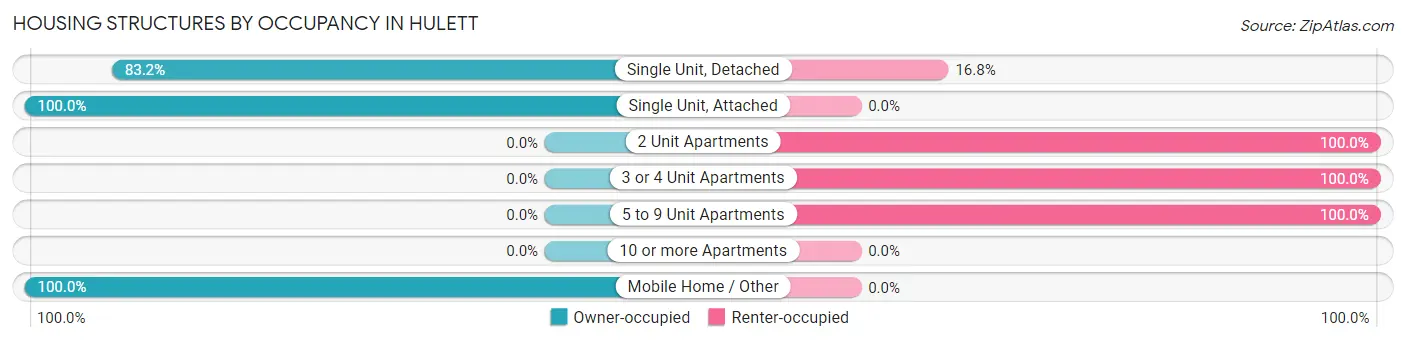
| Structure Type | Owner-occupied | Renter-occupied |
| Single Unit, Detached | 99 (83.2%) | 20 (16.8%) |
| Single Unit, Attached | 6 (100.0%) | 0 (0.0%) |
| 2 Unit Apartments | 0 (0.0%) | 12 (100.0%) |
| 3 or 4 Unit Apartments | 0 (0.0%) | 9 (100.0%) |
| 5 to 9 Unit Apartments | 0 (0.0%) | 6 (100.0%) |
| 10 or more Apartments | 0 (0.0%) | 0 (0.0%) |
| Mobile Home / Other | 41 (100.0%) | 0 (0.0%) |
| Total | 146 (75.6%) | 47 (24.3%) |
Housing Structures by Number of Rooms in Hulett
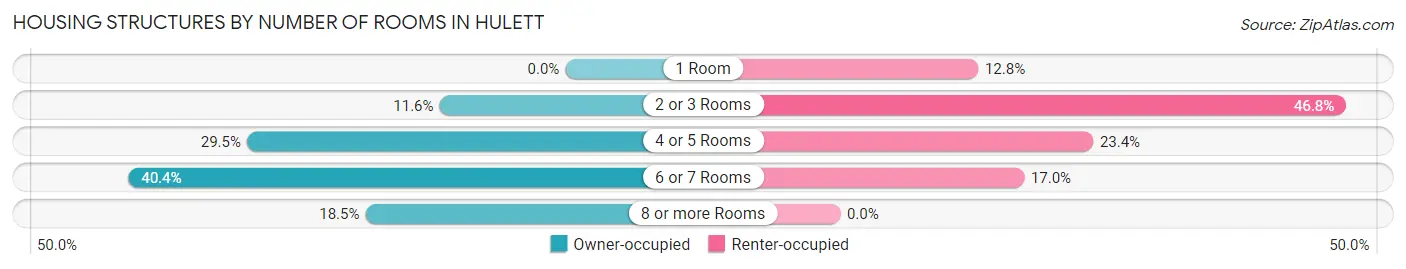
| Number of Rooms | Owner-occupied | Renter-occupied |
| 1 Room | 0 (0.0%) | 6 (12.8%) |
| 2 or 3 Rooms | 17 (11.6%) | 22 (46.8%) |
| 4 or 5 Rooms | 43 (29.4%) | 11 (23.4%) |
| 6 or 7 Rooms | 59 (40.4%) | 8 (17.0%) |
| 8 or more Rooms | 27 (18.5%) | 0 (0.0%) |
| Total | 146 (100.0%) | 47 (100.0%) |
Housing Structure by Heating Type in Hulett
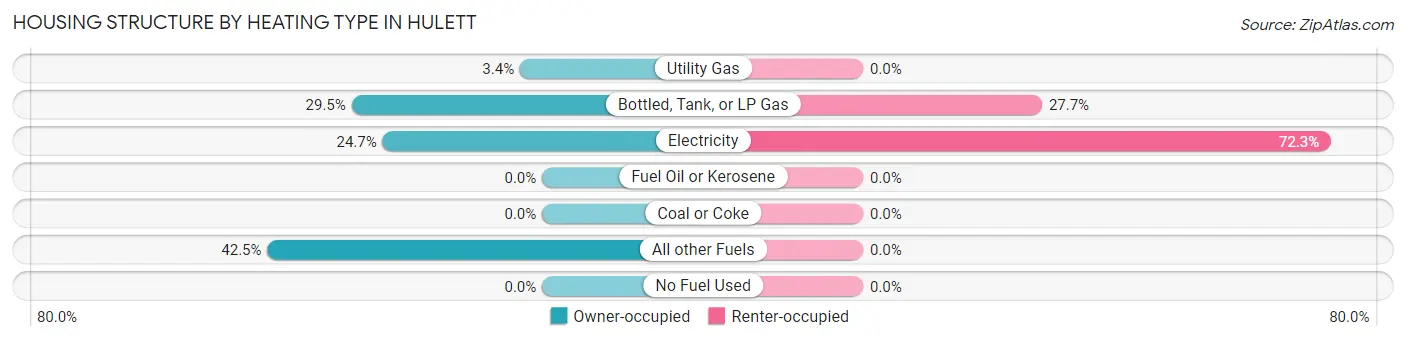
| Heating Type | Owner-occupied | Renter-occupied |
| Utility Gas | 5 (3.4%) | 0 (0.0%) |
| Bottled, Tank, or LP Gas | 43 (29.4%) | 13 (27.7%) |
| Electricity | 36 (24.7%) | 34 (72.3%) |
| Fuel Oil or Kerosene | 0 (0.0%) | 0 (0.0%) |
| Coal or Coke | 0 (0.0%) | 0 (0.0%) |
| All other Fuels | 62 (42.5%) | 0 (0.0%) |
| No Fuel Used | 0 (0.0%) | 0 (0.0%) |
| Total | 146 (100.0%) | 47 (100.0%) |
Household Vehicle Usage in Hulett
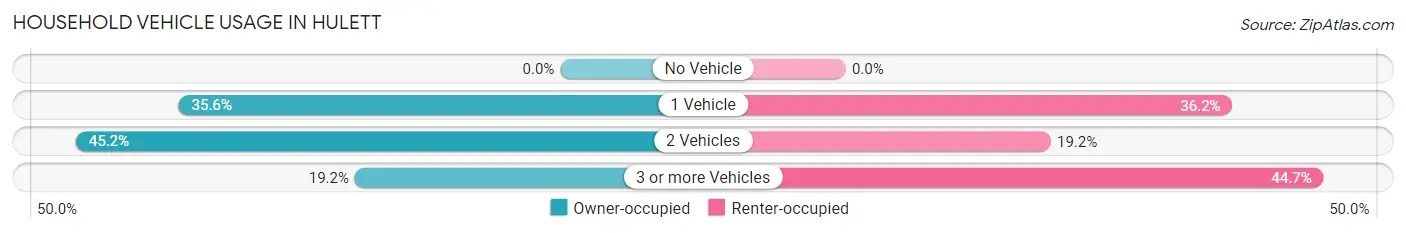
| Vehicles per Household | Owner-occupied | Renter-occupied |
| No Vehicle | 0 (0.0%) | 0 (0.0%) |
| 1 Vehicle | 52 (35.6%) | 17 (36.2%) |
| 2 Vehicles | 66 (45.2%) | 9 (19.2%) |
| 3 or more Vehicles | 28 (19.2%) | 21 (44.7%) |
| Total | 146 (100.0%) | 47 (100.0%) |
Real Estate & Mortgages in Hulett
Real Estate and Mortgage Overview in Hulett
| Characteristic | Without Mortgage | With Mortgage |
| Housing Units | 70 | 76 |
| Median Property Value | - | - |
| Median Household Income | $68,088 | $5 |
| Monthly Housing Costs | - | - |
| Real Estate Taxes | - | - |
Property Value by Mortgage Status in Hulett
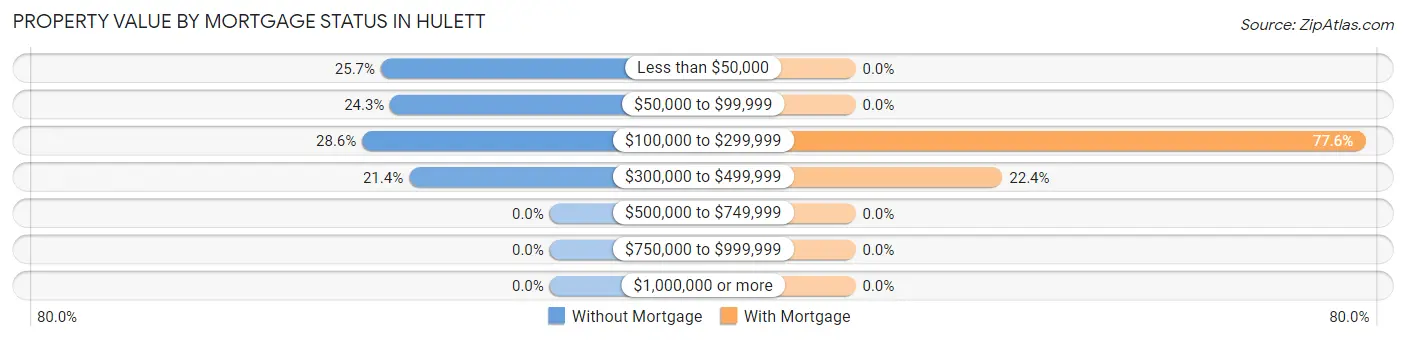
| Property Value | Without Mortgage | With Mortgage |
| Less than $50,000 | 18 (25.7%) | 0 (0.0%) |
| $50,000 to $99,999 | 17 (24.3%) | 0 (0.0%) |
| $100,000 to $299,999 | 20 (28.6%) | 59 (77.6%) |
| $300,000 to $499,999 | 15 (21.4%) | 17 (22.4%) |
| $500,000 to $749,999 | 0 (0.0%) | 0 (0.0%) |
| $750,000 to $999,999 | 0 (0.0%) | 0 (0.0%) |
| $1,000,000 or more | 0 (0.0%) | 0 (0.0%) |
| Total | 70 (100.0%) | 76 (100.0%) |
Household Income by Mortgage Status in Hulett
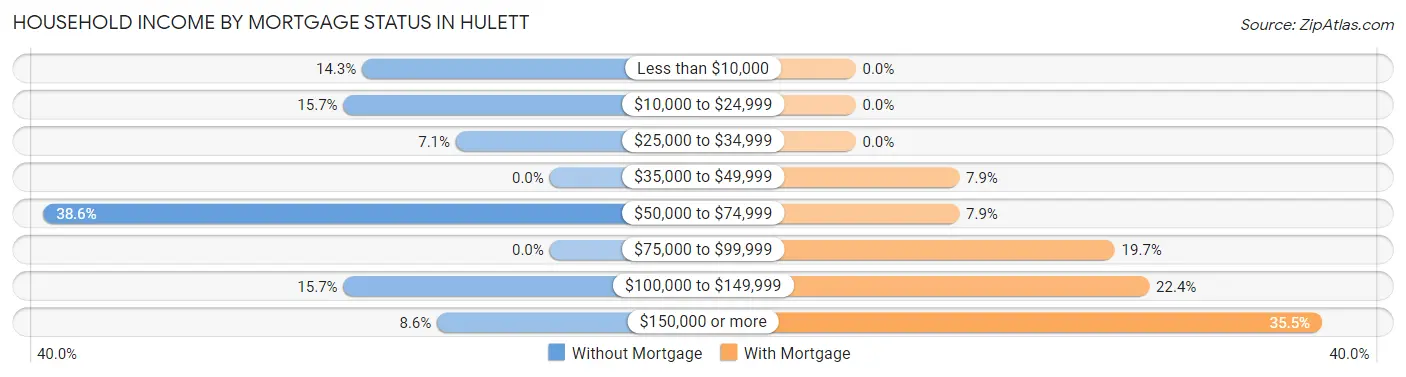
| Household Income | Without Mortgage | With Mortgage |
| Less than $10,000 | 10 (14.3%) | 0 (0.0%) |
| $10,000 to $24,999 | 11 (15.7%) | 0 (0.0%) |
| $25,000 to $34,999 | 5 (7.1%) | 0 (0.0%) |
| $35,000 to $49,999 | 0 (0.0%) | 6 (7.9%) |
| $50,000 to $74,999 | 27 (38.6%) | 6 (7.9%) |
| $75,000 to $99,999 | 0 (0.0%) | 15 (19.7%) |
| $100,000 to $149,999 | 11 (15.7%) | 17 (22.4%) |
| $150,000 or more | 6 (8.6%) | 27 (35.5%) |
| Total | 70 (100.0%) | 76 (100.0%) |
Property Value to Household Income Ratio in Hulett
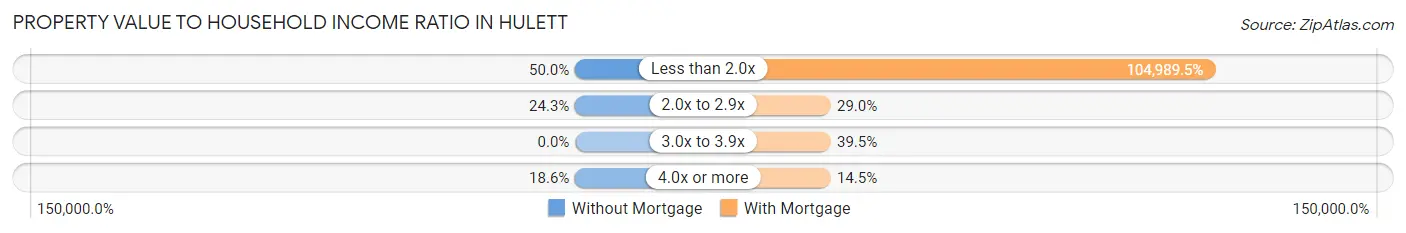
| Value-to-Income Ratio | Without Mortgage | With Mortgage |
| Less than 2.0x | 35 (50.0%) | 79,792 (104,989.5%) |
| 2.0x to 2.9x | 17 (24.3%) | 22 (28.9%) |
| 3.0x to 3.9x | 0 (0.0%) | 30 (39.5%) |
| 4.0x or more | 13 (18.6%) | 11 (14.5%) |
| Total | 70 (100.0%) | 76 (100.0%) |
Real Estate Taxes by Mortgage Status in Hulett
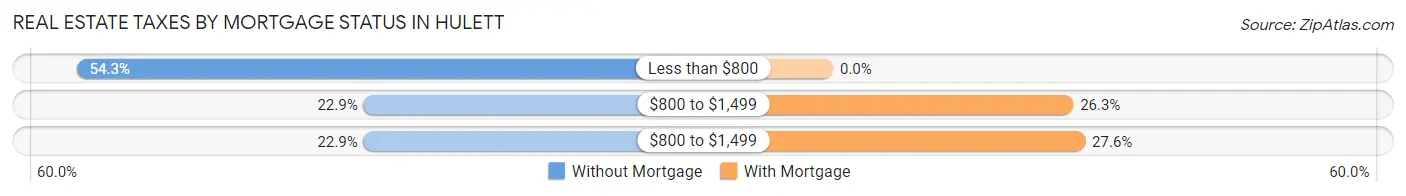
| Property Taxes | Without Mortgage | With Mortgage |
| Less than $800 | 38 (54.3%) | 0 (0.0%) |
| $800 to $1,499 | 16 (22.9%) | 20 (26.3%) |
| $800 to $1,499 | 16 (22.9%) | 21 (27.6%) |
| Total | 70 (100.0%) | 76 (100.0%) |
Health & Disability in Hulett
Health Insurance Coverage by Age in Hulett
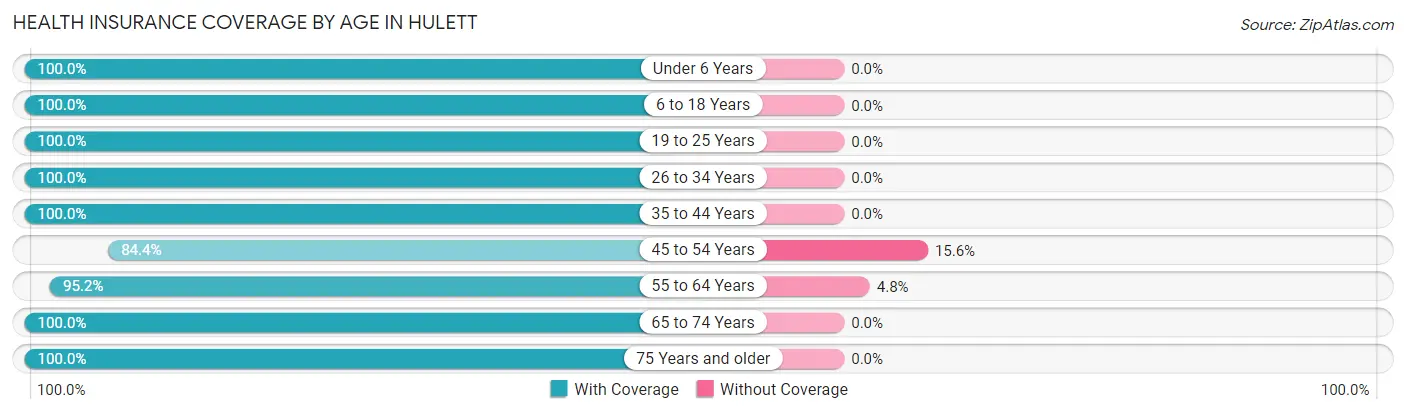
| Age Bracket | With Coverage | Without Coverage |
| Under 6 Years | 8 (100.0%) | 0 (0.0%) |
| 6 to 18 Years | 56 (100.0%) | 0 (0.0%) |
| 19 to 25 Years | 20 (100.0%) | 0 (0.0%) |
| 26 to 34 Years | 42 (100.0%) | 0 (0.0%) |
| 35 to 44 Years | 17 (100.0%) | 0 (0.0%) |
| 45 to 54 Years | 92 (84.4%) | 17 (15.6%) |
| 55 to 64 Years | 100 (95.2%) | 5 (4.8%) |
| 65 to 74 Years | 37 (100.0%) | 0 (0.0%) |
| 75 Years and older | 20 (100.0%) | 0 (0.0%) |
| Total | 392 (94.7%) | 22 (5.3%) |
Health Insurance Coverage by Citizenship Status in Hulett
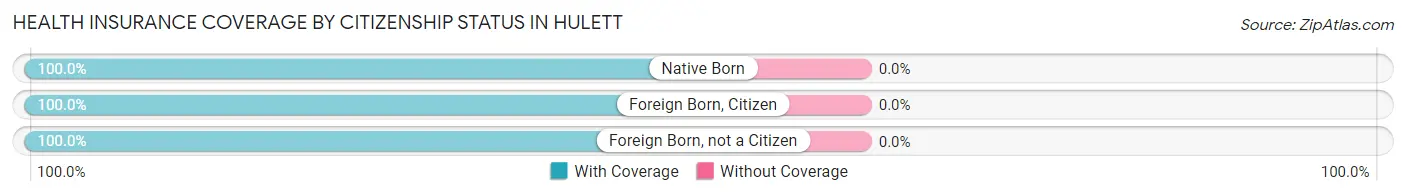
| Citizenship Status | With Coverage | Without Coverage |
| Native Born | 8 (100.0%) | 0 (0.0%) |
| Foreign Born, Citizen | 56 (100.0%) | 0 (0.0%) |
| Foreign Born, not a Citizen | 20 (100.0%) | 0 (0.0%) |
Health Insurance Coverage by Household Income in Hulett
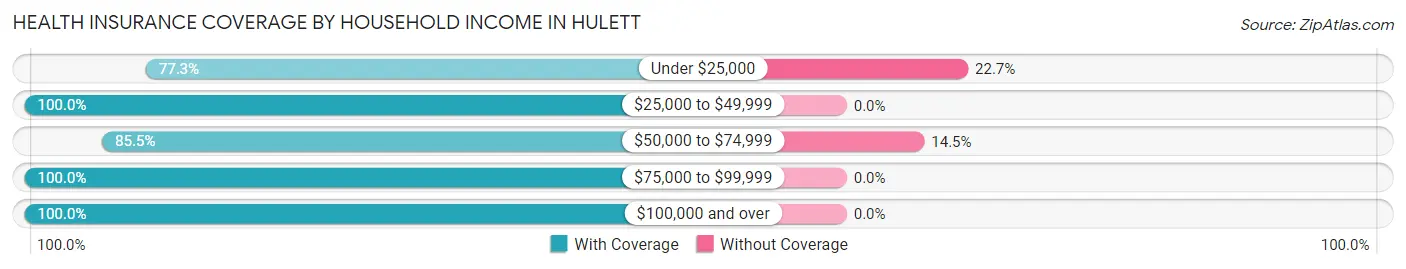
| Household Income | With Coverage | Without Coverage |
| Under $25,000 | 17 (77.3%) | 5 (22.7%) |
| $25,000 to $49,999 | 41 (100.0%) | 0 (0.0%) |
| $50,000 to $74,999 | 100 (85.5%) | 17 (14.5%) |
| $75,000 to $99,999 | 30 (100.0%) | 0 (0.0%) |
| $100,000 and over | 204 (100.0%) | 0 (0.0%) |
Public vs Private Health Insurance Coverage by Age in Hulett
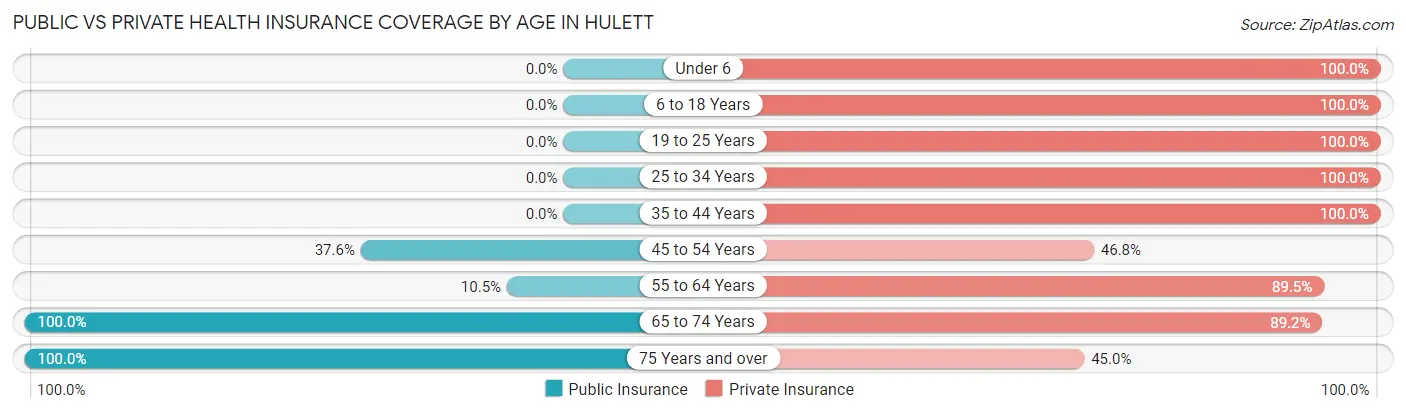
| Age Bracket | Public Insurance | Private Insurance |
| Under 6 | 0 (0.0%) | 8 (100.0%) |
| 6 to 18 Years | 0 (0.0%) | 56 (100.0%) |
| 19 to 25 Years | 0 (0.0%) | 20 (100.0%) |
| 25 to 34 Years | 0 (0.0%) | 42 (100.0%) |
| 35 to 44 Years | 0 (0.0%) | 17 (100.0%) |
| 45 to 54 Years | 41 (37.6%) | 51 (46.8%) |
| 55 to 64 Years | 11 (10.5%) | 94 (89.5%) |
| 65 to 74 Years | 37 (100.0%) | 33 (89.2%) |
| 75 Years and over | 20 (100.0%) | 9 (45.0%) |
| Total | 109 (26.3%) | 330 (79.7%) |
Disability Status by Sex by Age in Hulett
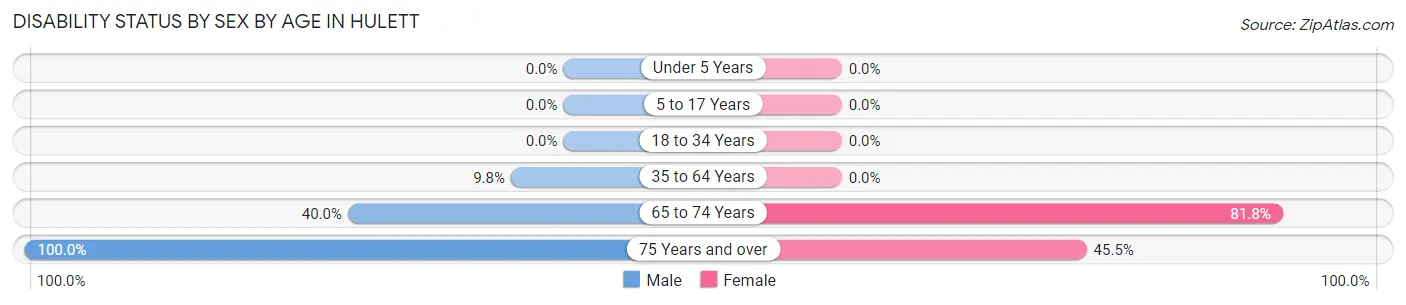
| Age Bracket | Male | Female |
| Under 5 Years | 0 (0.0%) | 0 (0.0%) |
| 5 to 17 Years | 0 (0.0%) | 0 (0.0%) |
| 18 to 34 Years | 0 (0.0%) | 0 (0.0%) |
| 35 to 64 Years | 12 (9.8%) | 0 (0.0%) |
| 65 to 74 Years | 6 (40.0%) | 18 (81.8%) |
| 75 Years and over | 9 (100.0%) | 5 (45.5%) |
Disability Class by Sex by Age in Hulett
Disability Class: Hearing Difficulty
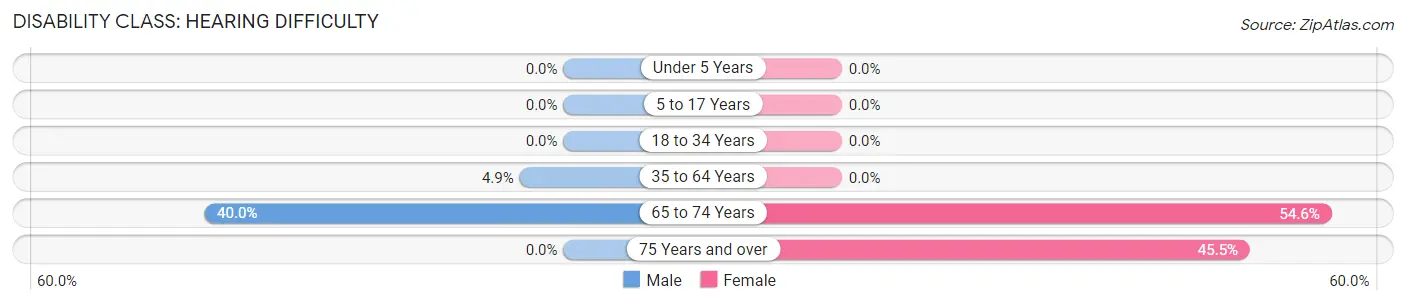
| Age Bracket | Male | Female |
| Under 5 Years | 0 (0.0%) | 0 (0.0%) |
| 5 to 17 Years | 0 (0.0%) | 0 (0.0%) |
| 18 to 34 Years | 0 (0.0%) | 0 (0.0%) |
| 35 to 64 Years | 6 (4.9%) | 0 (0.0%) |
| 65 to 74 Years | 6 (40.0%) | 12 (54.5%) |
| 75 Years and over | 0 (0.0%) | 5 (45.5%) |
Disability Class: Vision Difficulty
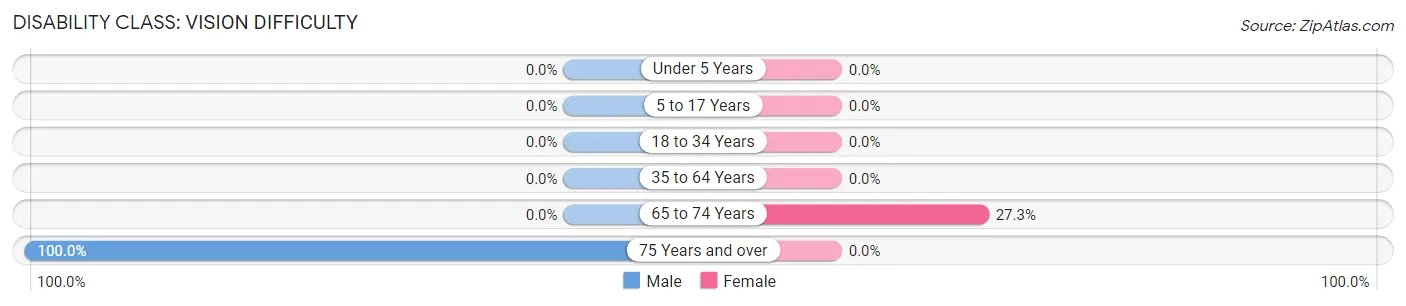
| Age Bracket | Male | Female |
| Under 5 Years | 0 (0.0%) | 0 (0.0%) |
| 5 to 17 Years | 0 (0.0%) | 0 (0.0%) |
| 18 to 34 Years | 0 (0.0%) | 0 (0.0%) |
| 35 to 64 Years | 0 (0.0%) | 0 (0.0%) |
| 65 to 74 Years | 0 (0.0%) | 6 (27.3%) |
| 75 Years and over | 9 (100.0%) | 0 (0.0%) |
Disability Class: Cognitive Difficulty
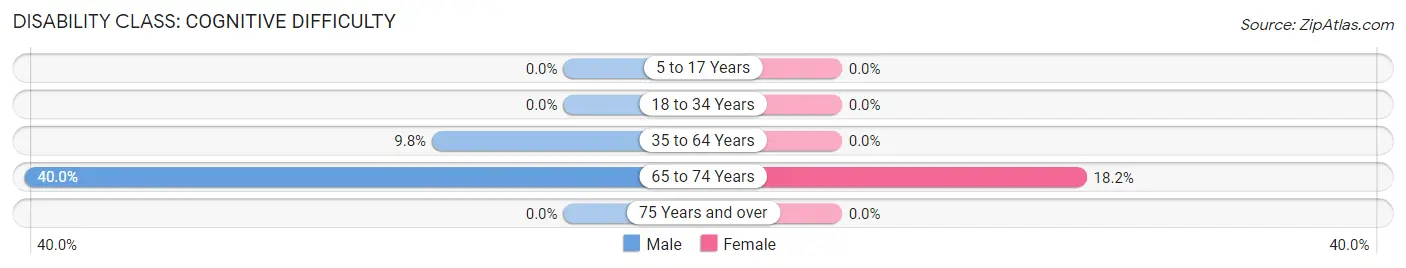
| Age Bracket | Male | Female |
| 5 to 17 Years | 0 (0.0%) | 0 (0.0%) |
| 18 to 34 Years | 0 (0.0%) | 0 (0.0%) |
| 35 to 64 Years | 12 (9.8%) | 0 (0.0%) |
| 65 to 74 Years | 6 (40.0%) | 4 (18.2%) |
| 75 Years and over | 0 (0.0%) | 0 (0.0%) |
Disability Class: Ambulatory Difficulty
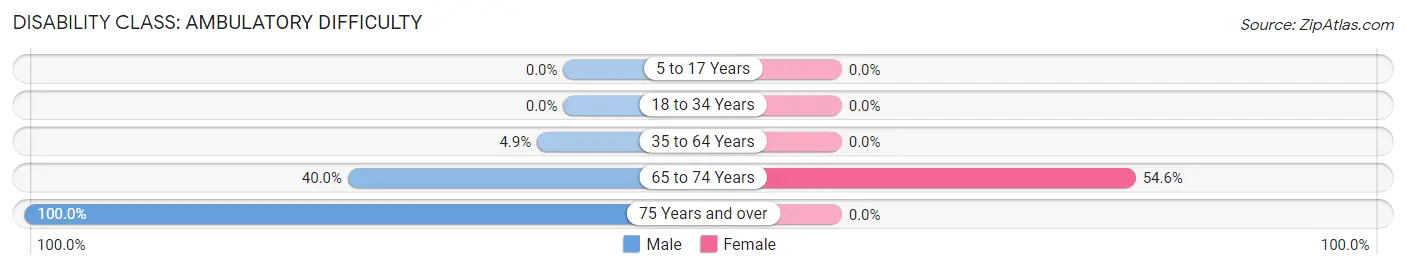
| Age Bracket | Male | Female |
| 5 to 17 Years | 0 (0.0%) | 0 (0.0%) |
| 18 to 34 Years | 0 (0.0%) | 0 (0.0%) |
| 35 to 64 Years | 6 (4.9%) | 0 (0.0%) |
| 65 to 74 Years | 6 (40.0%) | 12 (54.5%) |
| 75 Years and over | 9 (100.0%) | 0 (0.0%) |
Disability Class: Self-Care Difficulty
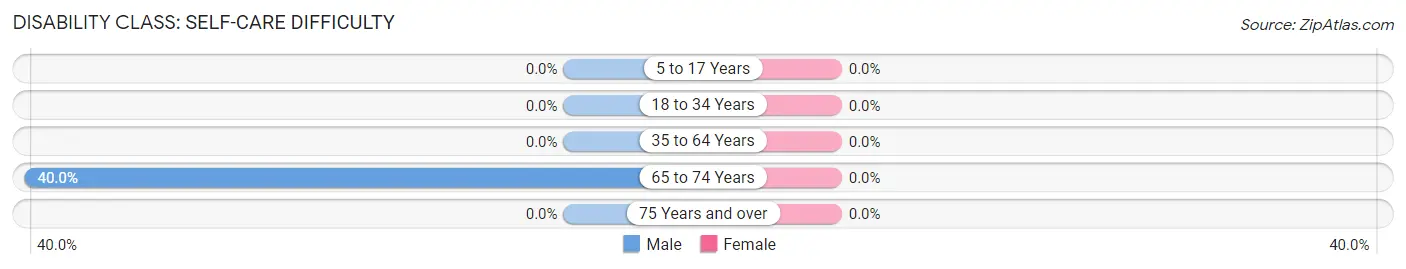
| Age Bracket | Male | Female |
| 5 to 17 Years | 0 (0.0%) | 0 (0.0%) |
| 18 to 34 Years | 0 (0.0%) | 0 (0.0%) |
| 35 to 64 Years | 0 (0.0%) | 0 (0.0%) |
| 65 to 74 Years | 6 (40.0%) | 0 (0.0%) |
| 75 Years and over | 0 (0.0%) | 0 (0.0%) |
Technology Access in Hulett
Computing Device Access in Hulett
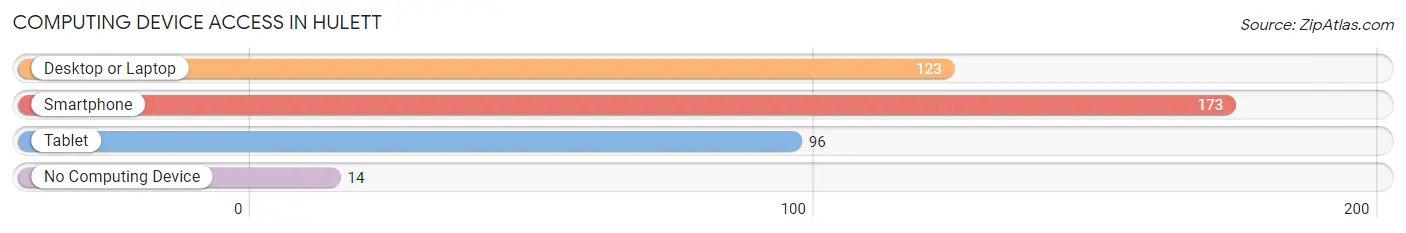
| Device Type | # Households | % Households |
| Desktop or Laptop | 123 | 63.7% |
| Smartphone | 173 | 89.6% |
| Tablet | 96 | 49.7% |
| No Computing Device | 14 | 7.2% |
| Total | 193 | 100.0% |
Internet Access in Hulett
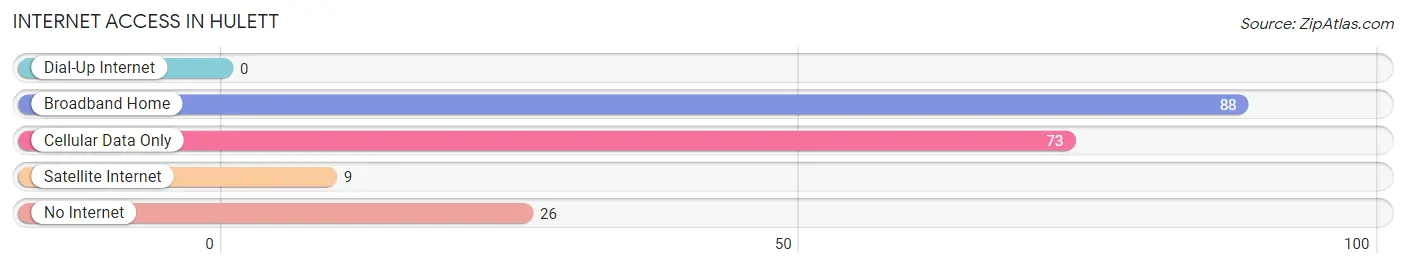
| Internet Type | # Households | % Households |
| Dial-Up Internet | 0 | 0.0% |
| Broadband Home | 88 | 45.6% |
| Cellular Data Only | 73 | 37.8% |
| Satellite Internet | 9 | 4.7% |
| No Internet | 26 | 13.5% |
| Total | 193 | 100.0% |
Hulett Summary
Hulett is a small town located in the northeastern corner of Wyoming, in the foothills of the Black Hills. It is situated in Crook County, and is the county seat. The town was founded in 1906, and was named after the first postmaster, William Hulett. The population of Hulett was 590 in the 2010 census.
Geography
Hulett is located in the northeastern corner of Wyoming, in the foothills of the Black Hills. It is situated in Crook County, and is the county seat. The town is located at an elevation of 4,092 feet, and is surrounded by rolling hills and grasslands. The town is located on the Belle Fourche River, and is near the Wyoming-South Dakota border. The nearest major city is Rapid City, South Dakota, which is about 50 miles away.
The climate in Hulett is semi-arid, with hot summers and cold winters. The average annual temperature is 48°F, and the average annual precipitation is 16.5 inches.
Economy
The economy of Hulett is largely based on agriculture and tourism. The town is home to several small businesses, including a grocery store, a hardware store, and a restaurant. The town is also home to a number of tourist attractions, including the Hulett Museum, the Crook County Historical Society, and the Hulett Rodeo.
The town is also home to a number of ranches, which raise cattle, horses, and sheep. The town is also home to a number of oil and gas wells, which provide jobs for many of the town's residents.
Demographics
As of the 2010 census, the population of Hulett was 590. The racial makeup of the town was 97.2% White, 0.2% African American, 0.2% Native American, 0.2% Asian, 0.2% from other races, and 1.9% from two or more races. Hispanic or Latino of any race were 1.7% of the population.
The median income for a household in Hulett was $37,500, and the median income for a family was $45,000. The per capita income for the town was $18,000. About 11.2% of families and 14.2% of the population were below the poverty line, including 17.2% of those under age 18 and 8.3% of those age 65 or over.
Conclusion
Hulett is a small town located in the northeastern corner of Wyoming, in the foothills of the Black Hills. It is situated in Crook County, and is the county seat. The town was founded in 1906, and was named after the first postmaster, William Hulett. The population of Hulett was 590 in the 2010 census. The economy of Hulett is largely based on agriculture and tourism, and the town is home to several small businesses, ranches, and oil and gas wells. The racial makeup of the town was 97.2% White, 0.2% African American, 0.2% Native American, 0.2% Asian, 0.2% from other races, and 1.9% from two or more races. The median income for a household in Hulett was $37,500, and the median income for a family was $45,000. The per capita income for the town was $18,000.
Common Questions
What is Per Capita Income in Hulett?
Per Capita income in Hulett is $41,627.
What is the Median Family Income in Hulett?
Median Family Income in Hulett is $102,125.
What is the Median Household income in Hulett?
Median Household Income in Hulett is $68,177.
What is Income or Wage Gap in Hulett?
Income or Wage Gap in Hulett is 48.5%.
Women in Hulett earn 51.5 cents for every dollar earned by a man.
What is Inequality or Gini Index in Hulett?
Inequality or Gini Index in Hulett is 0.41.
What is the Total Population of Hulett?
Total Population of Hulett is 414.
What is the Total Male Population of Hulett?
Total Male Population of Hulett is 252.
What is the Total Female Population of Hulett?
Total Female Population of Hulett is 162.
What is the Ratio of Males per 100 Females in Hulett?
There are 155.56 Males per 100 Females in Hulett.
What is the Ratio of Females per 100 Males in Hulett?
There are 64.29 Females per 100 Males in Hulett.
What is the Median Population Age in Hulett?
Median Population Age in Hulett is 50.8 Years.
What is the Average Family Size in Hulett
Average Family Size in Hulett is 3.3 People.
What is the Average Household Size in Hulett
Average Household Size in Hulett is 2.1 People.
How Large is the Labor Force in Hulett?
There are 292 People in the Labor Forcein in Hulett.
What is the Percentage of People in the Labor Force in Hulett?
83.4% of People are in the Labor Force in Hulett.