Hudson, WY Map & Demographics
Hudson Map
Hudson Overview
$29,750
PER CAPITA INCOME
$78,750
AVG FAMILY INCOME
$52,750
AVG HOUSEHOLD INCOME
47.2%
WAGE / INCOME GAP [ % ]
52.8¢/ $1
WAGE / INCOME GAP [ $ ]
0.40
INEQUALITY / GINI INDEX
463
TOTAL POPULATION
205
MALE POPULATION
258
FEMALE POPULATION
79.46
MALES / 100 FEMALES
125.85
FEMALES / 100 MALES
40.2
MEDIAN AGE
3.2
AVG FAMILY SIZE
2.5
AVG HOUSEHOLD SIZE
243
LABOR FORCE [ PEOPLE ]
62.3%
PERCENT IN LABOR FORCE
4.6%
UNEMPLOYMENT RATE
Hudson Zip Codes
Hudson Area Codes
Income in Hudson
Income Overview in Hudson
Per Capita Income in Hudson is $29,750, while median incomes of families and households are $78,750 and $52,750 respectively.
| Characteristic | Number | Measure |
| Per Capita Income | 463 | $29,750 |
| Median Family Income | 121 | $78,750 |
| Mean Family Income | 121 | $87,515 |
| Median Household Income | 182 | $52,750 |
| Mean Household Income | 182 | $71,158 |
| Income Deficit | 121 | $0 |
| Wage / Income Gap (%) | 463 | 47.25% |
| Wage / Income Gap ($) | 463 | 52.75¢ per $1 |
| Gini / Inequality Index | 463 | 0.40 |
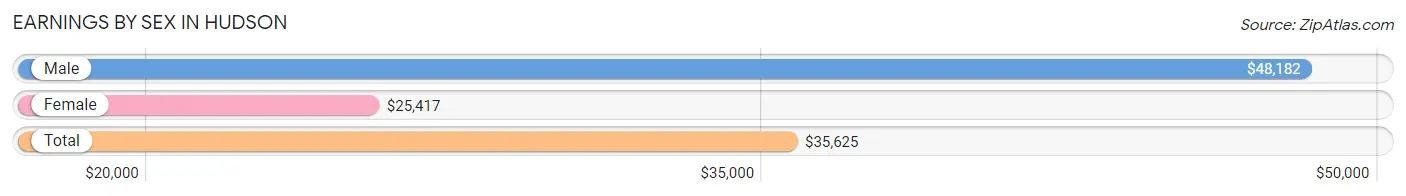
Earnings by Sex in Hudson
Average Earnings in Hudson are $35,625, $48,182 for men and $25,417 for women, a difference of 47.2%.
| Sex | Number | Average Earnings |
| Male | 102 (40.6%) | $48,182 |
| Female | 149 (59.4%) | $25,417 |
| Total | 251 (100.0%) | $35,625 |
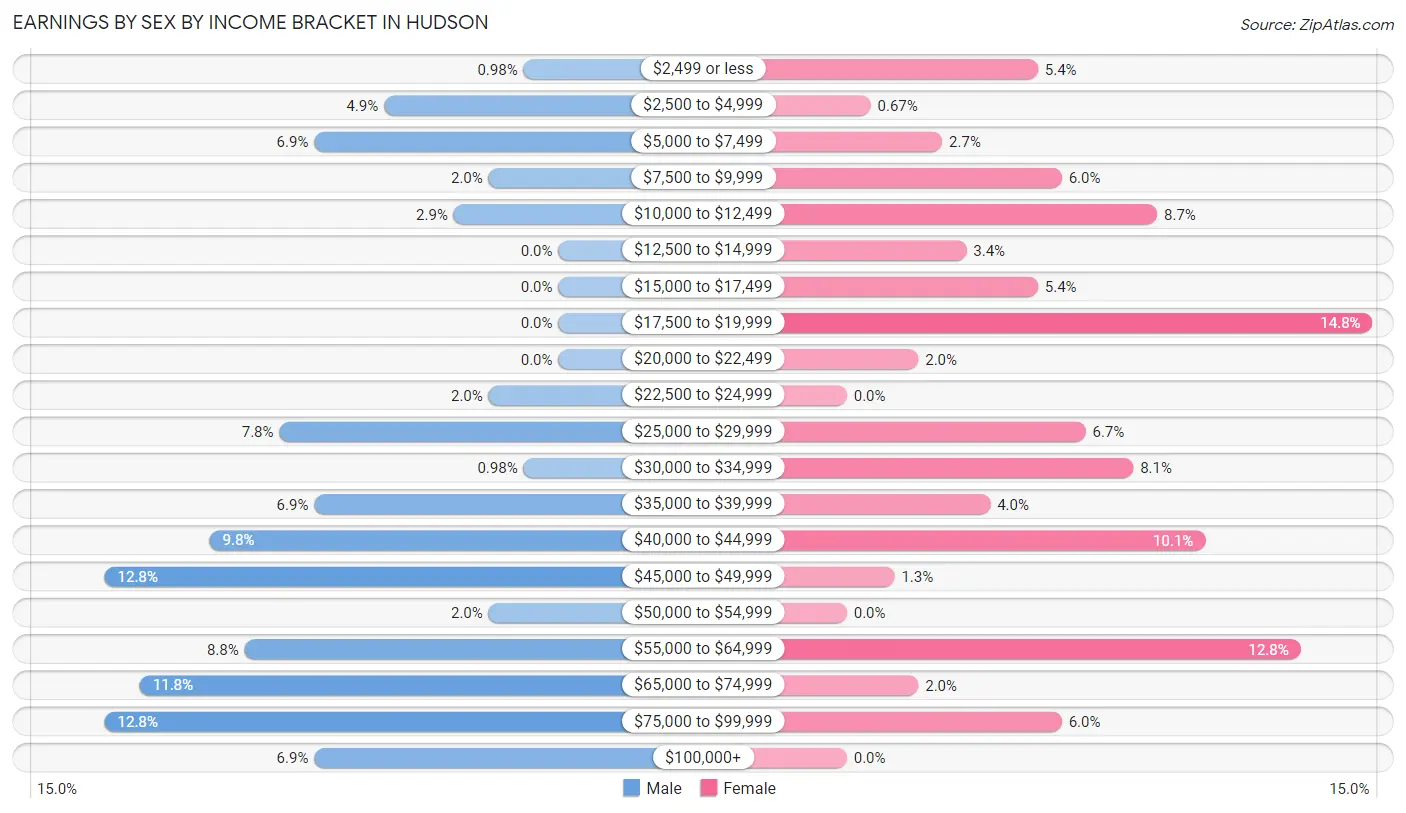
Earnings by Sex by Income Bracket in Hudson
The most common earnings brackets in Hudson are $45,000 to $49,999 for men (13 | 12.8%) and $17,500 to $19,999 for women (22 | 14.8%).
| Income | Male | Female |
| $2,499 or less | 1 (1.0%) | 8 (5.4%) |
| $2,500 to $4,999 | 5 (4.9%) | 1 (0.7%) |
| $5,000 to $7,499 | 7 (6.9%) | 4 (2.7%) |
| $7,500 to $9,999 | 2 (2.0%) | 9 (6.0%) |
| $10,000 to $12,499 | 3 (2.9%) | 13 (8.7%) |
| $12,500 to $14,999 | 0 (0.0%) | 5 (3.4%) |
| $15,000 to $17,499 | 0 (0.0%) | 8 (5.4%) |
| $17,500 to $19,999 | 0 (0.0%) | 22 (14.8%) |
| $20,000 to $22,499 | 0 (0.0%) | 3 (2.0%) |
| $22,500 to $24,999 | 2 (2.0%) | 0 (0.0%) |
| $25,000 to $29,999 | 8 (7.8%) | 10 (6.7%) |
| $30,000 to $34,999 | 1 (1.0%) | 12 (8.1%) |
| $35,000 to $39,999 | 7 (6.9%) | 6 (4.0%) |
| $40,000 to $44,999 | 10 (9.8%) | 15 (10.1%) |
| $45,000 to $49,999 | 13 (12.8%) | 2 (1.3%) |
| $50,000 to $54,999 | 2 (2.0%) | 0 (0.0%) |
| $55,000 to $64,999 | 9 (8.8%) | 19 (12.8%) |
| $65,000 to $74,999 | 12 (11.8%) | 3 (2.0%) |
| $75,000 to $99,999 | 13 (12.8%) | 9 (6.0%) |
| $100,000+ | 7 (6.9%) | 0 (0.0%) |
| Total | 102 (100.0%) | 149 (100.0%) |
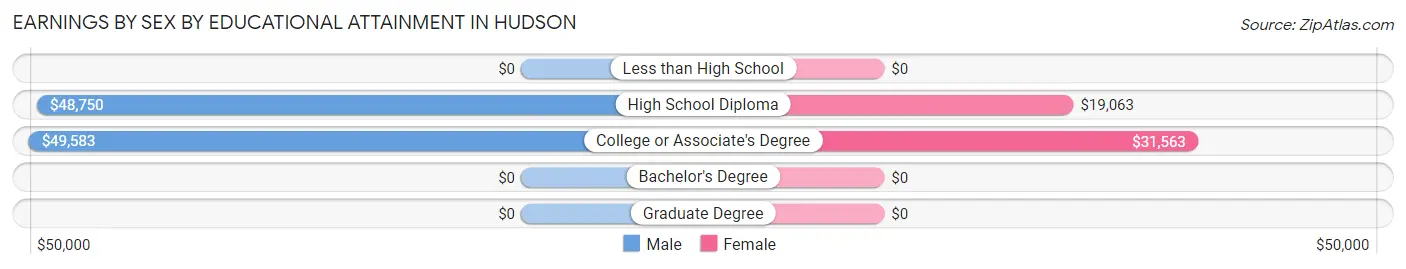
Earnings by Sex by Educational Attainment in Hudson
Average earnings in Hudson are $49,886 for men and $25,694 for women, a difference of 48.5%. Men with an educational attainment of college or associate's degree enjoy the highest average annual earnings of $49,583, while those with high school diploma education earn the least with $48,750. Women with an educational attainment of college or associate's degree earn the most with the average annual earnings of $31,563, while those with high school diploma education have the smallest earnings of $19,063.
| Educational Attainment | Male Income | Female Income |
| Less than High School | - | - |
| High School Diploma | $48,750 | $19,063 |
| College or Associate's Degree | $49,583 | $31,563 |
| Bachelor's Degree | - | - |
| Graduate Degree | - | - |
| Total | $49,886 | $25,694 |
Family Income in Hudson
Family Income Brackets in Hudson
According to the Hudson family income data, there are 30 families falling into the $75,000 to $99,999 income range, which is the most common income bracket and makes up 24.8% of all families.
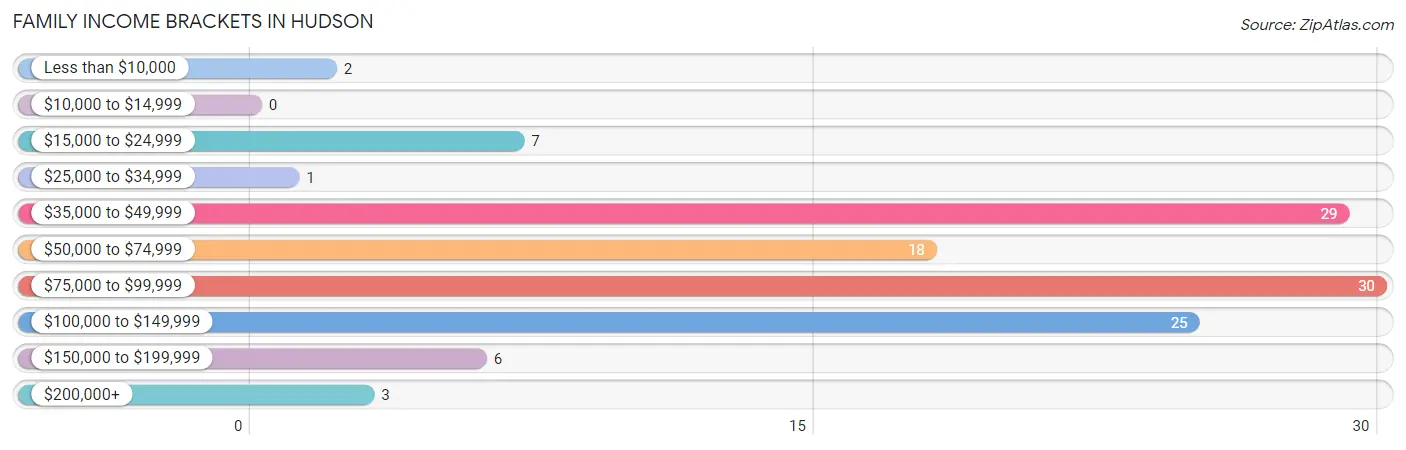
| Income Bracket | # Families | % Families |
| Less than $10,000 | 2 | 1.7% |
| $10,000 to $14,999 | 0 | 0.0% |
| $15,000 to $24,999 | 7 | 5.8% |
| $25,000 to $34,999 | 1 | 0.8% |
| $35,000 to $49,999 | 29 | 24.0% |
| $50,000 to $74,999 | 18 | 14.9% |
| $75,000 to $99,999 | 30 | 24.8% |
| $100,000 to $149,999 | 25 | 20.7% |
| $150,000 to $199,999 | 6 | 5.0% |
| $200,000+ | 3 | 2.5% |
Family Income by Famaliy Size in Hudson
5-person families (10 | 8.3%) account for the highest median family income in Hudson with $101,250 per family, while 2-person families (74 | 61.2%) have the highest median income of $33,125 per family member.
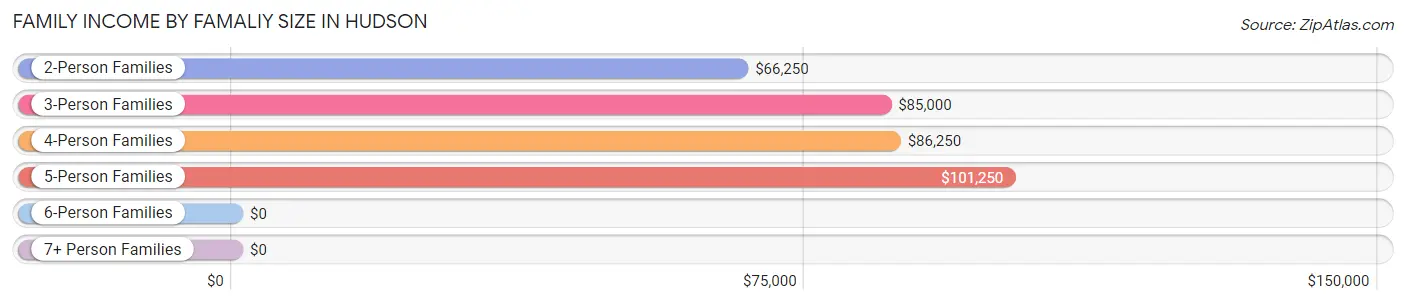
| Income Bracket | # Families | Median Income |
| 2-Person Families | 74 (61.2%) | $66,250 |
| 3-Person Families | 4 (3.3%) | $85,000 |
| 4-Person Families | 29 (24.0%) | $86,250 |
| 5-Person Families | 10 (8.3%) | $101,250 |
| 6-Person Families | 3 (2.5%) | $0 |
| 7+ Person Families | 1 (0.8%) | $0 |
| Total | 121 (100.0%) | $78,750 |
Family Income by Number of Earners in Hudson
The median family income in Hudson is $78,750, with families comprising 3+ earners (14) having the highest median family income of $123,333, while families with no earners (22) have the lowest median family income of $39,583, accounting for 11.6% and 18.2% of families, respectively.
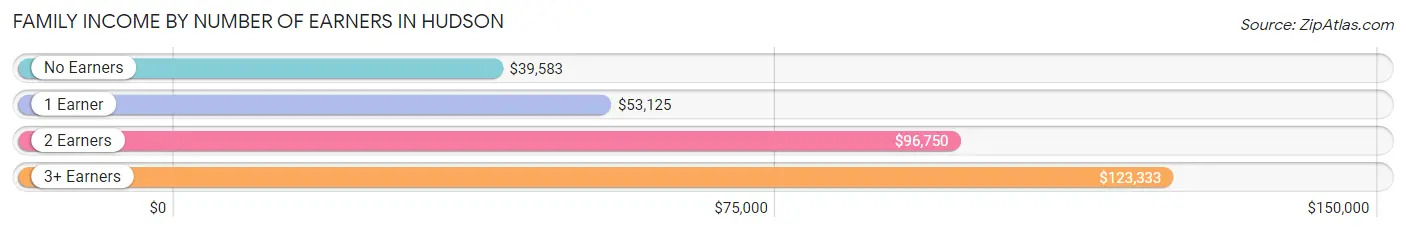
| Number of Earners | # Families | Median Income |
| No Earners | 22 (18.2%) | $39,583 |
| 1 Earner | 43 (35.5%) | $53,125 |
| 2 Earners | 42 (34.7%) | $96,750 |
| 3+ Earners | 14 (11.6%) | $123,333 |
| Total | 121 (100.0%) | $78,750 |
Household Income in Hudson
Household Income Brackets in Hudson
With 46 households falling in the category, the $35,000 to $49,999 income range is the most frequent in Hudson, accounting for 25.3% of all households. In contrast, only 3 households (1.7%) fall into the $200,000+ income bracket, making it the least populous group.
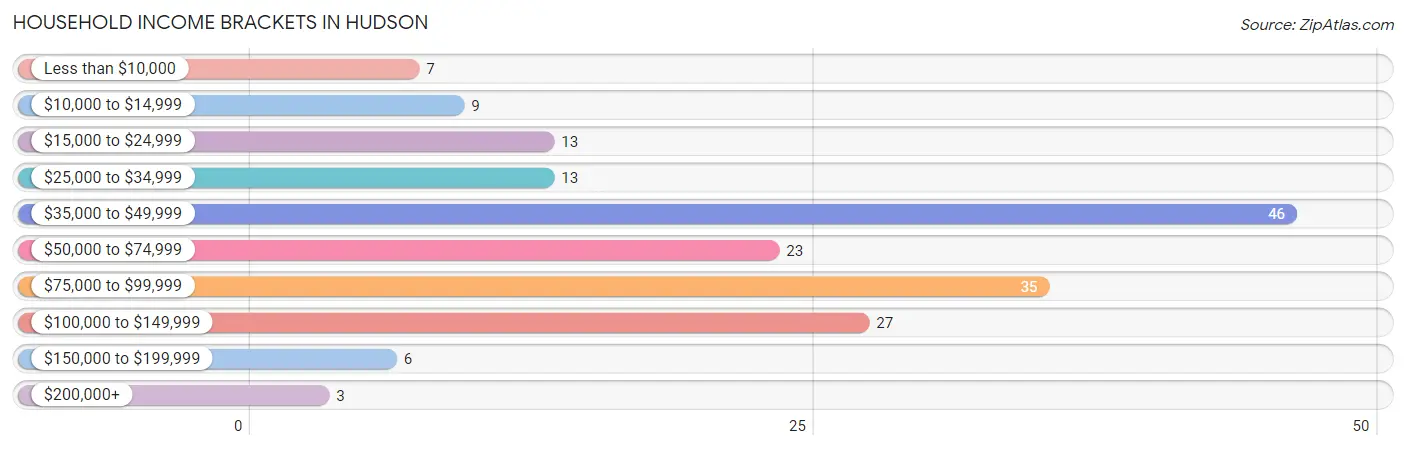
| Income Bracket | # Households | % Households |
| Less than $10,000 | 7 | 3.8% |
| $10,000 to $14,999 | 9 | 4.9% |
| $15,000 to $24,999 | 13 | 7.1% |
| $25,000 to $34,999 | 13 | 7.1% |
| $35,000 to $49,999 | 46 | 25.3% |
| $50,000 to $74,999 | 23 | 12.6% |
| $75,000 to $99,999 | 35 | 19.2% |
| $100,000 to $149,999 | 27 | 14.8% |
| $150,000 to $199,999 | 6 | 3.3% |
| $200,000+ | 3 | 1.6% |
Household Income by Householder Age in Hudson
The median household income in Hudson is $52,750, with the highest median household income of $88,500 found in the 45 to 64 years age bracket for the primary householder. A total of 66 households (36.3%) fall into this category. Meanwhile, the 15 to 24 years age bracket for the primary householder has the lowest median household income of $0, with 6 households (3.3%) in this group.
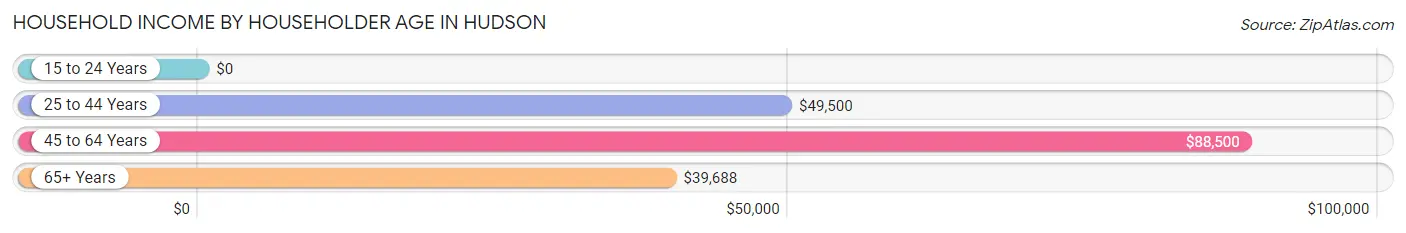
| Income Bracket | # Households | Median Income |
| 15 to 24 Years | 6 (3.3%) | $0 |
| 25 to 44 Years | 50 (27.5%) | $49,500 |
| 45 to 64 Years | 66 (36.3%) | $88,500 |
| 65+ Years | 60 (33.0%) | $39,688 |
| Total | 182 (100.0%) | $52,750 |
Poverty in Hudson
Income Below Poverty by Sex and Age in Hudson
With 6.4% poverty level for males and 6.6% for females among the residents of Hudson, 18 to 24 year old males and 55 to 64 year old females are the most vulnerable to poverty, with 5 males (21.7%) and 8 females (25.8%) in their respective age groups living below the poverty level.
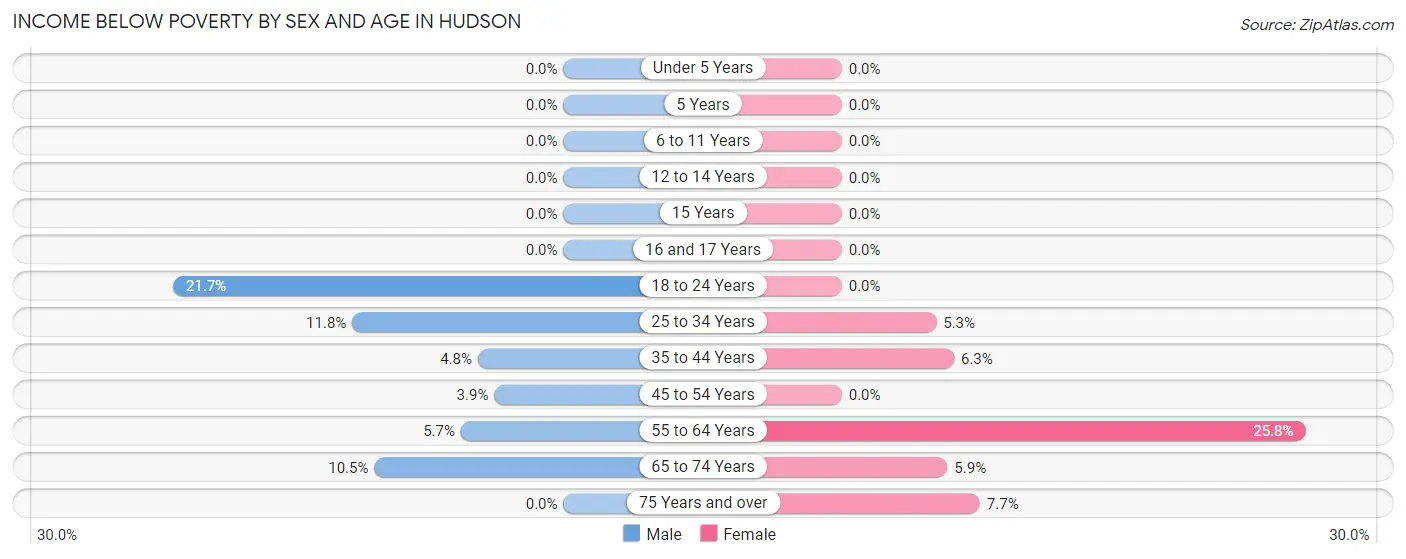
| Age Bracket | Male | Female |
| Under 5 Years | 0 (0.0%) | 0 (0.0%) |
| 5 Years | 0 (0.0%) | 0 (0.0%) |
| 6 to 11 Years | 0 (0.0%) | 0 (0.0%) |
| 12 to 14 Years | 0 (0.0%) | 0 (0.0%) |
| 15 Years | 0 (0.0%) | 0 (0.0%) |
| 16 and 17 Years | 0 (0.0%) | 0 (0.0%) |
| 18 to 24 Years | 5 (21.7%) | 0 (0.0%) |
| 25 to 34 Years | 2 (11.8%) | 3 (5.3%) |
| 35 to 44 Years | 1 (4.8%) | 2 (6.2%) |
| 45 to 54 Years | 1 (3.8%) | 0 (0.0%) |
| 55 to 64 Years | 2 (5.7%) | 8 (25.8%) |
| 65 to 74 Years | 2 (10.5%) | 2 (5.9%) |
| 75 Years and over | 0 (0.0%) | 2 (7.7%) |
| Total | 13 (6.4%) | 17 (6.6%) |
Income Above Poverty by Sex and Age in Hudson
According to the poverty statistics in Hudson, males aged under 5 years and females aged under 5 years are the age groups that are most secure financially, with 100.0% of males and 100.0% of females in these age groups living above the poverty line.
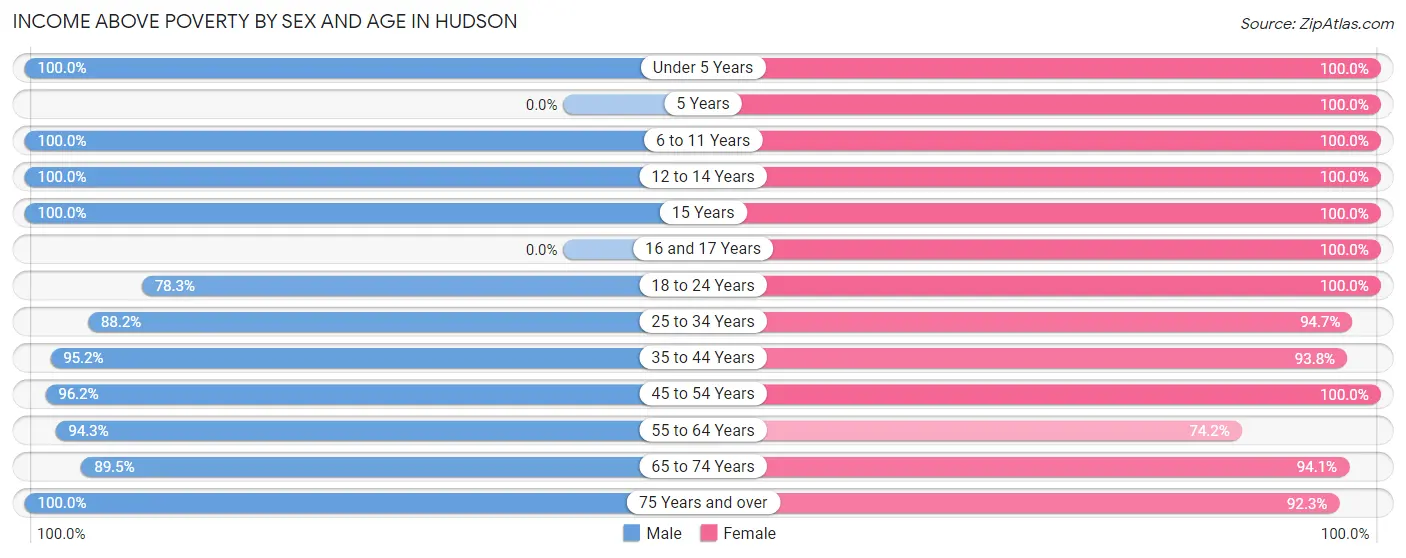
| Age Bracket | Male | Female |
| Under 5 Years | 1 (100.0%) | 3 (100.0%) |
| 5 Years | 0 (0.0%) | 7 (100.0%) |
| 6 to 11 Years | 21 (100.0%) | 5 (100.0%) |
| 12 to 14 Years | 10 (100.0%) | 17 (100.0%) |
| 15 Years | 5 (100.0%) | 1 (100.0%) |
| 16 and 17 Years | 0 (0.0%) | 6 (100.0%) |
| 18 to 24 Years | 18 (78.3%) | 12 (100.0%) |
| 25 to 34 Years | 15 (88.2%) | 54 (94.7%) |
| 35 to 44 Years | 20 (95.2%) | 30 (93.8%) |
| 45 to 54 Years | 25 (96.2%) | 27 (100.0%) |
| 55 to 64 Years | 33 (94.3%) | 23 (74.2%) |
| 65 to 74 Years | 17 (89.5%) | 32 (94.1%) |
| 75 Years and over | 24 (100.0%) | 24 (92.3%) |
| Total | 189 (93.6%) | 241 (93.4%) |
Income Below Poverty Among Married-Couple Families in Hudson
The poverty statistics for married-couple families in Hudson show that 3.6% or 4 of the total 111 families live below the poverty line. Families with no children have the highest poverty rate of 5.5%, comprising of 4 families. On the other hand, families with 1 or 2 children have the lowest poverty rate of 0.0%, which includes 0 families.
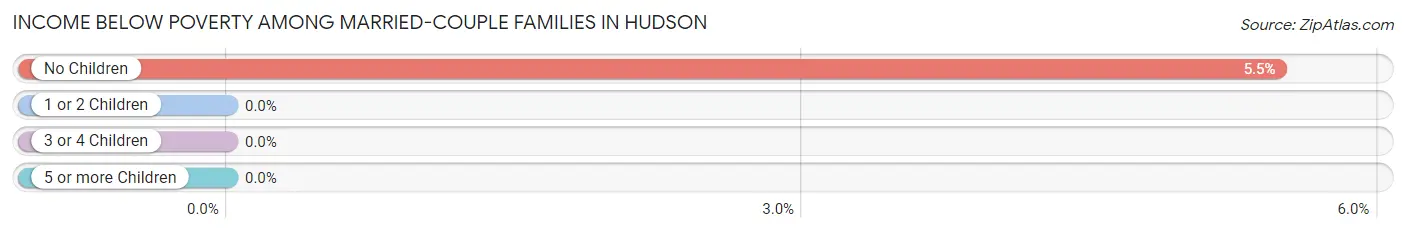
| Children | Above Poverty | Below Poverty |
| No Children | 69 (94.5%) | 4 (5.5%) |
| 1 or 2 Children | 35 (100.0%) | 0 (0.0%) |
| 3 or 4 Children | 3 (100.0%) | 0 (0.0%) |
| 5 or more Children | 0 (0.0%) | 0 (0.0%) |
| Total | 107 (96.4%) | 4 (3.6%) |
Income Below Poverty Among Single-Parent Households in Hudson
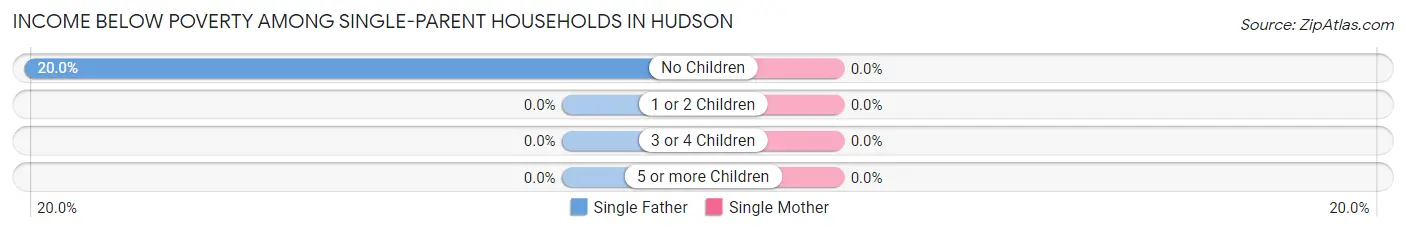
| Children | Single Father | Single Mother |
| No Children | 1 (20.0%) | 0 (0.0%) |
| 1 or 2 Children | 0 (0.0%) | 0 (0.0%) |
| 3 or 4 Children | 0 (0.0%) | 0 (0.0%) |
| 5 or more Children | 0 (0.0%) | 0 (0.0%) |
| Total | 1 (20.0%) | 0 (0.0%) |
Income Below Poverty Among Married-Couple vs Single-Parent Households in Hudson
The poverty data for Hudson shows that 4 of the married-couple family households (3.6%) and 1 of the single-parent households (10.0%) are living below the poverty level. Within the married-couple family households, those with no children have the highest poverty rate, with 4 households (5.5%) falling below the poverty line. Among the single-parent households, those with no children have the highest poverty rate, with 1 household (20.0%) living below poverty.
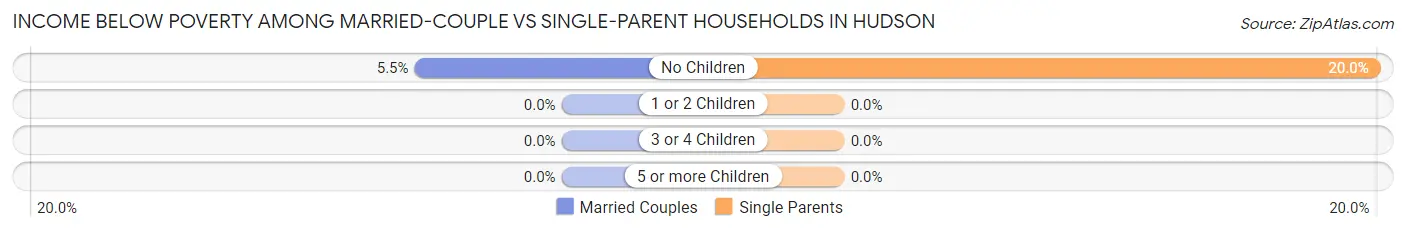
| Children | Married-Couple Families | Single-Parent Households |
| No Children | 4 (5.5%) | 1 (20.0%) |
| 1 or 2 Children | 0 (0.0%) | 0 (0.0%) |
| 3 or 4 Children | 0 (0.0%) | 0 (0.0%) |
| 5 or more Children | 0 (0.0%) | 0 (0.0%) |
| Total | 4 (3.6%) | 1 (10.0%) |
Race in Hudson
The most populous races in Hudson are White / Caucasian (395 | 85.3%), Hispanic or Latino (59 | 12.7%), and Two or more Races (39 | 8.4%).
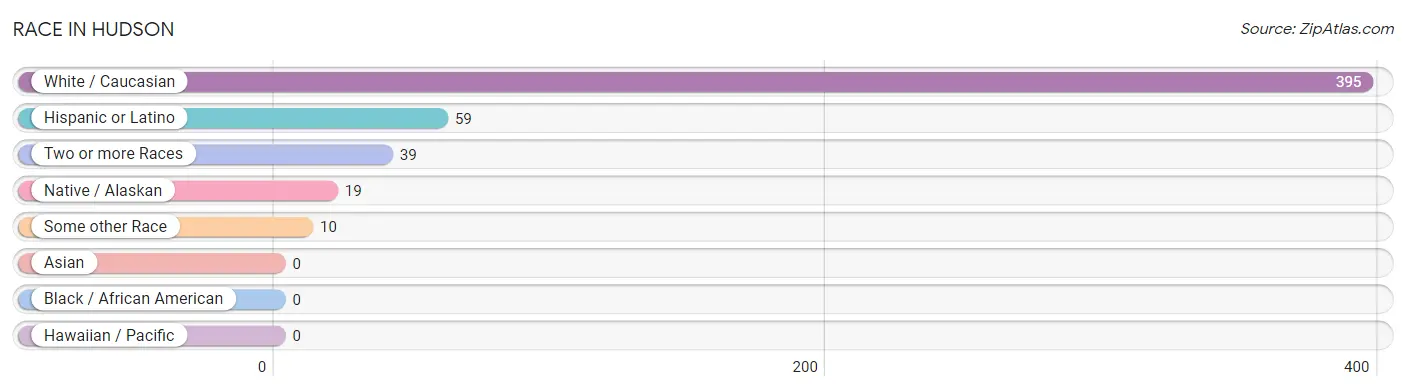
| Race | # Population | % Population |
| Asian | 0 | 0.0% |
| Black / African American | 0 | 0.0% |
| Hawaiian / Pacific | 0 | 0.0% |
| Hispanic or Latino | 59 | 12.7% |
| Native / Alaskan | 19 | 4.1% |
| White / Caucasian | 395 | 85.3% |
| Two or more Races | 39 | 8.4% |
| Some other Race | 10 | 2.2% |
| Total | 463 | 100.0% |
Ancestry in Hudson
The most populous ancestries reported in Hudson are German (102 | 22.0%), Irish (89 | 19.2%), English (60 | 13.0%), Mexican (44 | 9.5%), and Finnish (23 | 5.0%), together accounting for 68.7% of all Hudson residents.
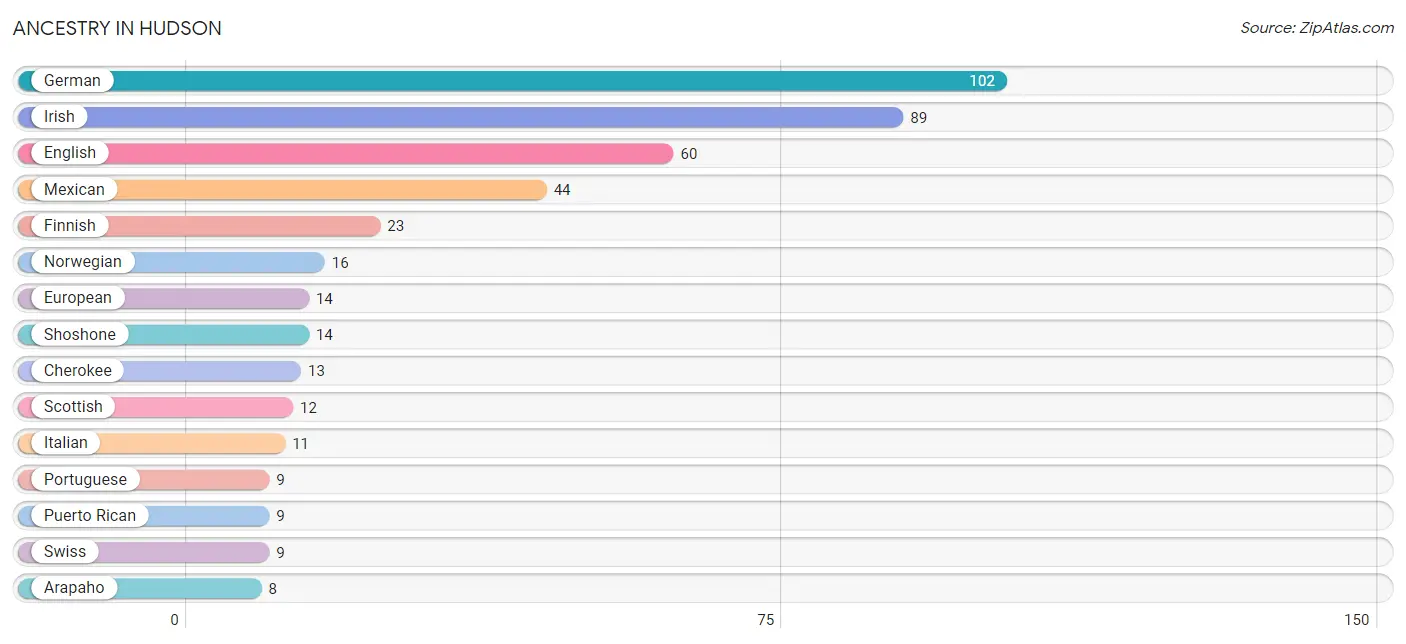
| Ancestry | # Population | % Population |
| American | 5 | 1.1% |
| Arapaho | 8 | 1.7% |
| Belgian | 2 | 0.4% |
| British | 2 | 0.4% |
| Cherokee | 13 | 2.8% |
| Czech | 1 | 0.2% |
| Danish | 2 | 0.4% |
| Dutch | 2 | 0.4% |
| Eastern European | 2 | 0.4% |
| English | 60 | 13.0% |
| European | 14 | 3.0% |
| Finnish | 23 | 5.0% |
| French | 6 | 1.3% |
| French Canadian | 1 | 0.2% |
| German | 102 | 22.0% |
| Hungarian | 4 | 0.9% |
| Irish | 89 | 19.2% |
| Italian | 11 | 2.4% |
| Mexican | 44 | 9.5% |
| Norwegian | 16 | 3.5% |
| Polish | 1 | 0.2% |
| Portuguese | 9 | 1.9% |
| Puerto Rican | 9 | 1.9% |
| Romanian | 3 | 0.6% |
| Scandinavian | 3 | 0.6% |
| Scotch-Irish | 2 | 0.4% |
| Scottish | 12 | 2.6% |
| Shoshone | 14 | 3.0% |
| Sioux | 4 | 0.9% |
| Slavic | 2 | 0.4% |
| Swedish | 4 | 0.9% |
| Swiss | 9 | 1.9% |
| Welsh | 7 | 1.5% | View All 33 Rows |
Immigrants in Hudson

| Immigration Origin | # Population | % Population | View All 0 Rows |
Sex and Age in Hudson
Sex and Age in Hudson
The most populous age groups in Hudson are 60 to 64 Years (30 | 14.6%) for men and 25 to 29 Years (50 | 19.4%) for women.
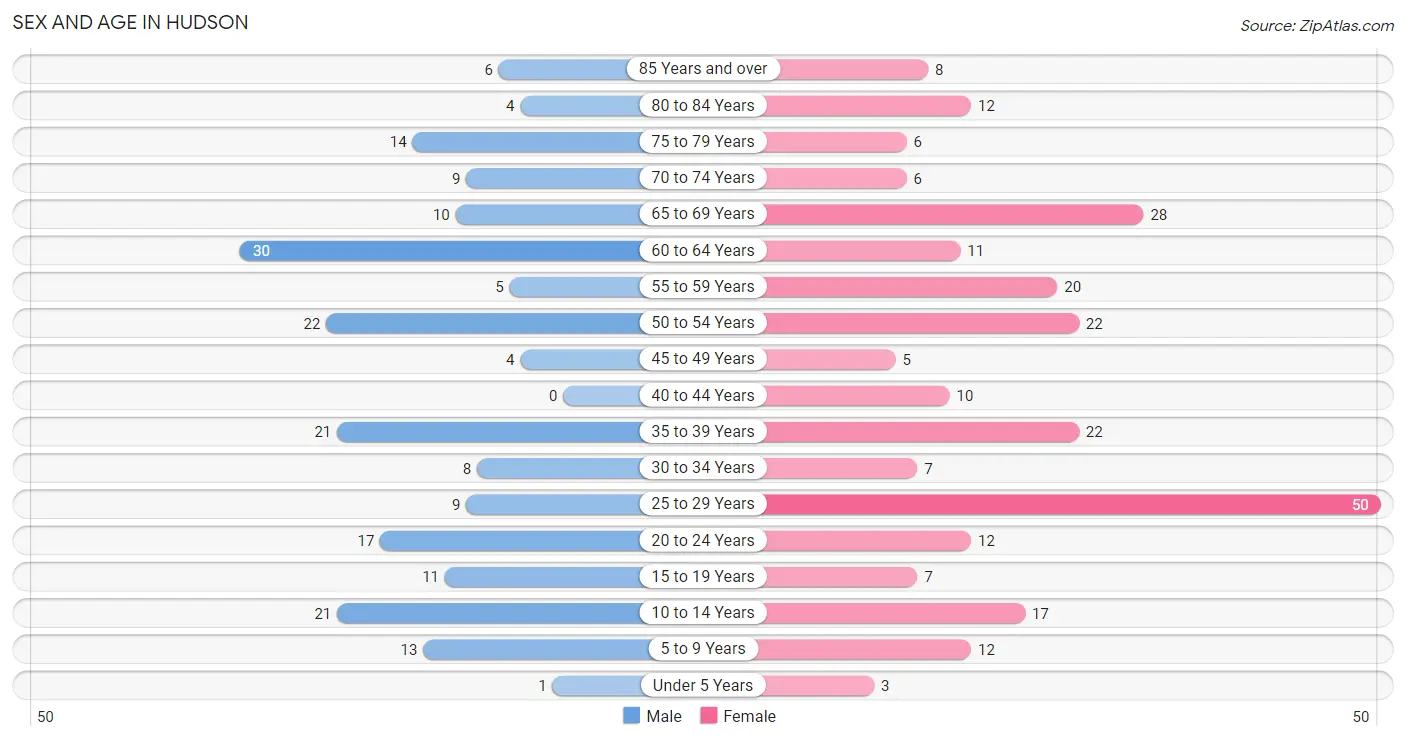
| Age Bracket | Male | Female |
| Under 5 Years | 1 (0.5%) | 3 (1.2%) |
| 5 to 9 Years | 13 (6.3%) | 12 (4.6%) |
| 10 to 14 Years | 21 (10.2%) | 17 (6.6%) |
| 15 to 19 Years | 11 (5.4%) | 7 (2.7%) |
| 20 to 24 Years | 17 (8.3%) | 12 (4.6%) |
| 25 to 29 Years | 9 (4.4%) | 50 (19.4%) |
| 30 to 34 Years | 8 (3.9%) | 7 (2.7%) |
| 35 to 39 Years | 21 (10.2%) | 22 (8.5%) |
| 40 to 44 Years | 0 (0.0%) | 10 (3.9%) |
| 45 to 49 Years | 4 (1.9%) | 5 (1.9%) |
| 50 to 54 Years | 22 (10.7%) | 22 (8.5%) |
| 55 to 59 Years | 5 (2.4%) | 20 (7.7%) |
| 60 to 64 Years | 30 (14.6%) | 11 (4.3%) |
| 65 to 69 Years | 10 (4.9%) | 28 (10.8%) |
| 70 to 74 Years | 9 (4.4%) | 6 (2.3%) |
| 75 to 79 Years | 14 (6.8%) | 6 (2.3%) |
| 80 to 84 Years | 4 (1.9%) | 12 (4.6%) |
| 85 Years and over | 6 (2.9%) | 8 (3.1%) |
| Total | 205 (100.0%) | 258 (100.0%) |
Families and Households in Hudson
Median Family Size in Hudson
The median family size in Hudson is 3.20 persons per family, with single male/father families (5 | 4.1%) accounting for the largest median family size of 4.4 persons per family. On the other hand, married-couple families (111 | 91.7%) represent the smallest median family size with 3.14 persons per family.
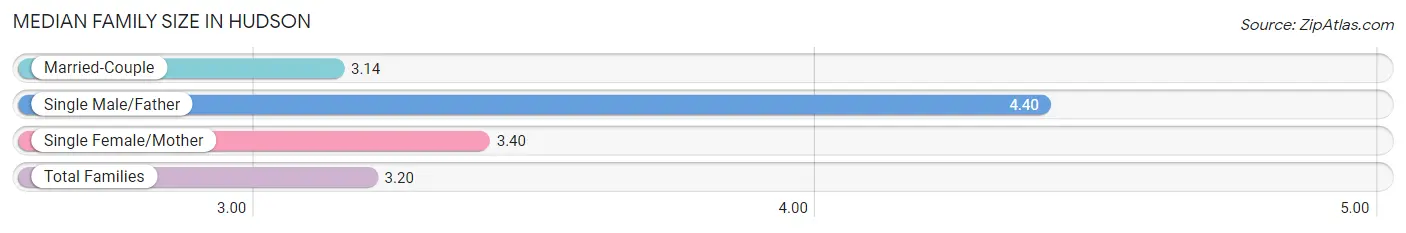
| Family Type | # Families | Family Size |
| Married-Couple | 111 (91.7%) | 3.14 |
| Single Male/Father | 5 (4.1%) | 4.40 |
| Single Female/Mother | 5 (4.1%) | 3.40 |
| Total Families | 121 (100.0%) | 3.20 |
Median Household Size in Hudson
The median household size in Hudson is 2.54 persons per household, with single male/father households (5 | 2.8%) accounting for the largest median household size of 5 persons per household. non-family households (61 | 33.5%) represent the smallest median household size with 1.15 persons per household.
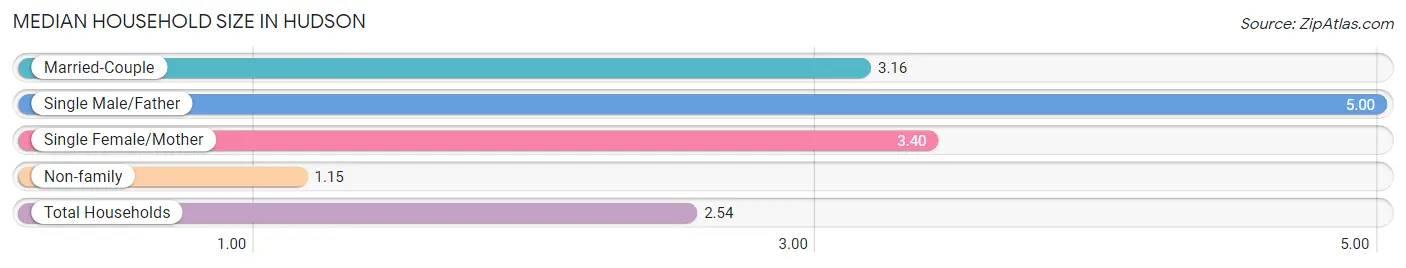
| Household Type | # Households | Household Size |
| Married-Couple | 111 (61.0%) | 3.16 |
| Single Male/Father | 5 (2.8%) | 5.00 |
| Single Female/Mother | 5 (2.8%) | 3.40 |
| Non-family | 61 (33.5%) | 1.15 |
| Total Households | 182 (100.0%) | 2.54 |
Household Size by Marriage Status in Hudson
Out of a total of 182 households in Hudson, 121 (66.5%) are family households, while 61 (33.5%) are nonfamily households. The most numerous type of family households are 2-person households, comprising 74, and the most common type of nonfamily households are 1-person households, comprising 56.
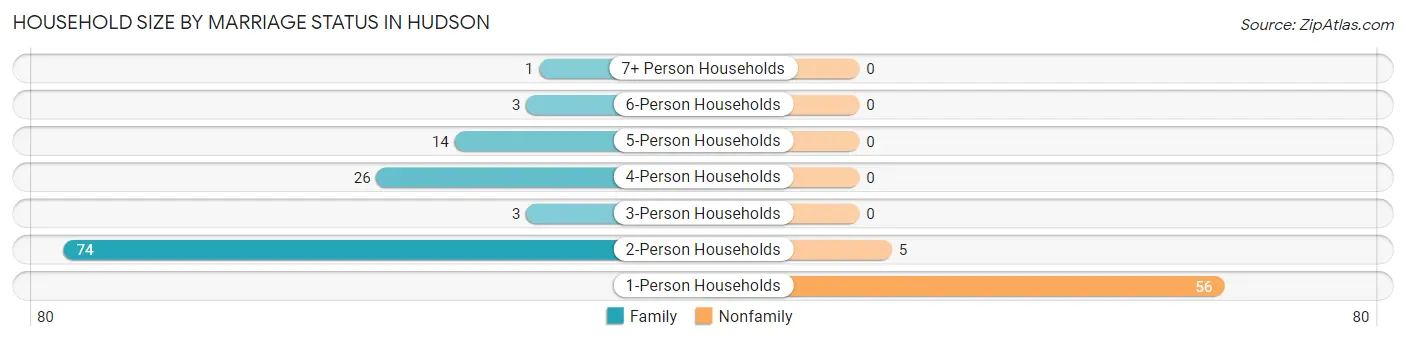
| Household Size | Family Households | Nonfamily Households |
| 1-Person Households | - | 56 (30.8%) |
| 2-Person Households | 74 (40.7%) | 5 (2.8%) |
| 3-Person Households | 3 (1.7%) | 0 (0.0%) |
| 4-Person Households | 26 (14.3%) | 0 (0.0%) |
| 5-Person Households | 14 (7.7%) | 0 (0.0%) |
| 6-Person Households | 3 (1.7%) | 0 (0.0%) |
| 7+ Person Households | 1 (0.5%) | 0 (0.0%) |
| Total | 121 (66.5%) | 61 (33.5%) |
Female Fertility in Hudson
Fertility by Age in Hudson
| Age Bracket | Women with Births | Births / 1,000 Women |
| 15 to 19 years | 0 (0.0%) | 0.0 |
| 20 to 34 years | 0 (0.0%) | 0.0 |
| 35 to 50 years | 0 (0.0%) | 0.0 |
| Total | 0 (0.0%) | 0.0 |
Fertility by Age by Marriage Status in Hudson
| Age Bracket | Married | Unmarried |
| 15 to 19 years | 0 (0.0%) | 0 (0.0%) |
| 20 to 34 years | 0 (0.0%) | 0 (0.0%) |
| 35 to 50 years | 0 (0.0%) | 0 (0.0%) |
| Total | 0 (0.0%) | 0 (0.0%) |
Fertility by Education in Hudson
| Educational Attainment | Women with Births | Births / 1,000 Women |
| Less than High School | 0 (0.0%) | 0.0 |
| High School Diploma | 0 (0.0%) | 0.0 |
| College or Associate's Degree | 0 (0.0%) | 0.0 |
| Bachelor's Degree | 0 (0.0%) | 0.0 |
| Graduate Degree | 0 (0.0%) | 0.0 |
| Total | 0 (0.0%) | 0.0 |
Fertility by Education by Marriage Status in Hudson
| Educational Attainment | Married | Unmarried |
| Less than High School | 0 (0.0%) | 0 (0.0%) |
| High School Diploma | 0 (0.0%) | 0 (0.0%) |
| College or Associate's Degree | 0 (0.0%) | 0 (0.0%) |
| Bachelor's Degree | 0 (0.0%) | 0 (0.0%) |
| Graduate Degree | 0 (0.0%) | 0 (0.0%) |
| Total | 0 (0.0%) | 0 (0.0%) |
Employment Characteristics in Hudson
Employment by Class of Employer in Hudson
Among the 224 employed individuals in Hudson, private company employees (147 | 65.6%), local government employees (25 | 11.2%), and not-for-profit organizations (19 | 8.5%) make up the most common classes of employment.
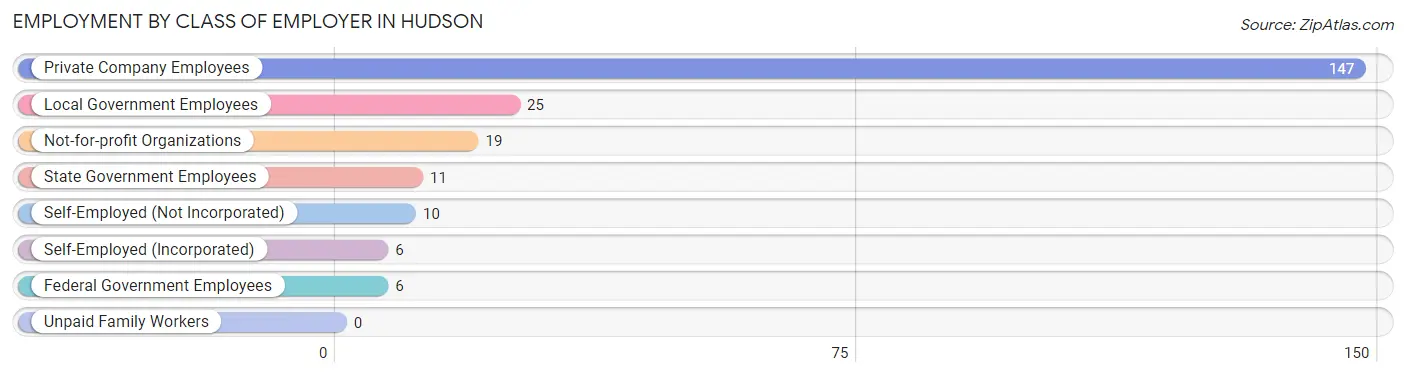
| Employer Class | # Employees | % Employees |
| Private Company Employees | 147 | 65.6% |
| Self-Employed (Incorporated) | 6 | 2.7% |
| Self-Employed (Not Incorporated) | 10 | 4.5% |
| Not-for-profit Organizations | 19 | 8.5% |
| Local Government Employees | 25 | 11.2% |
| State Government Employees | 11 | 4.9% |
| Federal Government Employees | 6 | 2.7% |
| Unpaid Family Workers | 0 | 0.0% |
| Total | 224 | 100.0% |
Employment Status by Age in Hudson
According to the labor force statistics for Hudson, out of the total population over 16 years of age (390), 62.3% or 243 individuals are in the labor force, with 4.6% or 11 of them unemployed. The age group with the highest labor force participation rate is 35 to 44 years, with 100.0% or 53 individuals in the labor force. Within the labor force, the 45 to 54 years age range has the highest percentage of unemployed individuals, with 11.3% or 6 of them being unemployed.
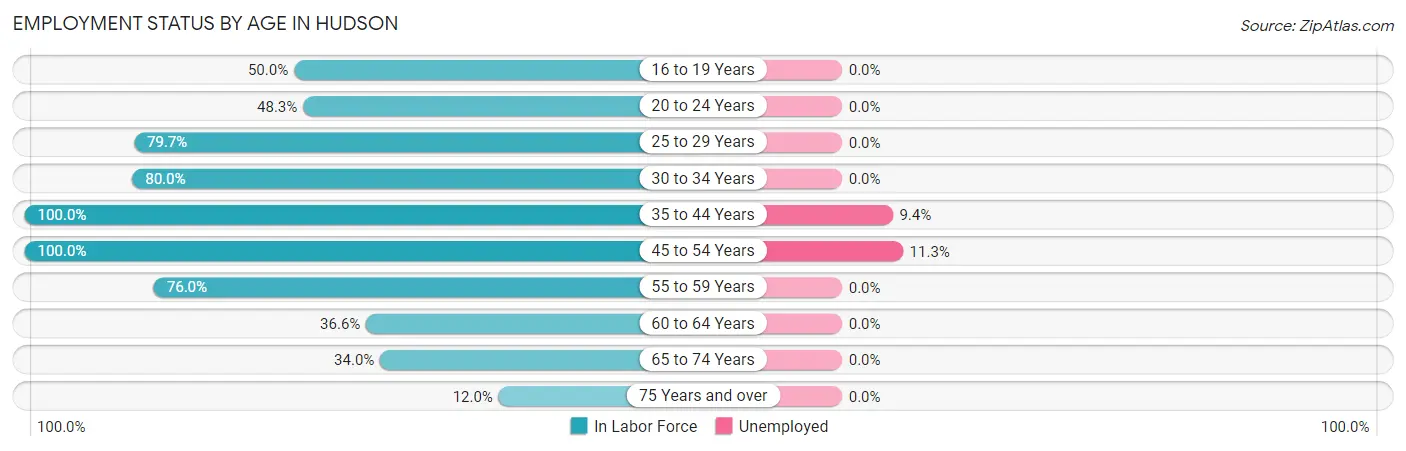
| Age Bracket | In Labor Force | Unemployed |
| 16 to 19 Years | 6 (50.0%) | 0 (0.0%) |
| 20 to 24 Years | 14 (48.3%) | 0 (0.0%) |
| 25 to 29 Years | 47 (79.7%) | 0 (0.0%) |
| 30 to 34 Years | 12 (80.0%) | 0 (0.0%) |
| 35 to 44 Years | 53 (100.0%) | 5 (9.4%) |
| 45 to 54 Years | 53 (100.0%) | 6 (11.3%) |
| 55 to 59 Years | 19 (76.0%) | 0 (0.0%) |
| 60 to 64 Years | 15 (36.6%) | 0 (0.0%) |
| 65 to 74 Years | 18 (34.0%) | 0 (0.0%) |
| 75 Years and over | 6 (12.0%) | 0 (0.0%) |
| Total | 243 (62.3%) | 11 (4.6%) |
Employment Status by Educational Attainment in Hudson
According to labor force statistics for Hudson, 80.9% of individuals (199) out of the total population between 25 and 64 years of age (246) are in the labor force, with 5.6% or 11 of them being unemployed. The group with the highest labor force participation rate are those with the educational attainment of high school diploma, with 86.0% or 86 individuals in the labor force. Within the labor force, individuals with high school diploma education have the highest percentage of unemployment, with 11.6% or 10 of them being unemployed.
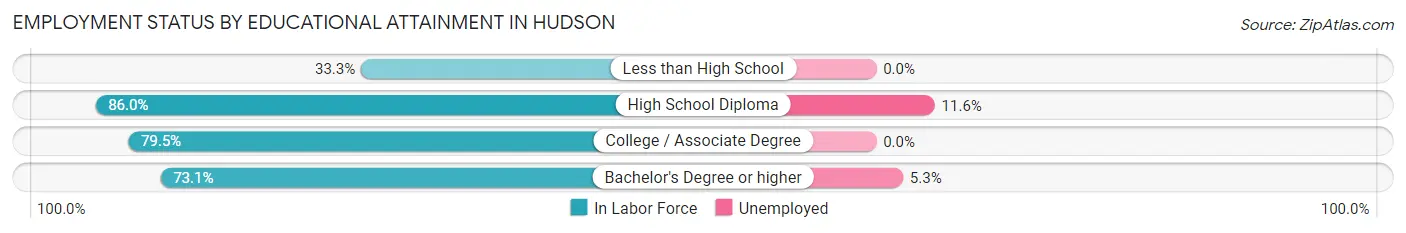
| Educational Attainment | In Labor Force | Unemployed |
| Less than High School | 1 (33.3%) | 0 (0.0%) |
| High School Diploma | 86 (86.0%) | 12 (11.6%) |
| College / Associate Degree | 93 (79.5%) | 0 (0.0%) |
| Bachelor's Degree or higher | 19 (73.1%) | 1 (5.3%) |
| Total | 199 (80.9%) | 14 (5.6%) |
Employment Occupations by Sex in Hudson
Management, Business, Science and Arts Occupations
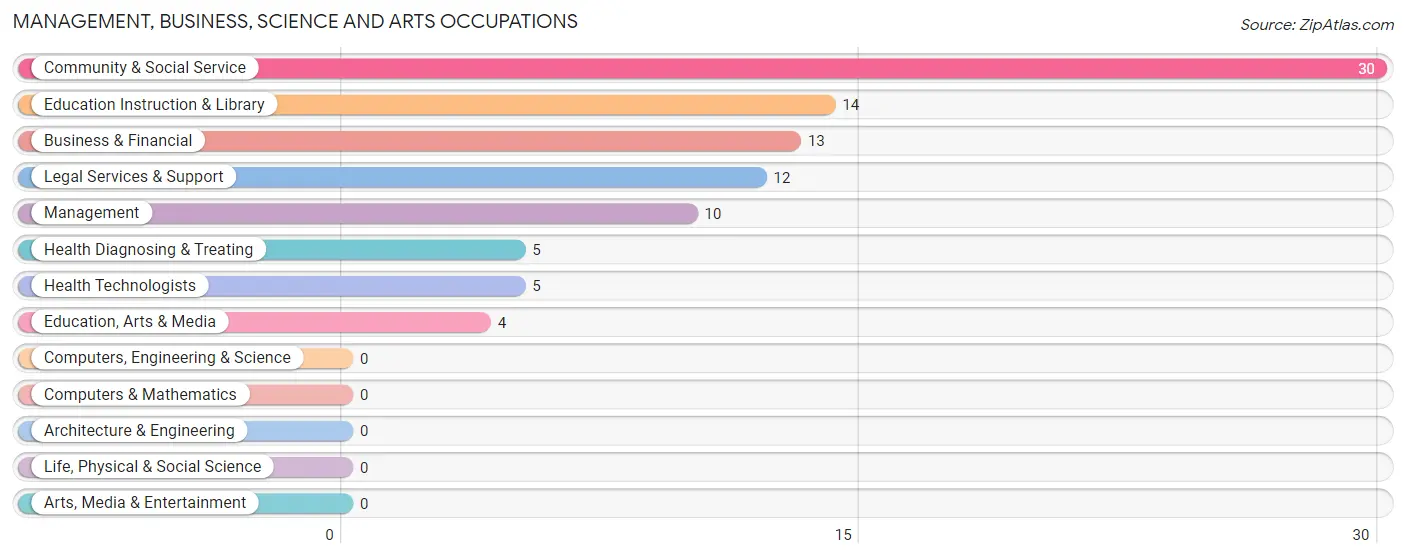
The most common Management, Business, Science and Arts occupations in Hudson are Community & Social Service (30 | 13.0%), Education Instruction & Library (14 | 6.1%), Business & Financial (13 | 5.7%), Legal Services & Support (12 | 5.2%), and Management (10 | 4.3%).
Management, Business, Science and Arts Occupations by Sex
Within the Management, Business, Science and Arts occupations in Hudson, the most male-oriented occupations are Education, Arts & Media (100.0%), Management (40.0%), and Community & Social Service (40.0%), while the most female-oriented occupations are Health Diagnosing & Treating (100.0%), Health Technologists (100.0%), and Business & Financial (84.6%).
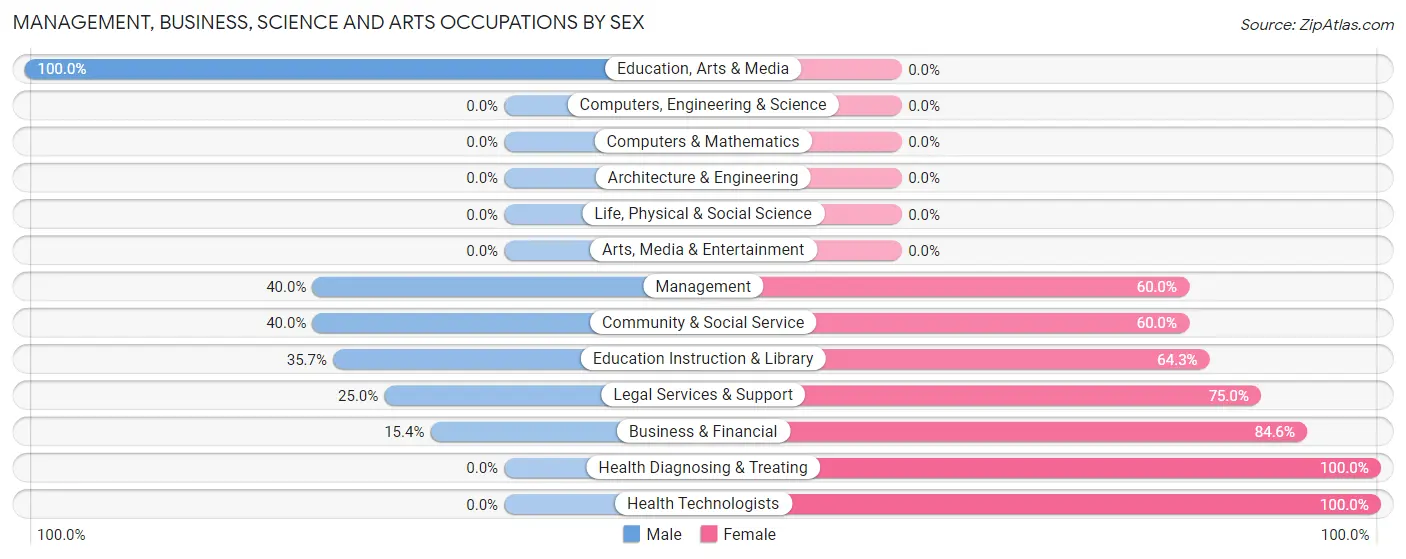
| Occupation | Male | Female |
| Management | 4 (40.0%) | 6 (60.0%) |
| Business & Financial | 2 (15.4%) | 11 (84.6%) |
| Computers, Engineering & Science | 0 (0.0%) | 0 (0.0%) |
| Computers & Mathematics | 0 (0.0%) | 0 (0.0%) |
| Architecture & Engineering | 0 (0.0%) | 0 (0.0%) |
| Life, Physical & Social Science | 0 (0.0%) | 0 (0.0%) |
| Community & Social Service | 12 (40.0%) | 18 (60.0%) |
| Education, Arts & Media | 4 (100.0%) | 0 (0.0%) |
| Legal Services & Support | 3 (25.0%) | 9 (75.0%) |
| Education Instruction & Library | 5 (35.7%) | 9 (64.3%) |
| Arts, Media & Entertainment | 0 (0.0%) | 0 (0.0%) |
| Health Diagnosing & Treating | 0 (0.0%) | 5 (100.0%) |
| Health Technologists | 0 (0.0%) | 5 (100.0%) |
| Total (Category) | 18 (31.0%) | 40 (69.0%) |
| Total (Overall) | 91 (39.6%) | 139 (60.4%) |
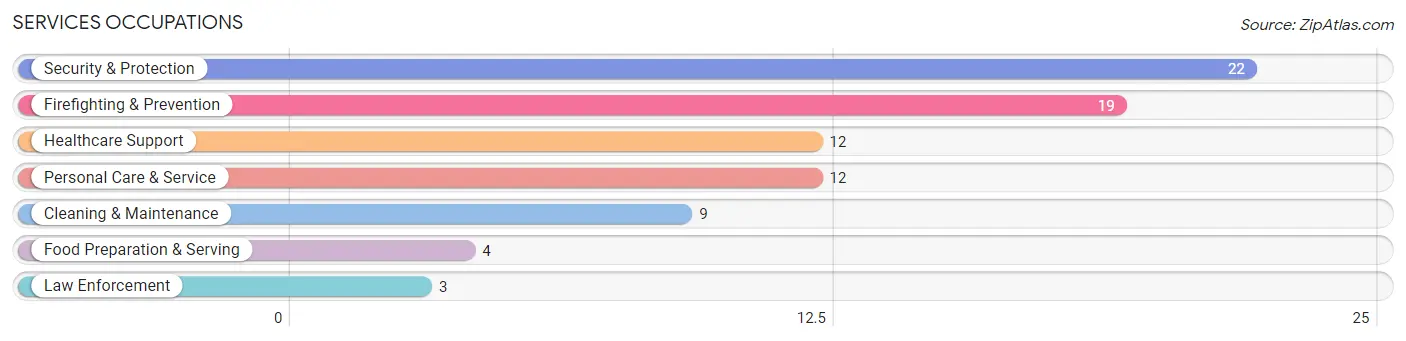
Services Occupations
The most common Services occupations in Hudson are Security & Protection (22 | 9.6%), Firefighting & Prevention (19 | 8.3%), Healthcare Support (12 | 5.2%), Personal Care & Service (12 | 5.2%), and Cleaning & Maintenance (9 | 3.9%).
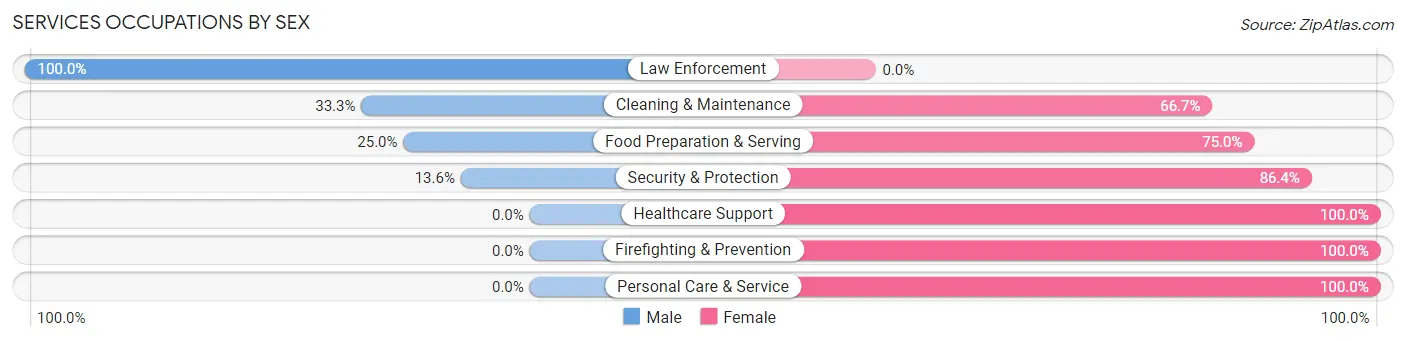
Services Occupations by Sex
Within the Services occupations in Hudson, the most male-oriented occupations are Law Enforcement (100.0%), Cleaning & Maintenance (33.3%), and Food Preparation & Serving (25.0%), while the most female-oriented occupations are Healthcare Support (100.0%), Firefighting & Prevention (100.0%), and Personal Care & Service (100.0%).
| Occupation | Male | Female |
| Healthcare Support | 0 (0.0%) | 12 (100.0%) |
| Security & Protection | 3 (13.6%) | 19 (86.4%) |
| Firefighting & Prevention | 0 (0.0%) | 19 (100.0%) |
| Law Enforcement | 3 (100.0%) | 0 (0.0%) |
| Food Preparation & Serving | 1 (25.0%) | 3 (75.0%) |
| Cleaning & Maintenance | 3 (33.3%) | 6 (66.7%) |
| Personal Care & Service | 0 (0.0%) | 12 (100.0%) |
| Total (Category) | 7 (11.9%) | 52 (88.1%) |
| Total (Overall) | 91 (39.6%) | 139 (60.4%) |
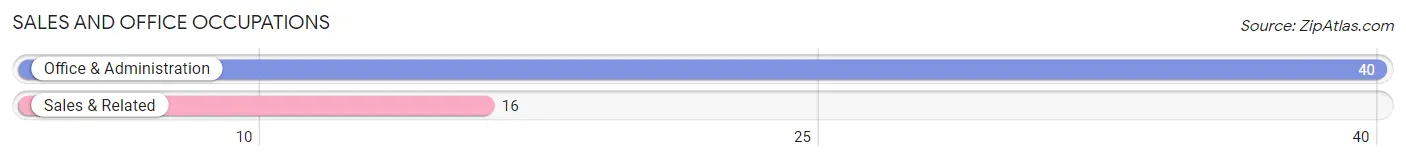
Sales and Office Occupations
The most common Sales and Office occupations in Hudson are Office & Administration (40 | 17.4%), and Sales & Related (16 | 7.0%).
Sales and Office Occupations by Sex
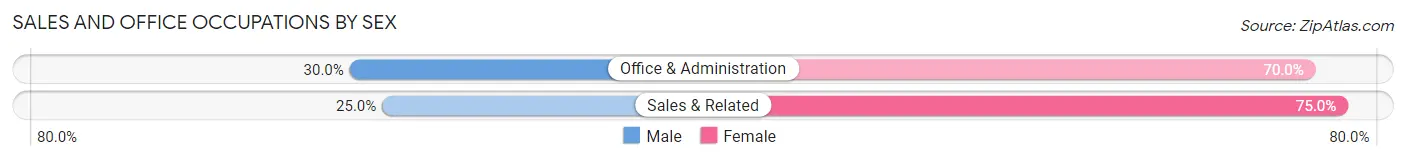
| Occupation | Male | Female |
| Sales & Related | 4 (25.0%) | 12 (75.0%) |
| Office & Administration | 12 (30.0%) | 28 (70.0%) |
| Total (Category) | 16 (28.6%) | 40 (71.4%) |
| Total (Overall) | 91 (39.6%) | 139 (60.4%) |
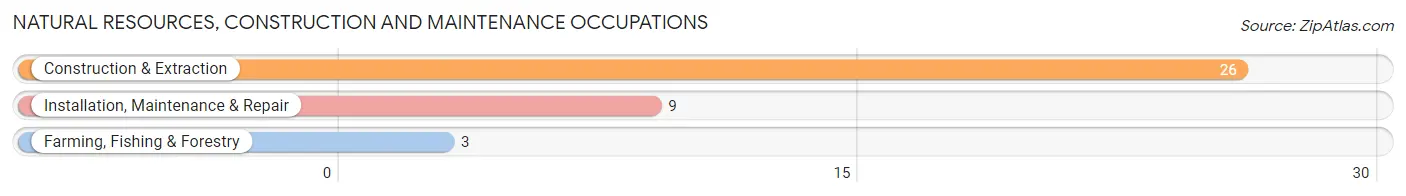
Natural Resources, Construction and Maintenance Occupations
The most common Natural Resources, Construction and Maintenance occupations in Hudson are Construction & Extraction (26 | 11.3%), Installation, Maintenance & Repair (9 | 3.9%), and Farming, Fishing & Forestry (3 | 1.3%).
Natural Resources, Construction and Maintenance Occupations by Sex
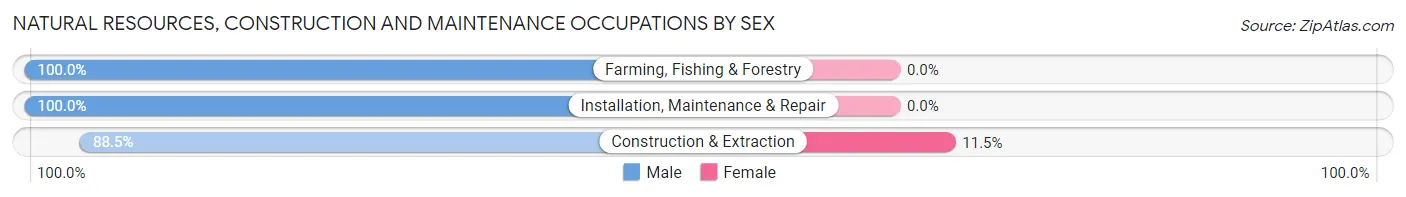
| Occupation | Male | Female |
| Farming, Fishing & Forestry | 3 (100.0%) | 0 (0.0%) |
| Construction & Extraction | 23 (88.5%) | 3 (11.5%) |
| Installation, Maintenance & Repair | 9 (100.0%) | 0 (0.0%) |
| Total (Category) | 35 (92.1%) | 3 (7.9%) |
| Total (Overall) | 91 (39.6%) | 139 (60.4%) |
Production, Transportation and Moving Occupations
The most common Production, Transportation and Moving occupations in Hudson are Transportation (13 | 5.7%), Material Moving (4 | 1.7%), and Production (2 | 0.9%).
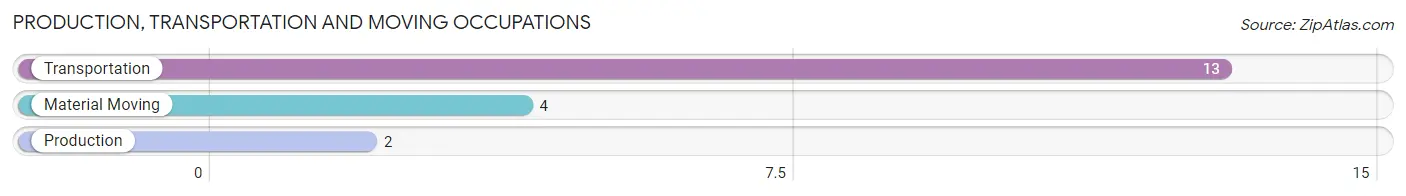
Production, Transportation and Moving Occupations by Sex
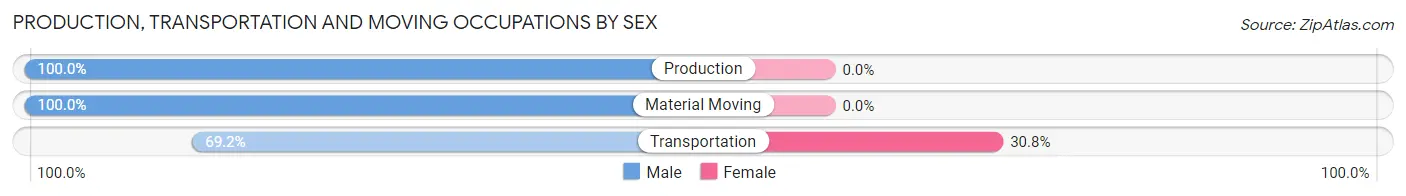
| Occupation | Male | Female |
| Production | 2 (100.0%) | 0 (0.0%) |
| Transportation | 9 (69.2%) | 4 (30.8%) |
| Material Moving | 4 (100.0%) | 0 (0.0%) |
| Total (Category) | 15 (78.9%) | 4 (21.0%) |
| Total (Overall) | 91 (39.6%) | 139 (60.4%) |
Employment Industries by Sex in Hudson
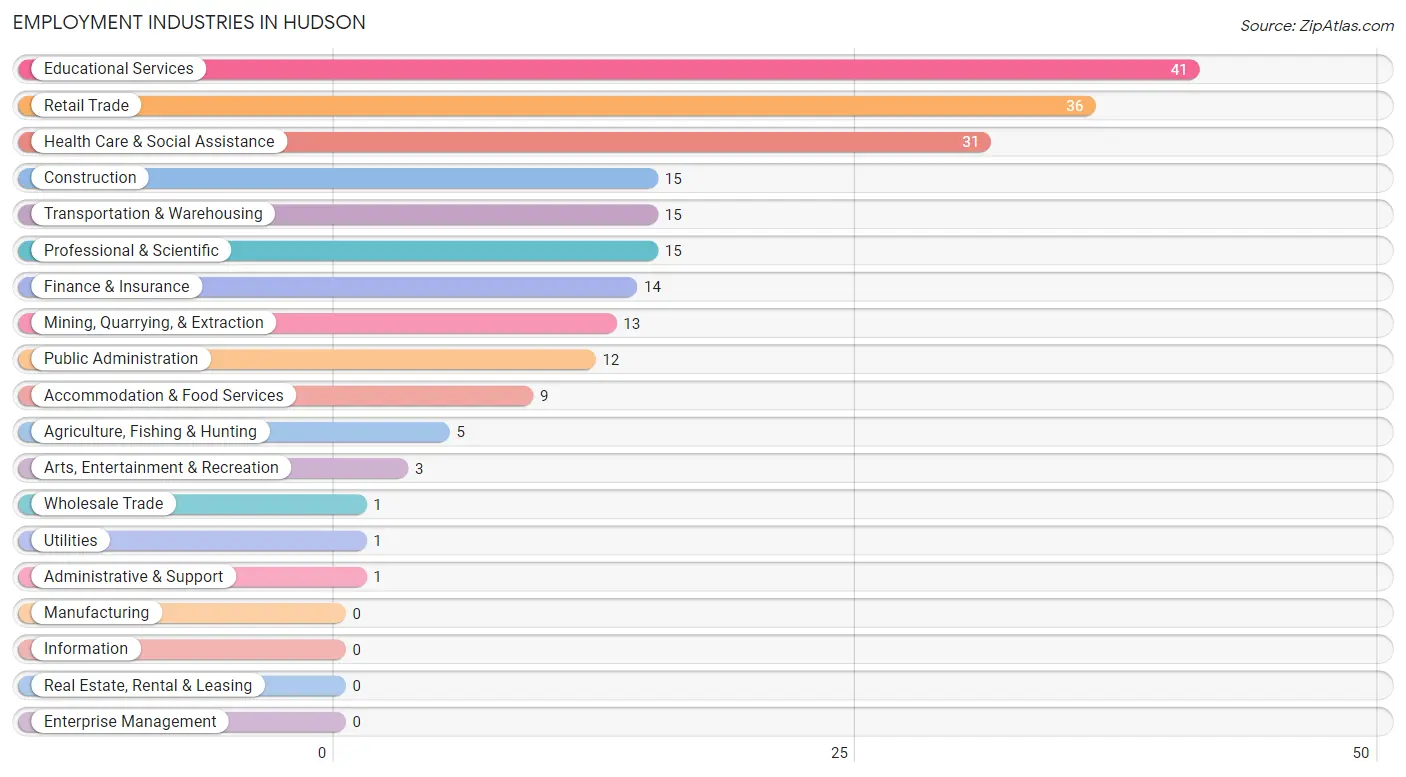
Employment Industries in Hudson
The major employment industries in Hudson include Educational Services (41 | 17.8%), Retail Trade (36 | 15.7%), Health Care & Social Assistance (31 | 13.5%), Construction (15 | 6.5%), and Transportation & Warehousing (15 | 6.5%).
Employment Industries by Sex in Hudson
The Hudson industries that see more men than women are Mining, Quarrying, & Extraction (100.0%), Wholesale Trade (100.0%), and Utilities (100.0%), whereas the industries that tend to have a higher number of women are Administrative & Support (100.0%), Health Care & Social Assistance (100.0%), and Arts, Entertainment & Recreation (100.0%).
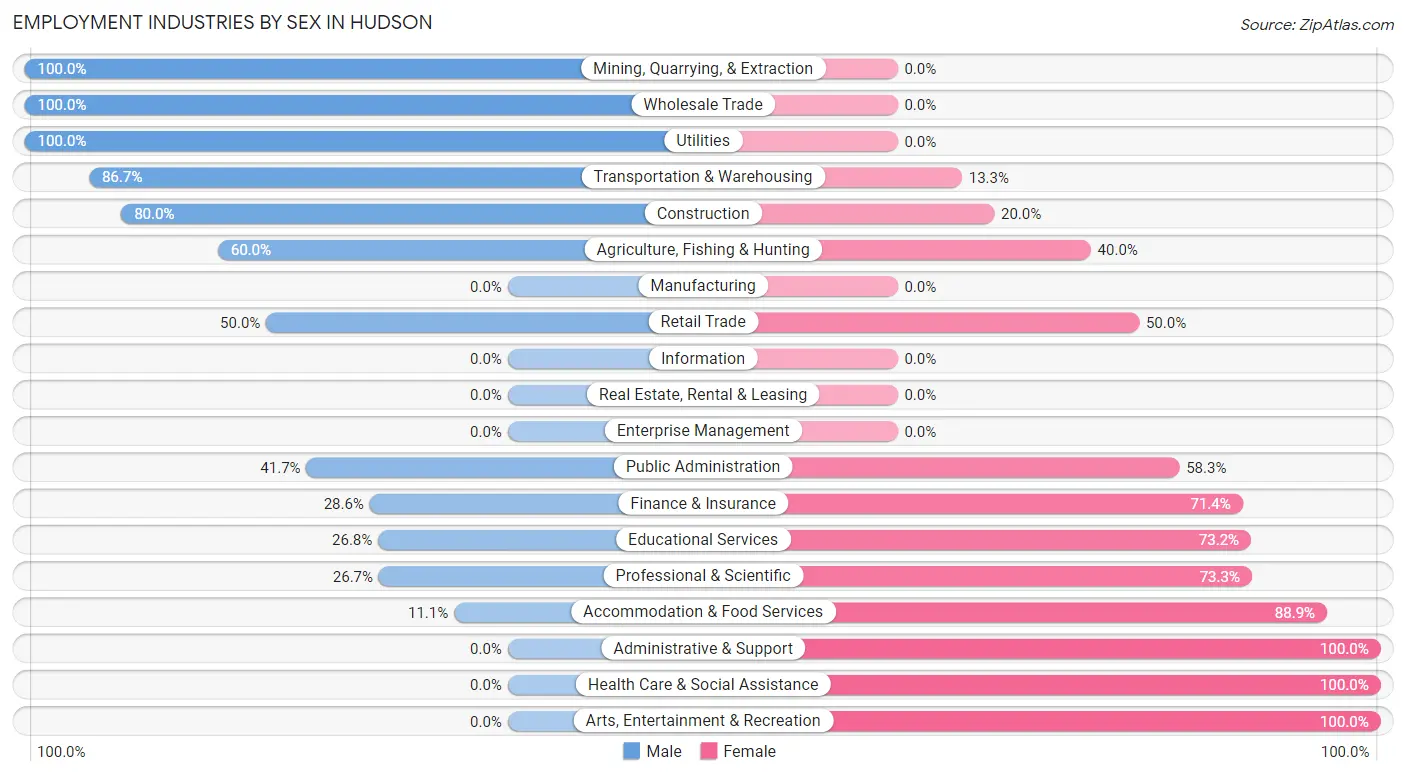
| Industry | Male | Female |
| Agriculture, Fishing & Hunting | 3 (60.0%) | 2 (40.0%) |
| Mining, Quarrying, & Extraction | 13 (100.0%) | 0 (0.0%) |
| Construction | 12 (80.0%) | 3 (20.0%) |
| Manufacturing | 0 (0.0%) | 0 (0.0%) |
| Wholesale Trade | 1 (100.0%) | 0 (0.0%) |
| Retail Trade | 18 (50.0%) | 18 (50.0%) |
| Transportation & Warehousing | 13 (86.7%) | 2 (13.3%) |
| Utilities | 1 (100.0%) | 0 (0.0%) |
| Information | 0 (0.0%) | 0 (0.0%) |
| Finance & Insurance | 4 (28.6%) | 10 (71.4%) |
| Real Estate, Rental & Leasing | 0 (0.0%) | 0 (0.0%) |
| Professional & Scientific | 4 (26.7%) | 11 (73.3%) |
| Enterprise Management | 0 (0.0%) | 0 (0.0%) |
| Administrative & Support | 0 (0.0%) | 1 (100.0%) |
| Educational Services | 11 (26.8%) | 30 (73.2%) |
| Health Care & Social Assistance | 0 (0.0%) | 31 (100.0%) |
| Arts, Entertainment & Recreation | 0 (0.0%) | 3 (100.0%) |
| Accommodation & Food Services | 1 (11.1%) | 8 (88.9%) |
| Public Administration | 5 (41.7%) | 7 (58.3%) |
| Total | 91 (39.6%) | 139 (60.4%) |
Education in Hudson
School Enrollment in Hudson
The most common levels of schooling among the 93 students in Hudson are middle school (29 | 31.2%), elementary school (23 | 24.7%), and college / undergraduate (18 | 19.4%).
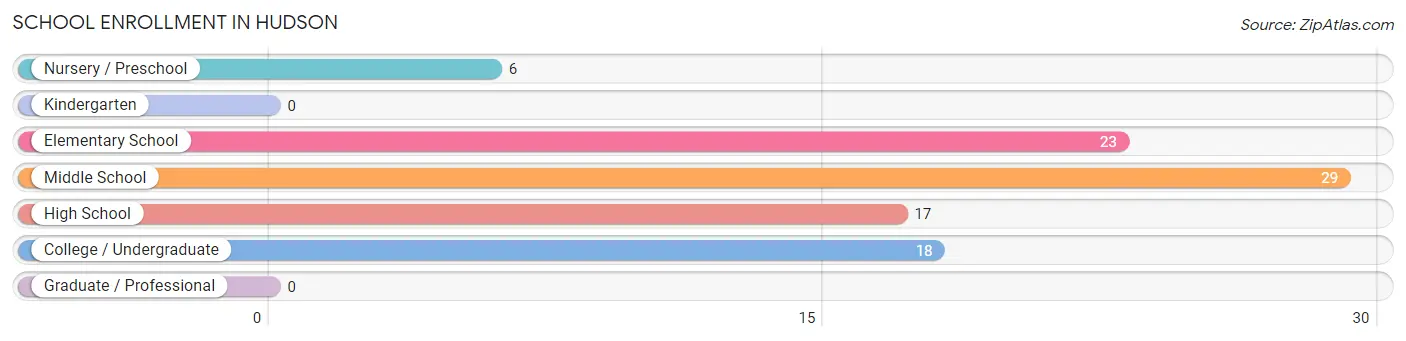
| School Level | # Students | % Students |
| Nursery / Preschool | 6 | 6.5% |
| Kindergarten | 0 | 0.0% |
| Elementary School | 23 | 24.7% |
| Middle School | 29 | 31.2% |
| High School | 17 | 18.3% |
| College / Undergraduate | 18 | 19.4% |
| Graduate / Professional | 0 | 0.0% |
| Total | 93 | 100.0% |
School Enrollment by Age by Funding Source in Hudson
Out of a total of 93 students who are enrolled in schools in Hudson, 7 (7.5%) attend a private institution, while the remaining 86 (92.5%) are enrolled in public schools. The age group of 10 to 14 year olds has the highest likelihood of being enrolled in private schools, with 7 (18.4% in the age bracket) enrolled. Conversely, the age group of 5 to 9 year old has the lowest likelihood of being enrolled in a private school, with 25 (100.0% in the age bracket) attending a public institution.
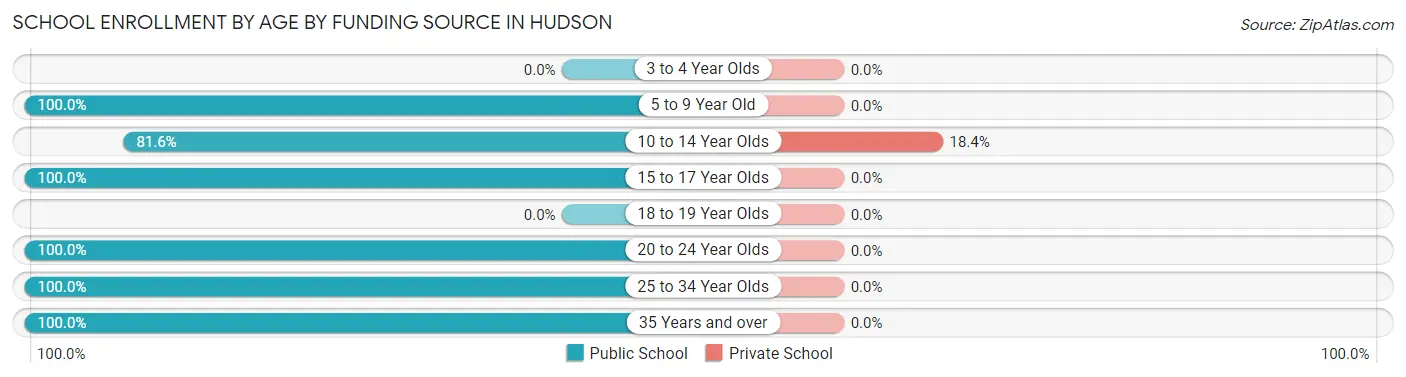
| Age Bracket | Public School | Private School |
| 3 to 4 Year Olds | 0 (0.0%) | 0 (0.0%) |
| 5 to 9 Year Old | 25 (100.0%) | 0 (0.0%) |
| 10 to 14 Year Olds | 31 (81.6%) | 7 (18.4%) |
| 15 to 17 Year Olds | 12 (100.0%) | 0 (0.0%) |
| 18 to 19 Year Olds | 0 (0.0%) | 0 (0.0%) |
| 20 to 24 Year Olds | 4 (100.0%) | 0 (0.0%) |
| 25 to 34 Year Olds | 7 (100.0%) | 0 (0.0%) |
| 35 Years and over | 7 (100.0%) | 0 (0.0%) |
| Total | 86 (92.5%) | 7 (7.5%) |
Educational Attainment by Field of Study in Hudson
Science & technology (11 | 19.6%), education (11 | 19.6%), bio, nature & agricultural (6 | 10.7%), business (6 | 10.7%), and communications (6 | 10.7%) are the most common fields of study among 56 individuals in Hudson who have obtained a bachelor's degree or higher.
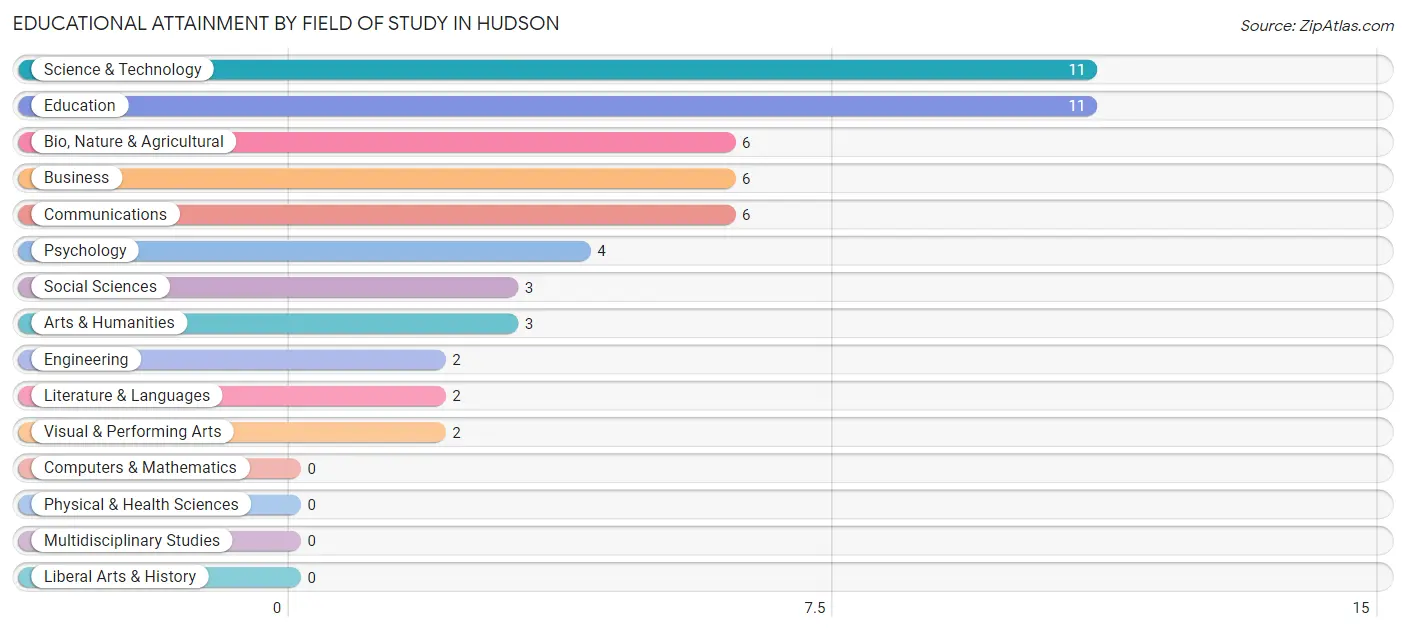
| Field of Study | # Graduates | % Graduates |
| Computers & Mathematics | 0 | 0.0% |
| Bio, Nature & Agricultural | 6 | 10.7% |
| Physical & Health Sciences | 0 | 0.0% |
| Psychology | 4 | 7.1% |
| Social Sciences | 3 | 5.4% |
| Engineering | 2 | 3.6% |
| Multidisciplinary Studies | 0 | 0.0% |
| Science & Technology | 11 | 19.6% |
| Business | 6 | 10.7% |
| Education | 11 | 19.6% |
| Literature & Languages | 2 | 3.6% |
| Liberal Arts & History | 0 | 0.0% |
| Visual & Performing Arts | 2 | 3.6% |
| Communications | 6 | 10.7% |
| Arts & Humanities | 3 | 5.4% |
| Total | 56 | 100.0% |
Transportation & Commute in Hudson
Vehicle Availability by Sex in Hudson
The most prevalent vehicle ownership categories in Hudson are males with 2 vehicles (34, accounting for 37.4%) and females with 2 vehicles (39, making up 25.6%).
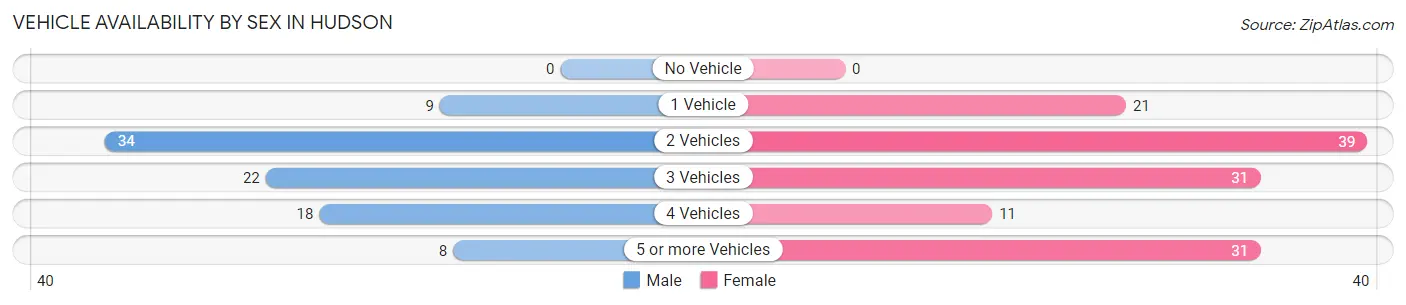
| Vehicles Available | Male | Female |
| No Vehicle | 0 (0.0%) | 0 (0.0%) |
| 1 Vehicle | 9 (9.9%) | 21 (15.8%) |
| 2 Vehicles | 34 (37.4%) | 39 (29.3%) |
| 3 Vehicles | 22 (24.2%) | 31 (23.3%) |
| 4 Vehicles | 18 (19.8%) | 11 (8.3%) |
| 5 or more Vehicles | 8 (8.8%) | 31 (23.3%) |
| Total | 91 (100.0%) | 133 (100.0%) |
Commute Time in Hudson
The most frequently occuring commute durations in Hudson are 15 to 19 minutes (67 commuters, 31.0%), 20 to 24 minutes (48 commuters, 22.2%), and 10 to 14 minutes (32 commuters, 14.8%).
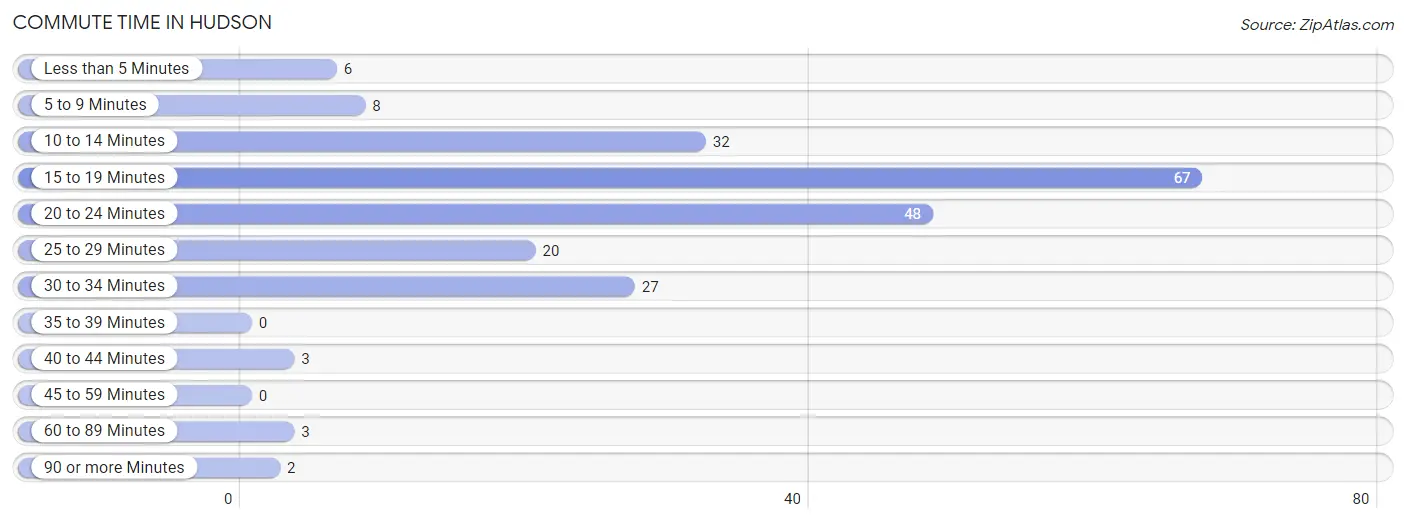
| Commute Time | # Commuters | % Commuters |
| Less than 5 Minutes | 6 | 2.8% |
| 5 to 9 Minutes | 8 | 3.7% |
| 10 to 14 Minutes | 32 | 14.8% |
| 15 to 19 Minutes | 67 | 31.0% |
| 20 to 24 Minutes | 48 | 22.2% |
| 25 to 29 Minutes | 20 | 9.3% |
| 30 to 34 Minutes | 27 | 12.5% |
| 35 to 39 Minutes | 0 | 0.0% |
| 40 to 44 Minutes | 3 | 1.4% |
| 45 to 59 Minutes | 0 | 0.0% |
| 60 to 89 Minutes | 3 | 1.4% |
| 90 or more Minutes | 2 | 0.9% |
Commute Time by Sex in Hudson
The most common commute times in Hudson are 20 to 24 minutes (22 commuters, 24.4%) for males and 15 to 19 minutes (53 commuters, 42.1%) for females.
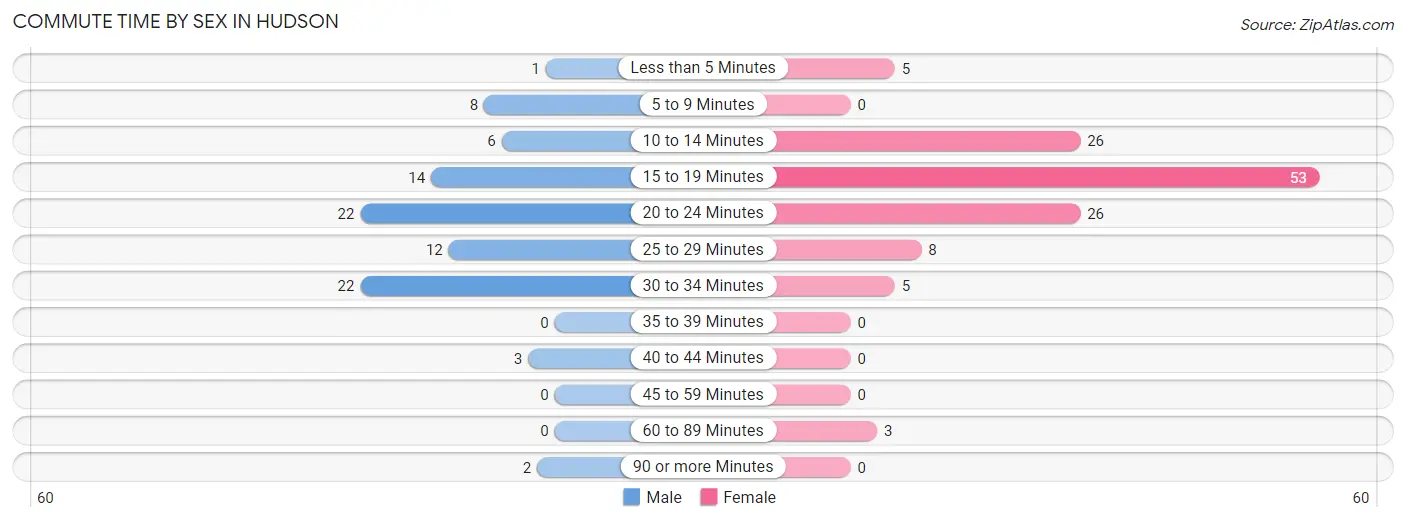
| Commute Time | Male | Female |
| Less than 5 Minutes | 1 (1.1%) | 5 (4.0%) |
| 5 to 9 Minutes | 8 (8.9%) | 0 (0.0%) |
| 10 to 14 Minutes | 6 (6.7%) | 26 (20.6%) |
| 15 to 19 Minutes | 14 (15.6%) | 53 (42.1%) |
| 20 to 24 Minutes | 22 (24.4%) | 26 (20.6%) |
| 25 to 29 Minutes | 12 (13.3%) | 8 (6.4%) |
| 30 to 34 Minutes | 22 (24.4%) | 5 (4.0%) |
| 35 to 39 Minutes | 0 (0.0%) | 0 (0.0%) |
| 40 to 44 Minutes | 3 (3.3%) | 0 (0.0%) |
| 45 to 59 Minutes | 0 (0.0%) | 0 (0.0%) |
| 60 to 89 Minutes | 0 (0.0%) | 3 (2.4%) |
| 90 or more Minutes | 2 (2.2%) | 0 (0.0%) |
Time of Departure to Work by Sex in Hudson
The most frequent times of departure to work in Hudson are 7:30 AM to 7:59 AM (25, 27.8%) for males and 7:00 AM to 7:29 AM (23, 18.2%) for females.
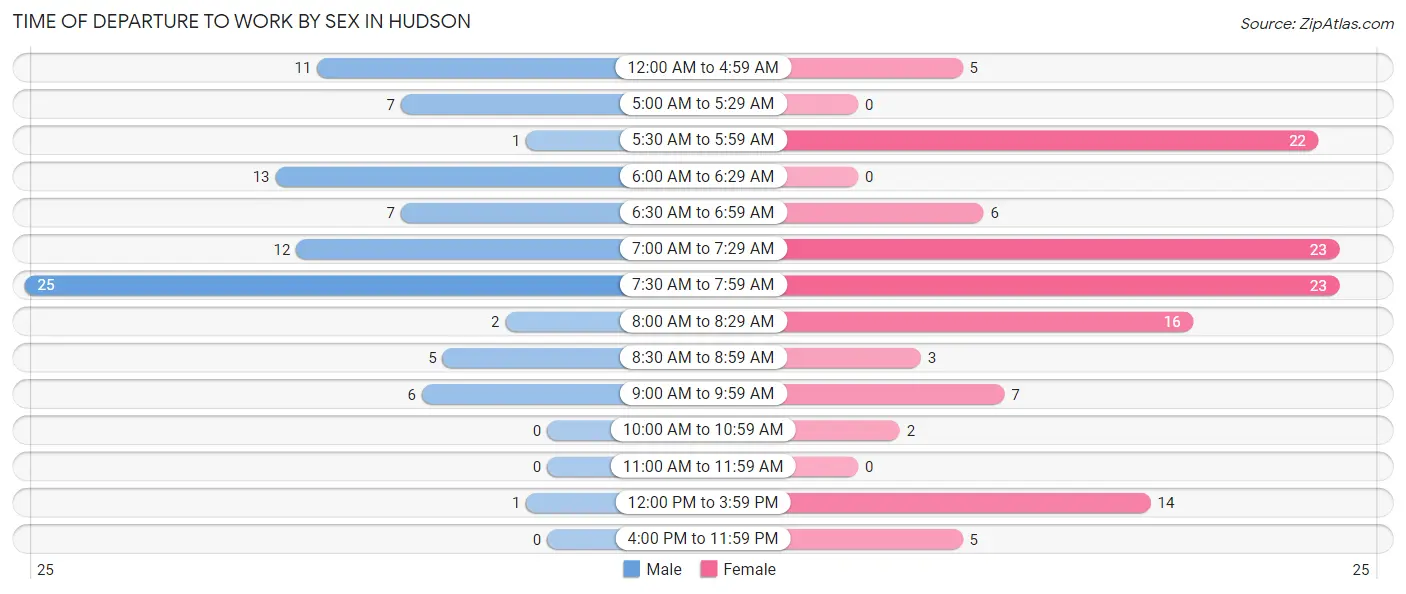
| Time of Departure | Male | Female |
| 12:00 AM to 4:59 AM | 11 (12.2%) | 5 (4.0%) |
| 5:00 AM to 5:29 AM | 7 (7.8%) | 0 (0.0%) |
| 5:30 AM to 5:59 AM | 1 (1.1%) | 22 (17.5%) |
| 6:00 AM to 6:29 AM | 13 (14.4%) | 0 (0.0%) |
| 6:30 AM to 6:59 AM | 7 (7.8%) | 6 (4.8%) |
| 7:00 AM to 7:29 AM | 12 (13.3%) | 23 (18.2%) |
| 7:30 AM to 7:59 AM | 25 (27.8%) | 23 (18.2%) |
| 8:00 AM to 8:29 AM | 2 (2.2%) | 16 (12.7%) |
| 8:30 AM to 8:59 AM | 5 (5.6%) | 3 (2.4%) |
| 9:00 AM to 9:59 AM | 6 (6.7%) | 7 (5.6%) |
| 10:00 AM to 10:59 AM | 0 (0.0%) | 2 (1.6%) |
| 11:00 AM to 11:59 AM | 0 (0.0%) | 0 (0.0%) |
| 12:00 PM to 3:59 PM | 1 (1.1%) | 14 (11.1%) |
| 4:00 PM to 11:59 PM | 0 (0.0%) | 5 (4.0%) |
| Total | 90 (100.0%) | 126 (100.0%) |
Housing Occupancy in Hudson
Occupancy by Ownership in Hudson
Of the total 182 dwellings in Hudson, owner-occupied units account for 146 (80.2%), while renter-occupied units make up 36 (19.8%).
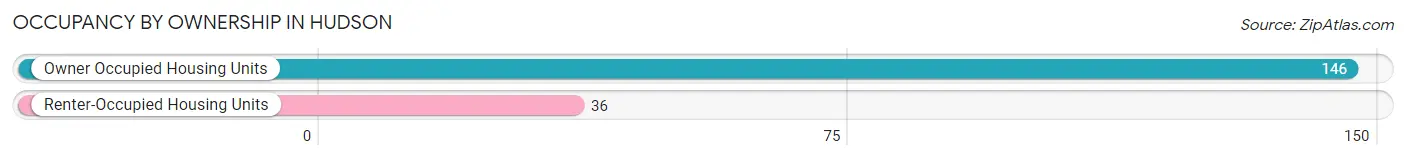
| Occupancy | # Housing Units | % Housing Units |
| Owner Occupied Housing Units | 146 | 80.2% |
| Renter-Occupied Housing Units | 36 | 19.8% |
| Total Occupied Housing Units | 182 | 100.0% |
Occupancy by Household Size in Hudson
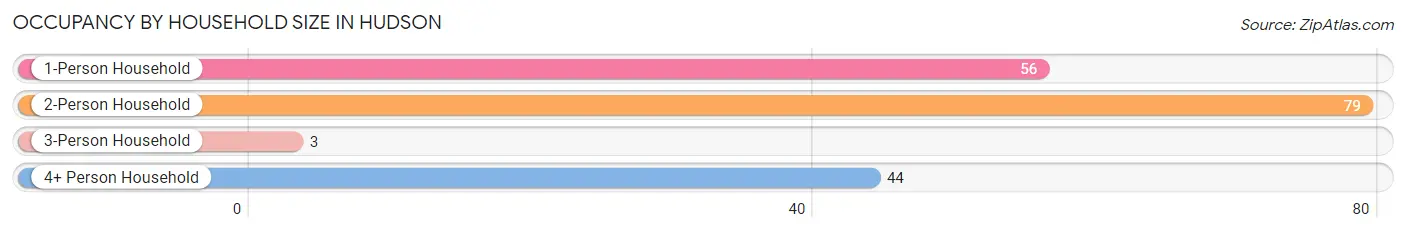
| Household Size | # Housing Units | % Housing Units |
| 1-Person Household | 56 | 30.8% |
| 2-Person Household | 79 | 43.4% |
| 3-Person Household | 3 | 1.7% |
| 4+ Person Household | 44 | 24.2% |
| Total Housing Units | 182 | 100.0% |
Occupancy by Ownership by Household Size in Hudson
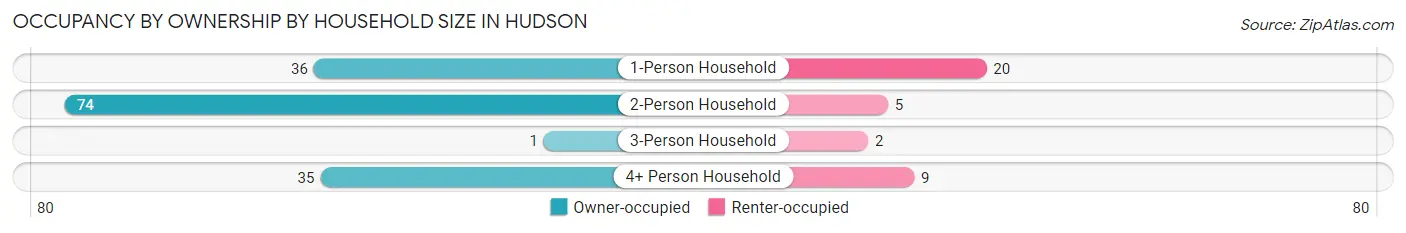
| Household Size | Owner-occupied | Renter-occupied |
| 1-Person Household | 36 (64.3%) | 20 (35.7%) |
| 2-Person Household | 74 (93.7%) | 5 (6.3%) |
| 3-Person Household | 1 (33.3%) | 2 (66.7%) |
| 4+ Person Household | 35 (79.5%) | 9 (20.4%) |
| Total Housing Units | 146 (80.2%) | 36 (19.8%) |
Occupancy by Educational Attainment in Hudson
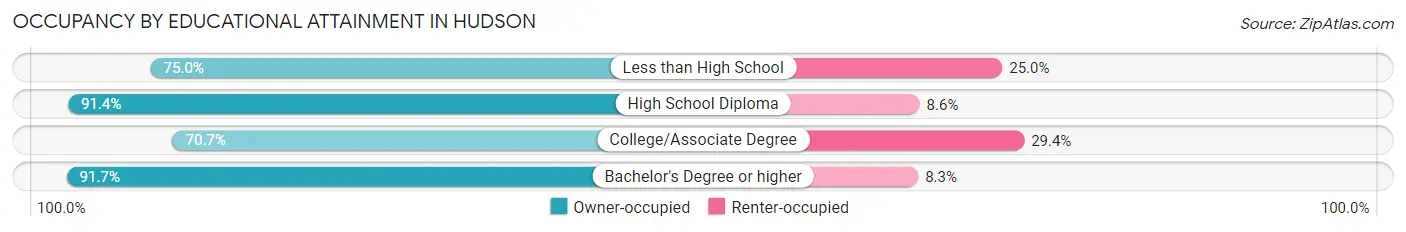
| Household Size | Owner-occupied | Renter-occupied |
| Less than High School | 6 (75.0%) | 2 (25.0%) |
| High School Diploma | 53 (91.4%) | 5 (8.6%) |
| College/Associate Degree | 65 (70.7%) | 27 (29.3%) |
| Bachelor's Degree or higher | 22 (91.7%) | 2 (8.3%) |
Occupancy by Age of Householder in Hudson
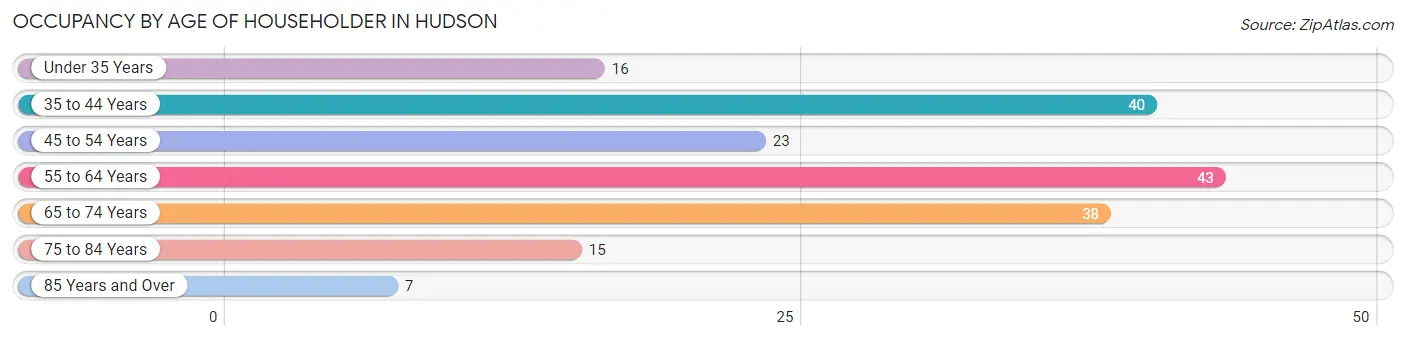
| Age Bracket | # Households | % Households |
| Under 35 Years | 16 | 8.8% |
| 35 to 44 Years | 40 | 22.0% |
| 45 to 54 Years | 23 | 12.6% |
| 55 to 64 Years | 43 | 23.6% |
| 65 to 74 Years | 38 | 20.9% |
| 75 to 84 Years | 15 | 8.2% |
| 85 Years and Over | 7 | 3.8% |
| Total | 182 | 100.0% |
Housing Finances in Hudson
Median Income by Occupancy in Hudson
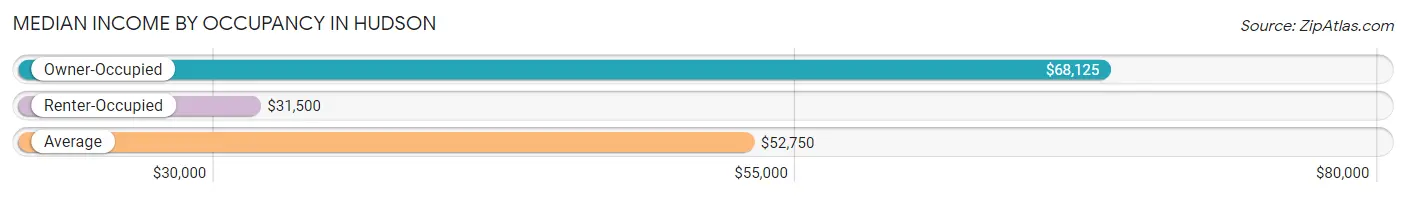
| Occupancy Type | # Households | Median Income |
| Owner-Occupied | 146 (80.2%) | $68,125 |
| Renter-Occupied | 36 (19.8%) | $31,500 |
| Average | 182 (100.0%) | $52,750 |
Occupancy by Householder Income Bracket in Hudson
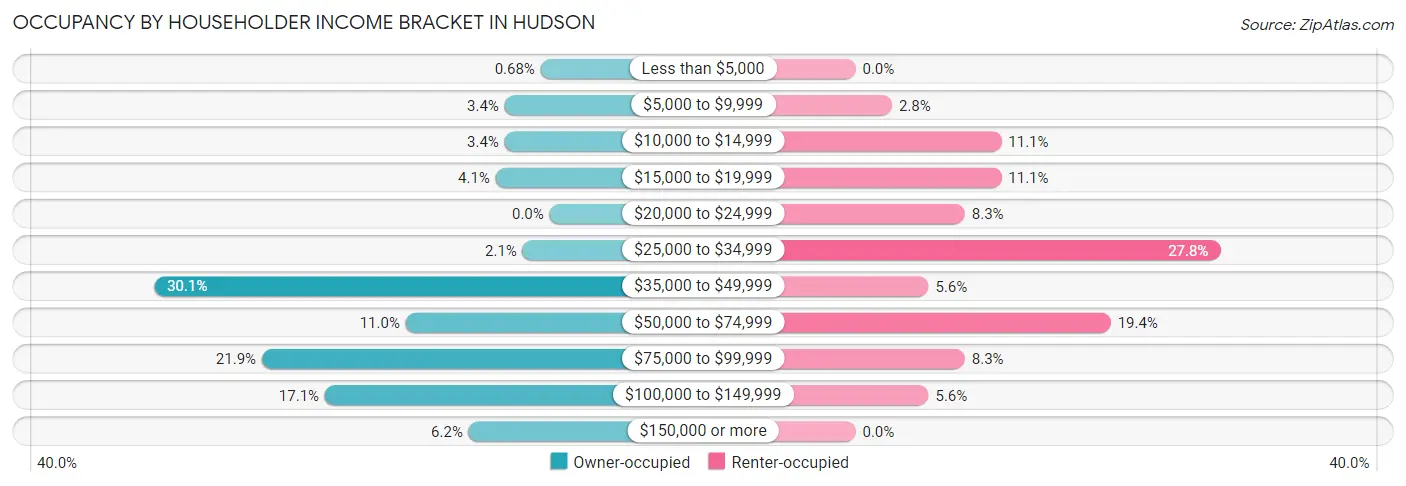
| Income Bracket | Owner-occupied | Renter-occupied |
| Less than $5,000 | 1 (0.7%) | 0 (0.0%) |
| $5,000 to $9,999 | 5 (3.4%) | 1 (2.8%) |
| $10,000 to $14,999 | 5 (3.4%) | 4 (11.1%) |
| $15,000 to $19,999 | 6 (4.1%) | 4 (11.1%) |
| $20,000 to $24,999 | 0 (0.0%) | 3 (8.3%) |
| $25,000 to $34,999 | 3 (2.1%) | 10 (27.8%) |
| $35,000 to $49,999 | 44 (30.1%) | 2 (5.6%) |
| $50,000 to $74,999 | 16 (11.0%) | 7 (19.4%) |
| $75,000 to $99,999 | 32 (21.9%) | 3 (8.3%) |
| $100,000 to $149,999 | 25 (17.1%) | 2 (5.6%) |
| $150,000 or more | 9 (6.2%) | 0 (0.0%) |
| Total | 146 (100.0%) | 36 (100.0%) |
Monthly Housing Cost Tiers in Hudson
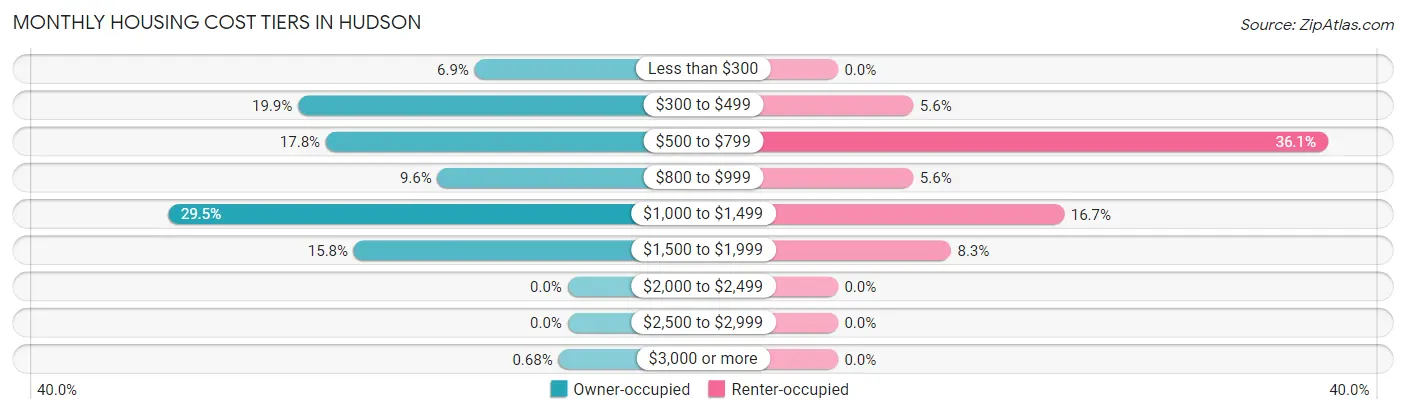
| Monthly Cost | Owner-occupied | Renter-occupied |
| Less than $300 | 10 (6.9%) | 0 (0.0%) |
| $300 to $499 | 29 (19.9%) | 2 (5.6%) |
| $500 to $799 | 26 (17.8%) | 13 (36.1%) |
| $800 to $999 | 14 (9.6%) | 2 (5.6%) |
| $1,000 to $1,499 | 43 (29.4%) | 6 (16.7%) |
| $1,500 to $1,999 | 23 (15.8%) | 3 (8.3%) |
| $2,000 to $2,499 | 0 (0.0%) | 0 (0.0%) |
| $2,500 to $2,999 | 0 (0.0%) | 0 (0.0%) |
| $3,000 or more | 1 (0.7%) | 0 (0.0%) |
| Total | 146 (100.0%) | 36 (100.0%) |
Physical Housing Characteristics in Hudson
Housing Structures in Hudson
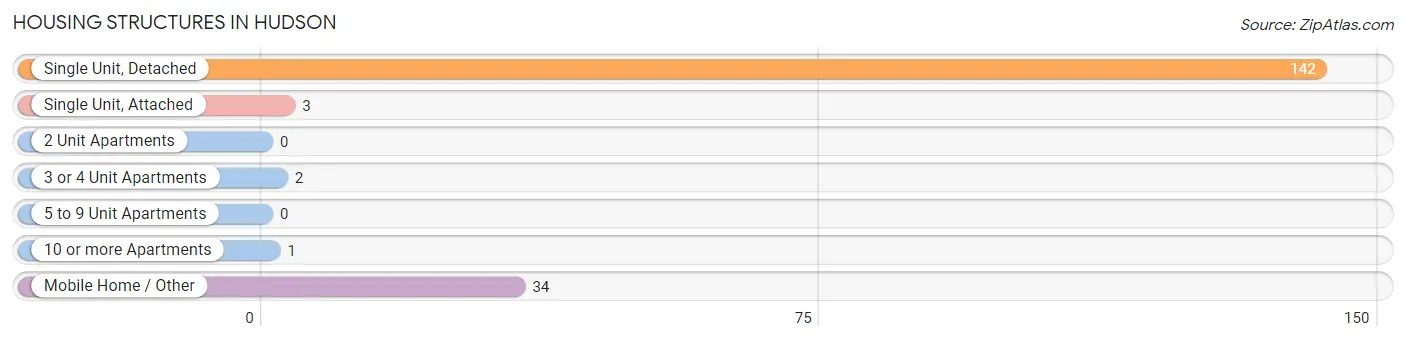
| Structure Type | # Housing Units | % Housing Units |
| Single Unit, Detached | 142 | 78.0% |
| Single Unit, Attached | 3 | 1.7% |
| 2 Unit Apartments | 0 | 0.0% |
| 3 or 4 Unit Apartments | 2 | 1.1% |
| 5 to 9 Unit Apartments | 0 | 0.0% |
| 10 or more Apartments | 1 | 0.5% |
| Mobile Home / Other | 34 | 18.7% |
| Total | 182 | 100.0% |
Housing Structures by Occupancy in Hudson
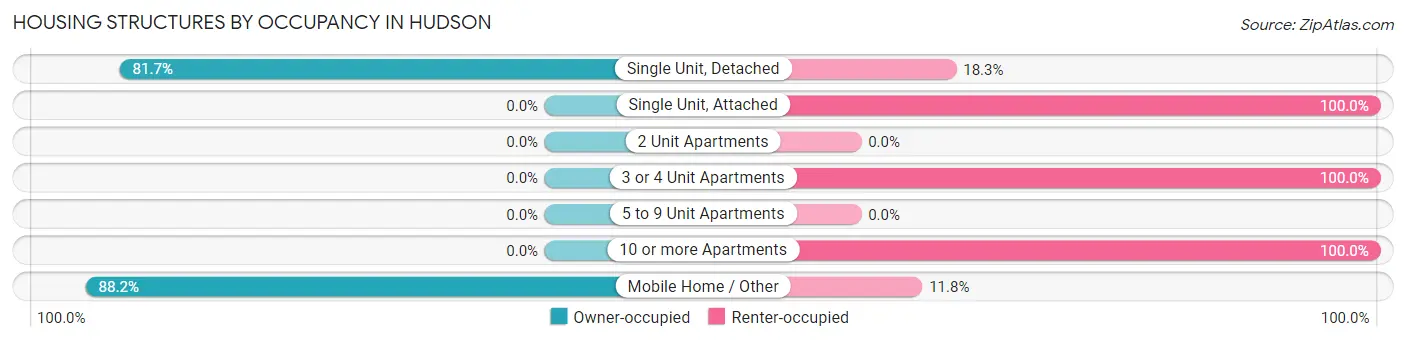
| Structure Type | Owner-occupied | Renter-occupied |
| Single Unit, Detached | 116 (81.7%) | 26 (18.3%) |
| Single Unit, Attached | 0 (0.0%) | 3 (100.0%) |
| 2 Unit Apartments | 0 (0.0%) | 0 (0.0%) |
| 3 or 4 Unit Apartments | 0 (0.0%) | 2 (100.0%) |
| 5 to 9 Unit Apartments | 0 (0.0%) | 0 (0.0%) |
| 10 or more Apartments | 0 (0.0%) | 1 (100.0%) |
| Mobile Home / Other | 30 (88.2%) | 4 (11.8%) |
| Total | 146 (80.2%) | 36 (19.8%) |
Housing Structures by Number of Rooms in Hudson
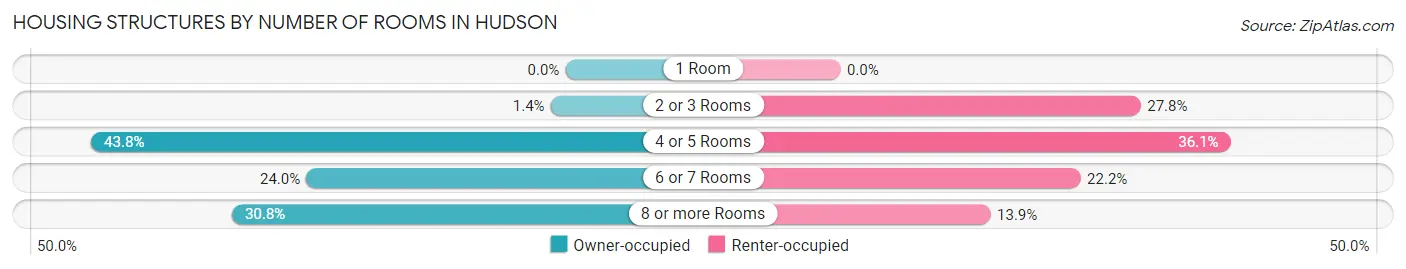
| Number of Rooms | Owner-occupied | Renter-occupied |
| 1 Room | 0 (0.0%) | 0 (0.0%) |
| 2 or 3 Rooms | 2 (1.4%) | 10 (27.8%) |
| 4 or 5 Rooms | 64 (43.8%) | 13 (36.1%) |
| 6 or 7 Rooms | 35 (24.0%) | 8 (22.2%) |
| 8 or more Rooms | 45 (30.8%) | 5 (13.9%) |
| Total | 146 (100.0%) | 36 (100.0%) |
Housing Structure by Heating Type in Hudson
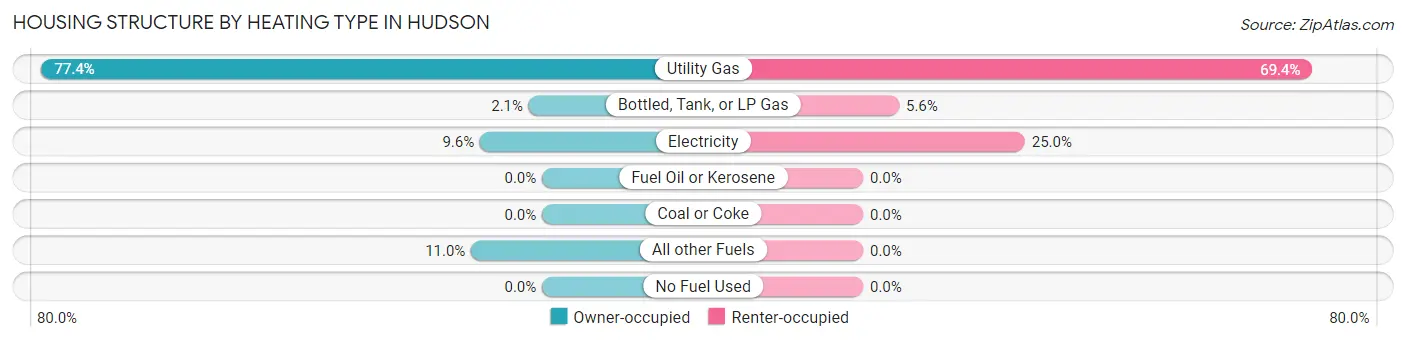
| Heating Type | Owner-occupied | Renter-occupied |
| Utility Gas | 113 (77.4%) | 25 (69.4%) |
| Bottled, Tank, or LP Gas | 3 (2.1%) | 2 (5.6%) |
| Electricity | 14 (9.6%) | 9 (25.0%) |
| Fuel Oil or Kerosene | 0 (0.0%) | 0 (0.0%) |
| Coal or Coke | 0 (0.0%) | 0 (0.0%) |
| All other Fuels | 16 (11.0%) | 0 (0.0%) |
| No Fuel Used | 0 (0.0%) | 0 (0.0%) |
| Total | 146 (100.0%) | 36 (100.0%) |
Household Vehicle Usage in Hudson
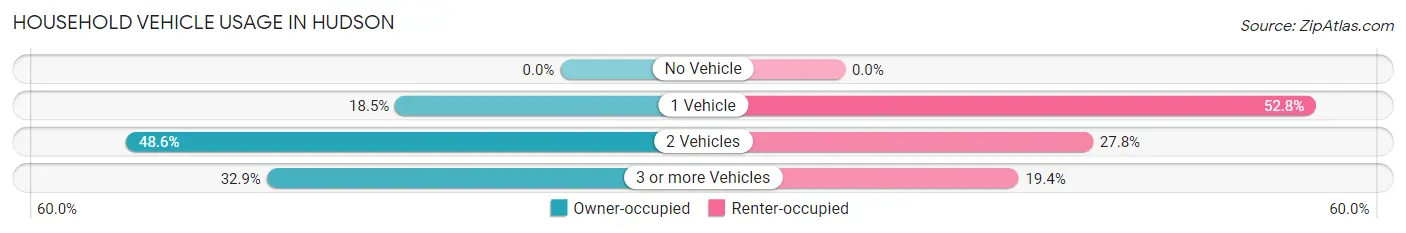
| Vehicles per Household | Owner-occupied | Renter-occupied |
| No Vehicle | 0 (0.0%) | 0 (0.0%) |
| 1 Vehicle | 27 (18.5%) | 19 (52.8%) |
| 2 Vehicles | 71 (48.6%) | 10 (27.8%) |
| 3 or more Vehicles | 48 (32.9%) | 7 (19.4%) |
| Total | 146 (100.0%) | 36 (100.0%) |
Real Estate & Mortgages in Hudson
Real Estate and Mortgage Overview in Hudson
| Characteristic | Without Mortgage | With Mortgage |
| Housing Units | 67 | 79 |
| Median Property Value | $172,500 | $221,700 |
| Median Household Income | $42,375 | $6 |
| Monthly Housing Costs | $421 | $0 |
| Real Estate Taxes | $757 | $3 |
Property Value by Mortgage Status in Hudson
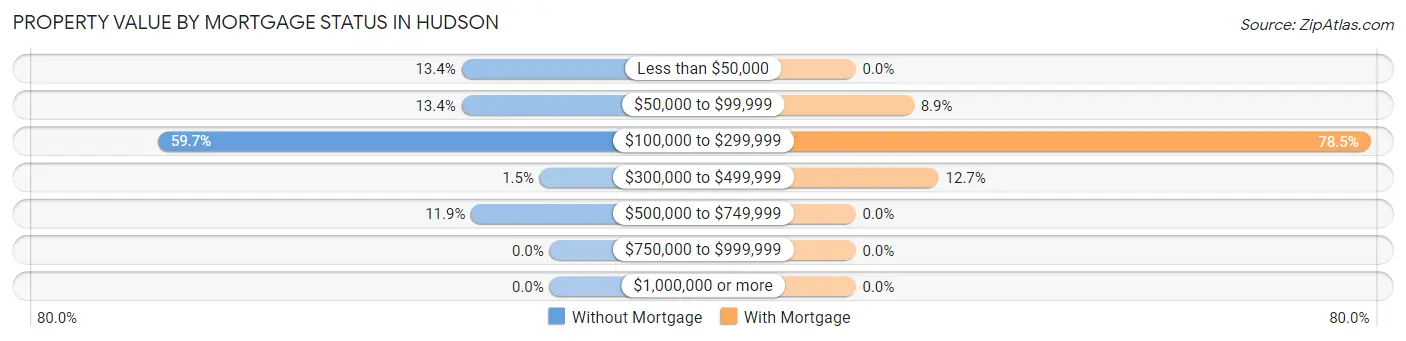
| Property Value | Without Mortgage | With Mortgage |
| Less than $50,000 | 9 (13.4%) | 0 (0.0%) |
| $50,000 to $99,999 | 9 (13.4%) | 7 (8.9%) |
| $100,000 to $299,999 | 40 (59.7%) | 62 (78.5%) |
| $300,000 to $499,999 | 1 (1.5%) | 10 (12.7%) |
| $500,000 to $749,999 | 8 (11.9%) | 0 (0.0%) |
| $750,000 to $999,999 | 0 (0.0%) | 0 (0.0%) |
| $1,000,000 or more | 0 (0.0%) | 0 (0.0%) |
| Total | 67 (100.0%) | 79 (100.0%) |
Household Income by Mortgage Status in Hudson
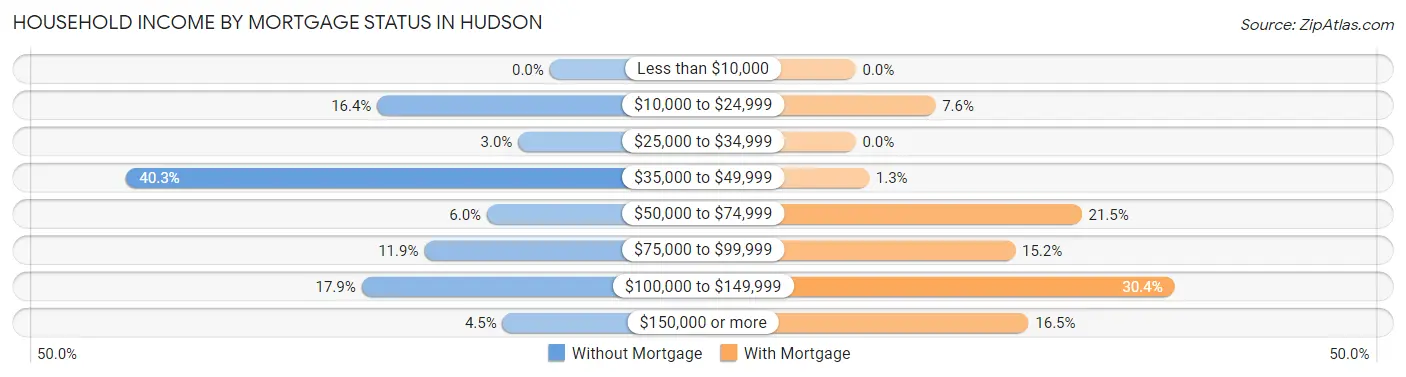
| Household Income | Without Mortgage | With Mortgage |
| Less than $10,000 | 0 (0.0%) | 0 (0.0%) |
| $10,000 to $24,999 | 11 (16.4%) | 6 (7.6%) |
| $25,000 to $34,999 | 2 (3.0%) | 0 (0.0%) |
| $35,000 to $49,999 | 27 (40.3%) | 1 (1.3%) |
| $50,000 to $74,999 | 4 (6.0%) | 17 (21.5%) |
| $75,000 to $99,999 | 8 (11.9%) | 12 (15.2%) |
| $100,000 to $149,999 | 12 (17.9%) | 24 (30.4%) |
| $150,000 or more | 3 (4.5%) | 13 (16.5%) |
| Total | 67 (100.0%) | 79 (100.0%) |
Property Value to Household Income Ratio in Hudson
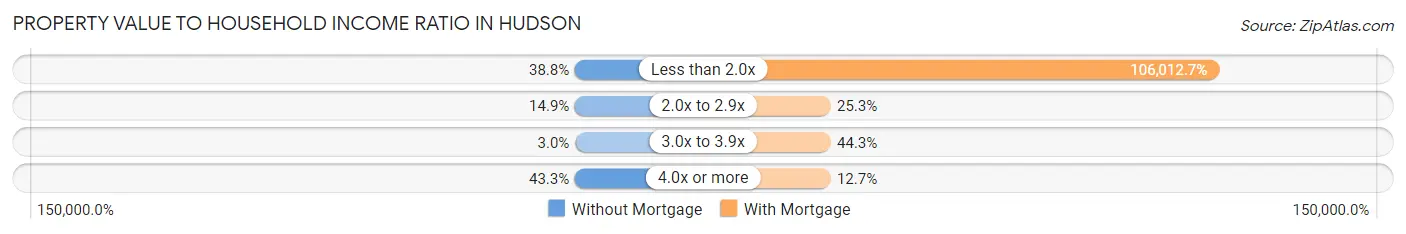
| Value-to-Income Ratio | Without Mortgage | With Mortgage |
| Less than 2.0x | 26 (38.8%) | 83,750 (106,012.7%) |
| 2.0x to 2.9x | 10 (14.9%) | 20 (25.3%) |
| 3.0x to 3.9x | 2 (3.0%) | 35 (44.3%) |
| 4.0x or more | 29 (43.3%) | 10 (12.7%) |
| Total | 67 (100.0%) | 79 (100.0%) |
Real Estate Taxes by Mortgage Status in Hudson
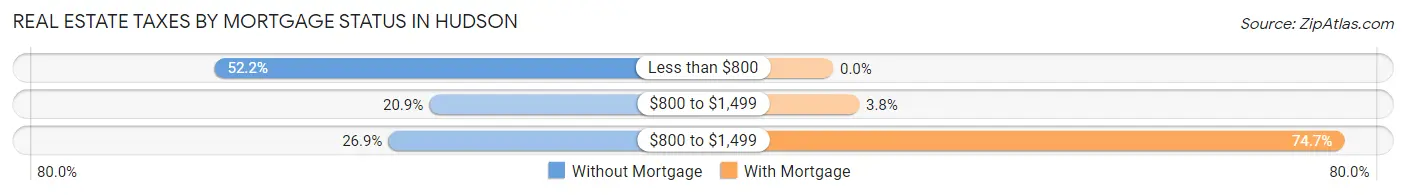
| Property Taxes | Without Mortgage | With Mortgage |
| Less than $800 | 35 (52.2%) | 0 (0.0%) |
| $800 to $1,499 | 14 (20.9%) | 3 (3.8%) |
| $800 to $1,499 | 18 (26.9%) | 59 (74.7%) |
| Total | 67 (100.0%) | 79 (100.0%) |
Health & Disability in Hudson
Health Insurance Coverage by Age in Hudson
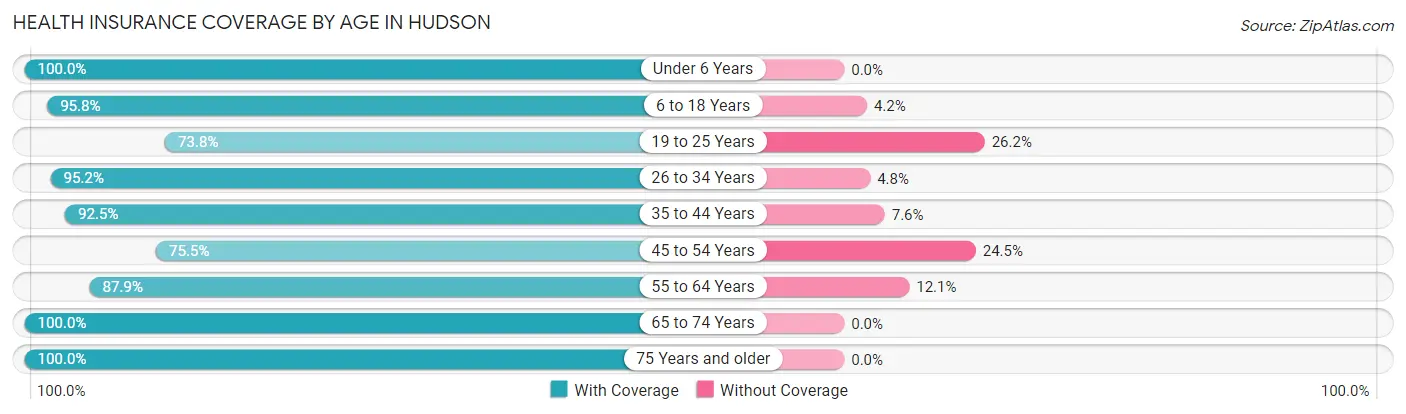
| Age Bracket | With Coverage | Without Coverage |
| Under 6 Years | 11 (100.0%) | 0 (0.0%) |
| 6 to 18 Years | 68 (95.8%) | 3 (4.2%) |
| 19 to 25 Years | 31 (73.8%) | 11 (26.2%) |
| 26 to 34 Years | 59 (95.2%) | 3 (4.8%) |
| 35 to 44 Years | 49 (92.4%) | 4 (7.5%) |
| 45 to 54 Years | 40 (75.5%) | 13 (24.5%) |
| 55 to 64 Years | 58 (87.9%) | 8 (12.1%) |
| 65 to 74 Years | 53 (100.0%) | 0 (0.0%) |
| 75 Years and older | 50 (100.0%) | 0 (0.0%) |
| Total | 419 (90.9%) | 42 (9.1%) |
Health Insurance Coverage by Citizenship Status in Hudson
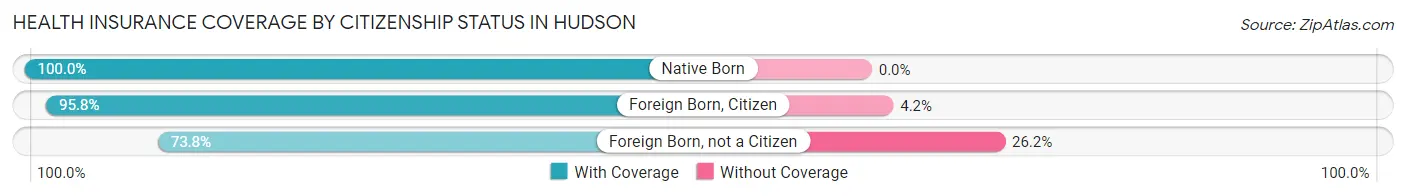
| Citizenship Status | With Coverage | Without Coverage |
| Native Born | 11 (100.0%) | 0 (0.0%) |
| Foreign Born, Citizen | 68 (95.8%) | 3 (4.2%) |
| Foreign Born, not a Citizen | 31 (73.8%) | 11 (26.2%) |
Health Insurance Coverage by Household Income in Hudson
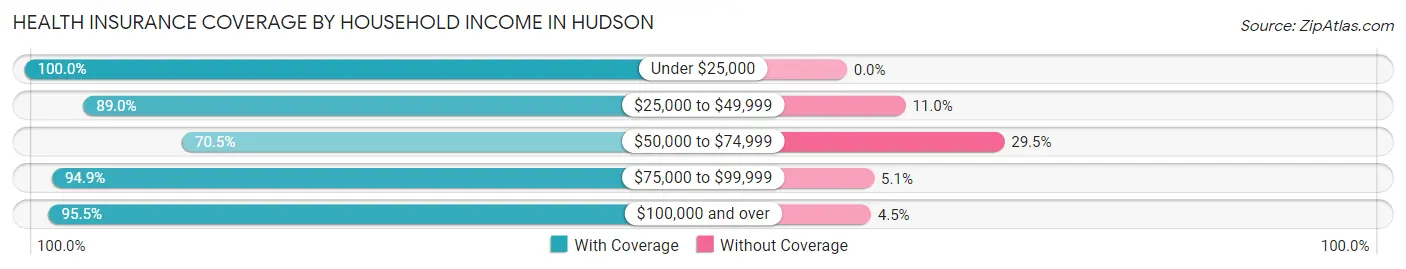
| Household Income | With Coverage | Without Coverage |
| Under $25,000 | 41 (100.0%) | 0 (0.0%) |
| $25,000 to $49,999 | 97 (89.0%) | 12 (11.0%) |
| $50,000 to $74,999 | 43 (70.5%) | 18 (29.5%) |
| $75,000 to $99,999 | 111 (94.9%) | 6 (5.1%) |
| $100,000 and over | 127 (95.5%) | 6 (4.5%) |
Public vs Private Health Insurance Coverage by Age in Hudson
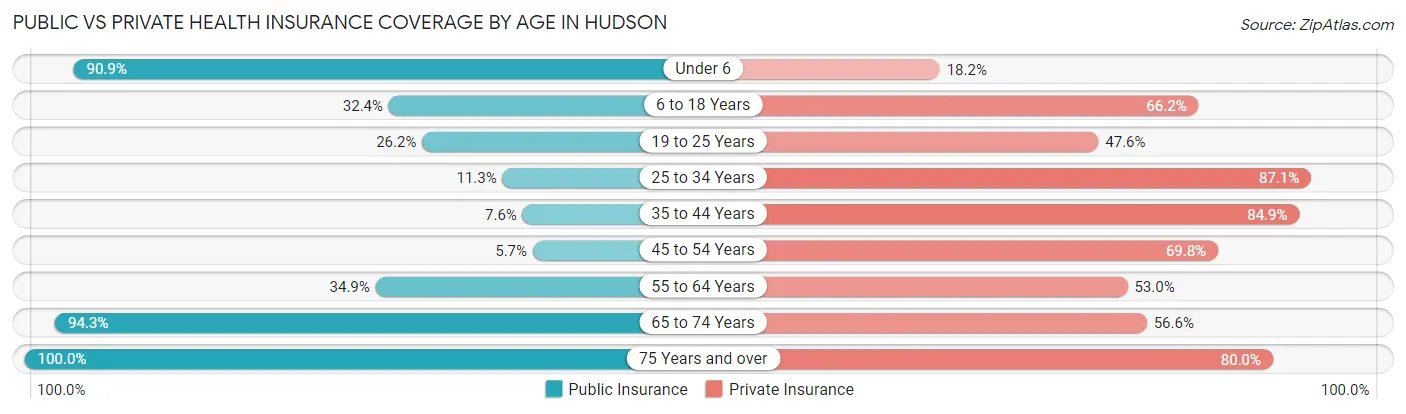
| Age Bracket | Public Insurance | Private Insurance |
| Under 6 | 10 (90.9%) | 2 (18.2%) |
| 6 to 18 Years | 23 (32.4%) | 47 (66.2%) |
| 19 to 25 Years | 11 (26.2%) | 20 (47.6%) |
| 25 to 34 Years | 7 (11.3%) | 54 (87.1%) |
| 35 to 44 Years | 4 (7.5%) | 45 (84.9%) |
| 45 to 54 Years | 3 (5.7%) | 37 (69.8%) |
| 55 to 64 Years | 23 (34.8%) | 35 (53.0%) |
| 65 to 74 Years | 50 (94.3%) | 30 (56.6%) |
| 75 Years and over | 50 (100.0%) | 40 (80.0%) |
| Total | 181 (39.3%) | 310 (67.2%) |
Disability Status by Sex by Age in Hudson
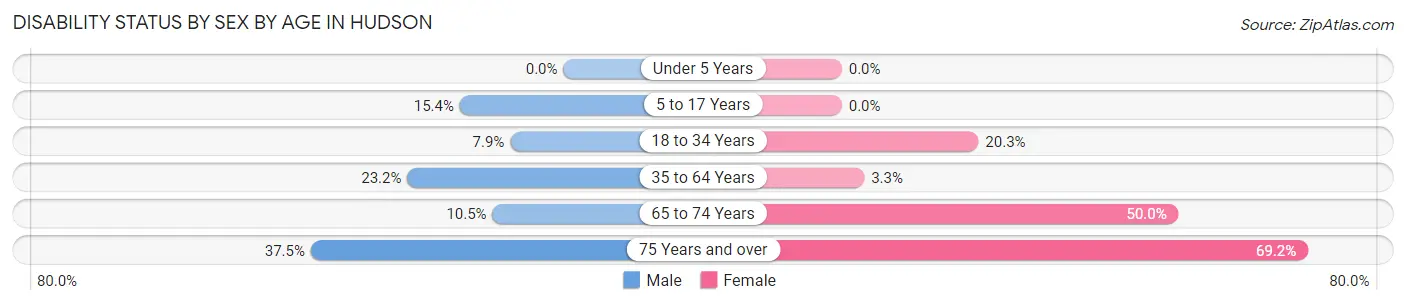
| Age Bracket | Male | Female |
| Under 5 Years | 0 (0.0%) | 0 (0.0%) |
| 5 to 17 Years | 6 (15.4%) | 0 (0.0%) |
| 18 to 34 Years | 3 (7.9%) | 14 (20.3%) |
| 35 to 64 Years | 19 (23.2%) | 3 (3.3%) |
| 65 to 74 Years | 2 (10.5%) | 17 (50.0%) |
| 75 Years and over | 9 (37.5%) | 18 (69.2%) |
Disability Class by Sex by Age in Hudson
Disability Class: Hearing Difficulty
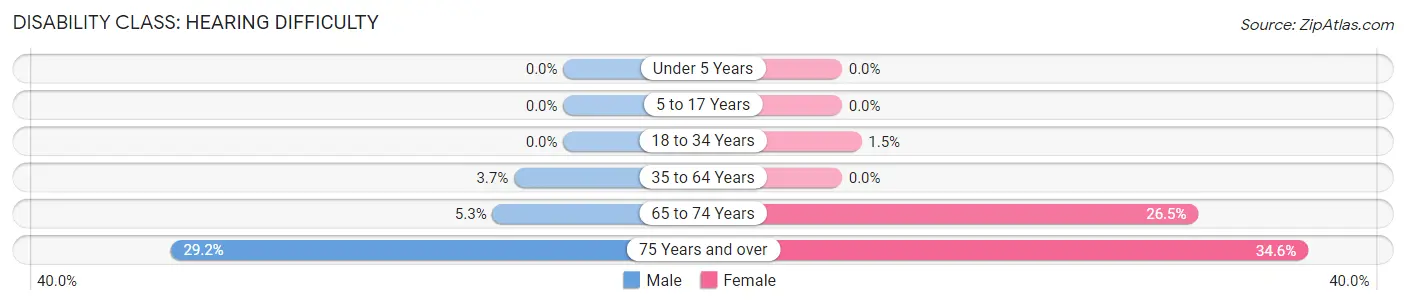
| Age Bracket | Male | Female |
| Under 5 Years | 0 (0.0%) | 0 (0.0%) |
| 5 to 17 Years | 0 (0.0%) | 0 (0.0%) |
| 18 to 34 Years | 0 (0.0%) | 1 (1.5%) |
| 35 to 64 Years | 3 (3.7%) | 0 (0.0%) |
| 65 to 74 Years | 1 (5.3%) | 9 (26.5%) |
| 75 Years and over | 7 (29.2%) | 9 (34.6%) |
Disability Class: Vision Difficulty
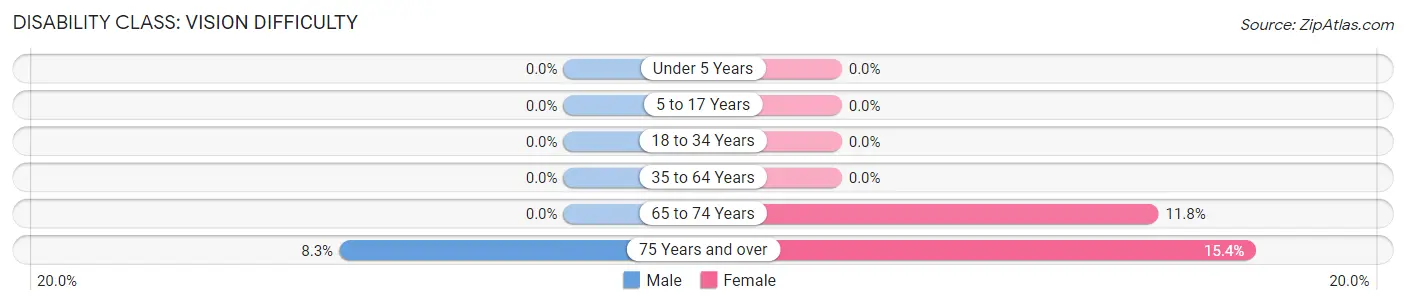
| Age Bracket | Male | Female |
| Under 5 Years | 0 (0.0%) | 0 (0.0%) |
| 5 to 17 Years | 0 (0.0%) | 0 (0.0%) |
| 18 to 34 Years | 0 (0.0%) | 0 (0.0%) |
| 35 to 64 Years | 0 (0.0%) | 0 (0.0%) |
| 65 to 74 Years | 0 (0.0%) | 4 (11.8%) |
| 75 Years and over | 2 (8.3%) | 4 (15.4%) |
Disability Class: Cognitive Difficulty
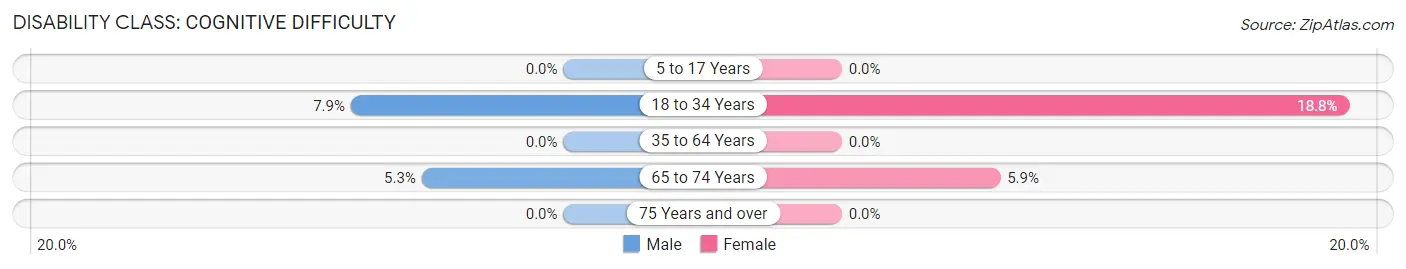
| Age Bracket | Male | Female |
| 5 to 17 Years | 0 (0.0%) | 0 (0.0%) |
| 18 to 34 Years | 3 (7.9%) | 13 (18.8%) |
| 35 to 64 Years | 0 (0.0%) | 0 (0.0%) |
| 65 to 74 Years | 1 (5.3%) | 2 (5.9%) |
| 75 Years and over | 0 (0.0%) | 0 (0.0%) |
Disability Class: Ambulatory Difficulty
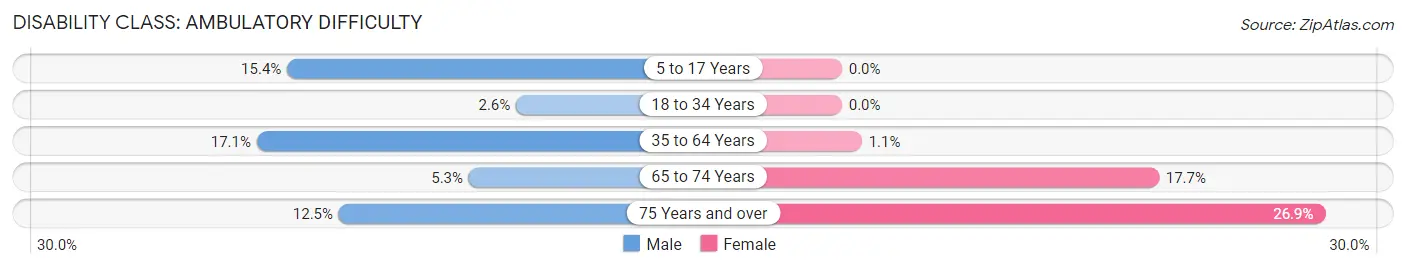
| Age Bracket | Male | Female |
| 5 to 17 Years | 6 (15.4%) | 0 (0.0%) |
| 18 to 34 Years | 1 (2.6%) | 0 (0.0%) |
| 35 to 64 Years | 14 (17.1%) | 1 (1.1%) |
| 65 to 74 Years | 1 (5.3%) | 6 (17.6%) |
| 75 Years and over | 3 (12.5%) | 7 (26.9%) |
Disability Class: Self-Care Difficulty
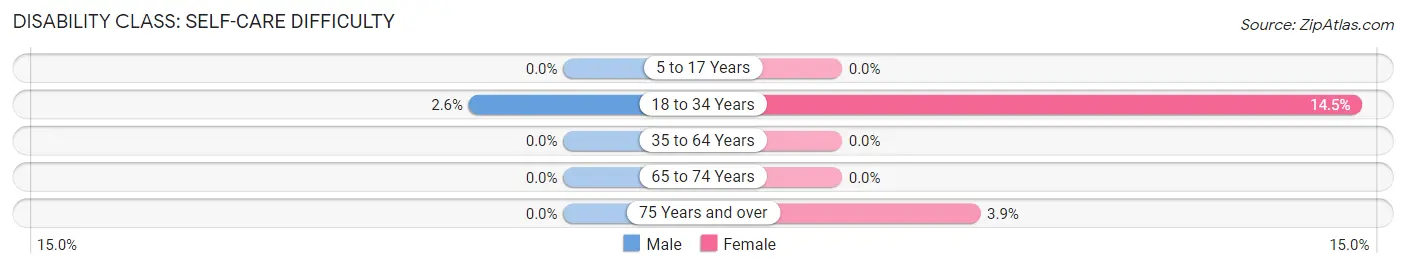
| Age Bracket | Male | Female |
| 5 to 17 Years | 0 (0.0%) | 0 (0.0%) |
| 18 to 34 Years | 1 (2.6%) | 10 (14.5%) |
| 35 to 64 Years | 0 (0.0%) | 0 (0.0%) |
| 65 to 74 Years | 0 (0.0%) | 0 (0.0%) |
| 75 Years and over | 0 (0.0%) | 1 (3.8%) |
Technology Access in Hudson
Computing Device Access in Hudson
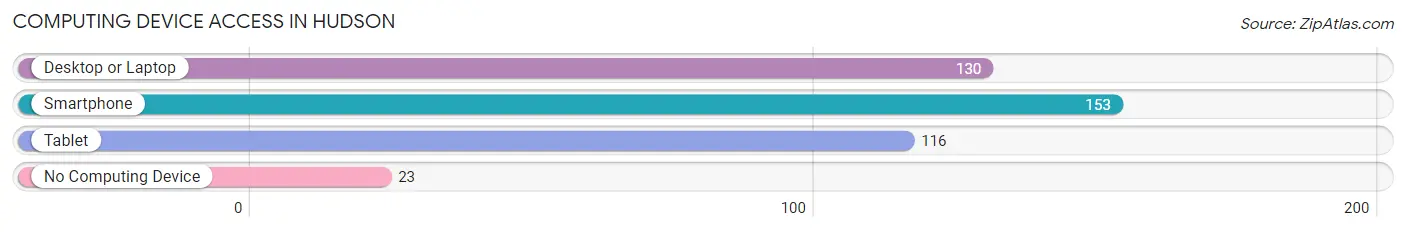
| Device Type | # Households | % Households |
| Desktop or Laptop | 130 | 71.4% |
| Smartphone | 153 | 84.1% |
| Tablet | 116 | 63.7% |
| No Computing Device | 23 | 12.6% |
| Total | 182 | 100.0% |
Internet Access in Hudson
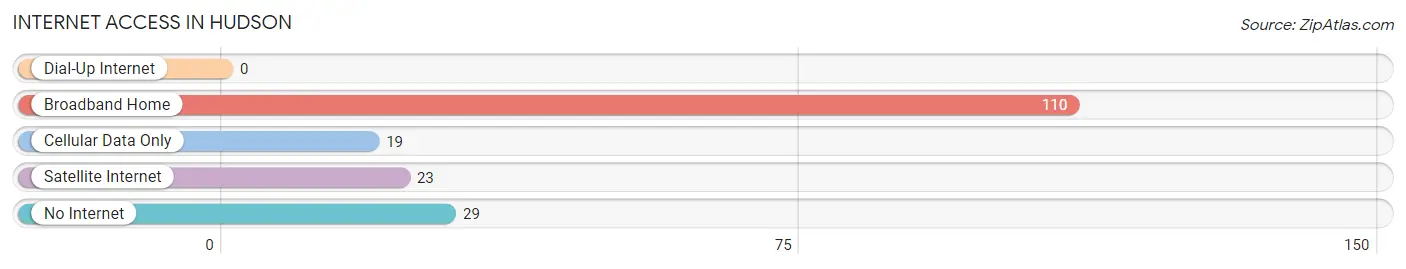
| Internet Type | # Households | % Households |
| Dial-Up Internet | 0 | 0.0% |
| Broadband Home | 110 | 60.4% |
| Cellular Data Only | 19 | 10.4% |
| Satellite Internet | 23 | 12.6% |
| No Internet | 29 | 15.9% |
| Total | 182 | 100.0% |
Hudson Summary
Hudson, Wyoming is a small town located in the southeastern corner of the state, near the border of Nebraska and Colorado. It is situated in the Laramie River Valley, and is surrounded by rolling hills and prairies. The town was founded in 1887 and has a population of approximately 1,000 people.
History
Hudson was founded in 1887 by a group of settlers from the Midwest. The town was named after the Hudson River in New York, and was originally intended to be a stop on the Union Pacific Railroad. The railroad was completed in 1887, and the town quickly grew. The first post office was established in 1888, and the first school was built in 1889.
The town was incorporated in 1890, and the first mayor was elected in 1891. The town continued to grow, and by 1900, it had a population of over 500 people. The town was home to several businesses, including a hotel, a bank, a general store, and a blacksmith shop.
In the early 1900s, the town was a popular destination for tourists, and it was known for its beautiful scenery and outdoor activities. The town was also home to several ranches, and it was a popular spot for hunting and fishing.
Geography
Hudson is located in the southeastern corner of Wyoming, near the border of Nebraska and Colorado. It is situated in the Laramie River Valley, and is surrounded by rolling hills and prairies. The town is located at an elevation of 5,400 feet, and the average temperature is around 50 degrees Fahrenheit.
The town is located near several natural attractions, including the Medicine Bow National Forest, the Snowy Range, and the Laramie Mountains. The town is also close to several major cities, including Denver, Colorado and Cheyenne, Wyoming.
Economy
Hudson’s economy is largely based on agriculture and tourism. The town is home to several ranches, and it is a popular destination for hunters and fishermen. The town is also home to several businesses, including a hotel, a bank, a general store, and a blacksmith shop.
The town is also home to several manufacturing companies, including a furniture factory and a metal fabrication plant. The town is also home to several small businesses, including restaurants, bars, and retail stores.
Demographics
As of the 2010 census, the population of Hudson was 1,000 people. The town is predominantly white, with a small Hispanic population. The median household income is $45,000, and the median age is 40 years old.
The town is home to several churches, including the First Baptist Church, the United Methodist Church, and the Church of Jesus Christ of Latter-day Saints. The town is also home to several schools, including the Hudson Elementary School, the Hudson Middle School, and the Hudson High School.
Conclusion
Hudson, Wyoming is a small town located in the southeastern corner of the state, near the border of Nebraska and Colorado. It is situated in the Laramie River Valley, and is surrounded by rolling hills and prairies. The town was founded in 1887 and has a population of approximately 1,000 people. The town’s economy is largely based on agriculture and tourism, and it is home to several businesses, churches, and schools.
Common Questions
What is Per Capita Income in Hudson?
Per Capita income in Hudson is $29,750.
What is the Median Family Income in Hudson?
Median Family Income in Hudson is $78,750.
What is the Median Household income in Hudson?
Median Household Income in Hudson is $52,750.
What is Income or Wage Gap in Hudson?
Income or Wage Gap in Hudson is 47.2%.
Women in Hudson earn 52.8 cents for every dollar earned by a man.
What is Inequality or Gini Index in Hudson?
Inequality or Gini Index in Hudson is 0.40.
What is the Total Population of Hudson?
Total Population of Hudson is 463.
What is the Total Male Population of Hudson?
Total Male Population of Hudson is 205.
What is the Total Female Population of Hudson?
Total Female Population of Hudson is 258.
What is the Ratio of Males per 100 Females in Hudson?
There are 79.46 Males per 100 Females in Hudson.
What is the Ratio of Females per 100 Males in Hudson?
There are 125.85 Females per 100 Males in Hudson.
What is the Median Population Age in Hudson?
Median Population Age in Hudson is 40.2 Years.
What is the Average Family Size in Hudson
Average Family Size in Hudson is 3.2 People.
What is the Average Household Size in Hudson
Average Household Size in Hudson is 2.5 People.
How Large is the Labor Force in Hudson?
There are 243 People in the Labor Forcein in Hudson.
What is the Percentage of People in the Labor Force in Hudson?
62.3% of People are in the Labor Force in Hudson.
What is the Unemployment Rate in Hudson?
Unemployment Rate in Hudson is 4.6%.