Greybull, WY Map & Demographics
Greybull Map
Greybull Overview
$24,771
PER CAPITA INCOME
$81,691
AVG FAMILY INCOME
$64,000
AVG HOUSEHOLD INCOME
15.1%
WAGE / INCOME GAP [ % ]
84.9¢/ $1
WAGE / INCOME GAP [ $ ]
0.38
INEQUALITY / GINI INDEX
2,145
TOTAL POPULATION
1,018
MALE POPULATION
1,127
FEMALE POPULATION
90.33
MALES / 100 FEMALES
110.71
FEMALES / 100 MALES
38.3
MEDIAN AGE
4.0
AVG FAMILY SIZE
2.9
AVG HOUSEHOLD SIZE
1,015
LABOR FORCE [ PEOPLE ]
62.4%
PERCENT IN LABOR FORCE
12.1%
UNEMPLOYMENT RATE
Greybull Zip Codes
Greybull Area Codes
Income in Greybull
Income Overview in Greybull
Per Capita Income in Greybull is $24,771, while median incomes of families and households are $81,691 and $64,000 respectively.
| Characteristic | Number | Measure |
| Per Capita Income | 2,145 | $24,771 |
| Median Family Income | 457 | $81,691 |
| Mean Family Income | 457 | $85,491 |
| Median Household Income | 740 | $64,000 |
| Mean Household Income | 740 | $66,704 |
| Income Deficit | 457 | $0 |
| Wage / Income Gap (%) | 2,145 | 15.10% |
| Wage / Income Gap ($) | 2,145 | 84.90¢ per $1 |
| Gini / Inequality Index | 2,145 | 0.38 |
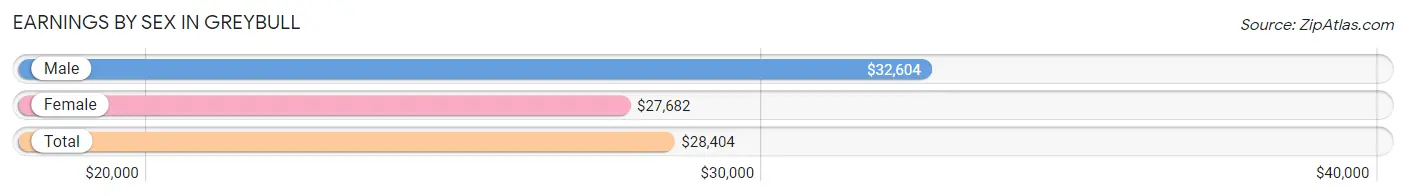
Earnings by Sex in Greybull
Average Earnings in Greybull are $28,404, $32,604 for men and $27,682 for women, a difference of 15.1%.
| Sex | Number | Average Earnings |
| Male | 585 (57.0%) | $32,604 |
| Female | 442 (43.0%) | $27,682 |
| Total | 1,027 (100.0%) | $28,404 |
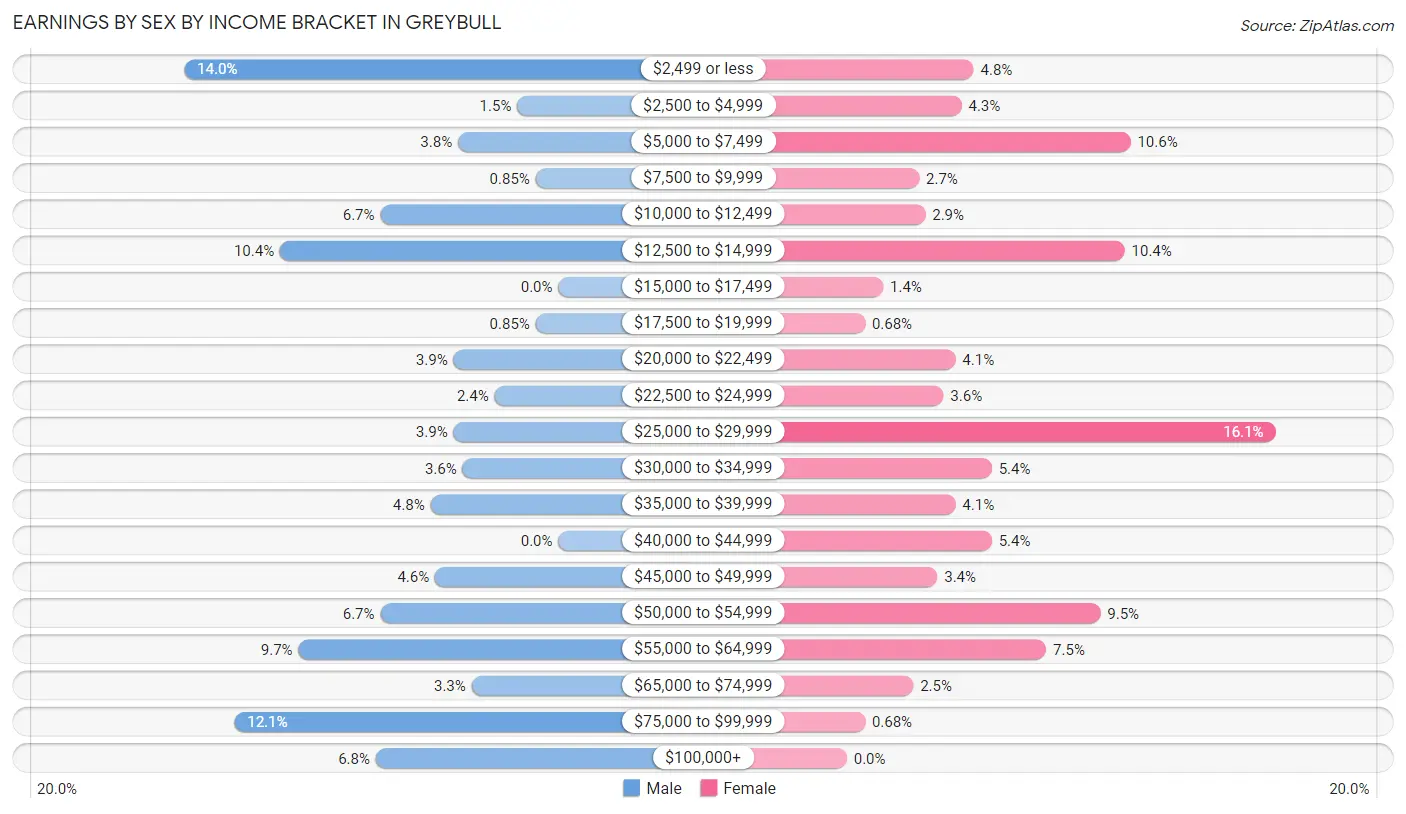
Earnings by Sex by Income Bracket in Greybull
The most common earnings brackets in Greybull are $2,499 or less for men (82 | 14.0%) and $25,000 to $29,999 for women (71 | 16.1%).
| Income | Male | Female |
| $2,499 or less | 82 (14.0%) | 21 (4.8%) |
| $2,500 to $4,999 | 9 (1.5%) | 19 (4.3%) |
| $5,000 to $7,499 | 22 (3.8%) | 47 (10.6%) |
| $7,500 to $9,999 | 5 (0.9%) | 12 (2.7%) |
| $10,000 to $12,499 | 39 (6.7%) | 13 (2.9%) |
| $12,500 to $14,999 | 61 (10.4%) | 46 (10.4%) |
| $15,000 to $17,499 | 0 (0.0%) | 6 (1.4%) |
| $17,500 to $19,999 | 5 (0.9%) | 3 (0.7%) |
| $20,000 to $22,499 | 23 (3.9%) | 18 (4.1%) |
| $22,500 to $24,999 | 14 (2.4%) | 16 (3.6%) |
| $25,000 to $29,999 | 23 (3.9%) | 71 (16.1%) |
| $30,000 to $34,999 | 21 (3.6%) | 24 (5.4%) |
| $35,000 to $39,999 | 28 (4.8%) | 18 (4.1%) |
| $40,000 to $44,999 | 0 (0.0%) | 24 (5.4%) |
| $45,000 to $49,999 | 27 (4.6%) | 15 (3.4%) |
| $50,000 to $54,999 | 39 (6.7%) | 42 (9.5%) |
| $55,000 to $64,999 | 57 (9.7%) | 33 (7.5%) |
| $65,000 to $74,999 | 19 (3.3%) | 11 (2.5%) |
| $75,000 to $99,999 | 71 (12.1%) | 3 (0.7%) |
| $100,000+ | 40 (6.8%) | 0 (0.0%) |
| Total | 585 (100.0%) | 442 (100.0%) |
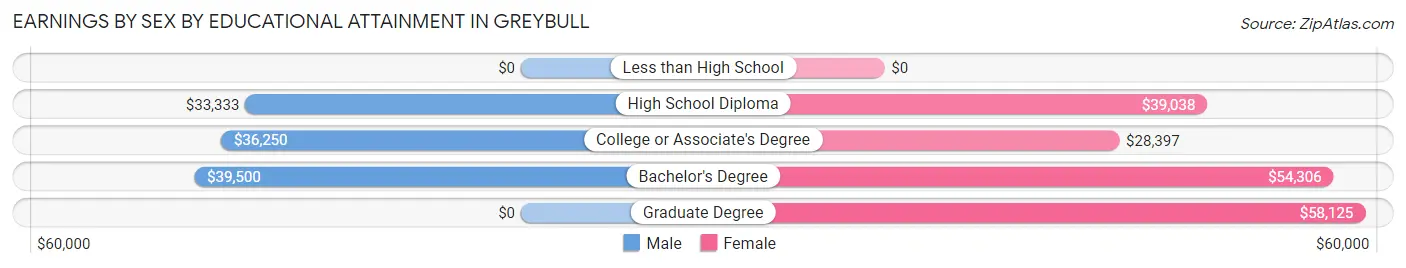
Earnings by Sex by Educational Attainment in Greybull
Average earnings in Greybull are $37,946 for men and $28,977 for women, a difference of 23.6%. Men with an educational attainment of bachelor's degree enjoy the highest average annual earnings of $39,500, while those with high school diploma education earn the least with $33,333. Women with an educational attainment of graduate degree earn the most with the average annual earnings of $58,125, while those with college or associate's degree education have the smallest earnings of $28,397.
| Educational Attainment | Male Income | Female Income |
| Less than High School | - | - |
| High School Diploma | $33,333 | $39,038 |
| College or Associate's Degree | $36,250 | $28,397 |
| Bachelor's Degree | $39,500 | $54,306 |
| Graduate Degree | - | - |
| Total | $37,946 | $28,977 |
Family Income in Greybull
Family Income Brackets in Greybull
According to the Greybull family income data, there are 136 families falling into the $75,000 to $99,999 income range, which is the most common income bracket and makes up 29.8% of all families. Conversely, the $200,000+ income bracket is the least frequent group with only 6 families (1.3%) belonging to this category.
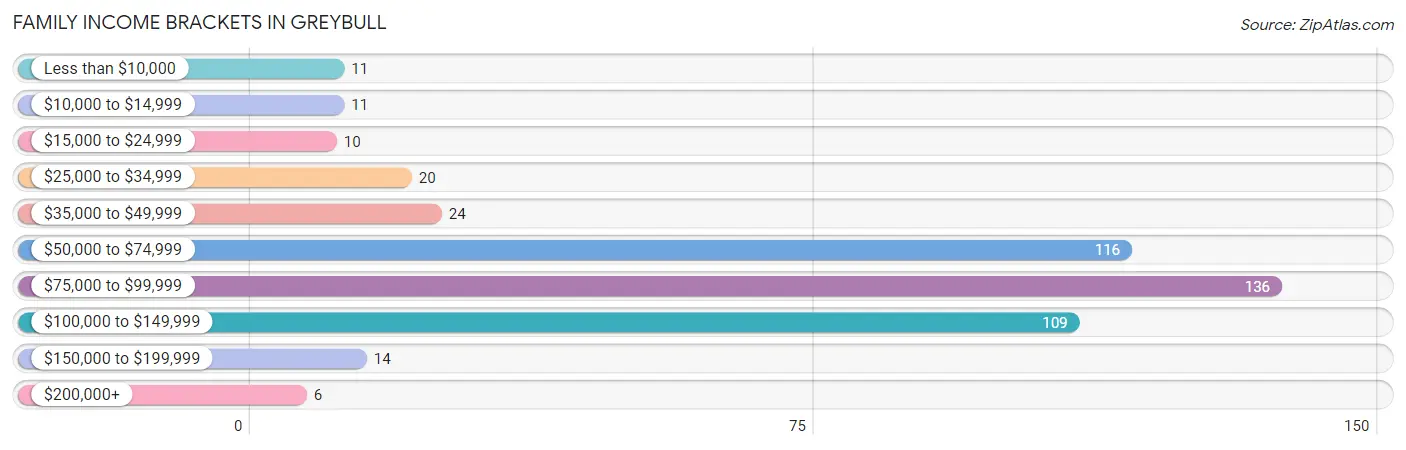
| Income Bracket | # Families | % Families |
| Less than $10,000 | 11 | 2.4% |
| $10,000 to $14,999 | 11 | 2.4% |
| $15,000 to $24,999 | 10 | 2.2% |
| $25,000 to $34,999 | 20 | 4.4% |
| $35,000 to $49,999 | 24 | 5.3% |
| $50,000 to $74,999 | 116 | 25.4% |
| $75,000 to $99,999 | 136 | 29.8% |
| $100,000 to $149,999 | 109 | 23.9% |
| $150,000 to $199,999 | 14 | 3.1% |
| $200,000+ | 6 | 1.3% |
Family Income by Famaliy Size in Greybull
5-person families (49 | 10.7%) account for the highest median family income in Greybull with $94,712 per family, while 2-person families (225 | 49.2%) have the highest median income of $39,062 per family member.
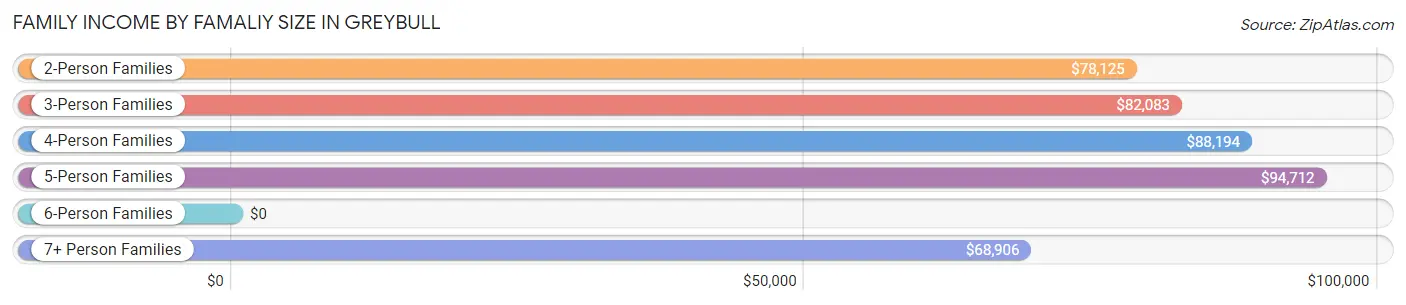
| Income Bracket | # Families | Median Income |
| 2-Person Families | 225 (49.2%) | $78,125 |
| 3-Person Families | 73 (16.0%) | $82,083 |
| 4-Person Families | 73 (16.0%) | $88,194 |
| 5-Person Families | 49 (10.7%) | $94,712 |
| 6-Person Families | 8 (1.8%) | $0 |
| 7+ Person Families | 29 (6.4%) | $68,906 |
| Total | 457 (100.0%) | $81,691 |
Family Income by Number of Earners in Greybull
The median family income in Greybull is $81,691, with families comprising 3+ earners (37) having the highest median family income of $97,917, while families with no earners (82) have the lowest median family income of $61,071, accounting for 8.1% and 17.9% of families, respectively.
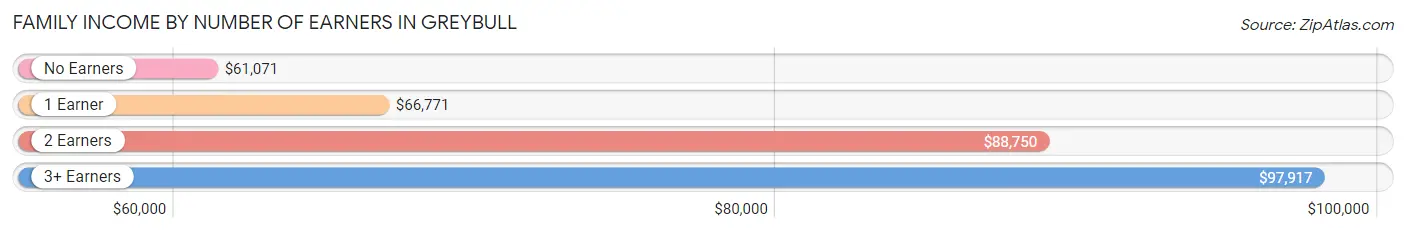
| Number of Earners | # Families | Median Income |
| No Earners | 82 (17.9%) | $61,071 |
| 1 Earner | 131 (28.7%) | $66,771 |
| 2 Earners | 207 (45.3%) | $88,750 |
| 3+ Earners | 37 (8.1%) | $97,917 |
| Total | 457 (100.0%) | $81,691 |
Household Income in Greybull
Household Income Brackets in Greybull
With 172 households falling in the category, the $75,000 to $99,999 income range is the most frequent in Greybull, accounting for 23.2% of all households. In contrast, only 10 households (1.3%) fall into the $200,000+ income bracket, making it the least populous group.
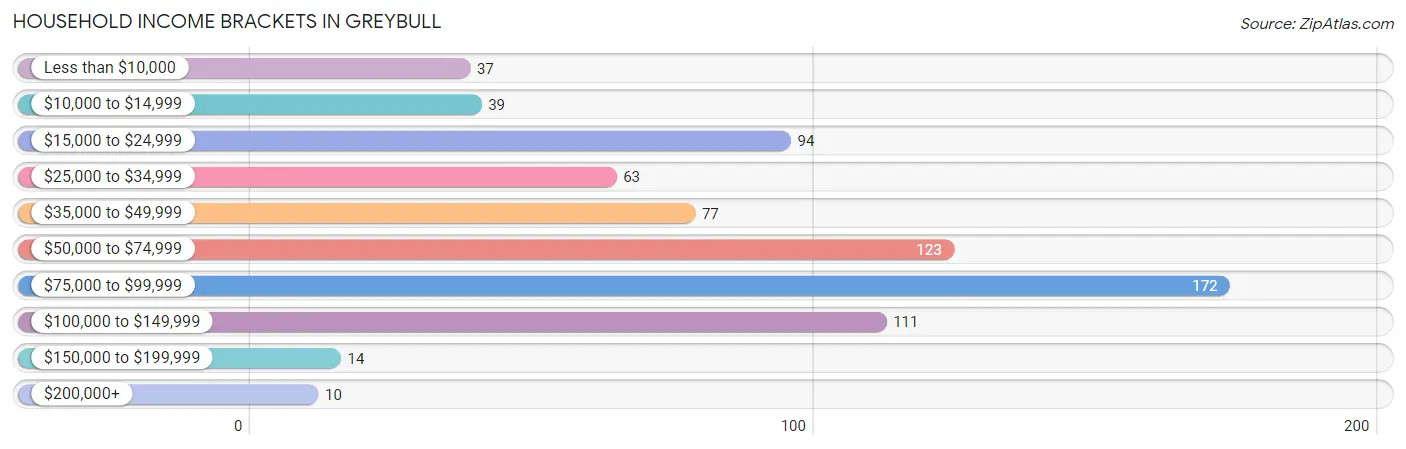
| Income Bracket | # Households | % Households |
| Less than $10,000 | 37 | 5.0% |
| $10,000 to $14,999 | 39 | 5.3% |
| $15,000 to $24,999 | 94 | 12.7% |
| $25,000 to $34,999 | 63 | 8.5% |
| $35,000 to $49,999 | 77 | 10.4% |
| $50,000 to $74,999 | 123 | 16.6% |
| $75,000 to $99,999 | 172 | 23.2% |
| $100,000 to $149,999 | 111 | 15.0% |
| $150,000 to $199,999 | 14 | 1.9% |
| $200,000+ | 10 | 1.4% |
Household Income by Householder Age in Greybull
The median household income in Greybull is $64,000, with the highest median household income of $79,135 found in the 45 to 64 years age bracket for the primary householder. A total of 230 households (31.1%) fall into this category. Meanwhile, the 15 to 24 years age bracket for the primary householder has the lowest median household income of $0, with 14 households (1.9%) in this group.
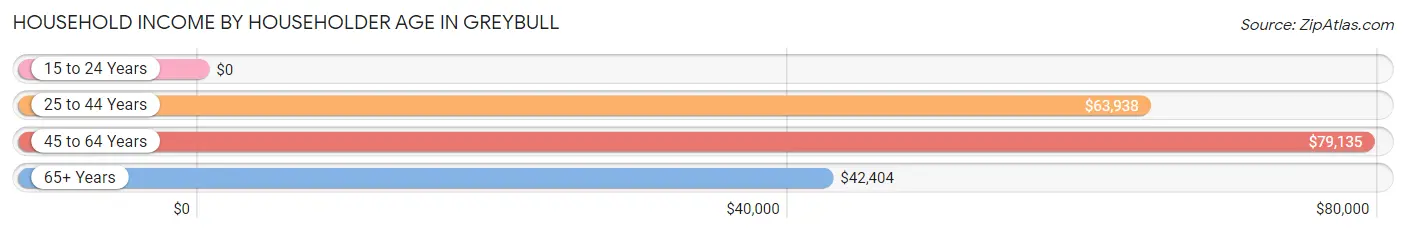
| Income Bracket | # Households | Median Income |
| 15 to 24 Years | 14 (1.9%) | $0 |
| 25 to 44 Years | 217 (29.3%) | $63,938 |
| 45 to 64 Years | 230 (31.1%) | $79,135 |
| 65+ Years | 279 (37.7%) | $42,404 |
| Total | 740 (100.0%) | $64,000 |
Poverty in Greybull
Income Below Poverty by Sex and Age in Greybull
With 10.0% poverty level for males and 10.6% for females among the residents of Greybull, 12 to 14 year old males and under 5 year old females are the most vulnerable to poverty, with 14 males (29.8%) and 26 females (28.3%) in their respective age groups living below the poverty level.
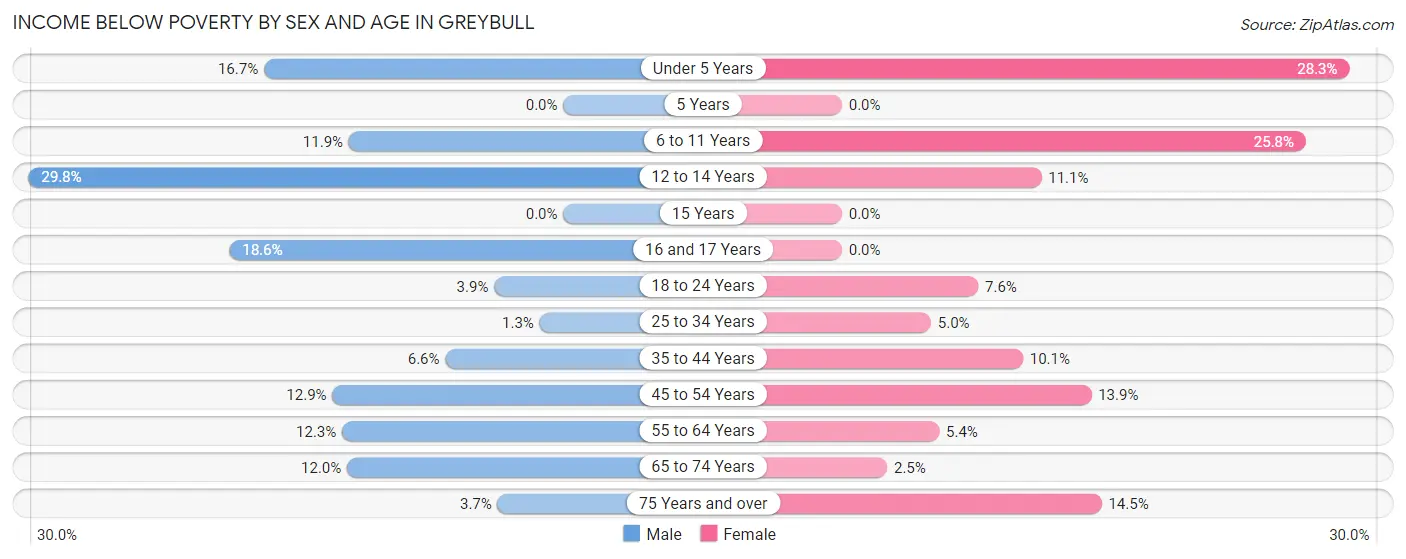
| Age Bracket | Male | Female |
| Under 5 Years | 17 (16.7%) | 26 (28.3%) |
| 5 Years | 0 (0.0%) | 0 (0.0%) |
| 6 to 11 Years | 8 (11.9%) | 23 (25.8%) |
| 12 to 14 Years | 14 (29.8%) | 10 (11.1%) |
| 15 Years | 0 (0.0%) | 0 (0.0%) |
| 16 and 17 Years | 8 (18.6%) | 0 (0.0%) |
| 18 to 24 Years | 2 (3.8%) | 6 (7.6%) |
| 25 to 34 Years | 2 (1.3%) | 7 (5.0%) |
| 35 to 44 Years | 9 (6.6%) | 12 (10.1%) |
| 45 to 54 Years | 9 (12.9%) | 10 (13.9%) |
| 55 to 64 Years | 17 (12.3%) | 9 (5.4%) |
| 65 to 74 Years | 13 (12.0%) | 4 (2.5%) |
| 75 Years and over | 3 (3.7%) | 12 (14.5%) |
| Total | 102 (10.0%) | 119 (10.6%) |
Income Above Poverty by Sex and Age in Greybull
According to the poverty statistics in Greybull, males aged 5 years and females aged 5 years are the age groups that are most secure financially, with 100.0% of males and 100.0% of females in these age groups living above the poverty line.
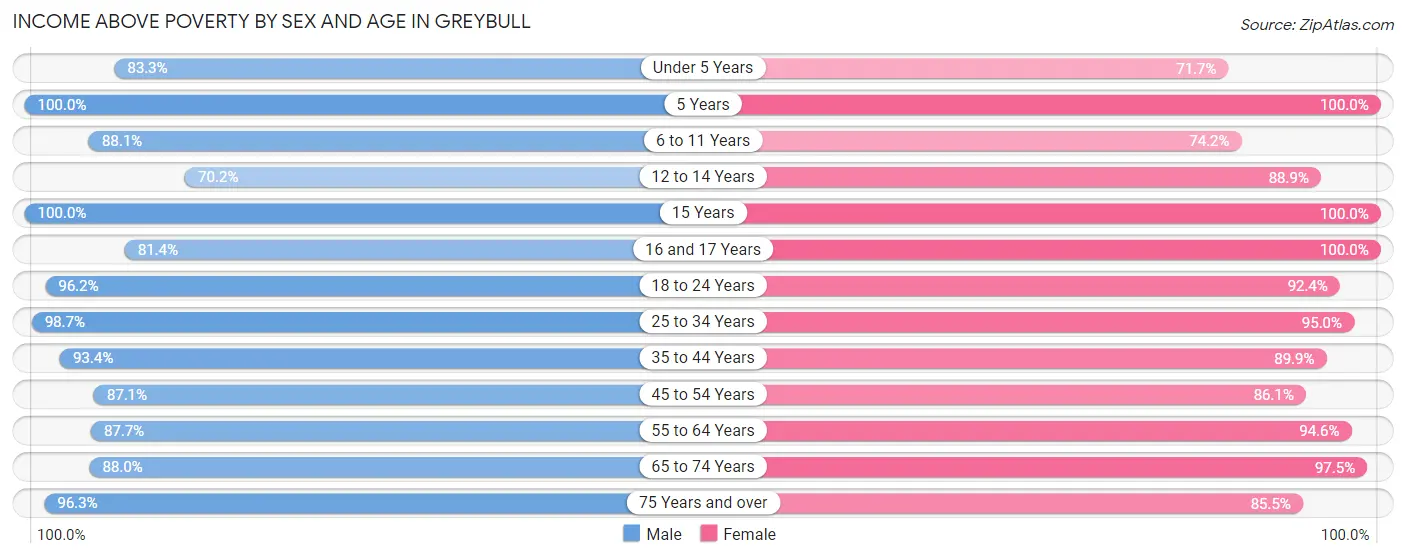
| Age Bracket | Male | Female |
| Under 5 Years | 85 (83.3%) | 66 (71.7%) |
| 5 Years | 7 (100.0%) | 6 (100.0%) |
| 6 to 11 Years | 59 (88.1%) | 66 (74.2%) |
| 12 to 14 Years | 33 (70.2%) | 80 (88.9%) |
| 15 Years | 13 (100.0%) | 5 (100.0%) |
| 16 and 17 Years | 35 (81.4%) | 26 (100.0%) |
| 18 to 24 Years | 50 (96.2%) | 73 (92.4%) |
| 25 to 34 Years | 150 (98.7%) | 134 (95.0%) |
| 35 to 44 Years | 128 (93.4%) | 107 (89.9%) |
| 45 to 54 Years | 61 (87.1%) | 62 (86.1%) |
| 55 to 64 Years | 121 (87.7%) | 157 (94.6%) |
| 65 to 74 Years | 95 (88.0%) | 155 (97.5%) |
| 75 Years and over | 79 (96.3%) | 71 (85.5%) |
| Total | 916 (90.0%) | 1,008 (89.4%) |
Income Below Poverty Among Married-Couple Families in Greybull
The poverty statistics for married-couple families in Greybull show that 1.5% or 6 of the total 400 families live below the poverty line. Families with no children have the highest poverty rate of 1.7%, comprising of 4 families. On the other hand, families with 3 or 4 children have the lowest poverty rate of 0.0%, which includes 0 families.
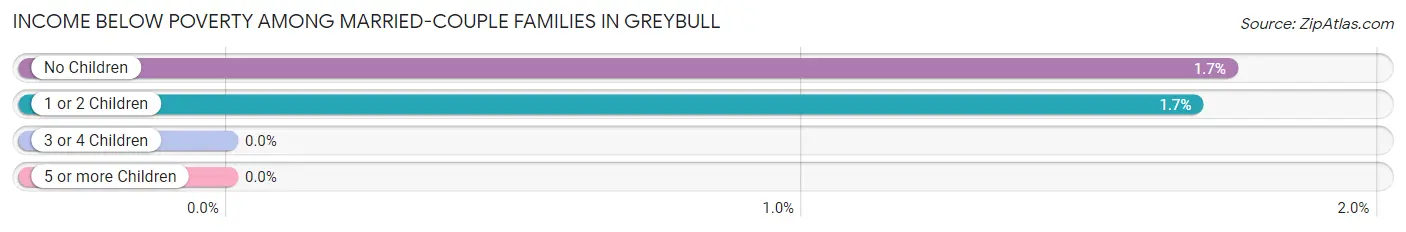
| Children | Above Poverty | Below Poverty |
| No Children | 226 (98.3%) | 4 (1.7%) |
| 1 or 2 Children | 117 (98.3%) | 2 (1.7%) |
| 3 or 4 Children | 41 (100.0%) | 0 (0.0%) |
| 5 or more Children | 10 (100.0%) | 0 (0.0%) |
| Total | 394 (98.5%) | 6 (1.5%) |
Income Below Poverty Among Single-Parent Households in Greybull
According to the poverty data in Greybull, 19.1% or 4 single-father households and 61.1% or 22 single-mother households are living below the poverty line. Among single-father households, those with 3 or 4 children have the highest poverty rate, with 4 households (100.0%) experiencing poverty. Likewise, among single-mother households, those with 3 or 4 children have the highest poverty rate, with 19 households (100.0%) falling below the poverty line.
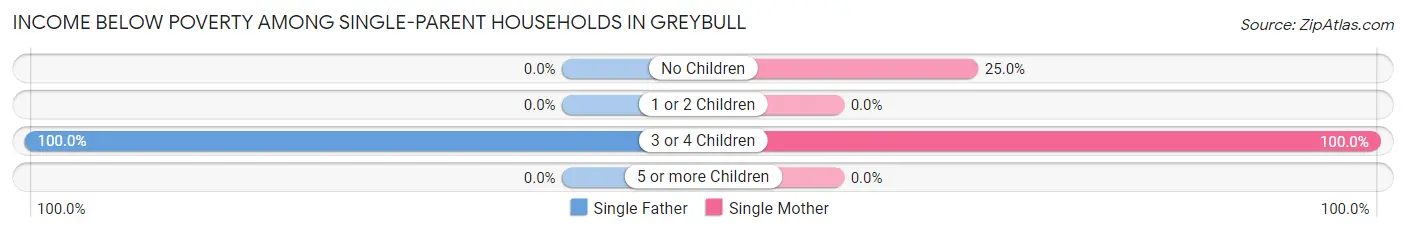
| Children | Single Father | Single Mother |
| No Children | 0 (0.0%) | 3 (25.0%) |
| 1 or 2 Children | 0 (0.0%) | 0 (0.0%) |
| 3 or 4 Children | 4 (100.0%) | 19 (100.0%) |
| 5 or more Children | 0 (0.0%) | 0 (0.0%) |
| Total | 4 (19.1%) | 22 (61.1%) |
Income Below Poverty Among Married-Couple vs Single-Parent Households in Greybull
The poverty data for Greybull shows that 6 of the married-couple family households (1.5%) and 26 of the single-parent households (45.6%) are living below the poverty level. Within the married-couple family households, those with no children have the highest poverty rate, with 4 households (1.7%) falling below the poverty line. Among the single-parent households, those with 3 or 4 children have the highest poverty rate, with 23 household (100.0%) living below poverty.
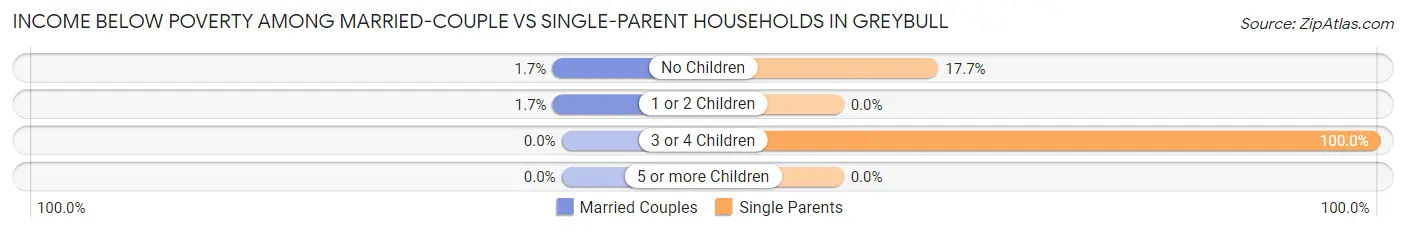
| Children | Married-Couple Families | Single-Parent Households |
| No Children | 4 (1.7%) | 3 (17.6%) |
| 1 or 2 Children | 2 (1.7%) | 0 (0.0%) |
| 3 or 4 Children | 0 (0.0%) | 23 (100.0%) |
| 5 or more Children | 0 (0.0%) | 0 (0.0%) |
| Total | 6 (1.5%) | 26 (45.6%) |
Race in Greybull
The most populous races in Greybull are White / Caucasian (1,665 | 77.6%), Hispanic or Latino (604 | 28.2%), and Some other Race (421 | 19.6%).
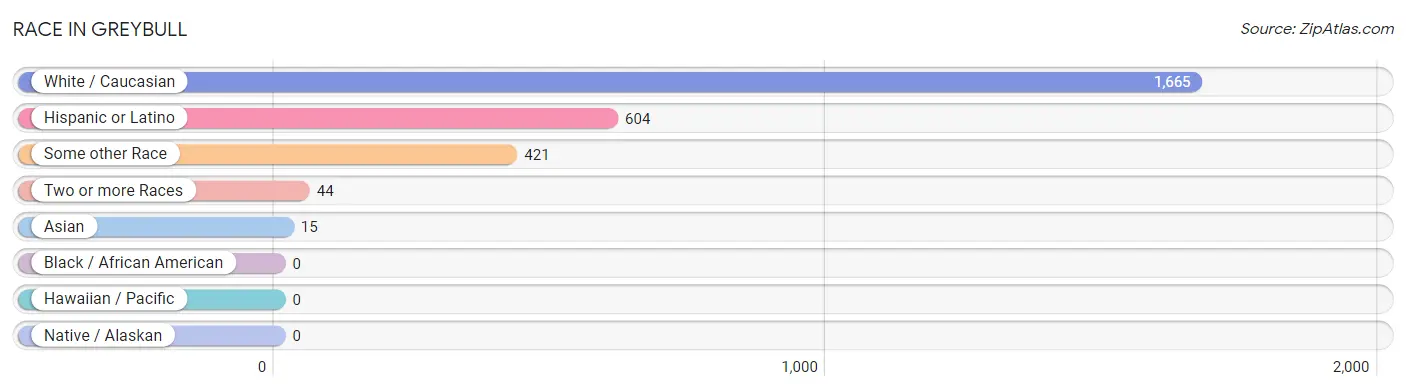
| Race | # Population | % Population |
| Asian | 15 | 0.7% |
| Black / African American | 0 | 0.0% |
| Hawaiian / Pacific | 0 | 0.0% |
| Hispanic or Latino | 604 | 28.2% |
| Native / Alaskan | 0 | 0.0% |
| White / Caucasian | 1,665 | 77.6% |
| Two or more Races | 44 | 2.1% |
| Some other Race | 421 | 19.6% |
| Total | 2,145 | 100.0% |
Ancestry in Greybull
The most populous ancestries reported in Greybull are Mexican (575 | 26.8%), German (478 | 22.3%), English (163 | 7.6%), Irish (137 | 6.4%), and American (116 | 5.4%), together accounting for 68.5% of all Greybull residents.
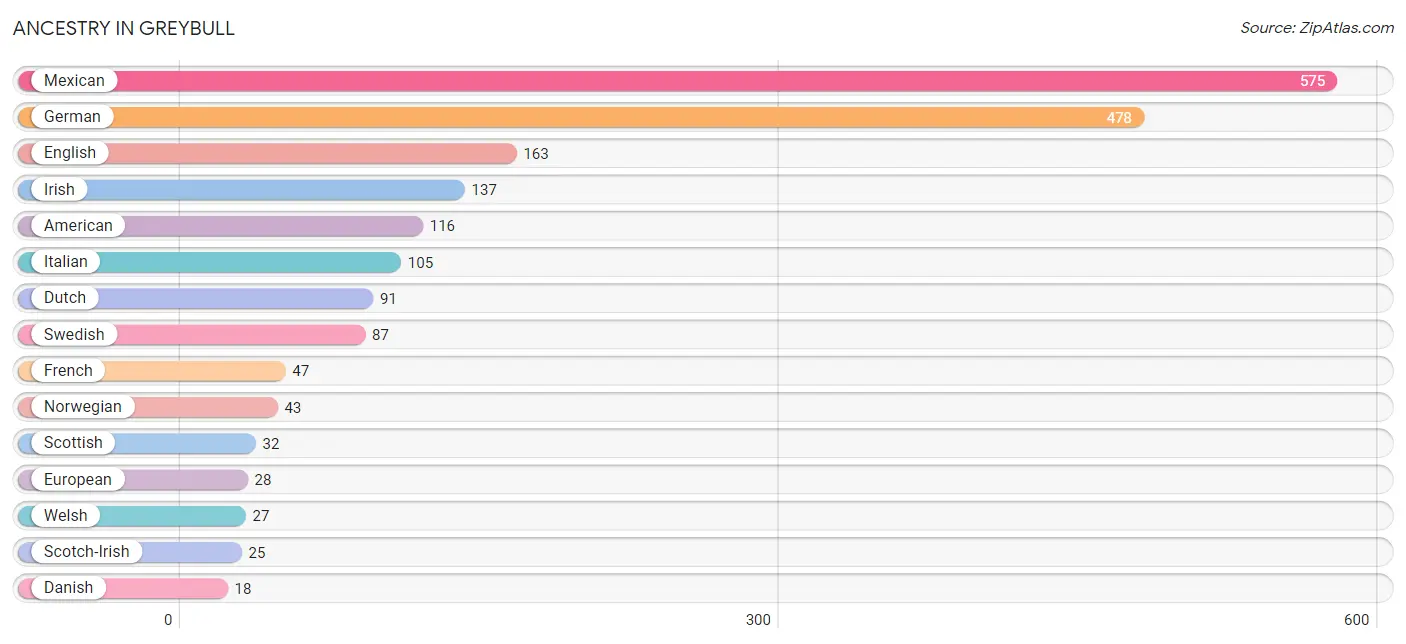
| Ancestry | # Population | % Population |
| American | 116 | 5.4% |
| British | 5 | 0.2% |
| Canadian | 9 | 0.4% |
| Celtic | 3 | 0.1% |
| Czech | 4 | 0.2% |
| Danish | 18 | 0.8% |
| Dutch | 91 | 4.2% |
| English | 163 | 7.6% |
| European | 28 | 1.3% |
| Finnish | 4 | 0.2% |
| French | 47 | 2.2% |
| German | 478 | 22.3% |
| Indian (Asian) | 15 | 0.7% |
| Irish | 137 | 6.4% |
| Italian | 105 | 4.9% |
| Lithuanian | 18 | 0.8% |
| Mexican | 575 | 26.8% |
| Norwegian | 43 | 2.0% |
| Pennsylvania German | 3 | 0.1% |
| Polish | 4 | 0.2% |
| Portuguese | 3 | 0.1% |
| Russian | 14 | 0.6% |
| Scandinavian | 6 | 0.3% |
| Scotch-Irish | 25 | 1.2% |
| Scottish | 32 | 1.5% |
| Spanish | 10 | 0.5% |
| Swedish | 87 | 4.1% |
| Swiss | 2 | 0.1% |
| Welsh | 27 | 1.3% |
| Yugoslavian | 3 | 0.1% | View All 30 Rows |
Immigrants in Greybull
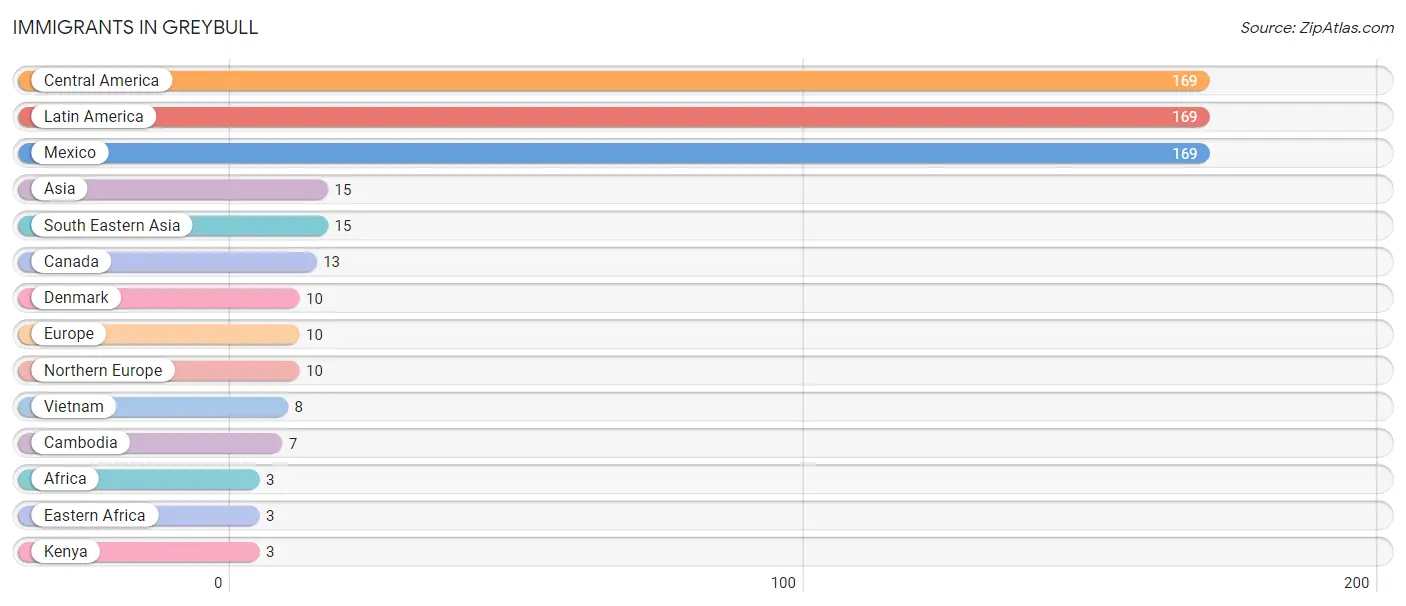
The most numerous immigrant groups reported in Greybull came from Central America (169 | 7.9%), Latin America (169 | 7.9%), Mexico (169 | 7.9%), Asia (15 | 0.7%), and South Eastern Asia (15 | 0.7%), together accounting for 25.0% of all Greybull residents.
| Immigration Origin | # Population | % Population |
| Africa | 3 | 0.1% |
| Asia | 15 | 0.7% |
| Cambodia | 7 | 0.3% |
| Canada | 13 | 0.6% |
| Central America | 169 | 7.9% |
| Denmark | 10 | 0.5% |
| Eastern Africa | 3 | 0.1% |
| Europe | 10 | 0.5% |
| Kenya | 3 | 0.1% |
| Latin America | 169 | 7.9% |
| Mexico | 169 | 7.9% |
| Northern Europe | 10 | 0.5% |
| South Eastern Asia | 15 | 0.7% |
| Vietnam | 8 | 0.4% | View All 14 Rows |
Sex and Age in Greybull
Sex and Age in Greybull
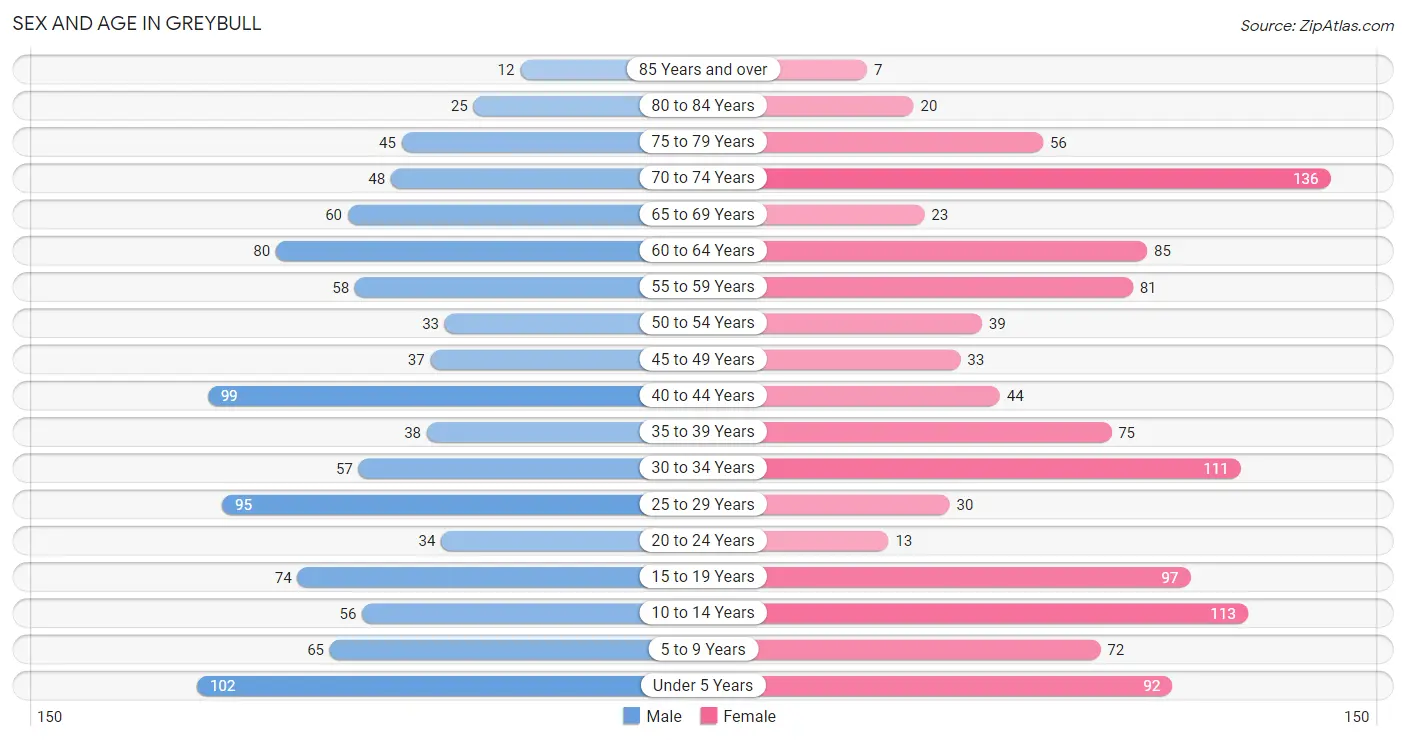
The most populous age groups in Greybull are Under 5 Years (102 | 10.0%) for men and 70 to 74 Years (136 | 12.1%) for women.
| Age Bracket | Male | Female |
| Under 5 Years | 102 (10.0%) | 92 (8.2%) |
| 5 to 9 Years | 65 (6.4%) | 72 (6.4%) |
| 10 to 14 Years | 56 (5.5%) | 113 (10.0%) |
| 15 to 19 Years | 74 (7.3%) | 97 (8.6%) |
| 20 to 24 Years | 34 (3.3%) | 13 (1.1%) |
| 25 to 29 Years | 95 (9.3%) | 30 (2.7%) |
| 30 to 34 Years | 57 (5.6%) | 111 (9.9%) |
| 35 to 39 Years | 38 (3.7%) | 75 (6.7%) |
| 40 to 44 Years | 99 (9.7%) | 44 (3.9%) |
| 45 to 49 Years | 37 (3.6%) | 33 (2.9%) |
| 50 to 54 Years | 33 (3.2%) | 39 (3.5%) |
| 55 to 59 Years | 58 (5.7%) | 81 (7.2%) |
| 60 to 64 Years | 80 (7.9%) | 85 (7.5%) |
| 65 to 69 Years | 60 (5.9%) | 23 (2.0%) |
| 70 to 74 Years | 48 (4.7%) | 136 (12.1%) |
| 75 to 79 Years | 45 (4.4%) | 56 (5.0%) |
| 80 to 84 Years | 25 (2.5%) | 20 (1.8%) |
| 85 Years and over | 12 (1.2%) | 7 (0.6%) |
| Total | 1,018 (100.0%) | 1,127 (100.0%) |
Families and Households in Greybull
Median Family Size in Greybull
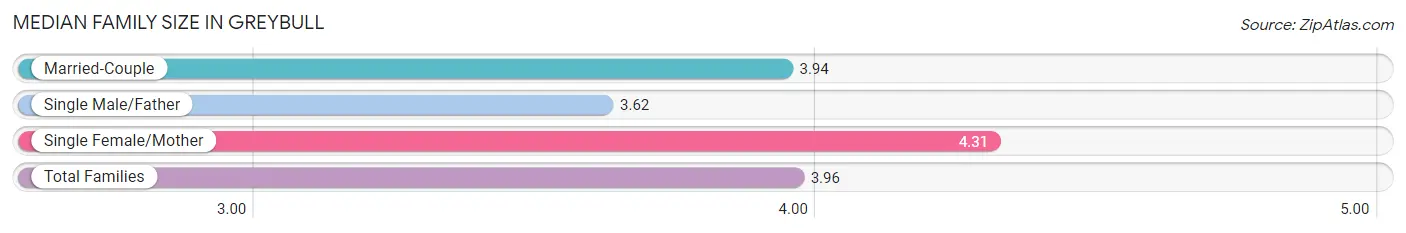
The median family size in Greybull is 3.96 persons per family, with single female/mother families (36 | 7.9%) accounting for the largest median family size of 4.31 persons per family. On the other hand, single male/father families (21 | 4.6%) represent the smallest median family size with 3.62 persons per family.
| Family Type | # Families | Family Size |
| Married-Couple | 400 (87.5%) | 3.94 |
| Single Male/Father | 21 (4.6%) | 3.62 |
| Single Female/Mother | 36 (7.9%) | 4.31 |
| Total Families | 457 (100.0%) | 3.96 |
Median Household Size in Greybull
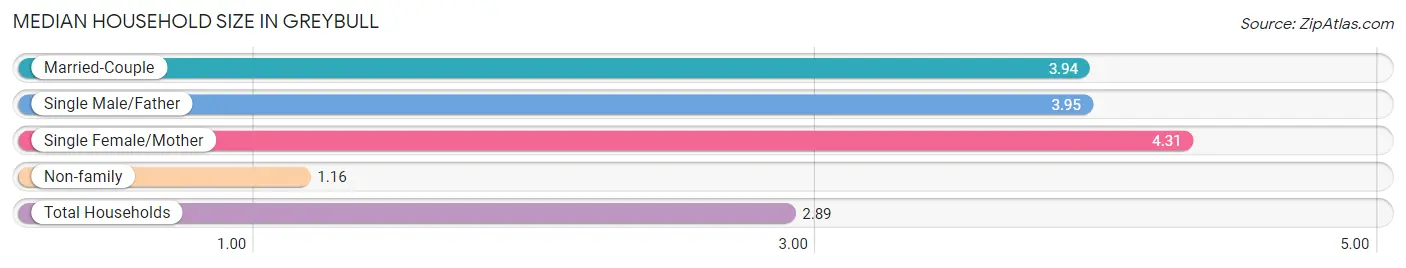
The median household size in Greybull is 2.89 persons per household, with single female/mother households (36 | 4.9%) accounting for the largest median household size of 4.31 persons per household. non-family households (283 | 38.2%) represent the smallest median household size with 1.16 persons per household.
| Household Type | # Households | Household Size |
| Married-Couple | 400 (54.0%) | 3.94 |
| Single Male/Father | 21 (2.8%) | 3.95 |
| Single Female/Mother | 36 (4.9%) | 4.31 |
| Non-family | 283 (38.2%) | 1.16 |
| Total Households | 740 (100.0%) | 2.89 |
Household Size by Marriage Status in Greybull
Out of a total of 740 households in Greybull, 457 (61.8%) are family households, while 283 (38.2%) are nonfamily households. The most numerous type of family households are 2-person households, comprising 225, and the most common type of nonfamily households are 1-person households, comprising 256.
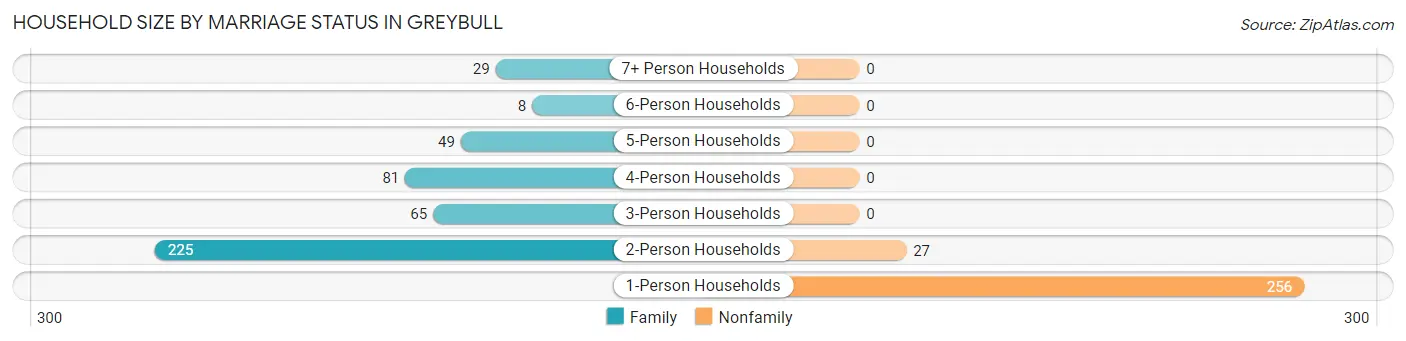
| Household Size | Family Households | Nonfamily Households |
| 1-Person Households | - | 256 (34.6%) |
| 2-Person Households | 225 (30.4%) | 27 (3.6%) |
| 3-Person Households | 65 (8.8%) | 0 (0.0%) |
| 4-Person Households | 81 (11.0%) | 0 (0.0%) |
| 5-Person Households | 49 (6.6%) | 0 (0.0%) |
| 6-Person Households | 8 (1.1%) | 0 (0.0%) |
| 7+ Person Households | 29 (3.9%) | 0 (0.0%) |
| Total | 457 (61.8%) | 283 (38.2%) |
Female Fertility in Greybull
Fertility by Age in Greybull
Average fertility rate in Greybull is 86.0 births per 1,000 women. Women in the age bracket of 20 to 34 years have the highest fertility rate with 234.0 births per 1,000 women. Women in the age bracket of 20 to 34 years acount for 100.0% of all women with births.
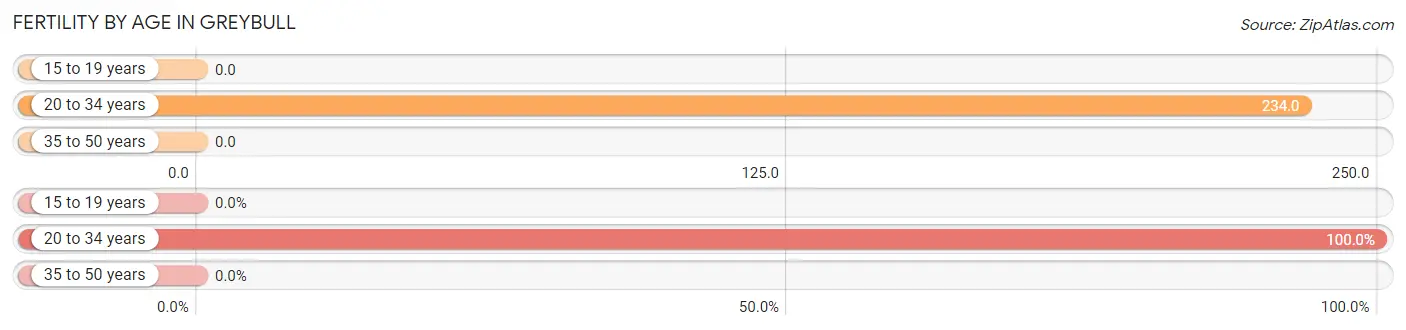
| Age Bracket | Women with Births | Births / 1,000 Women |
| 15 to 19 years | 0 (0.0%) | 0.0 |
| 20 to 34 years | 36 (100.0%) | 234.0 |
| 35 to 50 years | 0 (0.0%) | 0.0 |
| Total | 36 (100.0%) | 86.0 |
Fertility by Age by Marriage Status in Greybull
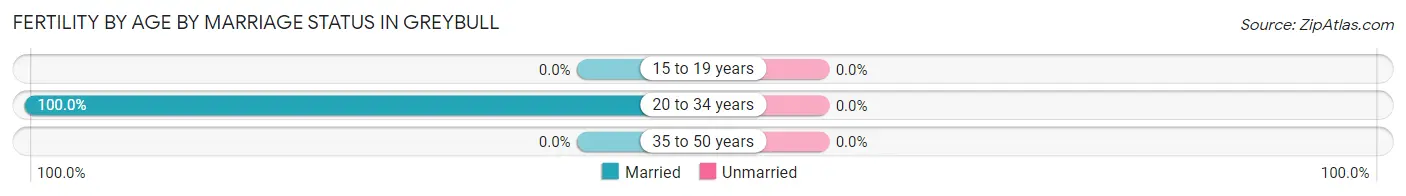
| Age Bracket | Married | Unmarried |
| 15 to 19 years | 0 (0.0%) | 0 (0.0%) |
| 20 to 34 years | 36 (100.0%) | 0 (0.0%) |
| 35 to 50 years | 0 (0.0%) | 0 (0.0%) |
| Total | 36 (100.0%) | 0 (0.0%) |
Fertility by Education in Greybull
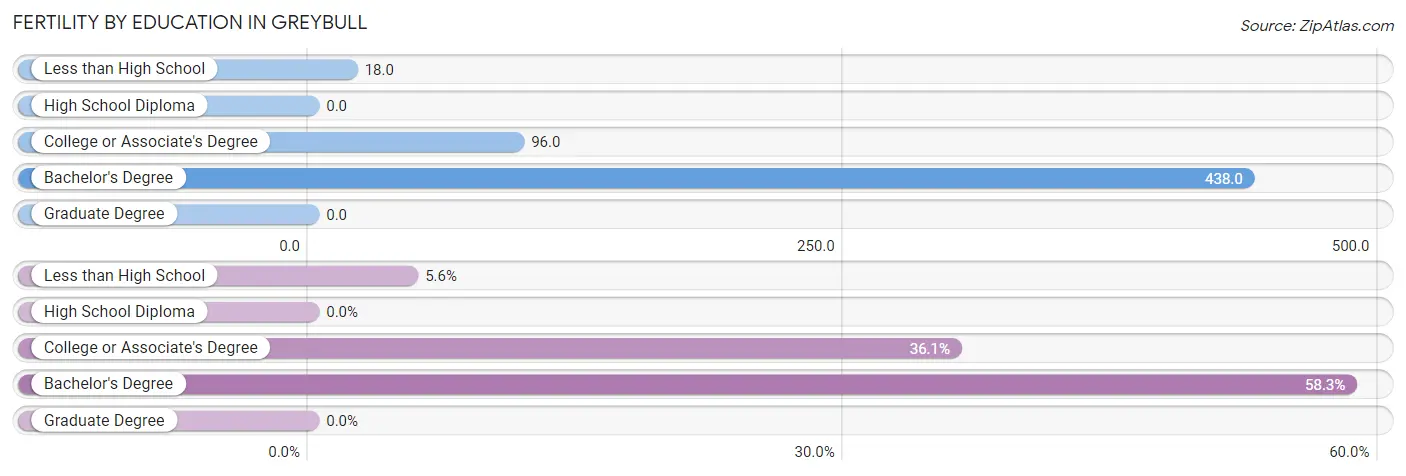
| Educational Attainment | Women with Births | Births / 1,000 Women |
| Less than High School | 2 (5.6%) | 18.0 |
| High School Diploma | 0 (0.0%) | 0.0 |
| College or Associate's Degree | 13 (36.1%) | 96.0 |
| Bachelor's Degree | 21 (58.3%) | 438.0 |
| Graduate Degree | 0 (0.0%) | 0.0 |
| Total | 36 (100.0%) | 86.0 |
Fertility by Education by Marriage Status in Greybull
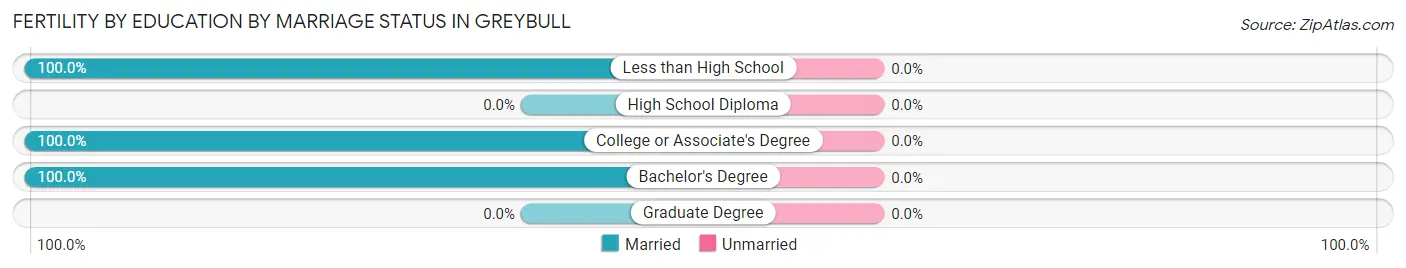
| Educational Attainment | Married | Unmarried |
| Less than High School | 2 (100.0%) | 0 (0.0%) |
| High School Diploma | 0 (0.0%) | 0 (0.0%) |
| College or Associate's Degree | 13 (100.0%) | 0 (0.0%) |
| Bachelor's Degree | 21 (100.0%) | 0 (0.0%) |
| Graduate Degree | 0 (0.0%) | 0 (0.0%) |
| Total | 36 (100.0%) | 0 (0.0%) |
Employment Characteristics in Greybull
Employment by Class of Employer in Greybull
Among the 876 employed individuals in Greybull, private company employees (552 | 63.0%), local government employees (99 | 11.3%), and self-employed (not incorporated) (90 | 10.3%) make up the most common classes of employment.
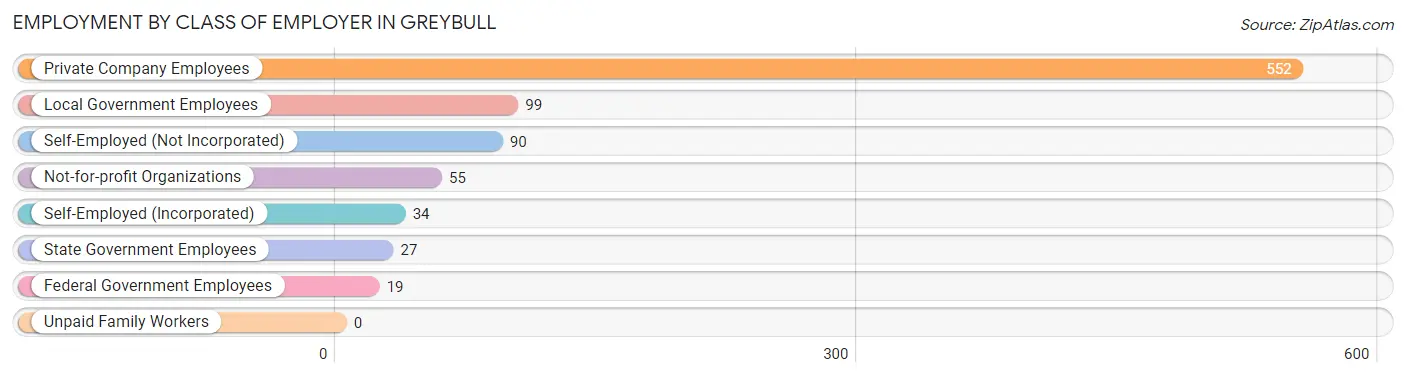
| Employer Class | # Employees | % Employees |
| Private Company Employees | 552 | 63.0% |
| Self-Employed (Incorporated) | 34 | 3.9% |
| Self-Employed (Not Incorporated) | 90 | 10.3% |
| Not-for-profit Organizations | 55 | 6.3% |
| Local Government Employees | 99 | 11.3% |
| State Government Employees | 27 | 3.1% |
| Federal Government Employees | 19 | 2.2% |
| Unpaid Family Workers | 0 | 0.0% |
| Total | 876 | 100.0% |
Employment Status by Age in Greybull
According to the labor force statistics for Greybull, out of the total population over 16 years of age (1,627), 62.4% or 1,015 individuals are in the labor force, with 12.1% or 123 of them unemployed. The age group with the highest labor force participation rate is 45 to 54 years, with 93.7% or 133 individuals in the labor force. Within the labor force, the 16 to 19 years age range has the highest percentage of unemployed individuals, with 39.5% or 30 of them being unemployed.
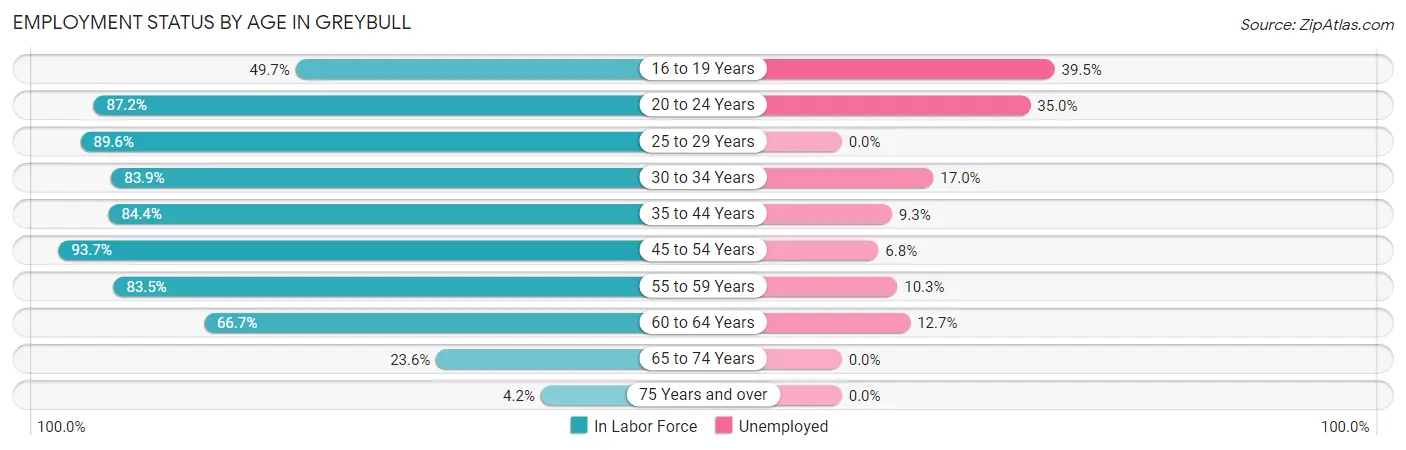
| Age Bracket | In Labor Force | Unemployed |
| 16 to 19 Years | 76 (49.7%) | 30 (39.5%) |
| 20 to 24 Years | 41 (87.2%) | 14 (35.0%) |
| 25 to 29 Years | 112 (89.6%) | 0 (0.0%) |
| 30 to 34 Years | 141 (83.9%) | 24 (17.0%) |
| 35 to 44 Years | 216 (84.4%) | 20 (9.3%) |
| 45 to 54 Years | 133 (93.7%) | 9 (6.8%) |
| 55 to 59 Years | 116 (83.5%) | 12 (10.3%) |
| 60 to 64 Years | 110 (66.7%) | 14 (12.7%) |
| 65 to 74 Years | 63 (23.6%) | 0 (0.0%) |
| 75 Years and over | 7 (4.2%) | 0 (0.0%) |
| Total | 1,015 (62.4%) | 123 (12.1%) |
Employment Status by Educational Attainment in Greybull
According to labor force statistics for Greybull, 83.2% of individuals (828) out of the total population between 25 and 64 years of age (995) are in the labor force, with 9.5% or 79 of them being unemployed. The group with the highest labor force participation rate are those with the educational attainment of bachelor's degree or higher, with 85.3% or 99 individuals in the labor force. Within the labor force, individuals with less than high school education have the highest percentage of unemployment, with 27.7% or 36 of them being unemployed.
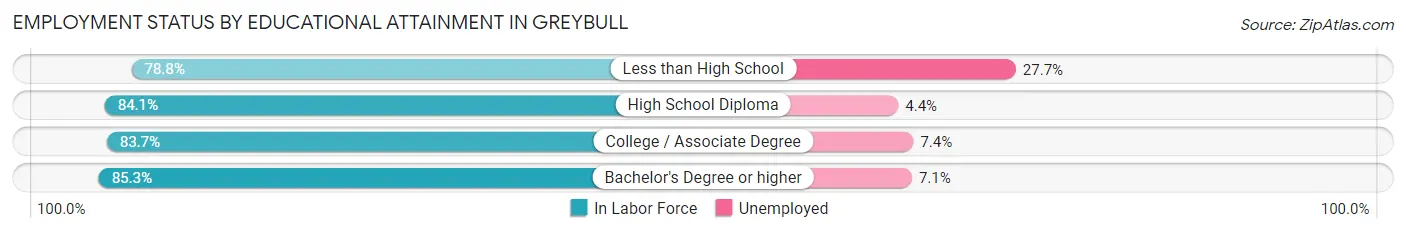
| Educational Attainment | In Labor Force | Unemployed |
| Less than High School | 130 (78.8%) | 46 (27.7%) |
| High School Diploma | 275 (84.1%) | 14 (4.4%) |
| College / Associate Degree | 324 (83.7%) | 29 (7.4%) |
| Bachelor's Degree or higher | 99 (85.3%) | 8 (7.1%) |
| Total | 828 (83.2%) | 95 (9.5%) |
Employment Occupations by Sex in Greybull
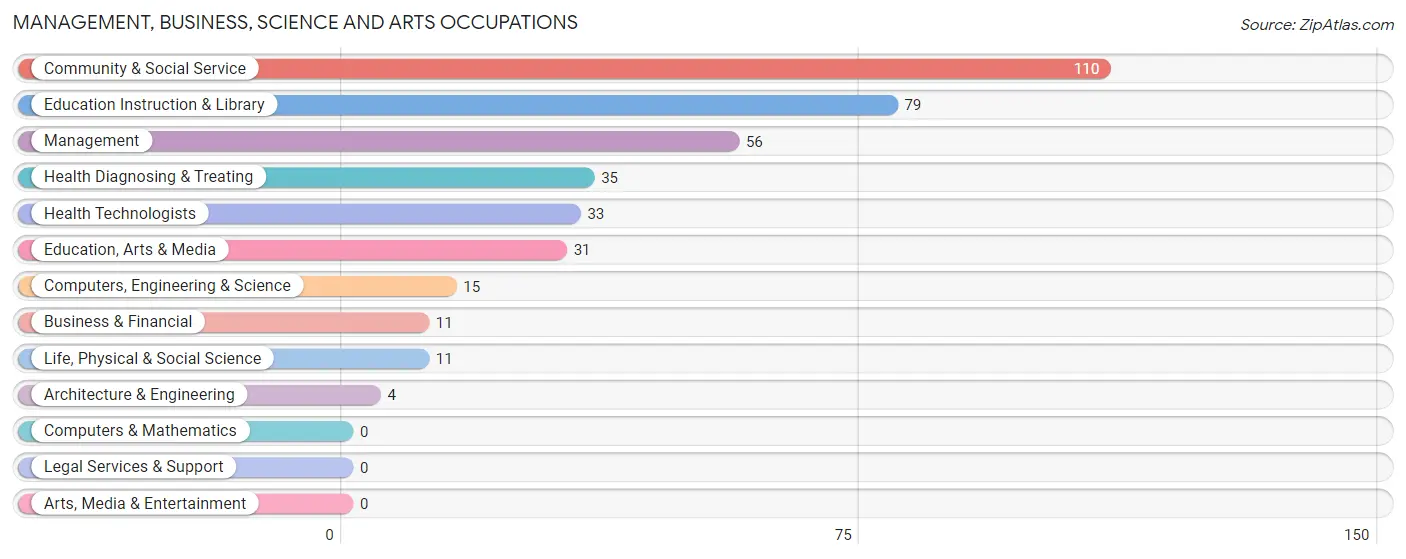
Management, Business, Science and Arts Occupations
The most common Management, Business, Science and Arts occupations in Greybull are Community & Social Service (110 | 12.3%), Education Instruction & Library (79 | 8.9%), Management (56 | 6.3%), Health Diagnosing & Treating (35 | 3.9%), and Health Technologists (33 | 3.7%).
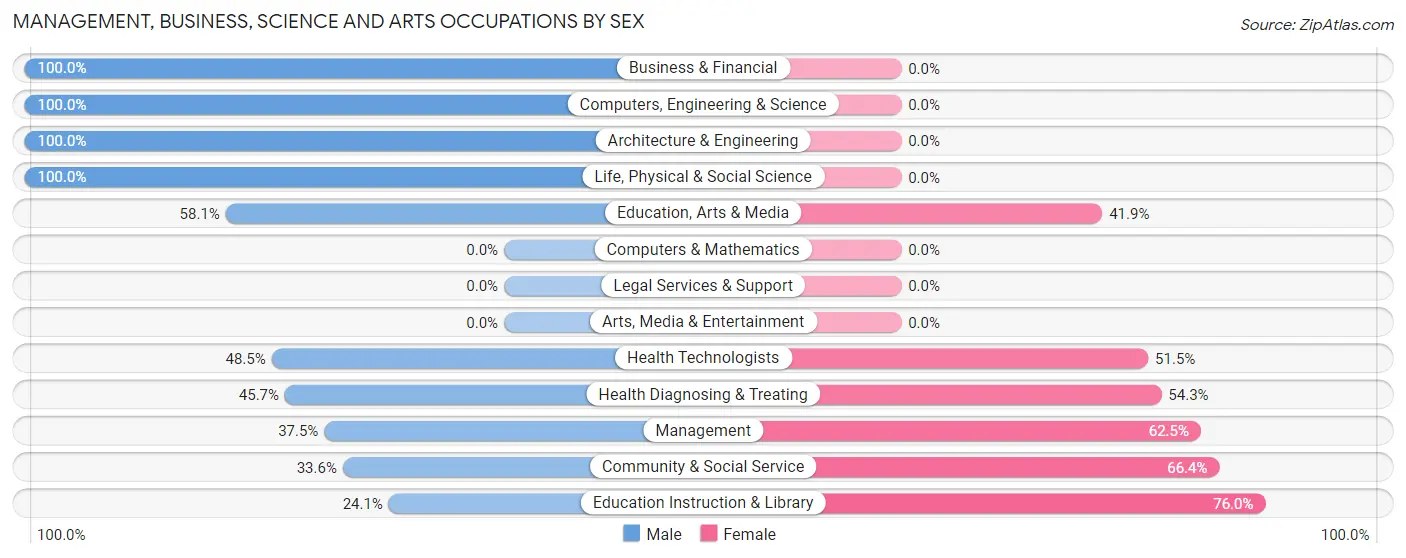
Management, Business, Science and Arts Occupations by Sex
Within the Management, Business, Science and Arts occupations in Greybull, the most male-oriented occupations are Business & Financial (100.0%), Computers, Engineering & Science (100.0%), and Architecture & Engineering (100.0%), while the most female-oriented occupations are Education Instruction & Library (75.9%), Community & Social Service (66.4%), and Management (62.5%).
| Occupation | Male | Female |
| Management | 21 (37.5%) | 35 (62.5%) |
| Business & Financial | 11 (100.0%) | 0 (0.0%) |
| Computers, Engineering & Science | 15 (100.0%) | 0 (0.0%) |
| Computers & Mathematics | 0 (0.0%) | 0 (0.0%) |
| Architecture & Engineering | 4 (100.0%) | 0 (0.0%) |
| Life, Physical & Social Science | 11 (100.0%) | 0 (0.0%) |
| Community & Social Service | 37 (33.6%) | 73 (66.4%) |
| Education, Arts & Media | 18 (58.1%) | 13 (41.9%) |
| Legal Services & Support | 0 (0.0%) | 0 (0.0%) |
| Education Instruction & Library | 19 (24.0%) | 60 (75.9%) |
| Arts, Media & Entertainment | 0 (0.0%) | 0 (0.0%) |
| Health Diagnosing & Treating | 16 (45.7%) | 19 (54.3%) |
| Health Technologists | 16 (48.5%) | 17 (51.5%) |
| Total (Category) | 100 (44.1%) | 127 (55.9%) |
| Total (Overall) | 505 (56.7%) | 386 (43.3%) |
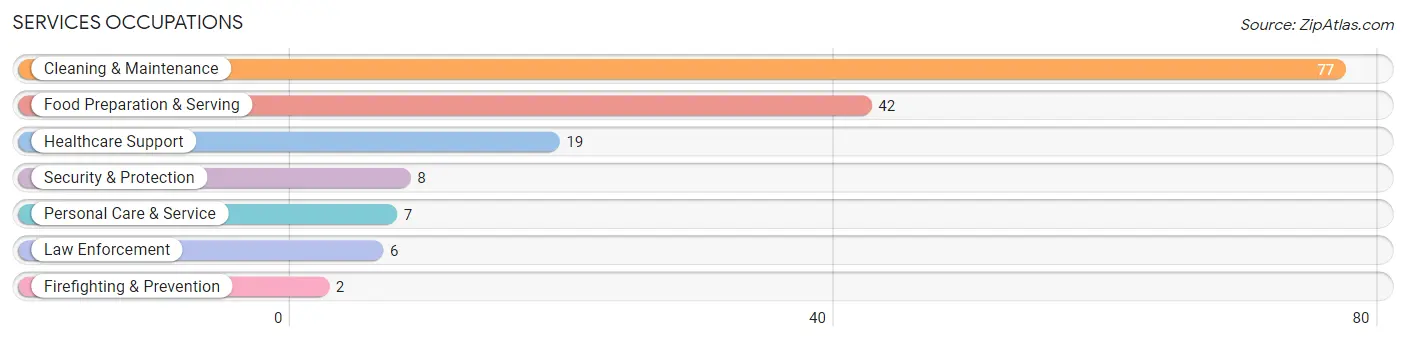
Services Occupations
The most common Services occupations in Greybull are Cleaning & Maintenance (77 | 8.6%), Food Preparation & Serving (42 | 4.7%), Healthcare Support (19 | 2.1%), Security & Protection (8 | 0.9%), and Personal Care & Service (7 | 0.8%).
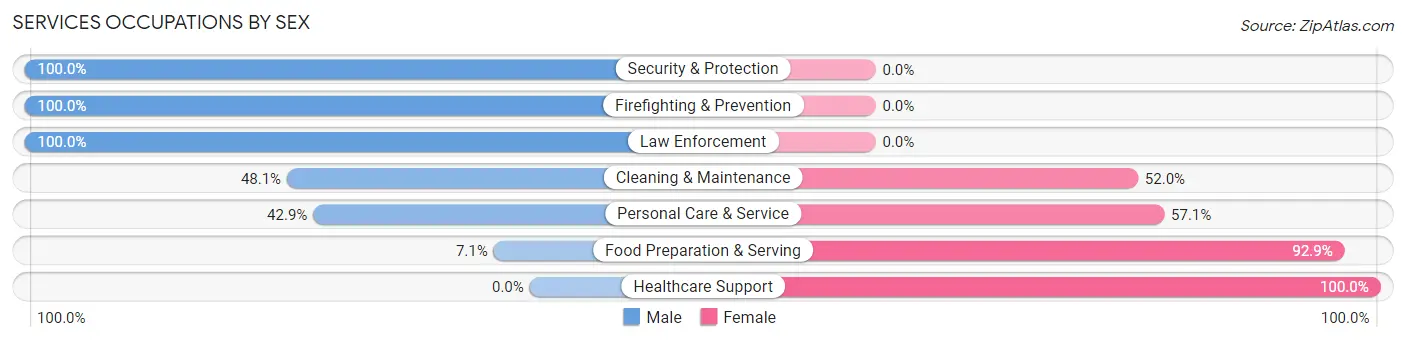
Services Occupations by Sex
Within the Services occupations in Greybull, the most male-oriented occupations are Security & Protection (100.0%), Firefighting & Prevention (100.0%), and Law Enforcement (100.0%), while the most female-oriented occupations are Healthcare Support (100.0%), Food Preparation & Serving (92.9%), and Personal Care & Service (57.1%).
| Occupation | Male | Female |
| Healthcare Support | 0 (0.0%) | 19 (100.0%) |
| Security & Protection | 8 (100.0%) | 0 (0.0%) |
| Firefighting & Prevention | 2 (100.0%) | 0 (0.0%) |
| Law Enforcement | 6 (100.0%) | 0 (0.0%) |
| Food Preparation & Serving | 3 (7.1%) | 39 (92.9%) |
| Cleaning & Maintenance | 37 (48.0%) | 40 (51.9%) |
| Personal Care & Service | 3 (42.9%) | 4 (57.1%) |
| Total (Category) | 51 (33.3%) | 102 (66.7%) |
| Total (Overall) | 505 (56.7%) | 386 (43.3%) |
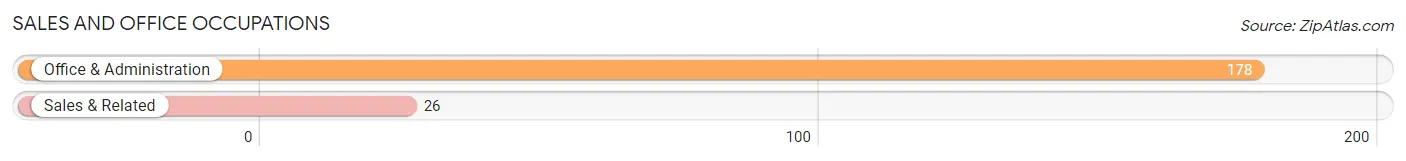
Sales and Office Occupations
The most common Sales and Office occupations in Greybull are Office & Administration (178 | 20.0%), and Sales & Related (26 | 2.9%).
Sales and Office Occupations by Sex
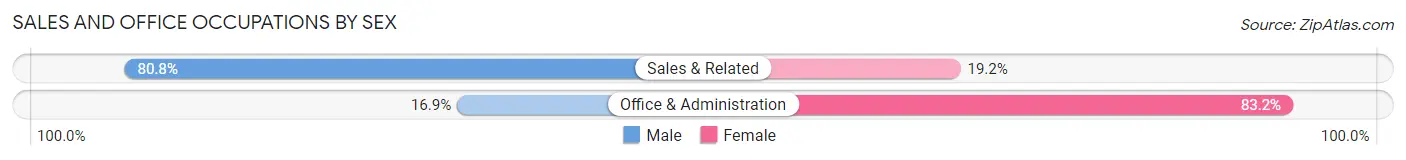
| Occupation | Male | Female |
| Sales & Related | 21 (80.8%) | 5 (19.2%) |
| Office & Administration | 30 (16.9%) | 148 (83.2%) |
| Total (Category) | 51 (25.0%) | 153 (75.0%) |
| Total (Overall) | 505 (56.7%) | 386 (43.3%) |
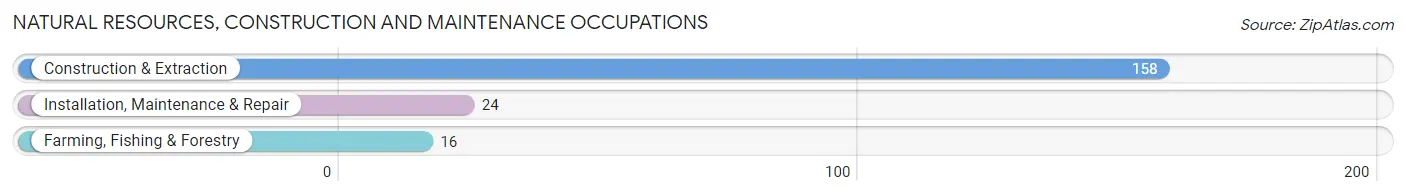
Natural Resources, Construction and Maintenance Occupations
The most common Natural Resources, Construction and Maintenance occupations in Greybull are Construction & Extraction (158 | 17.7%), Installation, Maintenance & Repair (24 | 2.7%), and Farming, Fishing & Forestry (16 | 1.8%).
Natural Resources, Construction and Maintenance Occupations by Sex
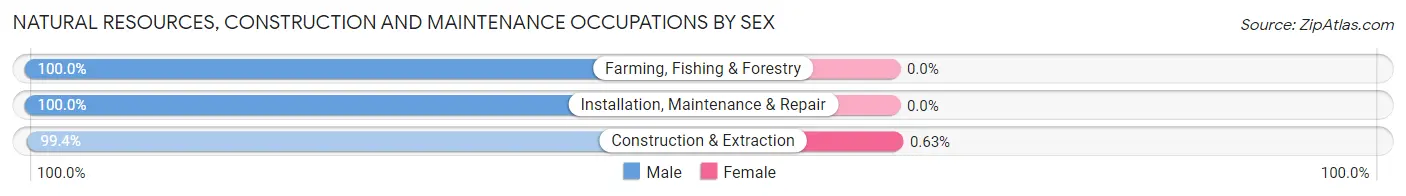
| Occupation | Male | Female |
| Farming, Fishing & Forestry | 16 (100.0%) | 0 (0.0%) |
| Construction & Extraction | 157 (99.4%) | 1 (0.6%) |
| Installation, Maintenance & Repair | 24 (100.0%) | 0 (0.0%) |
| Total (Category) | 197 (99.5%) | 1 (0.5%) |
| Total (Overall) | 505 (56.7%) | 386 (43.3%) |
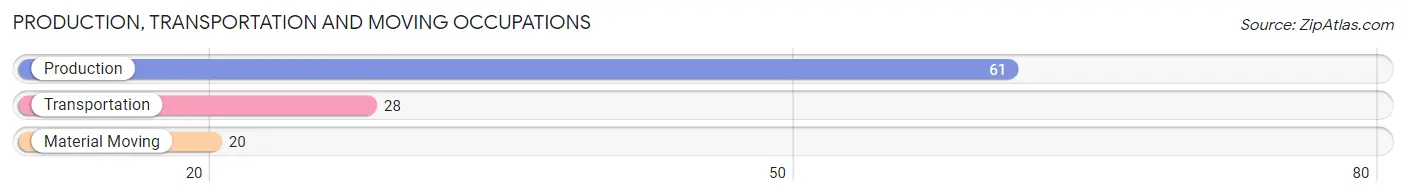
Production, Transportation and Moving Occupations
The most common Production, Transportation and Moving occupations in Greybull are Production (61 | 6.9%), Transportation (28 | 3.1%), and Material Moving (20 | 2.2%).
Production, Transportation and Moving Occupations by Sex
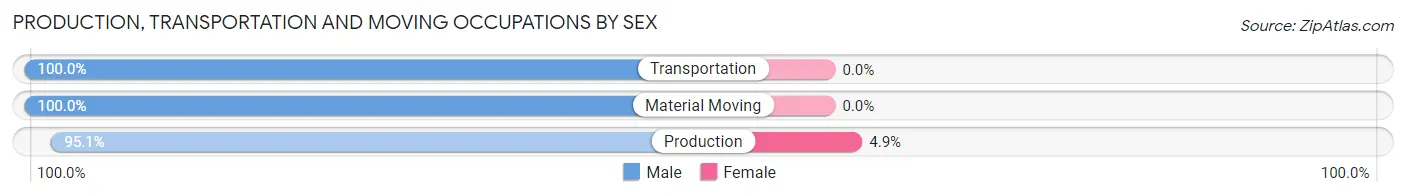
| Occupation | Male | Female |
| Production | 58 (95.1%) | 3 (4.9%) |
| Transportation | 28 (100.0%) | 0 (0.0%) |
| Material Moving | 20 (100.0%) | 0 (0.0%) |
| Total (Category) | 106 (97.3%) | 3 (2.8%) |
| Total (Overall) | 505 (56.7%) | 386 (43.3%) |
Employment Industries by Sex in Greybull
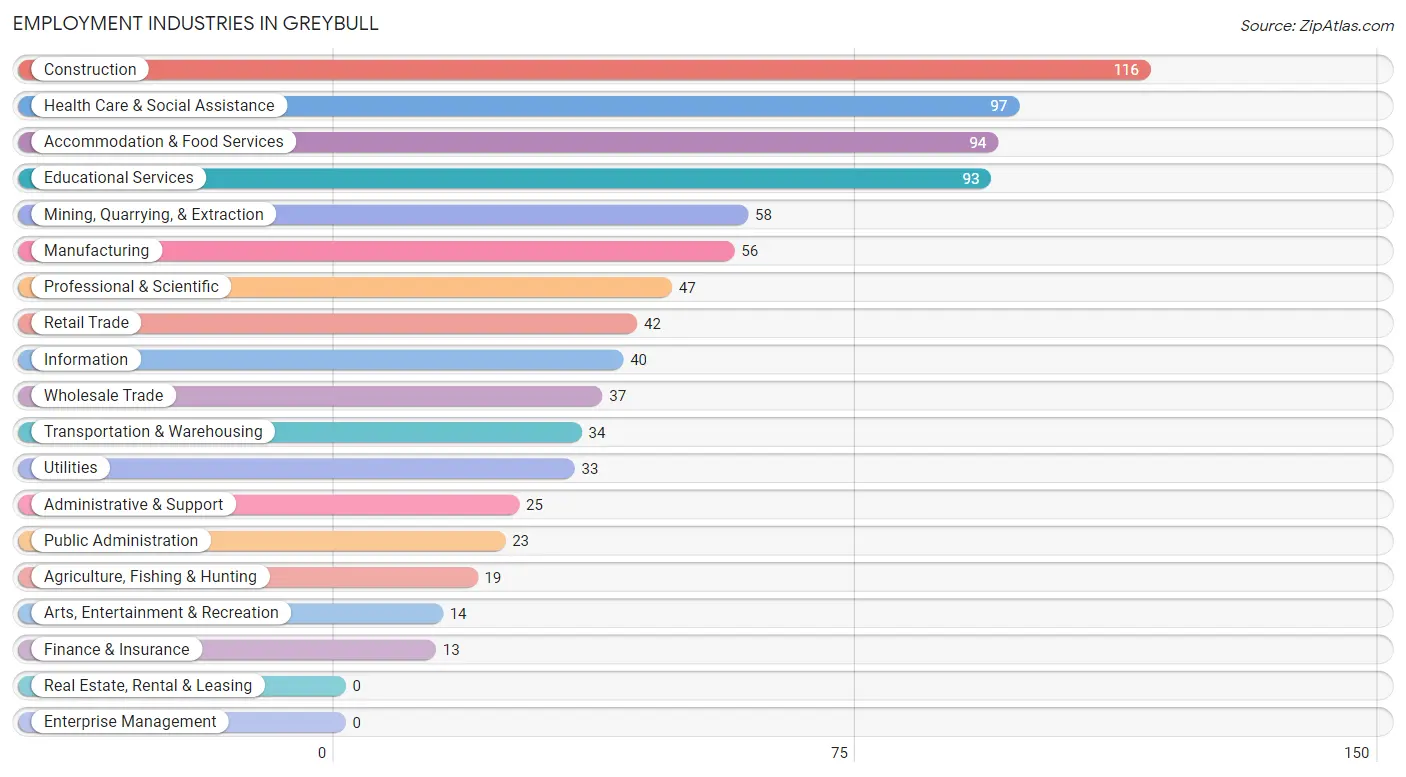
Employment Industries in Greybull
The major employment industries in Greybull include Construction (116 | 13.0%), Health Care & Social Assistance (97 | 10.9%), Accommodation & Food Services (94 | 10.5%), Educational Services (93 | 10.4%), and Mining, Quarrying, & Extraction (58 | 6.5%).
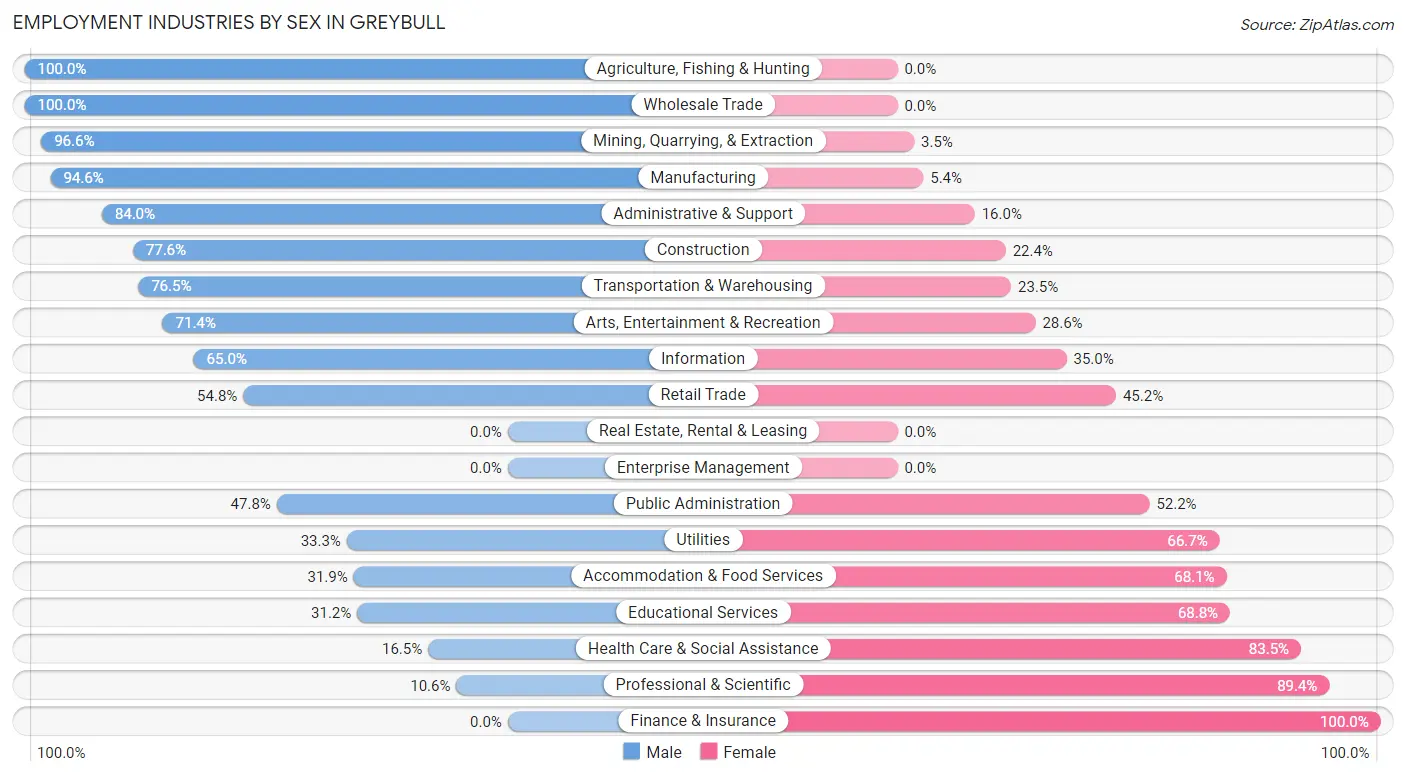
Employment Industries by Sex in Greybull
The Greybull industries that see more men than women are Agriculture, Fishing & Hunting (100.0%), Wholesale Trade (100.0%), and Mining, Quarrying, & Extraction (96.6%), whereas the industries that tend to have a higher number of women are Finance & Insurance (100.0%), Professional & Scientific (89.4%), and Health Care & Social Assistance (83.5%).
| Industry | Male | Female |
| Agriculture, Fishing & Hunting | 19 (100.0%) | 0 (0.0%) |
| Mining, Quarrying, & Extraction | 56 (96.6%) | 2 (3.5%) |
| Construction | 90 (77.6%) | 26 (22.4%) |
| Manufacturing | 53 (94.6%) | 3 (5.4%) |
| Wholesale Trade | 37 (100.0%) | 0 (0.0%) |
| Retail Trade | 23 (54.8%) | 19 (45.2%) |
| Transportation & Warehousing | 26 (76.5%) | 8 (23.5%) |
| Utilities | 11 (33.3%) | 22 (66.7%) |
| Information | 26 (65.0%) | 14 (35.0%) |
| Finance & Insurance | 0 (0.0%) | 13 (100.0%) |
| Real Estate, Rental & Leasing | 0 (0.0%) | 0 (0.0%) |
| Professional & Scientific | 5 (10.6%) | 42 (89.4%) |
| Enterprise Management | 0 (0.0%) | 0 (0.0%) |
| Administrative & Support | 21 (84.0%) | 4 (16.0%) |
| Educational Services | 29 (31.2%) | 64 (68.8%) |
| Health Care & Social Assistance | 16 (16.5%) | 81 (83.5%) |
| Arts, Entertainment & Recreation | 10 (71.4%) | 4 (28.6%) |
| Accommodation & Food Services | 30 (31.9%) | 64 (68.1%) |
| Public Administration | 11 (47.8%) | 12 (52.2%) |
| Total | 505 (56.7%) | 386 (43.3%) |
Education in Greybull
School Enrollment in Greybull
The most common levels of schooling among the 387 students in Greybull are middle school (126 | 32.6%), elementary school (106 | 27.4%), and high school (82 | 21.2%).
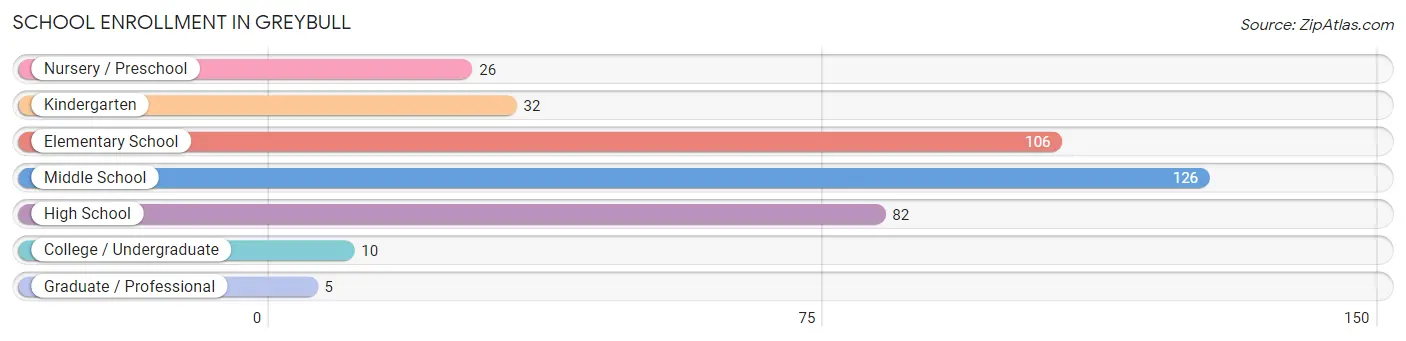
| School Level | # Students | % Students |
| Nursery / Preschool | 26 | 6.7% |
| Kindergarten | 32 | 8.3% |
| Elementary School | 106 | 27.4% |
| Middle School | 126 | 32.6% |
| High School | 82 | 21.2% |
| College / Undergraduate | 10 | 2.6% |
| Graduate / Professional | 5 | 1.3% |
| Total | 387 | 100.0% |
School Enrollment by Age by Funding Source in Greybull
Out of a total of 387 students who are enrolled in schools in Greybull, 27 (7.0%) attend a private institution, while the remaining 360 (93.0%) are enrolled in public schools. The age group of 15 to 17 year olds has the highest likelihood of being enrolled in private schools, with 12 (17.1% in the age bracket) enrolled. Conversely, the age group of 3 to 4 year olds has the lowest likelihood of being enrolled in a private school, with 26 (100.0% in the age bracket) attending a public institution.
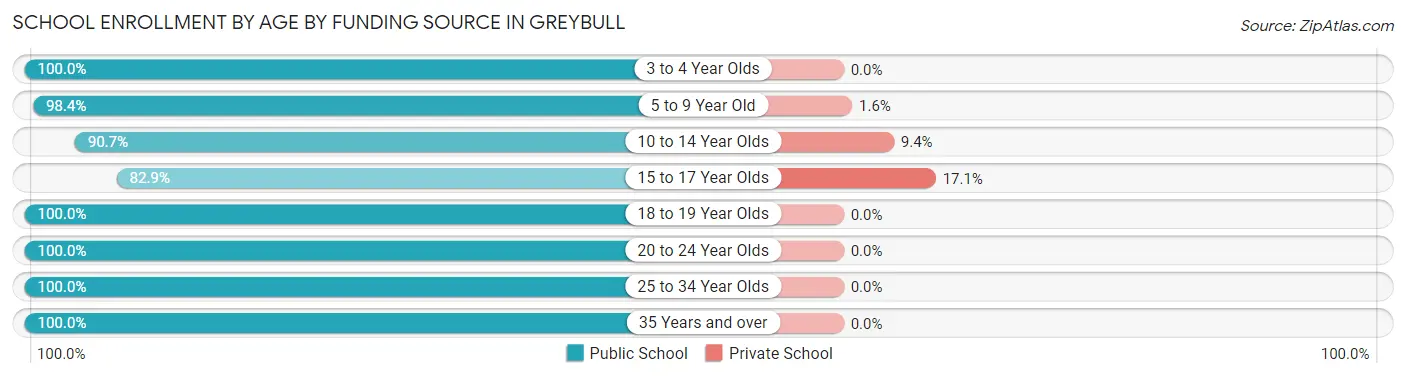
| Age Bracket | Public School | Private School |
| 3 to 4 Year Olds | 26 (100.0%) | 0 (0.0%) |
| 5 to 9 Year Old | 125 (98.4%) | 2 (1.6%) |
| 10 to 14 Year Olds | 126 (90.6%) | 13 (9.3%) |
| 15 to 17 Year Olds | 58 (82.9%) | 12 (17.1%) |
| 18 to 19 Year Olds | 10 (100.0%) | 0 (0.0%) |
| 20 to 24 Year Olds | 4 (100.0%) | 0 (0.0%) |
| 25 to 34 Year Olds | 10 (100.0%) | 0 (0.0%) |
| 35 Years and over | 1 (100.0%) | 0 (0.0%) |
| Total | 360 (93.0%) | 27 (7.0%) |
Educational Attainment by Field of Study in Greybull
Education (46 | 18.2%), science & technology (41 | 16.3%), business (41 | 16.3%), social sciences (25 | 9.9%), and psychology (17 | 6.8%) are the most common fields of study among 252 individuals in Greybull who have obtained a bachelor's degree or higher.
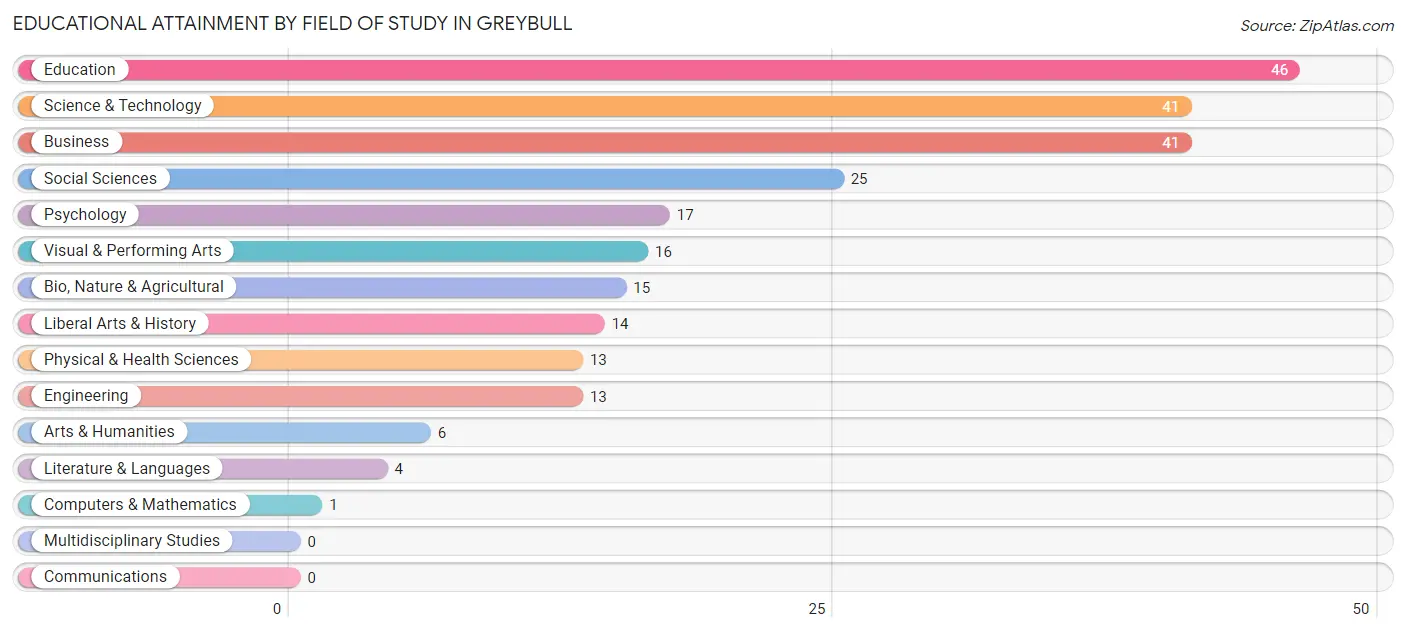
| Field of Study | # Graduates | % Graduates |
| Computers & Mathematics | 1 | 0.4% |
| Bio, Nature & Agricultural | 15 | 5.9% |
| Physical & Health Sciences | 13 | 5.2% |
| Psychology | 17 | 6.8% |
| Social Sciences | 25 | 9.9% |
| Engineering | 13 | 5.2% |
| Multidisciplinary Studies | 0 | 0.0% |
| Science & Technology | 41 | 16.3% |
| Business | 41 | 16.3% |
| Education | 46 | 18.2% |
| Literature & Languages | 4 | 1.6% |
| Liberal Arts & History | 14 | 5.6% |
| Visual & Performing Arts | 16 | 6.4% |
| Communications | 0 | 0.0% |
| Arts & Humanities | 6 | 2.4% |
| Total | 252 | 100.0% |
Transportation & Commute in Greybull
Vehicle Availability by Sex in Greybull
The most prevalent vehicle ownership categories in Greybull are males with 3 vehicles (172, accounting for 35.2%) and females with 3 vehicles (71, making up 44.7%).
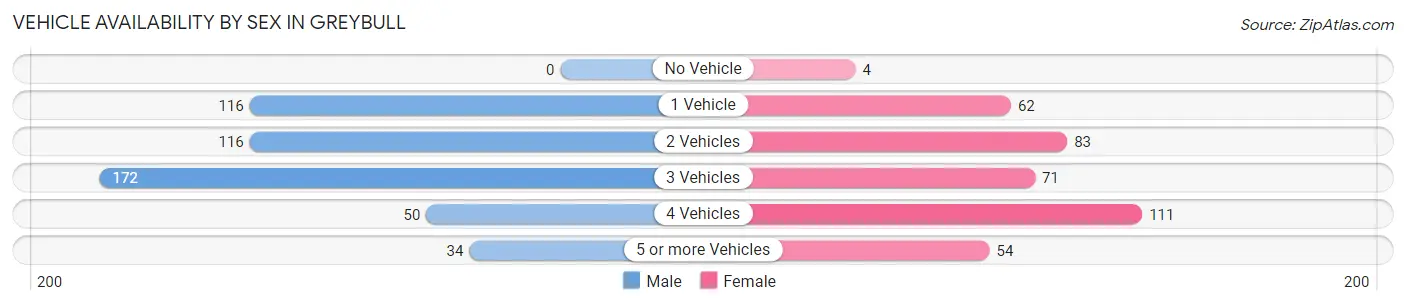
| Vehicles Available | Male | Female |
| No Vehicle | 0 (0.0%) | 4 (1.0%) |
| 1 Vehicle | 116 (23.8%) | 62 (16.1%) |
| 2 Vehicles | 116 (23.8%) | 83 (21.6%) |
| 3 Vehicles | 172 (35.2%) | 71 (18.4%) |
| 4 Vehicles | 50 (10.2%) | 111 (28.8%) |
| 5 or more Vehicles | 34 (7.0%) | 54 (14.0%) |
| Total | 488 (100.0%) | 385 (100.0%) |
Commute Time in Greybull
The most frequently occuring commute durations in Greybull are 10 to 14 minutes (242 commuters, 30.9%), 5 to 9 minutes (173 commuters, 22.1%), and less than 5 minutes (107 commuters, 13.7%).
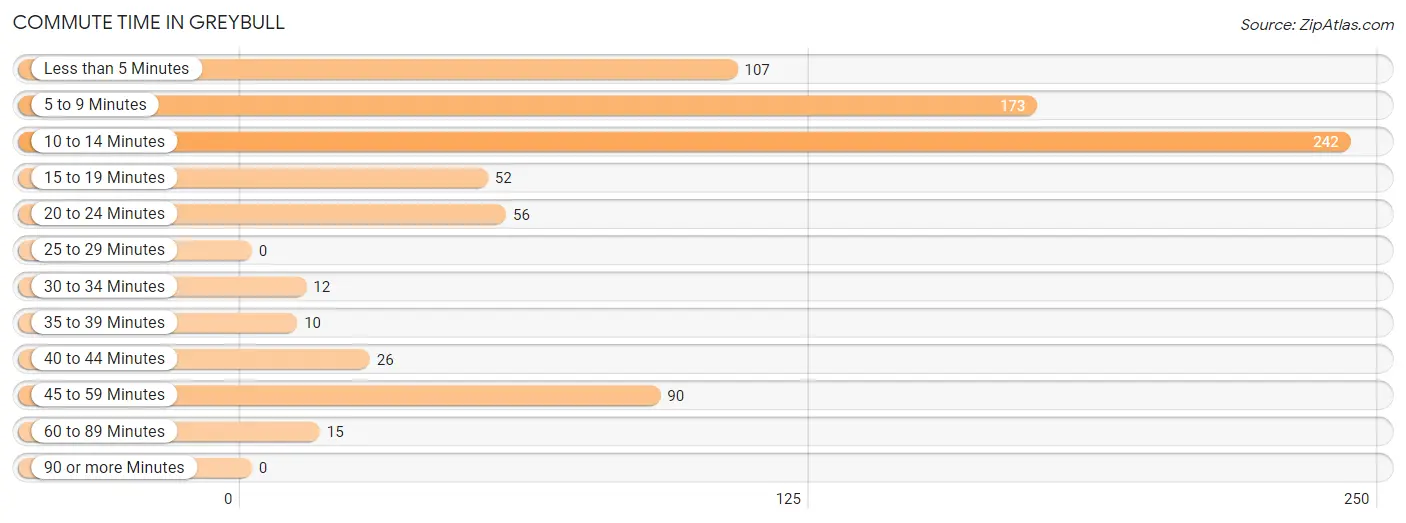
| Commute Time | # Commuters | % Commuters |
| Less than 5 Minutes | 107 | 13.7% |
| 5 to 9 Minutes | 173 | 22.1% |
| 10 to 14 Minutes | 242 | 30.9% |
| 15 to 19 Minutes | 52 | 6.6% |
| 20 to 24 Minutes | 56 | 7.1% |
| 25 to 29 Minutes | 0 | 0.0% |
| 30 to 34 Minutes | 12 | 1.5% |
| 35 to 39 Minutes | 10 | 1.3% |
| 40 to 44 Minutes | 26 | 3.3% |
| 45 to 59 Minutes | 90 | 11.5% |
| 60 to 89 Minutes | 15 | 1.9% |
| 90 or more Minutes | 0 | 0.0% |
Commute Time by Sex in Greybull
The most common commute times in Greybull are 10 to 14 minutes (179 commuters, 38.6%) for males and 5 to 9 minutes (88 commuters, 27.6%) for females.
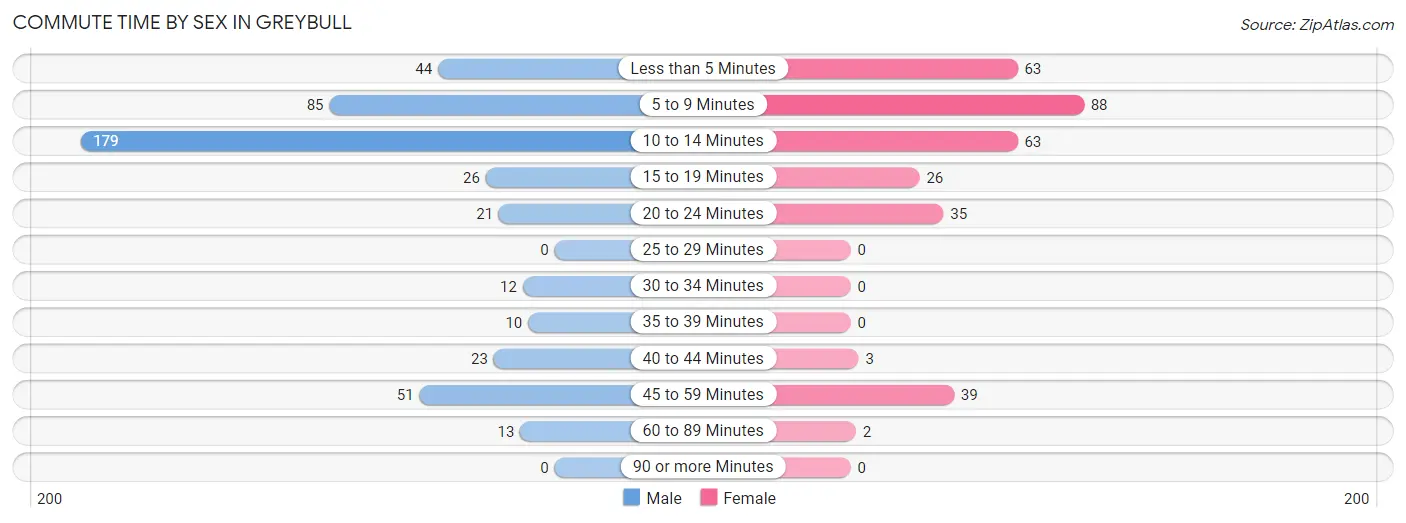
| Commute Time | Male | Female |
| Less than 5 Minutes | 44 (9.5%) | 63 (19.8%) |
| 5 to 9 Minutes | 85 (18.3%) | 88 (27.6%) |
| 10 to 14 Minutes | 179 (38.6%) | 63 (19.8%) |
| 15 to 19 Minutes | 26 (5.6%) | 26 (8.2%) |
| 20 to 24 Minutes | 21 (4.5%) | 35 (11.0%) |
| 25 to 29 Minutes | 0 (0.0%) | 0 (0.0%) |
| 30 to 34 Minutes | 12 (2.6%) | 0 (0.0%) |
| 35 to 39 Minutes | 10 (2.2%) | 0 (0.0%) |
| 40 to 44 Minutes | 23 (5.0%) | 3 (0.9%) |
| 45 to 59 Minutes | 51 (11.0%) | 39 (12.2%) |
| 60 to 89 Minutes | 13 (2.8%) | 2 (0.6%) |
| 90 or more Minutes | 0 (0.0%) | 0 (0.0%) |
Time of Departure to Work by Sex in Greybull
The most frequent times of departure to work in Greybull are 7:30 AM to 7:59 AM (81, 17.5%) for males and 7:30 AM to 7:59 AM (73, 22.9%) for females.
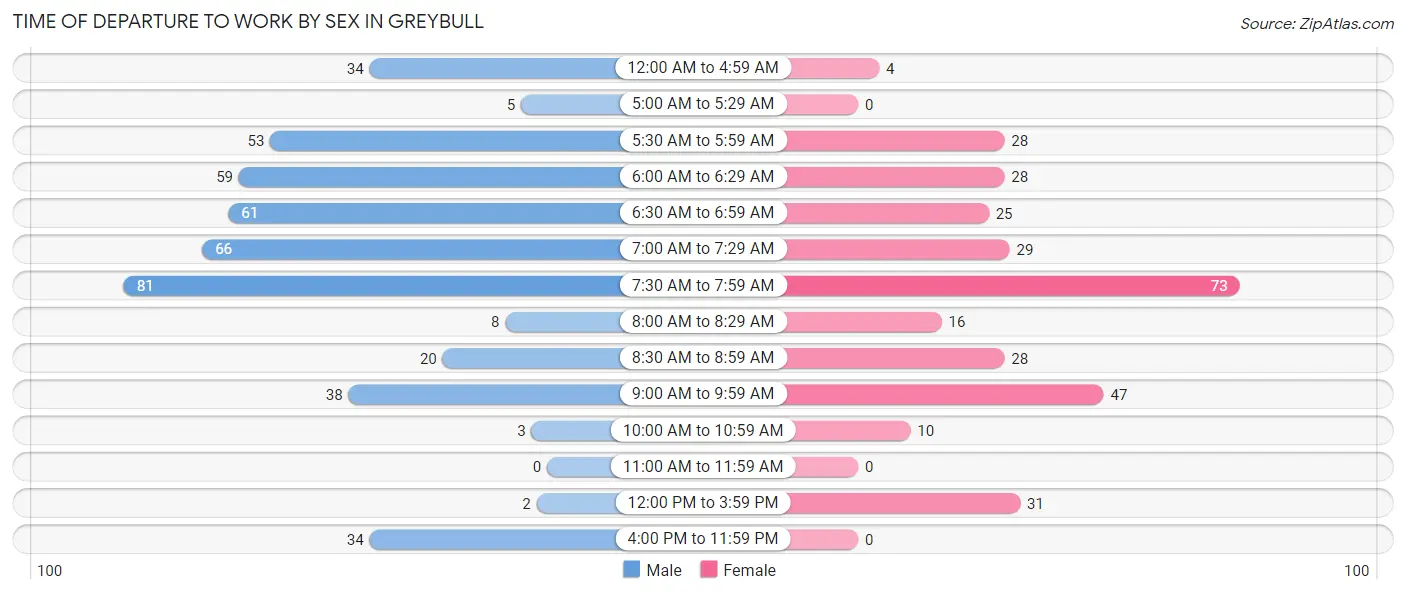
| Time of Departure | Male | Female |
| 12:00 AM to 4:59 AM | 34 (7.3%) | 4 (1.3%) |
| 5:00 AM to 5:29 AM | 5 (1.1%) | 0 (0.0%) |
| 5:30 AM to 5:59 AM | 53 (11.4%) | 28 (8.8%) |
| 6:00 AM to 6:29 AM | 59 (12.7%) | 28 (8.8%) |
| 6:30 AM to 6:59 AM | 61 (13.2%) | 25 (7.8%) |
| 7:00 AM to 7:29 AM | 66 (14.2%) | 29 (9.1%) |
| 7:30 AM to 7:59 AM | 81 (17.5%) | 73 (22.9%) |
| 8:00 AM to 8:29 AM | 8 (1.7%) | 16 (5.0%) |
| 8:30 AM to 8:59 AM | 20 (4.3%) | 28 (8.8%) |
| 9:00 AM to 9:59 AM | 38 (8.2%) | 47 (14.7%) |
| 10:00 AM to 10:59 AM | 3 (0.6%) | 10 (3.1%) |
| 11:00 AM to 11:59 AM | 0 (0.0%) | 0 (0.0%) |
| 12:00 PM to 3:59 PM | 2 (0.4%) | 31 (9.7%) |
| 4:00 PM to 11:59 PM | 34 (7.3%) | 0 (0.0%) |
| Total | 464 (100.0%) | 319 (100.0%) |
Housing Occupancy in Greybull
Occupancy by Ownership in Greybull
Of the total 740 dwellings in Greybull, owner-occupied units account for 532 (71.9%), while renter-occupied units make up 208 (28.1%).
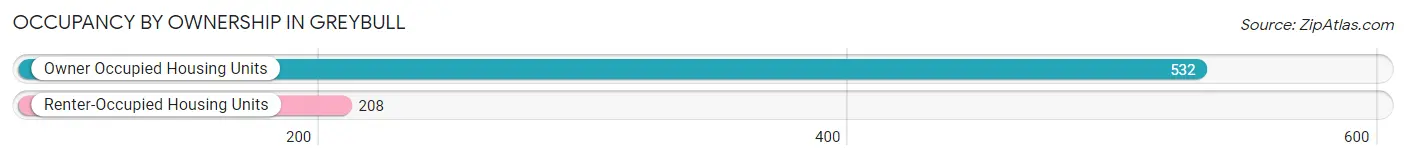
| Occupancy | # Housing Units | % Housing Units |
| Owner Occupied Housing Units | 532 | 71.9% |
| Renter-Occupied Housing Units | 208 | 28.1% |
| Total Occupied Housing Units | 740 | 100.0% |
Occupancy by Household Size in Greybull
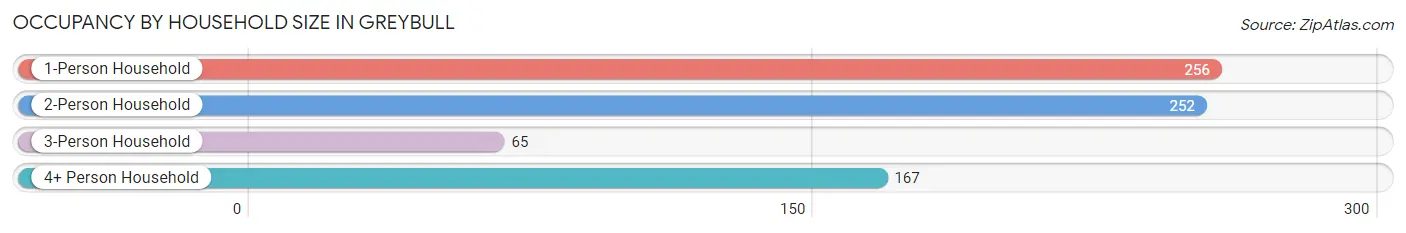
| Household Size | # Housing Units | % Housing Units |
| 1-Person Household | 256 | 34.6% |
| 2-Person Household | 252 | 34.1% |
| 3-Person Household | 65 | 8.8% |
| 4+ Person Household | 167 | 22.6% |
| Total Housing Units | 740 | 100.0% |
Occupancy by Ownership by Household Size in Greybull
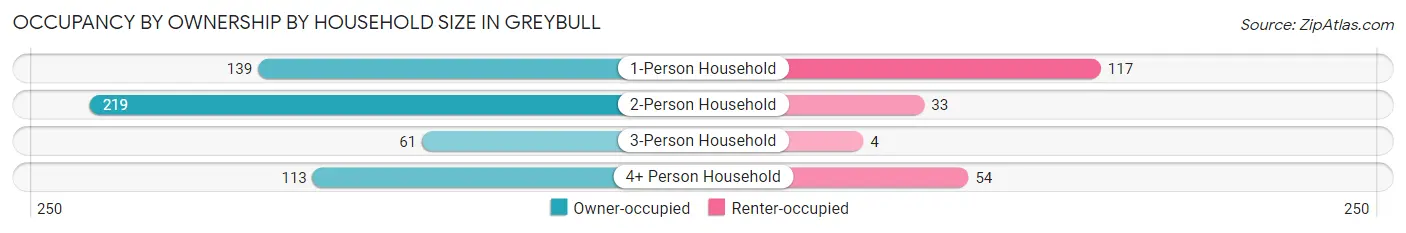
| Household Size | Owner-occupied | Renter-occupied |
| 1-Person Household | 139 (54.3%) | 117 (45.7%) |
| 2-Person Household | 219 (86.9%) | 33 (13.1%) |
| 3-Person Household | 61 (93.9%) | 4 (6.1%) |
| 4+ Person Household | 113 (67.7%) | 54 (32.3%) |
| Total Housing Units | 532 (71.9%) | 208 (28.1%) |
Occupancy by Educational Attainment in Greybull
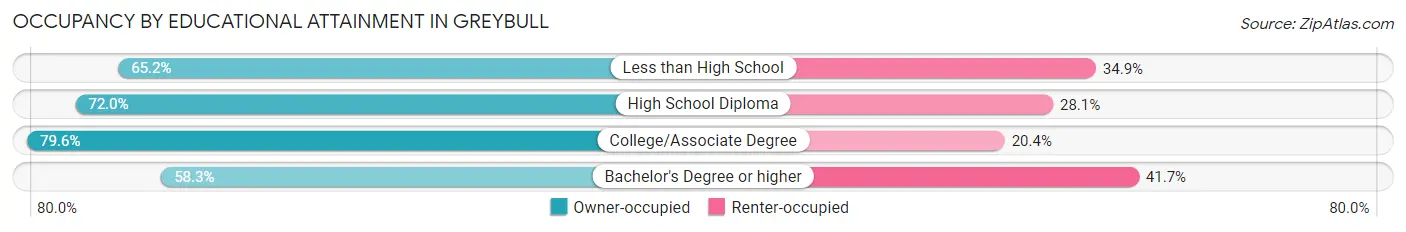
| Household Size | Owner-occupied | Renter-occupied |
| Less than High School | 43 (65.1%) | 23 (34.8%) |
| High School Diploma | 159 (72.0%) | 62 (28.1%) |
| College/Associate Degree | 246 (79.6%) | 63 (20.4%) |
| Bachelor's Degree or higher | 84 (58.3%) | 60 (41.7%) |
Occupancy by Age of Householder in Greybull
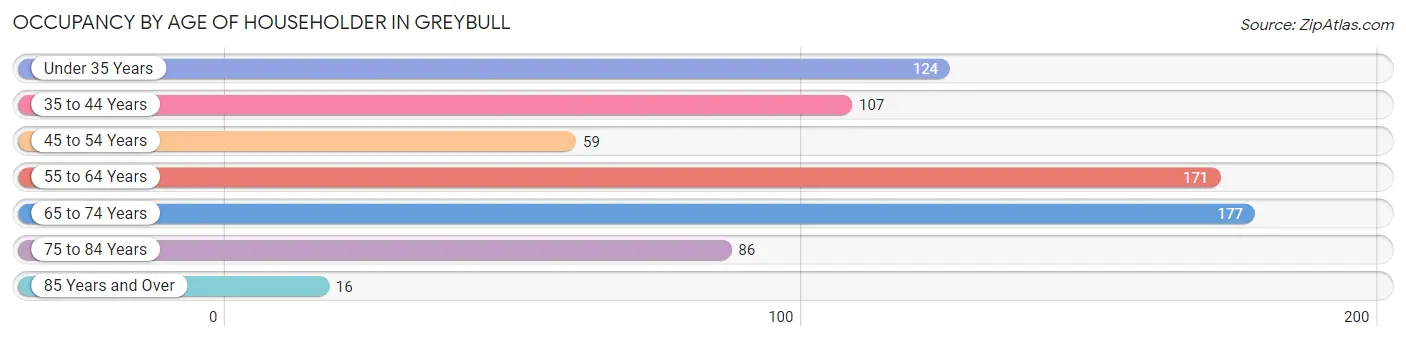
| Age Bracket | # Households | % Households |
| Under 35 Years | 124 | 16.8% |
| 35 to 44 Years | 107 | 14.5% |
| 45 to 54 Years | 59 | 8.0% |
| 55 to 64 Years | 171 | 23.1% |
| 65 to 74 Years | 177 | 23.9% |
| 75 to 84 Years | 86 | 11.6% |
| 85 Years and Over | 16 | 2.2% |
| Total | 740 | 100.0% |
Housing Finances in Greybull
Median Income by Occupancy in Greybull
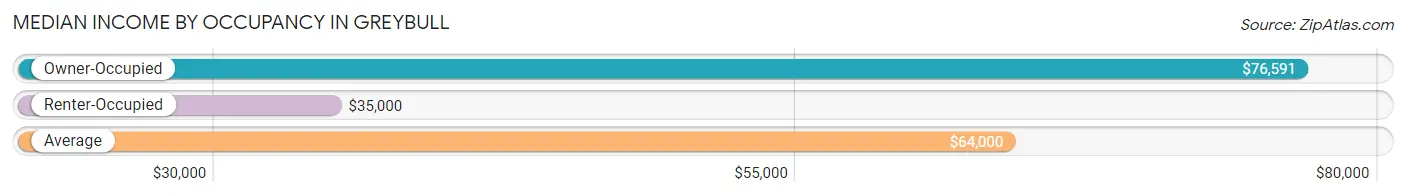
| Occupancy Type | # Households | Median Income |
| Owner-Occupied | 532 (71.9%) | $76,591 |
| Renter-Occupied | 208 (28.1%) | $35,000 |
| Average | 740 (100.0%) | $64,000 |
Occupancy by Householder Income Bracket in Greybull
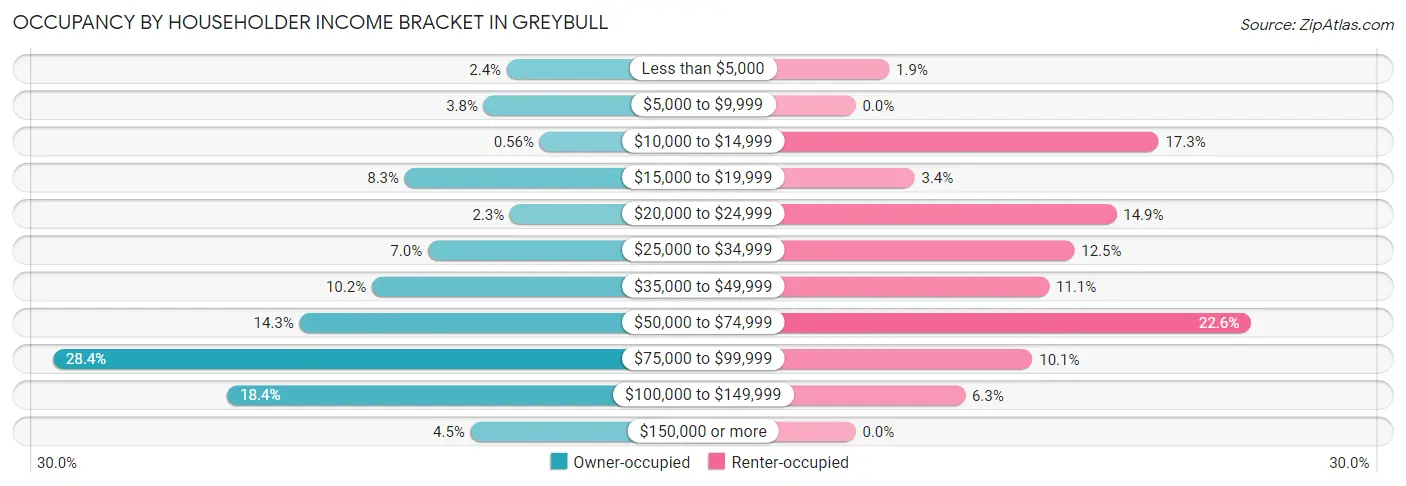
| Income Bracket | Owner-occupied | Renter-occupied |
| Less than $5,000 | 13 (2.4%) | 4 (1.9%) |
| $5,000 to $9,999 | 20 (3.8%) | 0 (0.0%) |
| $10,000 to $14,999 | 3 (0.6%) | 36 (17.3%) |
| $15,000 to $19,999 | 44 (8.3%) | 7 (3.4%) |
| $20,000 to $24,999 | 12 (2.3%) | 31 (14.9%) |
| $25,000 to $34,999 | 37 (7.0%) | 26 (12.5%) |
| $35,000 to $49,999 | 54 (10.2%) | 23 (11.1%) |
| $50,000 to $74,999 | 76 (14.3%) | 47 (22.6%) |
| $75,000 to $99,999 | 151 (28.4%) | 21 (10.1%) |
| $100,000 to $149,999 | 98 (18.4%) | 13 (6.2%) |
| $150,000 or more | 24 (4.5%) | 0 (0.0%) |
| Total | 532 (100.0%) | 208 (100.0%) |
Monthly Housing Cost Tiers in Greybull
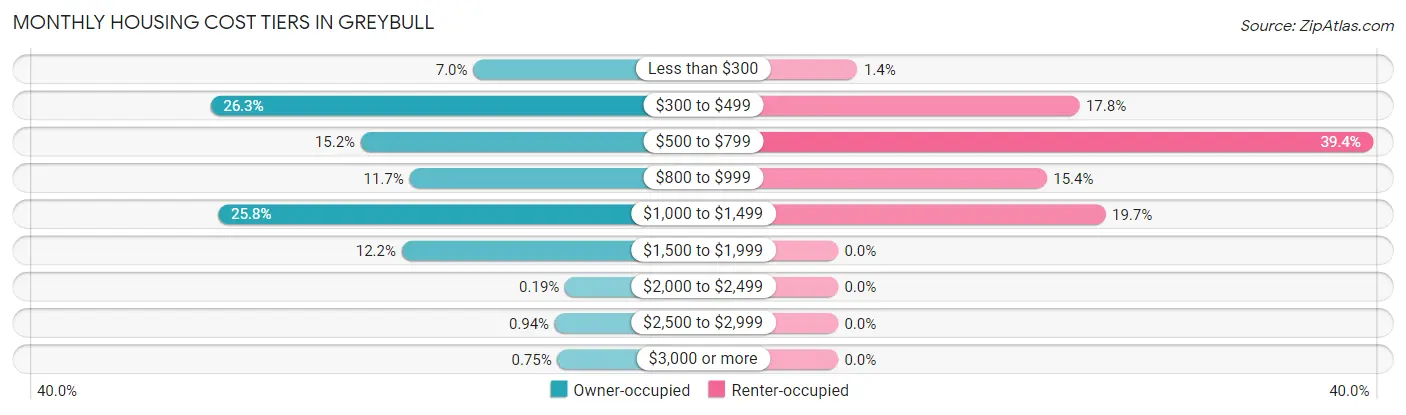
| Monthly Cost | Owner-occupied | Renter-occupied |
| Less than $300 | 37 (7.0%) | 3 (1.4%) |
| $300 to $499 | 140 (26.3%) | 37 (17.8%) |
| $500 to $799 | 81 (15.2%) | 82 (39.4%) |
| $800 to $999 | 62 (11.7%) | 32 (15.4%) |
| $1,000 to $1,499 | 137 (25.8%) | 41 (19.7%) |
| $1,500 to $1,999 | 65 (12.2%) | 0 (0.0%) |
| $2,000 to $2,499 | 1 (0.2%) | 0 (0.0%) |
| $2,500 to $2,999 | 5 (0.9%) | 0 (0.0%) |
| $3,000 or more | 4 (0.7%) | 0 (0.0%) |
| Total | 532 (100.0%) | 208 (100.0%) |
Physical Housing Characteristics in Greybull
Housing Structures in Greybull
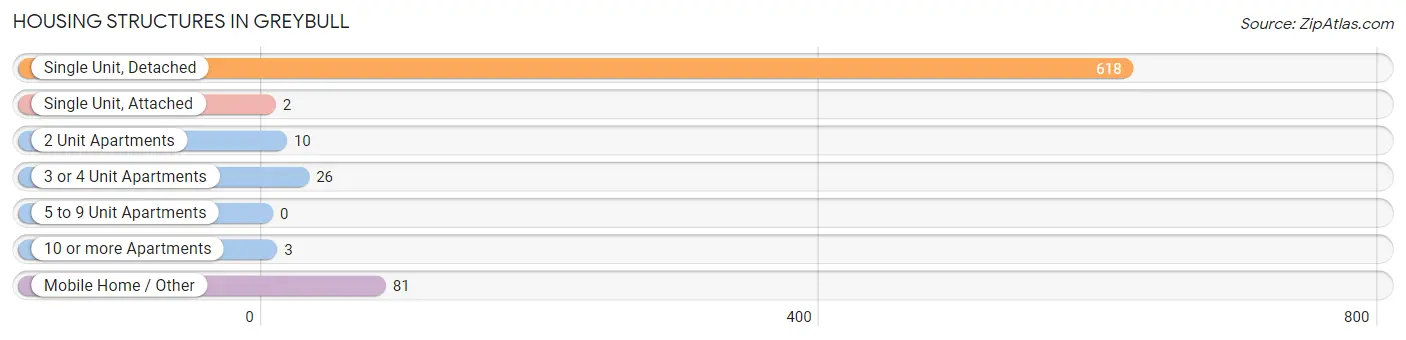
| Structure Type | # Housing Units | % Housing Units |
| Single Unit, Detached | 618 | 83.5% |
| Single Unit, Attached | 2 | 0.3% |
| 2 Unit Apartments | 10 | 1.3% |
| 3 or 4 Unit Apartments | 26 | 3.5% |
| 5 to 9 Unit Apartments | 0 | 0.0% |
| 10 or more Apartments | 3 | 0.4% |
| Mobile Home / Other | 81 | 11.0% |
| Total | 740 | 100.0% |
Housing Structures by Occupancy in Greybull
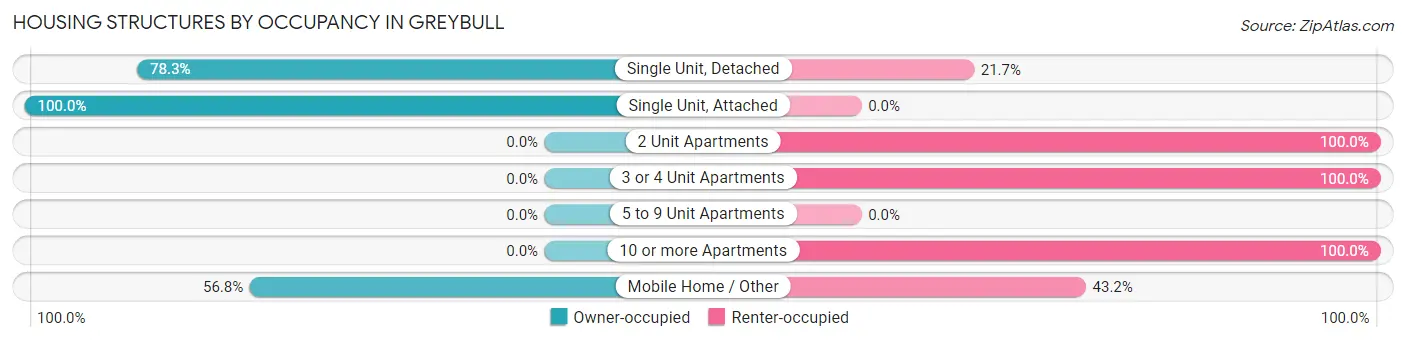
| Structure Type | Owner-occupied | Renter-occupied |
| Single Unit, Detached | 484 (78.3%) | 134 (21.7%) |
| Single Unit, Attached | 2 (100.0%) | 0 (0.0%) |
| 2 Unit Apartments | 0 (0.0%) | 10 (100.0%) |
| 3 or 4 Unit Apartments | 0 (0.0%) | 26 (100.0%) |
| 5 to 9 Unit Apartments | 0 (0.0%) | 0 (0.0%) |
| 10 or more Apartments | 0 (0.0%) | 3 (100.0%) |
| Mobile Home / Other | 46 (56.8%) | 35 (43.2%) |
| Total | 532 (71.9%) | 208 (28.1%) |
Housing Structures by Number of Rooms in Greybull
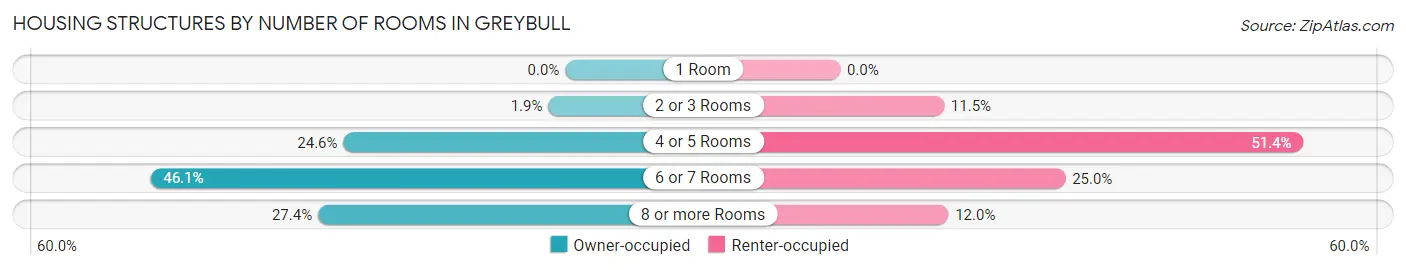
| Number of Rooms | Owner-occupied | Renter-occupied |
| 1 Room | 0 (0.0%) | 0 (0.0%) |
| 2 or 3 Rooms | 10 (1.9%) | 24 (11.5%) |
| 4 or 5 Rooms | 131 (24.6%) | 107 (51.4%) |
| 6 or 7 Rooms | 245 (46.1%) | 52 (25.0%) |
| 8 or more Rooms | 146 (27.4%) | 25 (12.0%) |
| Total | 532 (100.0%) | 208 (100.0%) |
Housing Structure by Heating Type in Greybull
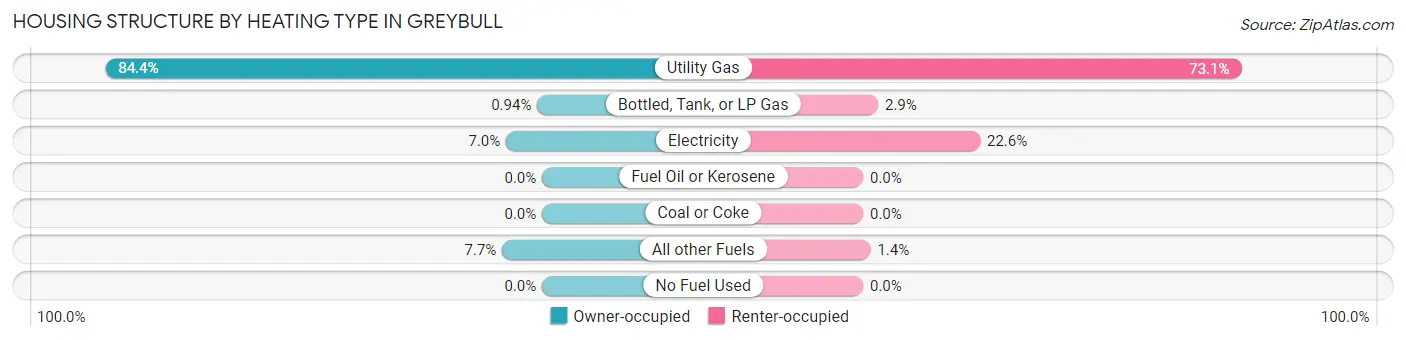
| Heating Type | Owner-occupied | Renter-occupied |
| Utility Gas | 449 (84.4%) | 152 (73.1%) |
| Bottled, Tank, or LP Gas | 5 (0.9%) | 6 (2.9%) |
| Electricity | 37 (7.0%) | 47 (22.6%) |
| Fuel Oil or Kerosene | 0 (0.0%) | 0 (0.0%) |
| Coal or Coke | 0 (0.0%) | 0 (0.0%) |
| All other Fuels | 41 (7.7%) | 3 (1.4%) |
| No Fuel Used | 0 (0.0%) | 0 (0.0%) |
| Total | 532 (100.0%) | 208 (100.0%) |
Household Vehicle Usage in Greybull
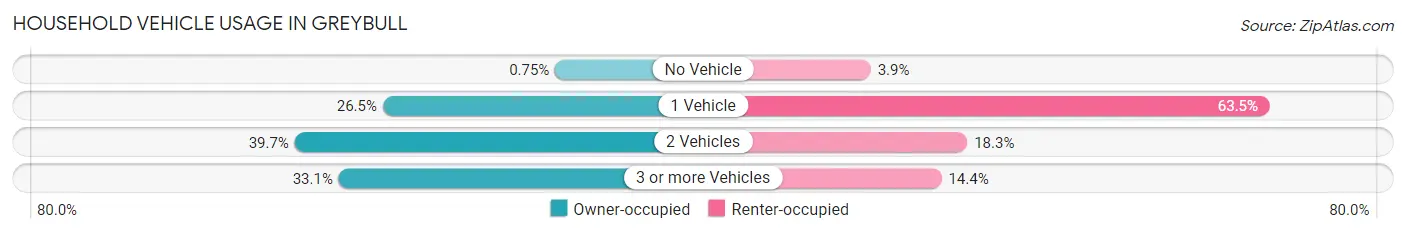
| Vehicles per Household | Owner-occupied | Renter-occupied |
| No Vehicle | 4 (0.7%) | 8 (3.8%) |
| 1 Vehicle | 141 (26.5%) | 132 (63.5%) |
| 2 Vehicles | 211 (39.7%) | 38 (18.3%) |
| 3 or more Vehicles | 176 (33.1%) | 30 (14.4%) |
| Total | 532 (100.0%) | 208 (100.0%) |
Real Estate & Mortgages in Greybull
Real Estate and Mortgage Overview in Greybull
| Characteristic | Without Mortgage | With Mortgage |
| Housing Units | 228 | 304 |
| Median Property Value | $155,000 | $153,800 |
| Median Household Income | $62,143 | $5 |
| Monthly Housing Costs | $426 | $4 |
| Real Estate Taxes | $1,021 | $0 |
Property Value by Mortgage Status in Greybull
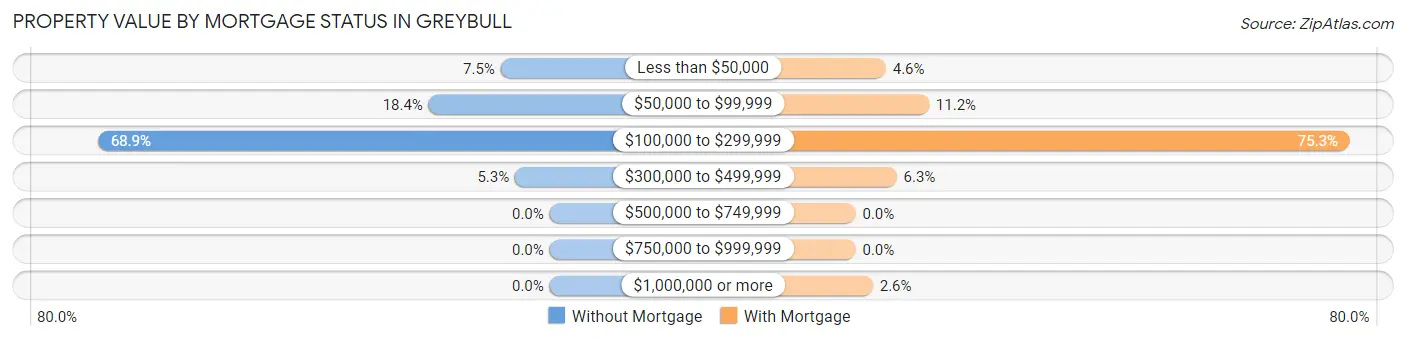
| Property Value | Without Mortgage | With Mortgage |
| Less than $50,000 | 17 (7.5%) | 14 (4.6%) |
| $50,000 to $99,999 | 42 (18.4%) | 34 (11.2%) |
| $100,000 to $299,999 | 157 (68.9%) | 229 (75.3%) |
| $300,000 to $499,999 | 12 (5.3%) | 19 (6.2%) |
| $500,000 to $749,999 | 0 (0.0%) | 0 (0.0%) |
| $750,000 to $999,999 | 0 (0.0%) | 0 (0.0%) |
| $1,000,000 or more | 0 (0.0%) | 8 (2.6%) |
| Total | 228 (100.0%) | 304 (100.0%) |
Household Income by Mortgage Status in Greybull
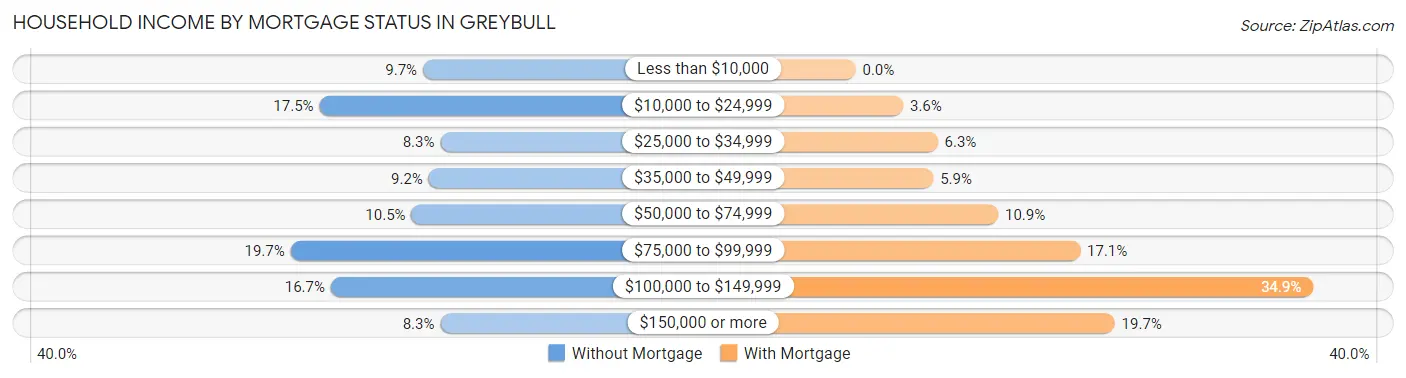
| Household Income | Without Mortgage | With Mortgage |
| Less than $10,000 | 22 (9.7%) | 0 (0.0%) |
| $10,000 to $24,999 | 40 (17.5%) | 11 (3.6%) |
| $25,000 to $34,999 | 19 (8.3%) | 19 (6.2%) |
| $35,000 to $49,999 | 21 (9.2%) | 18 (5.9%) |
| $50,000 to $74,999 | 24 (10.5%) | 33 (10.9%) |
| $75,000 to $99,999 | 45 (19.7%) | 52 (17.1%) |
| $100,000 to $149,999 | 38 (16.7%) | 106 (34.9%) |
| $150,000 or more | 19 (8.3%) | 60 (19.7%) |
| Total | 228 (100.0%) | 304 (100.0%) |
Property Value to Household Income Ratio in Greybull
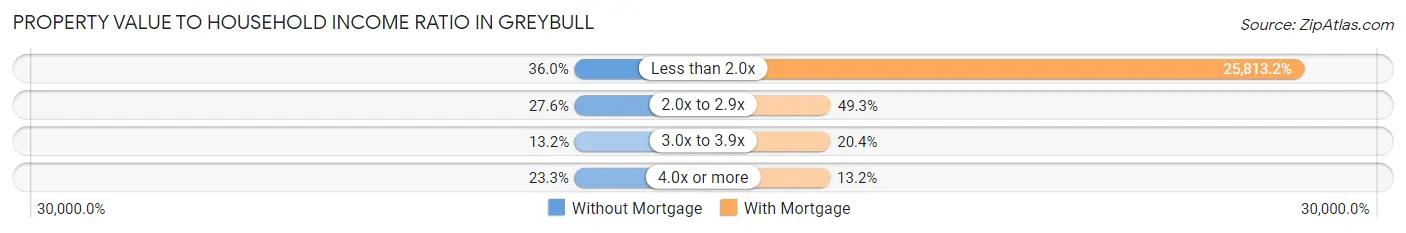
| Value-to-Income Ratio | Without Mortgage | With Mortgage |
| Less than 2.0x | 82 (36.0%) | 78,472 (25,813.2%) |
| 2.0x to 2.9x | 63 (27.6%) | 150 (49.3%) |
| 3.0x to 3.9x | 30 (13.2%) | 62 (20.4%) |
| 4.0x or more | 53 (23.3%) | 40 (13.2%) |
| Total | 228 (100.0%) | 304 (100.0%) |
Real Estate Taxes by Mortgage Status in Greybull
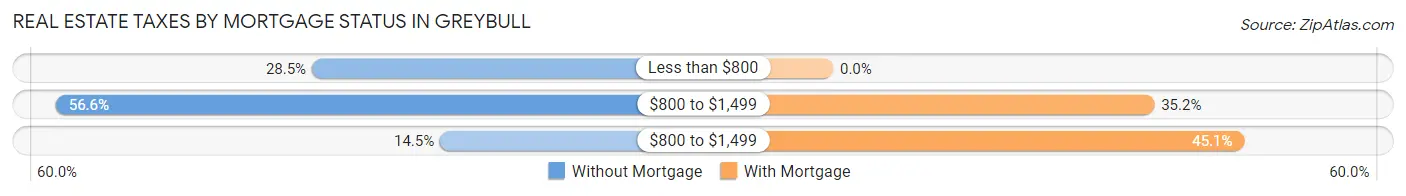
| Property Taxes | Without Mortgage | With Mortgage |
| Less than $800 | 65 (28.5%) | 0 (0.0%) |
| $800 to $1,499 | 129 (56.6%) | 107 (35.2%) |
| $800 to $1,499 | 33 (14.5%) | 137 (45.1%) |
| Total | 228 (100.0%) | 304 (100.0%) |
Health & Disability in Greybull
Health Insurance Coverage by Age in Greybull
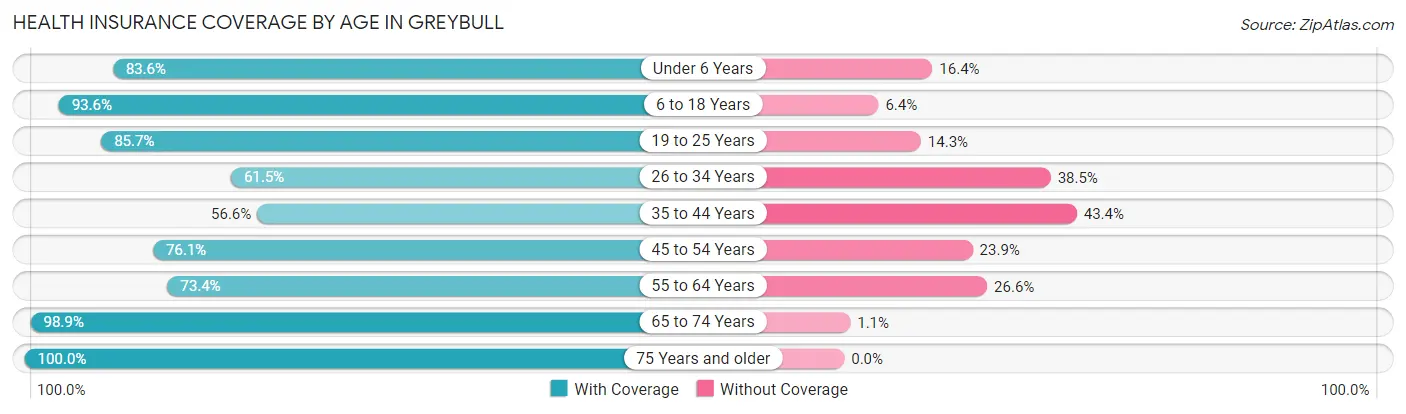
| Age Bracket | With Coverage | Without Coverage |
| Under 6 Years | 173 (83.6%) | 34 (16.4%) |
| 6 to 18 Years | 397 (93.6%) | 27 (6.4%) |
| 19 to 25 Years | 120 (85.7%) | 20 (14.3%) |
| 26 to 34 Years | 147 (61.5%) | 92 (38.5%) |
| 35 to 44 Years | 145 (56.6%) | 111 (43.4%) |
| 45 to 54 Years | 108 (76.1%) | 34 (23.9%) |
| 55 to 64 Years | 223 (73.4%) | 81 (26.6%) |
| 65 to 74 Years | 264 (98.9%) | 3 (1.1%) |
| 75 Years and older | 165 (100.0%) | 0 (0.0%) |
| Total | 1,742 (81.2%) | 402 (18.8%) |
Health Insurance Coverage by Citizenship Status in Greybull
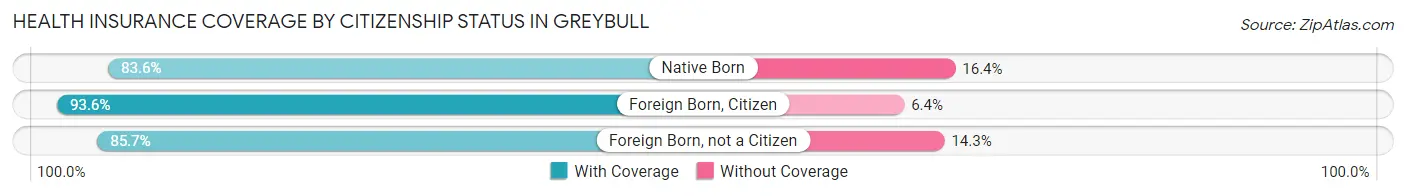
| Citizenship Status | With Coverage | Without Coverage |
| Native Born | 173 (83.6%) | 34 (16.4%) |
| Foreign Born, Citizen | 397 (93.6%) | 27 (6.4%) |
| Foreign Born, not a Citizen | 120 (85.7%) | 20 (14.3%) |
Health Insurance Coverage by Household Income in Greybull
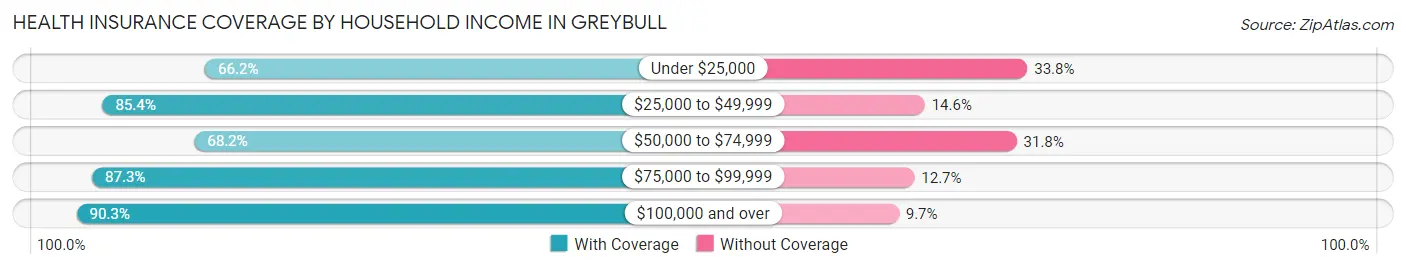
| Household Income | With Coverage | Without Coverage |
| Under $25,000 | 180 (66.2%) | 92 (33.8%) |
| $25,000 to $49,999 | 193 (85.4%) | 33 (14.6%) |
| $50,000 to $74,999 | 298 (68.2%) | 139 (31.8%) |
| $75,000 to $99,999 | 614 (87.3%) | 89 (12.7%) |
| $100,000 and over | 454 (90.3%) | 49 (9.7%) |
Public vs Private Health Insurance Coverage by Age in Greybull
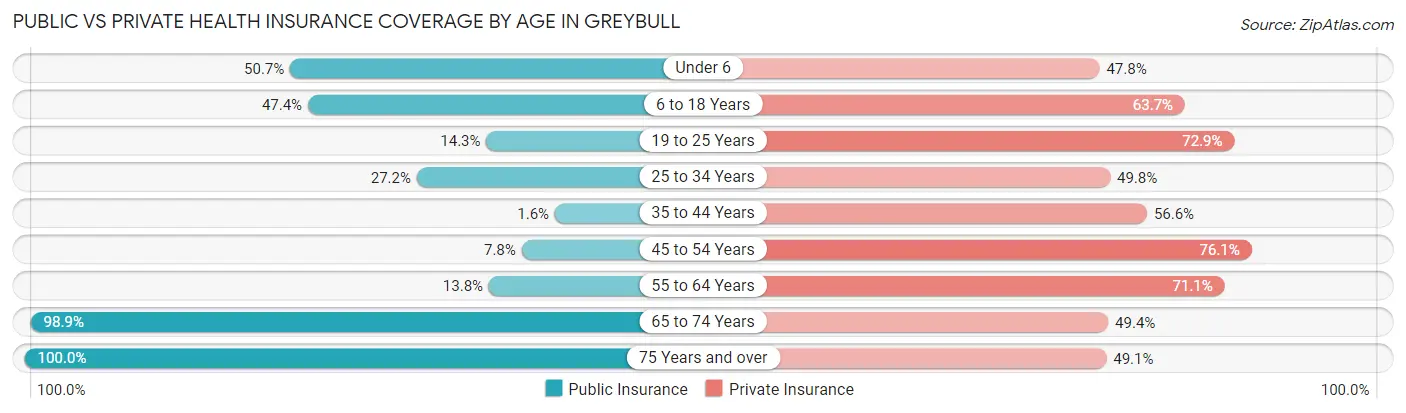
| Age Bracket | Public Insurance | Private Insurance |
| Under 6 | 105 (50.7%) | 99 (47.8%) |
| 6 to 18 Years | 201 (47.4%) | 270 (63.7%) |
| 19 to 25 Years | 20 (14.3%) | 102 (72.9%) |
| 25 to 34 Years | 65 (27.2%) | 119 (49.8%) |
| 35 to 44 Years | 4 (1.6%) | 145 (56.6%) |
| 45 to 54 Years | 11 (7.7%) | 108 (76.1%) |
| 55 to 64 Years | 42 (13.8%) | 216 (71.1%) |
| 65 to 74 Years | 264 (98.9%) | 132 (49.4%) |
| 75 Years and over | 165 (100.0%) | 81 (49.1%) |
| Total | 877 (40.9%) | 1,272 (59.3%) |
Disability Status by Sex by Age in Greybull
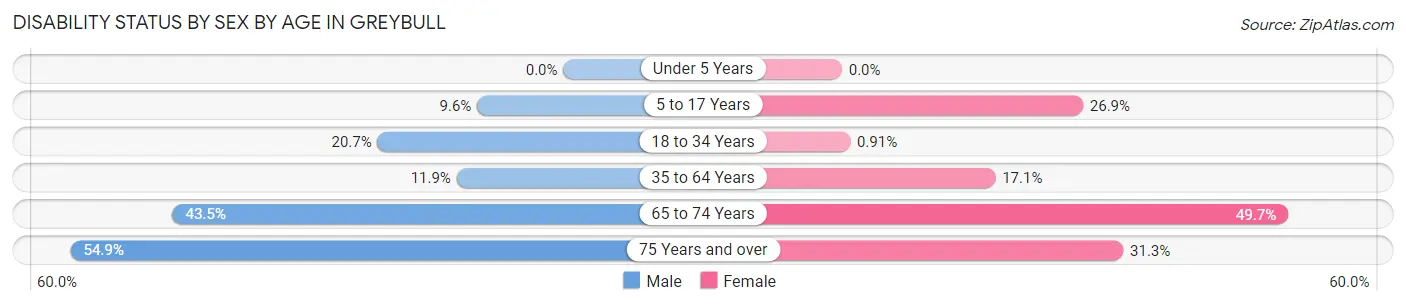
| Age Bracket | Male | Female |
| Under 5 Years | 0 (0.0%) | 0 (0.0%) |
| 5 to 17 Years | 17 (9.6%) | 58 (26.9%) |
| 18 to 34 Years | 42 (20.7%) | 2 (0.9%) |
| 35 to 64 Years | 41 (11.9%) | 61 (17.1%) |
| 65 to 74 Years | 47 (43.5%) | 79 (49.7%) |
| 75 Years and over | 45 (54.9%) | 26 (31.3%) |
Disability Class by Sex by Age in Greybull
Disability Class: Hearing Difficulty
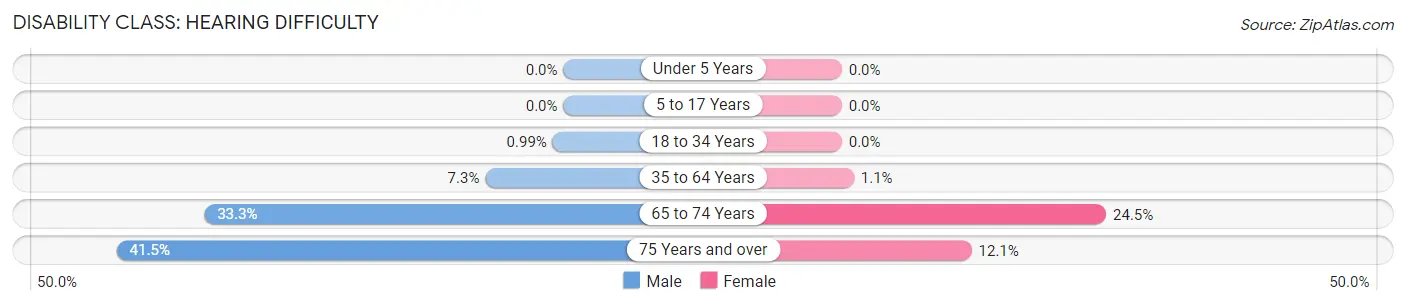
| Age Bracket | Male | Female |
| Under 5 Years | 0 (0.0%) | 0 (0.0%) |
| 5 to 17 Years | 0 (0.0%) | 0 (0.0%) |
| 18 to 34 Years | 2 (1.0%) | 0 (0.0%) |
| 35 to 64 Years | 25 (7.2%) | 4 (1.1%) |
| 65 to 74 Years | 36 (33.3%) | 39 (24.5%) |
| 75 Years and over | 34 (41.5%) | 10 (12.0%) |
Disability Class: Vision Difficulty
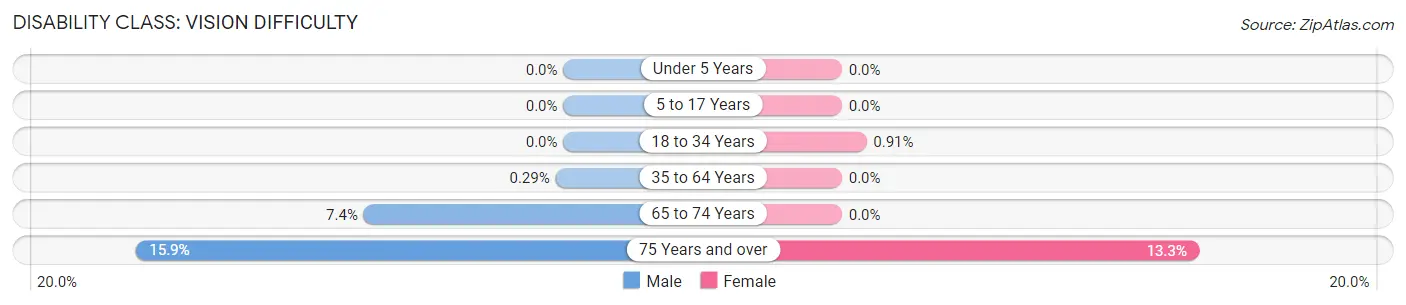
| Age Bracket | Male | Female |
| Under 5 Years | 0 (0.0%) | 0 (0.0%) |
| 5 to 17 Years | 0 (0.0%) | 0 (0.0%) |
| 18 to 34 Years | 0 (0.0%) | 2 (0.9%) |
| 35 to 64 Years | 1 (0.3%) | 0 (0.0%) |
| 65 to 74 Years | 8 (7.4%) | 0 (0.0%) |
| 75 Years and over | 13 (15.9%) | 11 (13.3%) |
Disability Class: Cognitive Difficulty
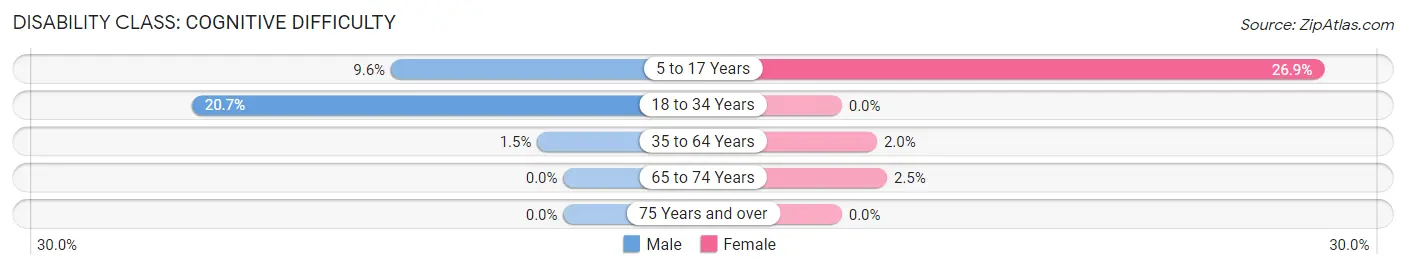
| Age Bracket | Male | Female |
| 5 to 17 Years | 17 (9.6%) | 58 (26.9%) |
| 18 to 34 Years | 42 (20.7%) | 0 (0.0%) |
| 35 to 64 Years | 5 (1.5%) | 7 (2.0%) |
| 65 to 74 Years | 0 (0.0%) | 4 (2.5%) |
| 75 Years and over | 0 (0.0%) | 0 (0.0%) |
Disability Class: Ambulatory Difficulty
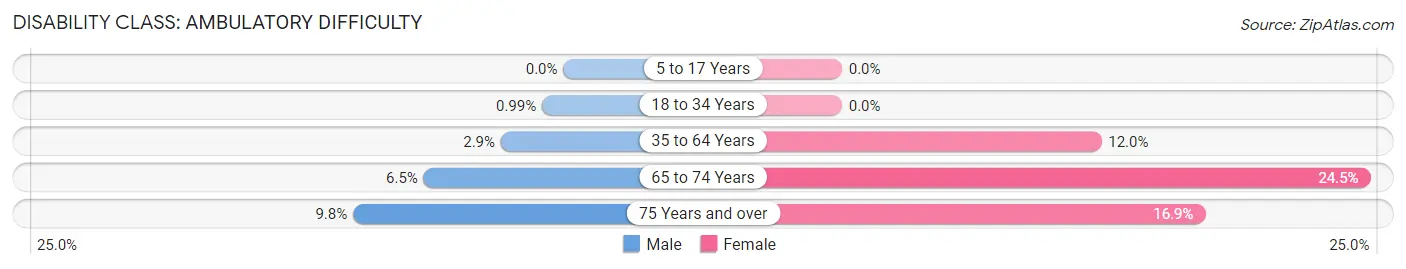
| Age Bracket | Male | Female |
| 5 to 17 Years | 0 (0.0%) | 0 (0.0%) |
| 18 to 34 Years | 2 (1.0%) | 0 (0.0%) |
| 35 to 64 Years | 10 (2.9%) | 43 (12.0%) |
| 65 to 74 Years | 7 (6.5%) | 39 (24.5%) |
| 75 Years and over | 8 (9.8%) | 14 (16.9%) |
Disability Class: Self-Care Difficulty
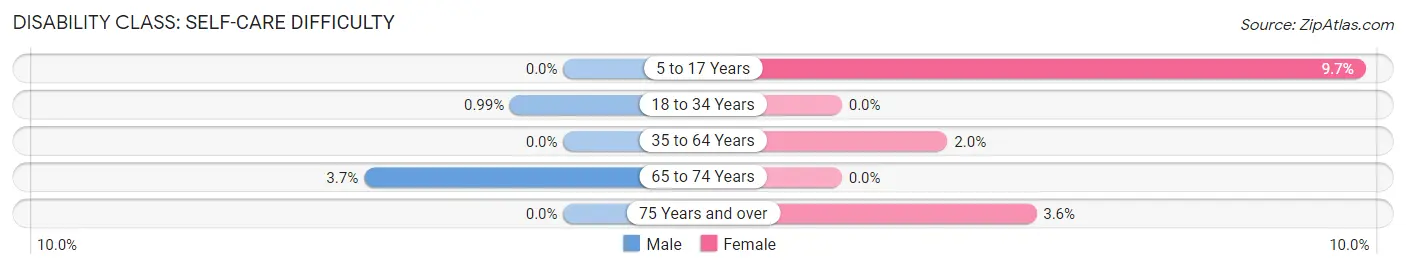
| Age Bracket | Male | Female |
| 5 to 17 Years | 0 (0.0%) | 21 (9.7%) |
| 18 to 34 Years | 2 (1.0%) | 0 (0.0%) |
| 35 to 64 Years | 0 (0.0%) | 7 (2.0%) |
| 65 to 74 Years | 4 (3.7%) | 0 (0.0%) |
| 75 Years and over | 0 (0.0%) | 3 (3.6%) |
Technology Access in Greybull
Computing Device Access in Greybull
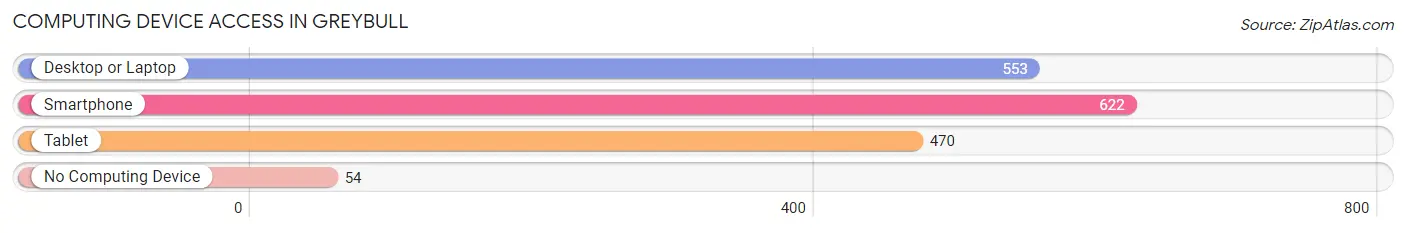
| Device Type | # Households | % Households |
| Desktop or Laptop | 553 | 74.7% |
| Smartphone | 622 | 84.1% |
| Tablet | 470 | 63.5% |
| No Computing Device | 54 | 7.3% |
| Total | 740 | 100.0% |
Internet Access in Greybull
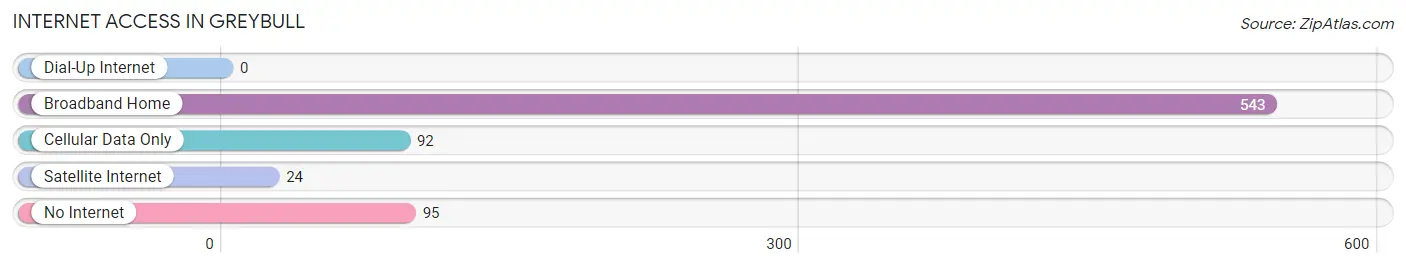
| Internet Type | # Households | % Households |
| Dial-Up Internet | 0 | 0.0% |
| Broadband Home | 543 | 73.4% |
| Cellular Data Only | 92 | 12.4% |
| Satellite Internet | 24 | 3.2% |
| No Internet | 95 | 12.8% |
| Total | 740 | 100.0% |
Greybull Summary
History
Greybull, Wyoming is a small town located in the Big Horn Basin of north-central Wyoming. It is the county seat of Big Horn County and is located on the banks of the Greybull River. The town was founded in 1884 by the Union Pacific Railroad and was named after the Greybull River, which was named after the Grey Bull, a Native American chief of the Arapaho tribe.
The town was originally a stop on the Union Pacific Railroad, and it quickly grew into a bustling town. In the early 1900s, Greybull was a major hub for the cattle industry, with many ranchers and cowboys coming to the area to work. The town also had a large number of saloons, hotels, and other businesses catering to the cowboys and ranchers.
In the 1920s, Greybull began to experience a decline in the cattle industry, and the town began to focus more on tourism. The town was home to a number of tourist attractions, including the Greybull Museum, the Greybull Theater, and the Greybull Hotel.
In the 1950s, Greybull experienced a resurgence in the cattle industry, and the town began to focus more on ranching and farming. The town also became a popular destination for tourists, with many people coming to the area to enjoy the scenery and outdoor activities.
Geography
Greybull is located in the Big Horn Basin of north-central Wyoming. The town is situated on the banks of the Greybull River, and is surrounded by the Big Horn Mountains to the east and the Absaroka Mountains to the west. The town is located at an elevation of 4,890 feet above sea level.
The climate in Greybull is semi-arid, with hot summers and cold winters. The average annual temperature is 45 degrees Fahrenheit, and the average annual precipitation is 12.5 inches.
Economy
The economy of Greybull is largely based on agriculture and tourism. The town is home to a number of farms and ranches, and the surrounding area is known for its cattle and sheep production. The town is also a popular tourist destination, with many people coming to the area to enjoy the scenery and outdoor activities.
The town is also home to a number of businesses, including restaurants, hotels, and retail stores. The town is also home to a number of manufacturing companies, including a plastics factory and a metal fabrication plant.
Demographics
As of the 2010 census, the population of Greybull was 1,876. The racial makeup of the town was 95.3% White, 0.3% African American, 0.7% Native American, 0.3% Asian, 0.1% Pacific Islander, 1.2% from other races, and 2.3% from two or more races. Hispanic or Latino of any race were 4.2% of the population.
The median household income in Greybull was $37,917, and the median family income was $45,625. The per capita income in Greybull was $19,945. About 11.2% of families and 14.2% of the population were below the poverty line, including 17.2% of those under age 18 and 8.2% of those age 65 or over.
Common Questions
What is Per Capita Income in Greybull?
Per Capita income in Greybull is $24,771.
What is the Median Family Income in Greybull?
Median Family Income in Greybull is $81,691.
What is the Median Household income in Greybull?
Median Household Income in Greybull is $64,000.
What is Income or Wage Gap in Greybull?
Income or Wage Gap in Greybull is 15.1%.
Women in Greybull earn 84.9 cents for every dollar earned by a man.
What is Inequality or Gini Index in Greybull?
Inequality or Gini Index in Greybull is 0.38.
What is the Total Population of Greybull?
Total Population of Greybull is 2,145.
What is the Total Male Population of Greybull?
Total Male Population of Greybull is 1,018.
What is the Total Female Population of Greybull?
Total Female Population of Greybull is 1,127.
What is the Ratio of Males per 100 Females in Greybull?
There are 90.33 Males per 100 Females in Greybull.
What is the Ratio of Females per 100 Males in Greybull?
There are 110.71 Females per 100 Males in Greybull.
What is the Median Population Age in Greybull?
Median Population Age in Greybull is 38.3 Years.
What is the Average Family Size in Greybull
Average Family Size in Greybull is 4.0 People.
What is the Average Household Size in Greybull
Average Household Size in Greybull is 2.9 People.
How Large is the Labor Force in Greybull?
There are 1,015 People in the Labor Forcein in Greybull.
What is the Percentage of People in the Labor Force in Greybull?
62.4% of People are in the Labor Force in Greybull.
What is the Unemployment Rate in Greybull?
Unemployment Rate in Greybull is 12.1%.