Fort Washakie, WY Map & Demographics
Fort Washakie Map
Fort Washakie Overview
$17,814
PER CAPITA INCOME
$56,042
AVG FAMILY INCOME
$40,000
AVG HOUSEHOLD INCOME
4.9%
WAGE / INCOME GAP [ % ]
95.1¢/ $1
WAGE / INCOME GAP [ $ ]
$8,959
FAMILY INCOME DEFICIT
0.49
INEQUALITY / GINI INDEX
1,481
TOTAL POPULATION
753
MALE POPULATION
728
FEMALE POPULATION
103.43
MALES / 100 FEMALES
96.68
FEMALES / 100 MALES
31.8
MEDIAN AGE
4.8
AVG FAMILY SIZE
4.1
AVG HOUSEHOLD SIZE
584
LABOR FORCE [ PEOPLE ]
55.3%
PERCENT IN LABOR FORCE
18.5%
UNEMPLOYMENT RATE
Fort Washakie Zip Codes
Fort Washakie Area Codes
Income in Fort Washakie
Income Overview in Fort Washakie
Per Capita Income in Fort Washakie is $17,814, while median incomes of families and households are $56,042 and $40,000 respectively.
| Characteristic | Number | Measure |
| Per Capita Income | 1,481 | $17,814 |
| Median Family Income | 267 | $56,042 |
| Mean Family Income | 267 | $69,122 |
| Median Household Income | 352 | $40,000 |
| Mean Household Income | 352 | $59,199 |
| Income Deficit | 267 | $8,959 |
| Wage / Income Gap (%) | 1,481 | 4.88% |
| Wage / Income Gap ($) | 1,481 | 95.12¢ per $1 |
| Gini / Inequality Index | 1,481 | 0.49 |
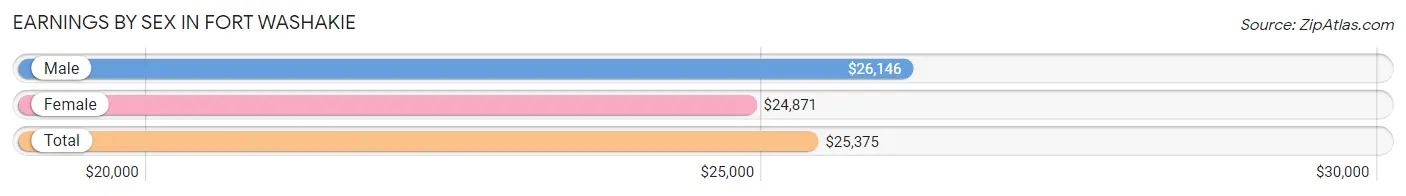
Earnings by Sex in Fort Washakie
Average Earnings in Fort Washakie are $25,375, $26,146 for men and $24,871 for women, a difference of 4.9%.
| Sex | Number | Average Earnings |
| Male | 268 (45.7%) | $26,146 |
| Female | 319 (54.3%) | $24,871 |
| Total | 587 (100.0%) | $25,375 |
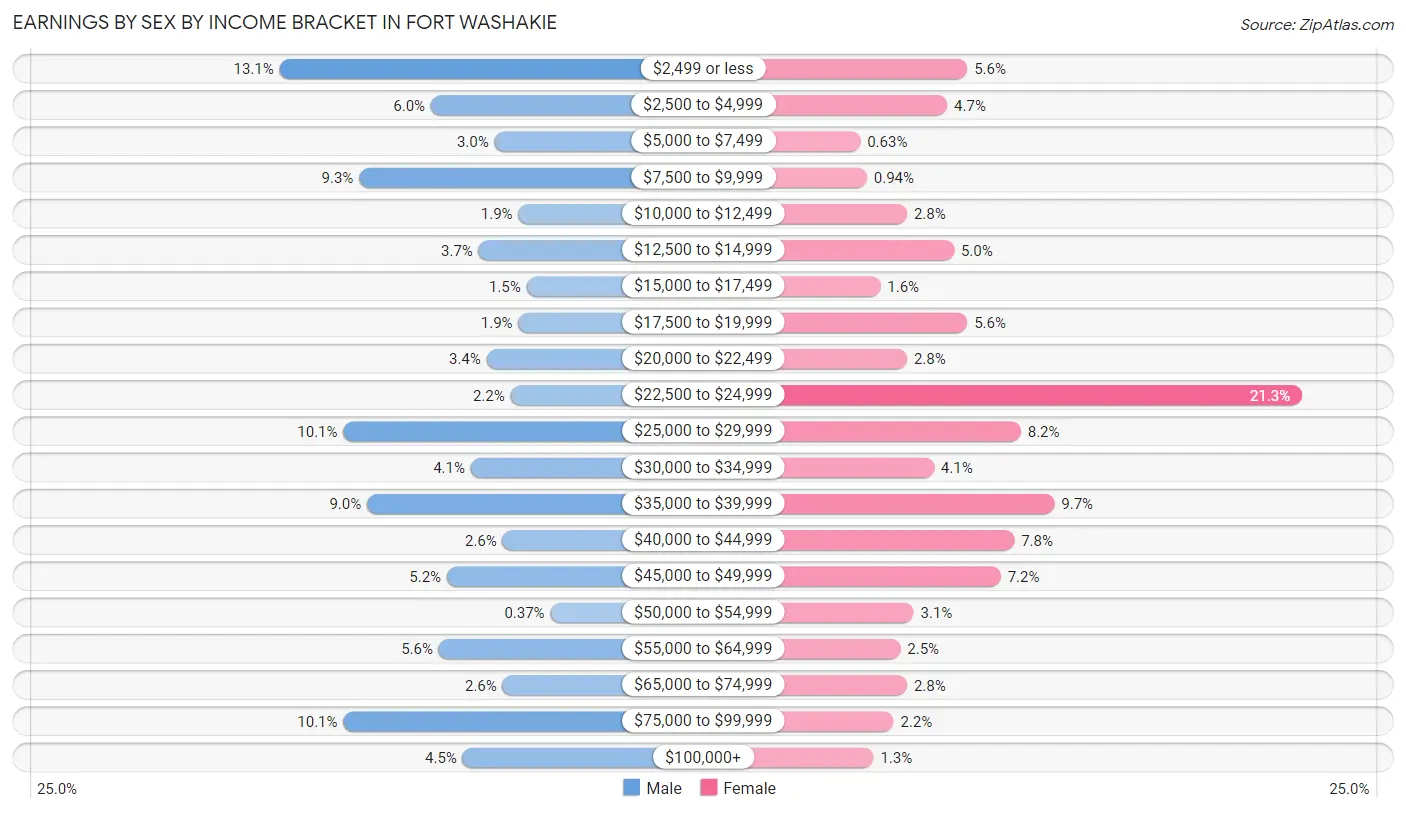
Earnings by Sex by Income Bracket in Fort Washakie
The most common earnings brackets in Fort Washakie are $2,499 or less for men (35 | 13.1%) and $22,500 to $24,999 for women (68 | 21.3%).
| Income | Male | Female |
| $2,499 or less | 35 (13.1%) | 18 (5.6%) |
| $2,500 to $4,999 | 16 (6.0%) | 15 (4.7%) |
| $5,000 to $7,499 | 8 (3.0%) | 2 (0.6%) |
| $7,500 to $9,999 | 25 (9.3%) | 3 (0.9%) |
| $10,000 to $12,499 | 5 (1.9%) | 9 (2.8%) |
| $12,500 to $14,999 | 10 (3.7%) | 16 (5.0%) |
| $15,000 to $17,499 | 4 (1.5%) | 5 (1.6%) |
| $17,500 to $19,999 | 5 (1.9%) | 18 (5.6%) |
| $20,000 to $22,499 | 9 (3.4%) | 9 (2.8%) |
| $22,500 to $24,999 | 6 (2.2%) | 68 (21.3%) |
| $25,000 to $29,999 | 27 (10.1%) | 26 (8.2%) |
| $30,000 to $34,999 | 11 (4.1%) | 13 (4.1%) |
| $35,000 to $39,999 | 24 (9.0%) | 31 (9.7%) |
| $40,000 to $44,999 | 7 (2.6%) | 25 (7.8%) |
| $45,000 to $49,999 | 14 (5.2%) | 23 (7.2%) |
| $50,000 to $54,999 | 1 (0.4%) | 10 (3.1%) |
| $55,000 to $64,999 | 15 (5.6%) | 8 (2.5%) |
| $65,000 to $74,999 | 7 (2.6%) | 9 (2.8%) |
| $75,000 to $99,999 | 27 (10.1%) | 7 (2.2%) |
| $100,000+ | 12 (4.5%) | 4 (1.3%) |
| Total | 268 (100.0%) | 319 (100.0%) |
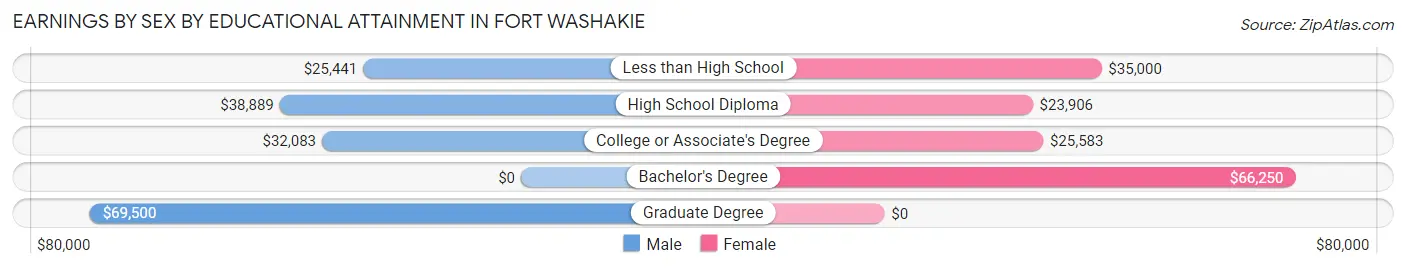
Earnings by Sex by Educational Attainment in Fort Washakie
Average earnings in Fort Washakie are $28,750 for men and $26,625 for women, a difference of 7.4%. Men with an educational attainment of graduate degree enjoy the highest average annual earnings of $69,500, while those with less than high school education earn the least with $25,441. Women with an educational attainment of bachelor's degree earn the most with the average annual earnings of $66,250, while those with high school diploma education have the smallest earnings of $23,906.
| Educational Attainment | Male Income | Female Income |
| Less than High School | $25,441 | $35,000 |
| High School Diploma | $38,889 | $23,906 |
| College or Associate's Degree | $32,083 | $25,583 |
| Bachelor's Degree | - | - |
| Graduate Degree | $69,500 | $0 |
| Total | $28,750 | $26,625 |
Family Income in Fort Washakie
Family Income Brackets in Fort Washakie
According to the Fort Washakie family income data, there are 42 families falling into the $50,000 to $74,999 income range, which is the most common income bracket and makes up 15.7% of all families. Conversely, the $200,000+ income bracket is the least frequent group with only 10 families (3.7%) belonging to this category.
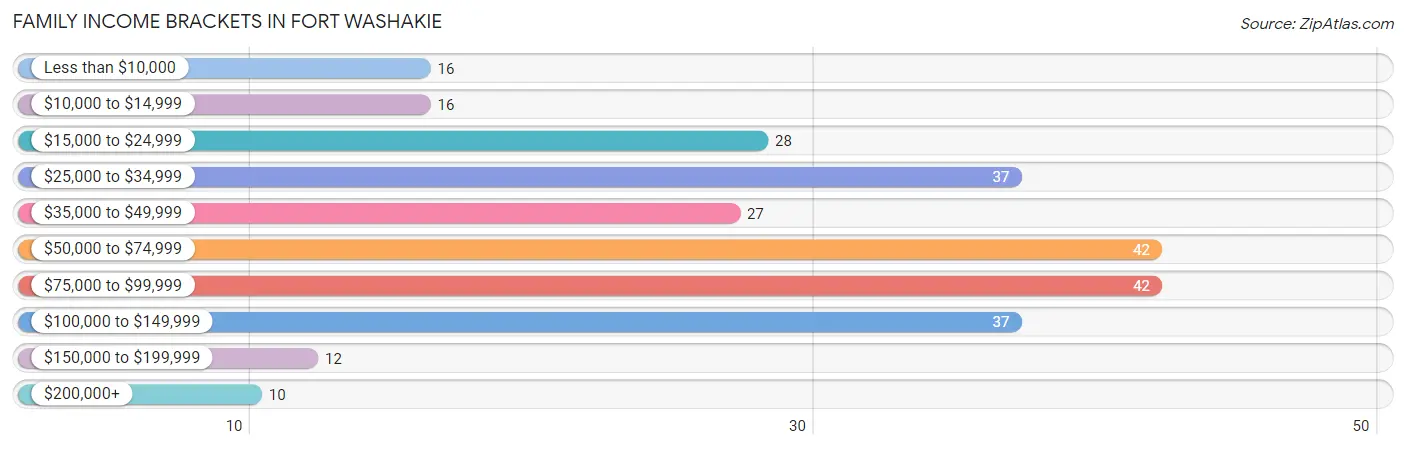
| Income Bracket | # Families | % Families |
| Less than $10,000 | 16 | 6.0% |
| $10,000 to $14,999 | 16 | 6.0% |
| $15,000 to $24,999 | 28 | 10.5% |
| $25,000 to $34,999 | 37 | 13.9% |
| $35,000 to $49,999 | 27 | 10.1% |
| $50,000 to $74,999 | 42 | 15.7% |
| $75,000 to $99,999 | 42 | 15.7% |
| $100,000 to $149,999 | 37 | 13.9% |
| $150,000 to $199,999 | 12 | 4.5% |
| $200,000+ | 10 | 3.7% |
Family Income by Famaliy Size in Fort Washakie
6-person families (30 | 11.2%) account for the highest median family income in Fort Washakie with $92,500 per family, while 2-person families (78 | 29.2%) have the highest median income of $21,250 per family member.
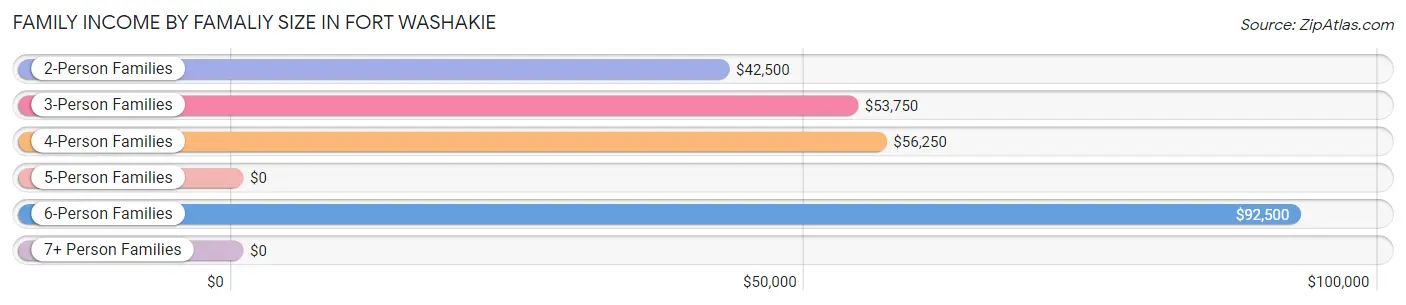
| Income Bracket | # Families | Median Income |
| 2-Person Families | 78 (29.2%) | $42,500 |
| 3-Person Families | 82 (30.7%) | $53,750 |
| 4-Person Families | 45 (16.9%) | $56,250 |
| 5-Person Families | 19 (7.1%) | $0 |
| 6-Person Families | 30 (11.2%) | $92,500 |
| 7+ Person Families | 13 (4.9%) | $0 |
| Total | 267 (100.0%) | $56,042 |
Family Income by Number of Earners in Fort Washakie
The median family income in Fort Washakie is $56,042, with families comprising 2 earners (80) having the highest median family income of $103,750, while families with no earners (48) have the lowest median family income of $21,500, accounting for 30.0% and 18.0% of families, respectively.
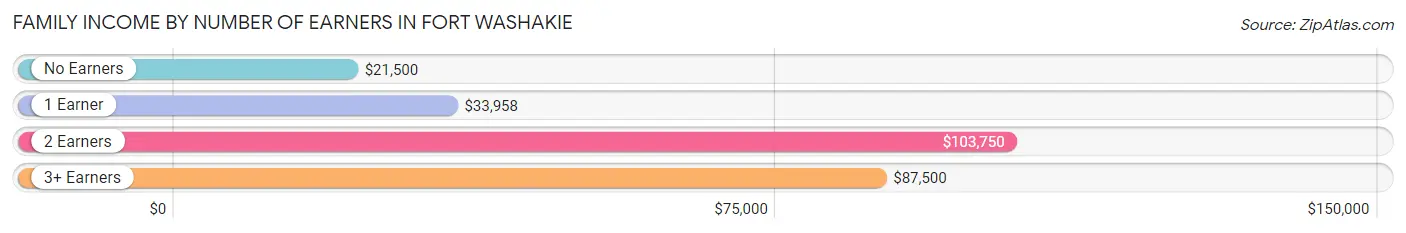
| Number of Earners | # Families | Median Income |
| No Earners | 48 (18.0%) | $21,500 |
| 1 Earner | 101 (37.8%) | $33,958 |
| 2 Earners | 80 (30.0%) | $103,750 |
| 3+ Earners | 38 (14.2%) | $87,500 |
| Total | 267 (100.0%) | $56,042 |
Household Income in Fort Washakie
Household Income Brackets in Fort Washakie
With 52 households falling in the category, the $15,000 to $24,999 income range is the most frequent in Fort Washakie, accounting for 14.8% of all households. In contrast, only 10 households (2.8%) fall into the $200,000+ income bracket, making it the least populous group.
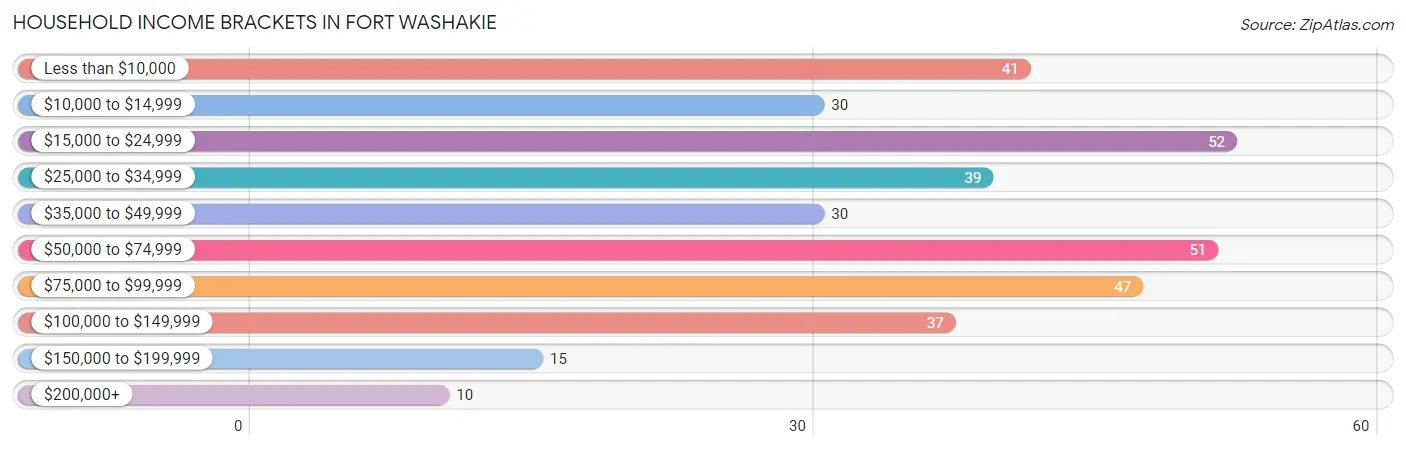
| Income Bracket | # Households | % Households |
| Less than $10,000 | 41 | 11.6% |
| $10,000 to $14,999 | 30 | 8.5% |
| $15,000 to $24,999 | 52 | 14.8% |
| $25,000 to $34,999 | 39 | 11.1% |
| $35,000 to $49,999 | 30 | 8.5% |
| $50,000 to $74,999 | 51 | 14.5% |
| $75,000 to $99,999 | 47 | 13.4% |
| $100,000 to $149,999 | 37 | 10.5% |
| $150,000 to $199,999 | 15 | 4.3% |
| $200,000+ | 10 | 2.8% |
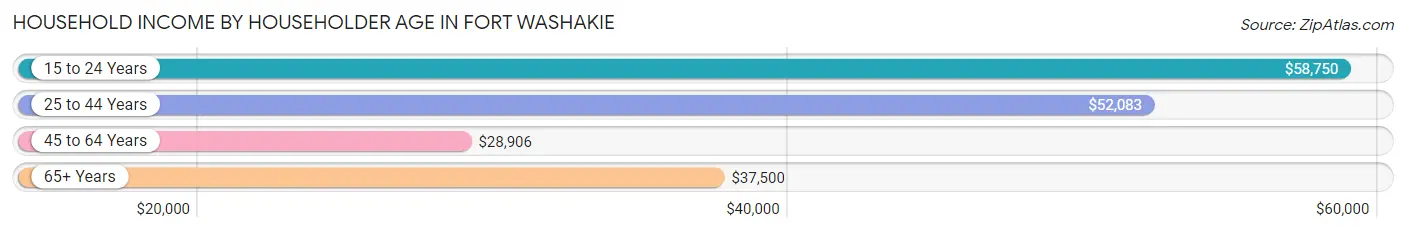
Household Income by Householder Age in Fort Washakie
The median household income in Fort Washakie is $40,000, with the highest median household income of $58,750 found in the 15 to 24 years age bracket for the primary householder. A total of 6 households (1.7%) fall into this category. Meanwhile, the 45 to 64 years age bracket for the primary householder has the lowest median household income of $28,906, with 141 households (40.1%) in this group.
| Income Bracket | # Households | Median Income |
| 15 to 24 Years | 6 (1.7%) | $58,750 |
| 25 to 44 Years | 91 (25.9%) | $52,083 |
| 45 to 64 Years | 141 (40.1%) | $28,906 |
| 65+ Years | 114 (32.4%) | $37,500 |
| Total | 352 (100.0%) | $40,000 |
Poverty in Fort Washakie
Income Below Poverty by Sex and Age in Fort Washakie
With 28.7% poverty level for males and 25.4% for females among the residents of Fort Washakie, 15 year old males and 16 and 17 year old females are the most vulnerable to poverty, with 11 males (52.4%) and 13 females (54.2%) in their respective age groups living below the poverty level.
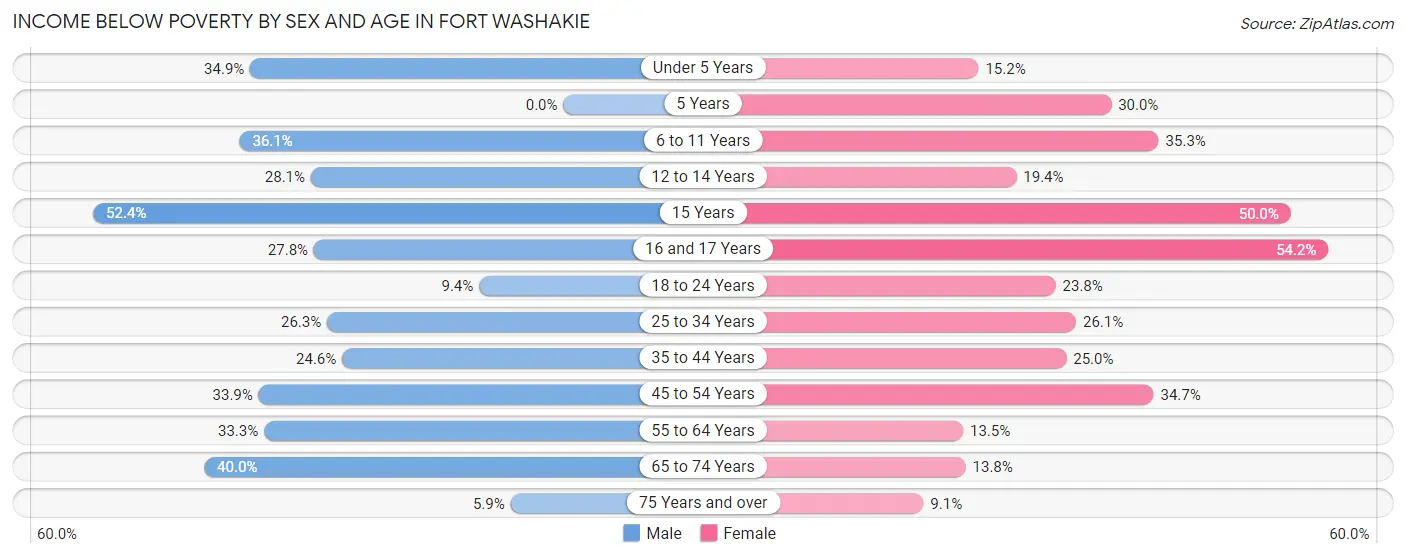
| Age Bracket | Male | Female |
| Under 5 Years | 15 (34.9%) | 7 (15.2%) |
| 5 Years | 0 (0.0%) | 3 (30.0%) |
| 6 to 11 Years | 22 (36.1%) | 36 (35.3%) |
| 12 to 14 Years | 18 (28.1%) | 7 (19.4%) |
| 15 Years | 11 (52.4%) | 8 (50.0%) |
| 16 and 17 Years | 15 (27.8%) | 13 (54.2%) |
| 18 to 24 Years | 6 (9.4%) | 20 (23.8%) |
| 25 to 34 Years | 20 (26.3%) | 24 (26.1%) |
| 35 to 44 Years | 17 (24.6%) | 18 (25.0%) |
| 45 to 54 Years | 37 (33.9%) | 25 (34.7%) |
| 55 to 64 Years | 34 (33.3%) | 5 (13.5%) |
| 65 to 74 Years | 14 (40.0%) | 8 (13.8%) |
| 75 Years and over | 1 (5.9%) | 5 (9.1%) |
| Total | 210 (28.7%) | 179 (25.4%) |
Income Above Poverty by Sex and Age in Fort Washakie
According to the poverty statistics in Fort Washakie, males aged 5 years and females aged 75 years and over are the age groups that are most secure financially, with 100.0% of males and 90.9% of females in these age groups living above the poverty line.
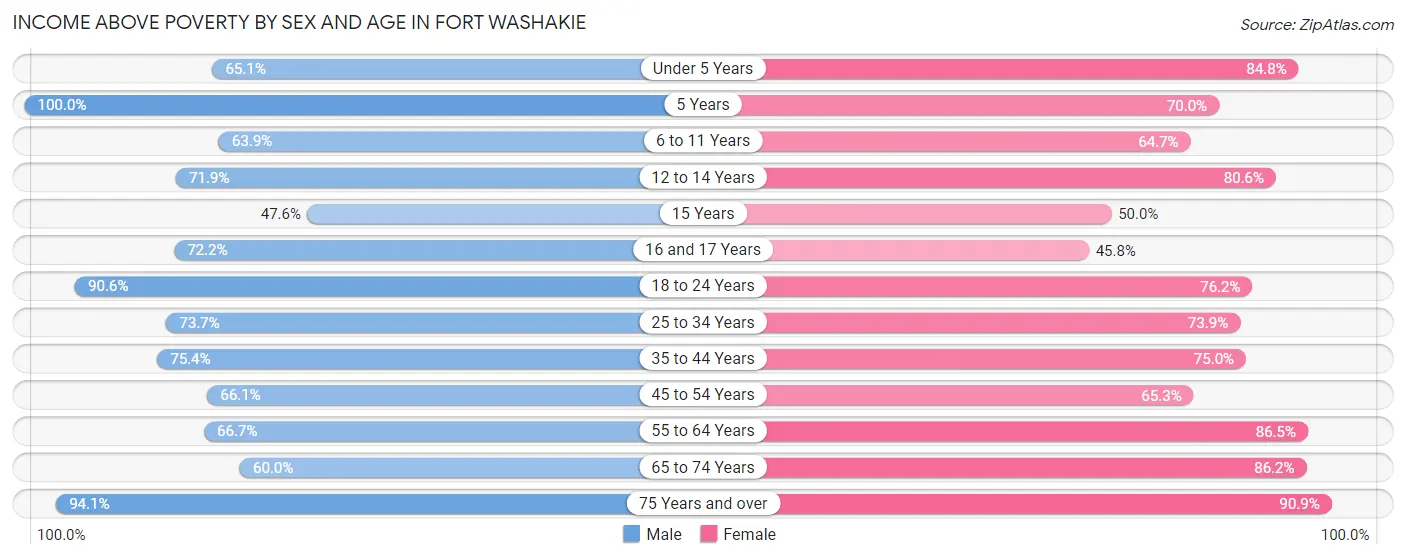
| Age Bracket | Male | Female |
| Under 5 Years | 28 (65.1%) | 39 (84.8%) |
| 5 Years | 17 (100.0%) | 7 (70.0%) |
| 6 to 11 Years | 39 (63.9%) | 66 (64.7%) |
| 12 to 14 Years | 46 (71.9%) | 29 (80.6%) |
| 15 Years | 10 (47.6%) | 8 (50.0%) |
| 16 and 17 Years | 39 (72.2%) | 11 (45.8%) |
| 18 to 24 Years | 58 (90.6%) | 64 (76.2%) |
| 25 to 34 Years | 56 (73.7%) | 68 (73.9%) |
| 35 to 44 Years | 52 (75.4%) | 54 (75.0%) |
| 45 to 54 Years | 72 (66.1%) | 47 (65.3%) |
| 55 to 64 Years | 68 (66.7%) | 32 (86.5%) |
| 65 to 74 Years | 21 (60.0%) | 50 (86.2%) |
| 75 Years and over | 16 (94.1%) | 50 (90.9%) |
| Total | 522 (71.3%) | 525 (74.6%) |
Income Below Poverty Among Married-Couple Families in Fort Washakie
The poverty statistics for married-couple families in Fort Washakie show that 14.4% or 17 of the total 118 families live below the poverty line. Families with 5 or more children have the highest poverty rate of 100.0%, comprising of 3 families. On the other hand, families with no children have the lowest poverty rate of 10.0%, which includes 5 families.
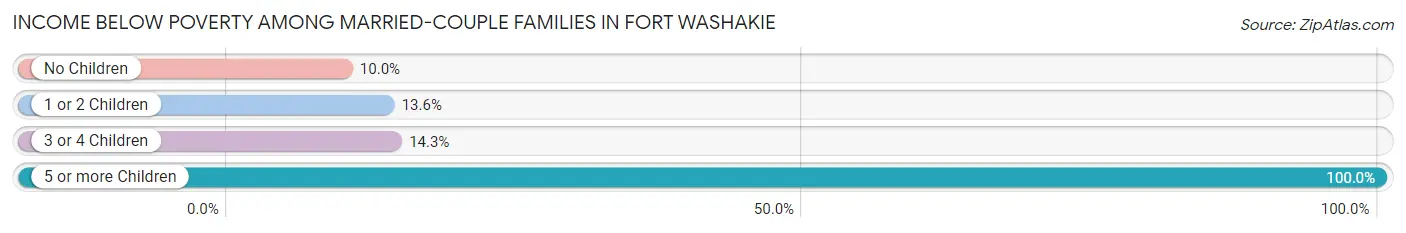
| Children | Above Poverty | Below Poverty |
| No Children | 45 (90.0%) | 5 (10.0%) |
| 1 or 2 Children | 38 (86.4%) | 6 (13.6%) |
| 3 or 4 Children | 18 (85.7%) | 3 (14.3%) |
| 5 or more Children | 0 (0.0%) | 3 (100.0%) |
| Total | 101 (85.6%) | 17 (14.4%) |
Income Below Poverty Among Single-Parent Households in Fort Washakie
According to the poverty data in Fort Washakie, 46.8% or 22 single-father households and 30.4% or 31 single-mother households are living below the poverty line. Among single-father households, those with 3 or 4 children have the highest poverty rate, with 1 households (100.0%) experiencing poverty. Likewise, among single-mother households, those with 1 or 2 children have the highest poverty rate, with 16 households (36.4%) falling below the poverty line.
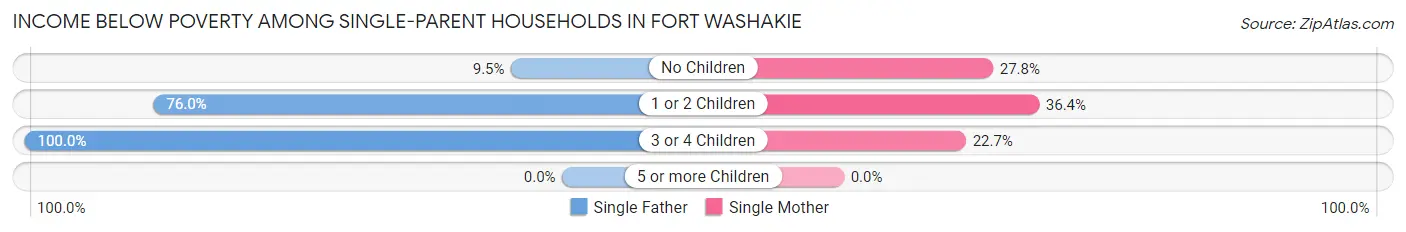
| Children | Single Father | Single Mother |
| No Children | 2 (9.5%) | 10 (27.8%) |
| 1 or 2 Children | 19 (76.0%) | 16 (36.4%) |
| 3 or 4 Children | 1 (100.0%) | 5 (22.7%) |
| 5 or more Children | 0 (0.0%) | 0 (0.0%) |
| Total | 22 (46.8%) | 31 (30.4%) |
Income Below Poverty Among Married-Couple vs Single-Parent Households in Fort Washakie
The poverty data for Fort Washakie shows that 17 of the married-couple family households (14.4%) and 53 of the single-parent households (35.6%) are living below the poverty level. Within the married-couple family households, those with 5 or more children have the highest poverty rate, with 3 households (100.0%) falling below the poverty line. Among the single-parent households, those with 1 or 2 children have the highest poverty rate, with 35 household (50.7%) living below poverty.
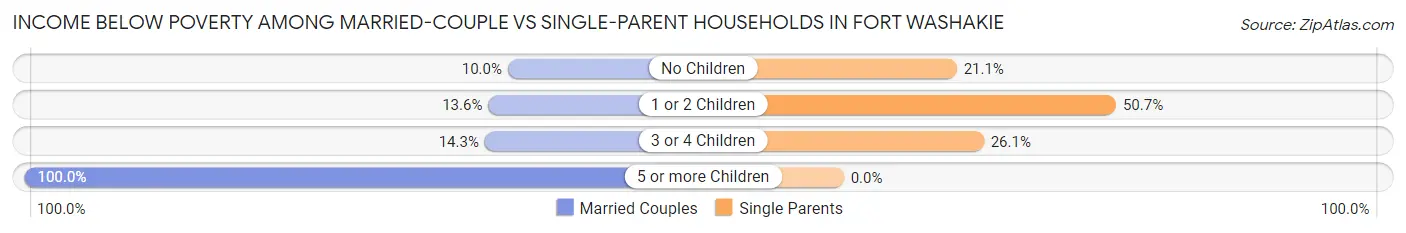
| Children | Married-Couple Families | Single-Parent Households |
| No Children | 5 (10.0%) | 12 (21.0%) |
| 1 or 2 Children | 6 (13.6%) | 35 (50.7%) |
| 3 or 4 Children | 3 (14.3%) | 6 (26.1%) |
| 5 or more Children | 3 (100.0%) | 0 (0.0%) |
| Total | 17 (14.4%) | 53 (35.6%) |
Race in Fort Washakie
The most populous races in Fort Washakie are Native / Alaskan (1,358 | 91.7%), Hispanic or Latino (78 | 5.3%), and White / Caucasian (70 | 4.7%).
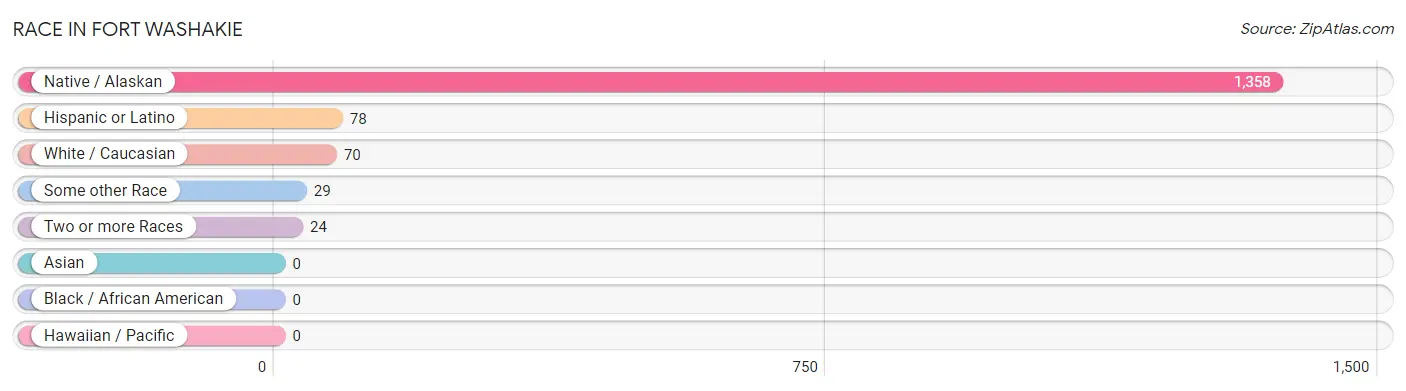
| Race | # Population | % Population |
| Asian | 0 | 0.0% |
| Black / African American | 0 | 0.0% |
| Hawaiian / Pacific | 0 | 0.0% |
| Hispanic or Latino | 78 | 5.3% |
| Native / Alaskan | 1,358 | 91.7% |
| White / Caucasian | 70 | 4.7% |
| Two or more Races | 24 | 1.6% |
| Some other Race | 29 | 2.0% |
| Total | 1,481 | 100.0% |
Ancestry in Fort Washakie
The most populous ancestries reported in Fort Washakie are Shoshone (946 | 63.9%), Arapaho (141 | 9.5%), Navajo (79 | 5.3%), Mexican (58 | 3.9%), and Sioux (48 | 3.2%), together accounting for 85.9% of all Fort Washakie residents.
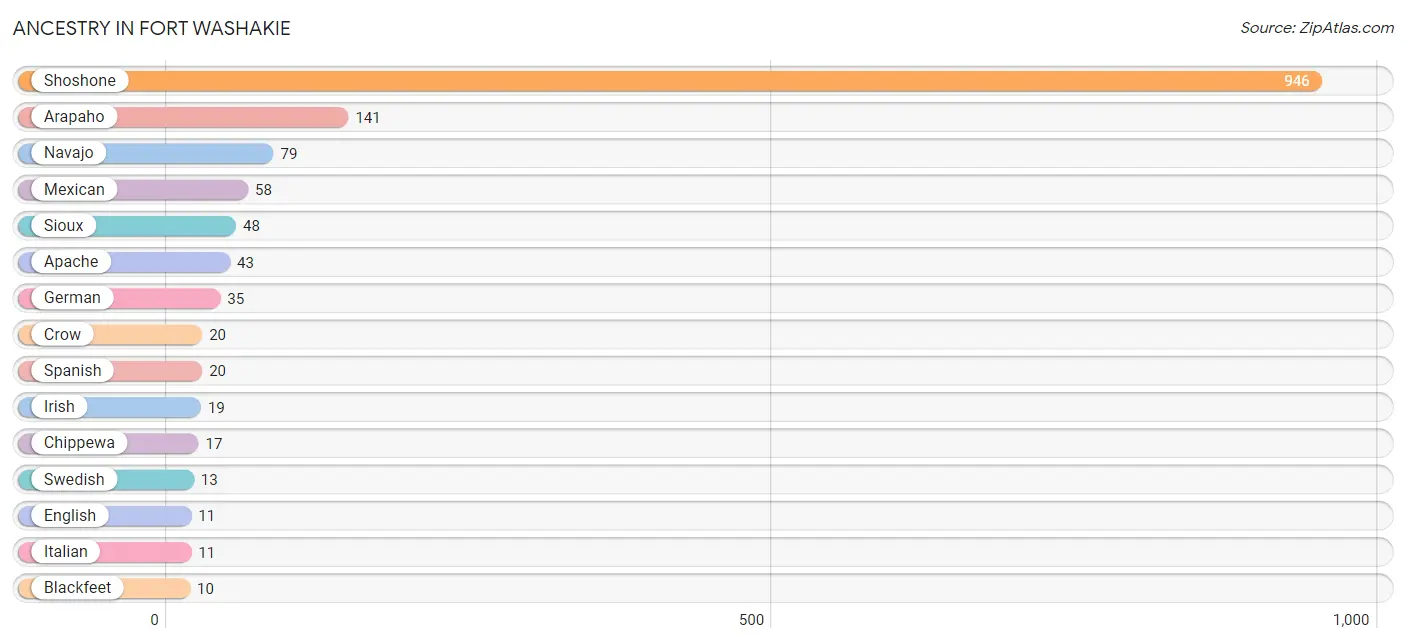
| Ancestry | # Population | % Population |
| Alaska Native | 2 | 0.1% |
| Apache | 43 | 2.9% |
| Arapaho | 141 | 9.5% |
| Blackfeet | 10 | 0.7% |
| Cheyenne | 10 | 0.7% |
| Chippewa | 17 | 1.1% |
| Crow | 20 | 1.3% |
| Danish | 3 | 0.2% |
| Eastern European | 3 | 0.2% |
| English | 11 | 0.7% |
| French | 6 | 0.4% |
| German | 35 | 2.4% |
| Irish | 19 | 1.3% |
| Iroquois | 5 | 0.3% |
| Italian | 11 | 0.7% |
| Mexican | 58 | 3.9% |
| Navajo | 79 | 5.3% |
| Pima | 3 | 0.2% |
| Scandinavian | 1 | 0.1% |
| Shoshone | 946 | 63.9% |
| Sioux | 48 | 3.2% |
| Spanish | 20 | 1.3% |
| Swedish | 13 | 0.9% |
| Ute | 8 | 0.5% |
| Welsh | 2 | 0.1% | View All 25 Rows |
Immigrants in Fort Washakie
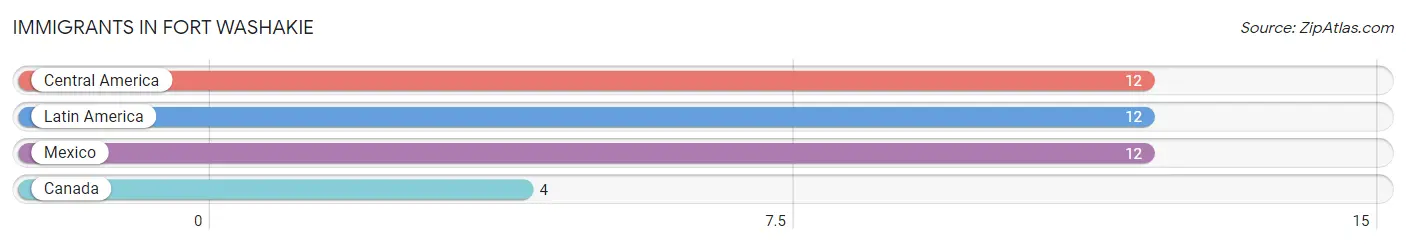
The most numerous immigrant groups reported in Fort Washakie came from Central America (12 | 0.8%), Latin America (12 | 0.8%), Mexico (12 | 0.8%), and Canada (4 | 0.3%), together accounting for 2.7% of all Fort Washakie residents.
| Immigration Origin | # Population | % Population |
| Canada | 4 | 0.3% |
| Central America | 12 | 0.8% |
| Latin America | 12 | 0.8% |
| Mexico | 12 | 0.8% | View All 4 Rows |
Sex and Age in Fort Washakie
Sex and Age in Fort Washakie
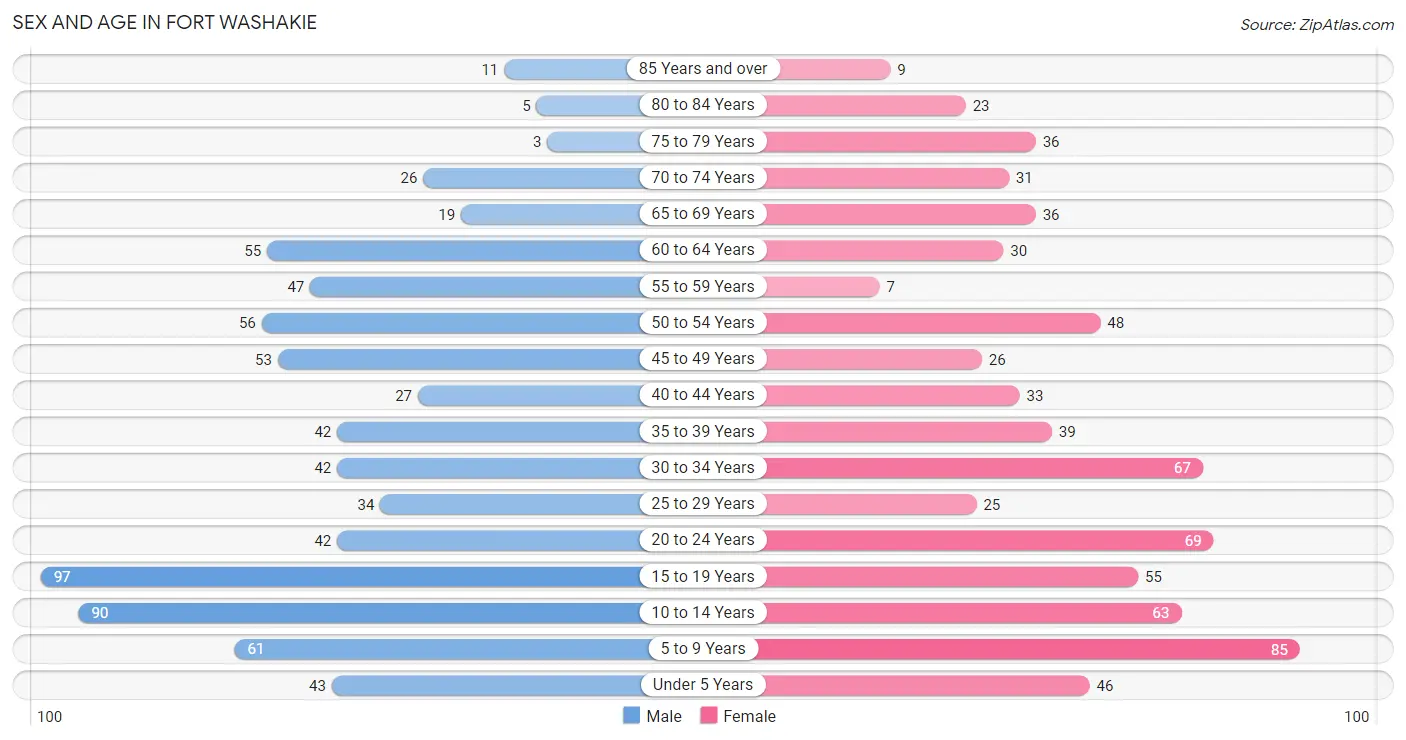
The most populous age groups in Fort Washakie are 15 to 19 Years (97 | 12.9%) for men and 5 to 9 Years (85 | 11.7%) for women.
| Age Bracket | Male | Female |
| Under 5 Years | 43 (5.7%) | 46 (6.3%) |
| 5 to 9 Years | 61 (8.1%) | 85 (11.7%) |
| 10 to 14 Years | 90 (11.9%) | 63 (8.6%) |
| 15 to 19 Years | 97 (12.9%) | 55 (7.5%) |
| 20 to 24 Years | 42 (5.6%) | 69 (9.5%) |
| 25 to 29 Years | 34 (4.5%) | 25 (3.4%) |
| 30 to 34 Years | 42 (5.6%) | 67 (9.2%) |
| 35 to 39 Years | 42 (5.6%) | 39 (5.4%) |
| 40 to 44 Years | 27 (3.6%) | 33 (4.5%) |
| 45 to 49 Years | 53 (7.0%) | 26 (3.6%) |
| 50 to 54 Years | 56 (7.4%) | 48 (6.6%) |
| 55 to 59 Years | 47 (6.2%) | 7 (1.0%) |
| 60 to 64 Years | 55 (7.3%) | 30 (4.1%) |
| 65 to 69 Years | 19 (2.5%) | 36 (5.0%) |
| 70 to 74 Years | 26 (3.5%) | 31 (4.3%) |
| 75 to 79 Years | 3 (0.4%) | 36 (5.0%) |
| 80 to 84 Years | 5 (0.7%) | 23 (3.2%) |
| 85 Years and over | 11 (1.5%) | 9 (1.2%) |
| Total | 753 (100.0%) | 728 (100.0%) |
Families and Households in Fort Washakie
Median Family Size in Fort Washakie
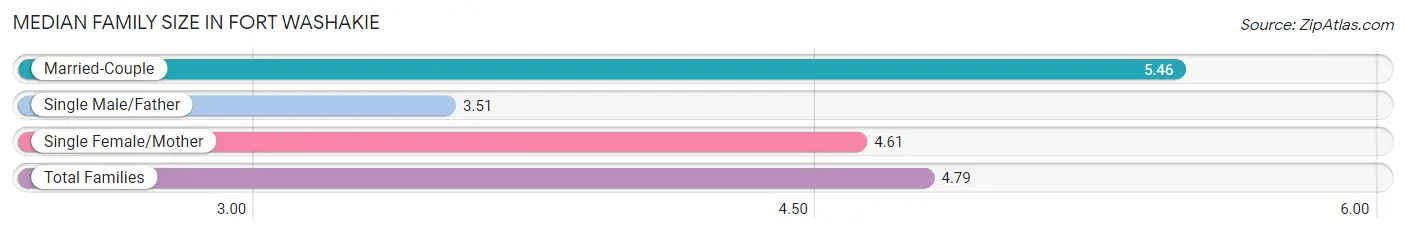
The median family size in Fort Washakie is 4.79 persons per family, with married-couple families (118 | 44.2%) accounting for the largest median family size of 5.46 persons per family. On the other hand, single male/father families (47 | 17.6%) represent the smallest median family size with 3.51 persons per family.
| Family Type | # Families | Family Size |
| Married-Couple | 118 (44.2%) | 5.46 |
| Single Male/Father | 47 (17.6%) | 3.51 |
| Single Female/Mother | 102 (38.2%) | 4.61 |
| Total Families | 267 (100.0%) | 4.79 |
Median Household Size in Fort Washakie
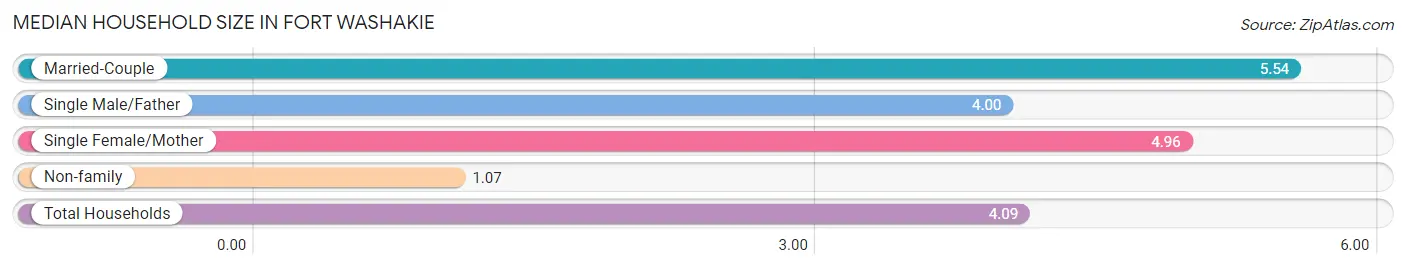
The median household size in Fort Washakie is 4.09 persons per household, with married-couple households (118 | 33.5%) accounting for the largest median household size of 5.54 persons per household. non-family households (85 | 24.1%) represent the smallest median household size with 1.07 persons per household.
| Household Type | # Households | Household Size |
| Married-Couple | 118 (33.5%) | 5.54 |
| Single Male/Father | 47 (13.4%) | 4.00 |
| Single Female/Mother | 102 (29.0%) | 4.96 |
| Non-family | 85 (24.1%) | 1.07 |
| Total Households | 352 (100.0%) | 4.09 |
Household Size by Marriage Status in Fort Washakie
Out of a total of 352 households in Fort Washakie, 267 (75.8%) are family households, while 85 (24.1%) are nonfamily households. The most numerous type of family households are 3-person households, comprising 78, and the most common type of nonfamily households are 1-person households, comprising 80.
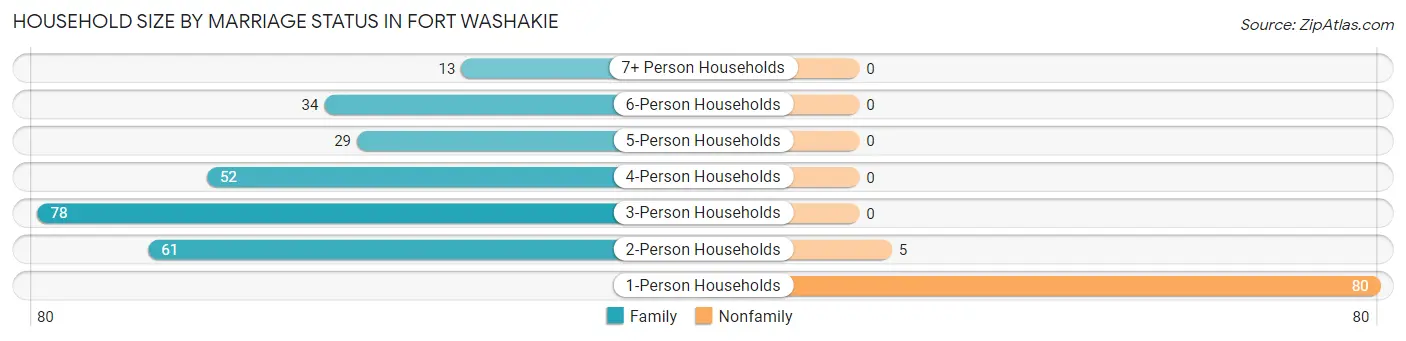
| Household Size | Family Households | Nonfamily Households |
| 1-Person Households | - | 80 (22.7%) |
| 2-Person Households | 61 (17.3%) | 5 (1.4%) |
| 3-Person Households | 78 (22.2%) | 0 (0.0%) |
| 4-Person Households | 52 (14.8%) | 0 (0.0%) |
| 5-Person Households | 29 (8.2%) | 0 (0.0%) |
| 6-Person Households | 34 (9.7%) | 0 (0.0%) |
| 7+ Person Households | 13 (3.7%) | 0 (0.0%) |
| Total | 267 (75.8%) | 85 (24.1%) |
Female Fertility in Fort Washakie
Fertility by Age in Fort Washakie
Average fertility rate in Fort Washakie is 69.0 births per 1,000 women. Women in the age bracket of 20 to 34 years have the highest fertility rate with 118.0 births per 1,000 women. Women in the age bracket of 20 to 34 years acount for 86.4% of all women with births.
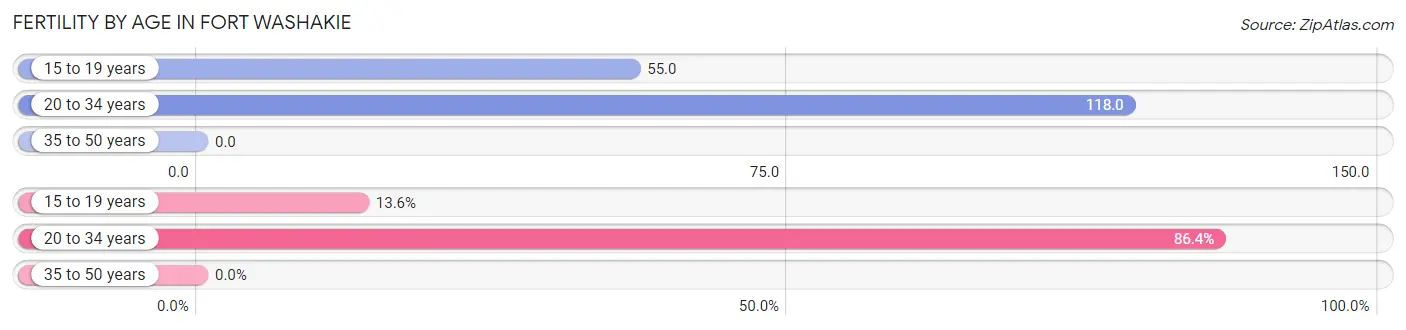
| Age Bracket | Women with Births | Births / 1,000 Women |
| 15 to 19 years | 3 (13.6%) | 55.0 |
| 20 to 34 years | 19 (86.4%) | 118.0 |
| 35 to 50 years | 0 (0.0%) | 0.0 |
| Total | 22 (100.0%) | 69.0 |
Fertility by Age by Marriage Status in Fort Washakie
40.9% of women with births (22) in Fort Washakie are married. The highest percentage of unmarried women with births falls into 15 to 19 years age bracket with 100.0% of them unmarried at the time of birth, while the lowest percentage of unmarried women with births belong to 20 to 34 years age bracket with 52.6% of them unmarried.
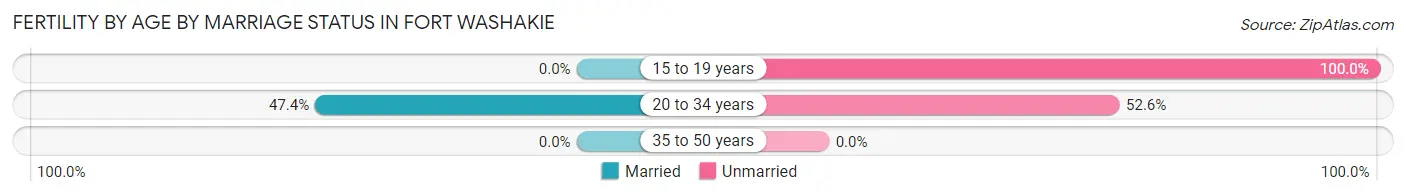
| Age Bracket | Married | Unmarried |
| 15 to 19 years | 0 (0.0%) | 3 (100.0%) |
| 20 to 34 years | 9 (47.4%) | 10 (52.6%) |
| 35 to 50 years | 0 (0.0%) | 0 (0.0%) |
| Total | 9 (40.9%) | 13 (59.1%) |
Fertility by Education in Fort Washakie
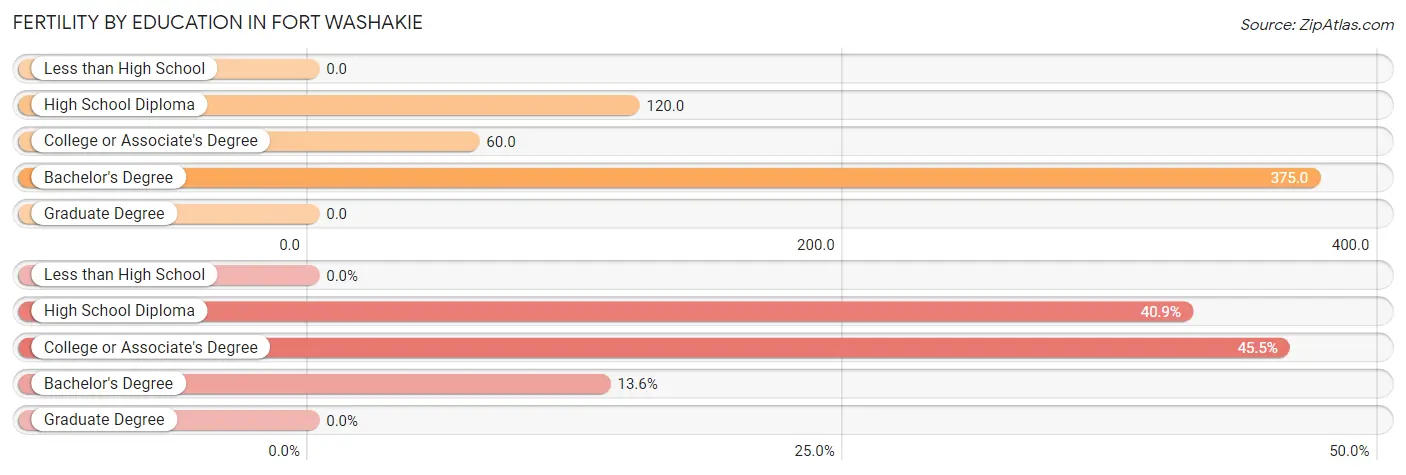
| Educational Attainment | Women with Births | Births / 1,000 Women |
| Less than High School | 0 (0.0%) | 0.0 |
| High School Diploma | 9 (40.9%) | 120.0 |
| College or Associate's Degree | 10 (45.5%) | 60.0 |
| Bachelor's Degree | 3 (13.6%) | 375.0 |
| Graduate Degree | 0 (0.0%) | 0.0 |
| Total | 22 (100.0%) | 69.0 |
Fertility by Education by Marriage Status in Fort Washakie
59.1% of women with births in Fort Washakie are unmarried. Women with the educational attainment of bachelor's degree are most likely to be married with 100.0% of them married at childbirth, while women with the educational attainment of college or associate's degree are least likely to be married with 100.0% of them unmarried at childbirth.
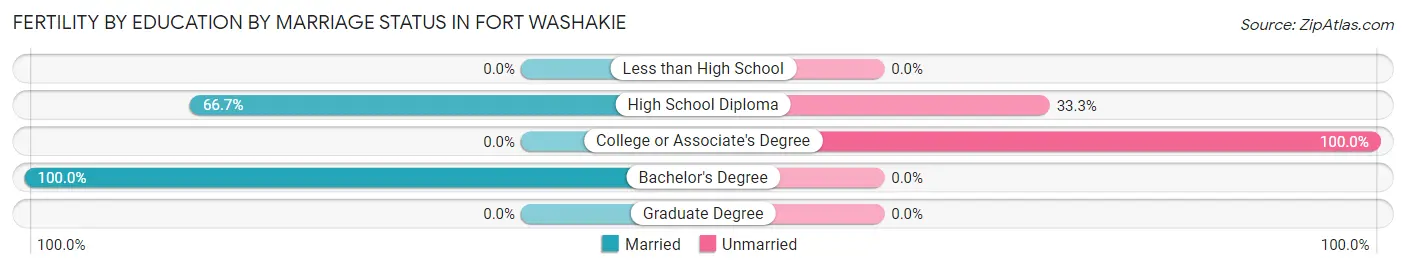
| Educational Attainment | Married | Unmarried |
| Less than High School | 0 (0.0%) | 0 (0.0%) |
| High School Diploma | 6 (66.7%) | 3 (33.3%) |
| College or Associate's Degree | 0 (0.0%) | 10 (100.0%) |
| Bachelor's Degree | 3 (100.0%) | 0 (0.0%) |
| Graduate Degree | 0 (0.0%) | 0 (0.0%) |
| Total | 9 (40.9%) | 13 (59.1%) |
Employment Characteristics in Fort Washakie
Employment by Class of Employer in Fort Washakie
Among the 451 employed individuals in Fort Washakie, local government employees (293 | 65.0%), private company employees (82 | 18.2%), and federal government employees (40 | 8.9%) make up the most common classes of employment.
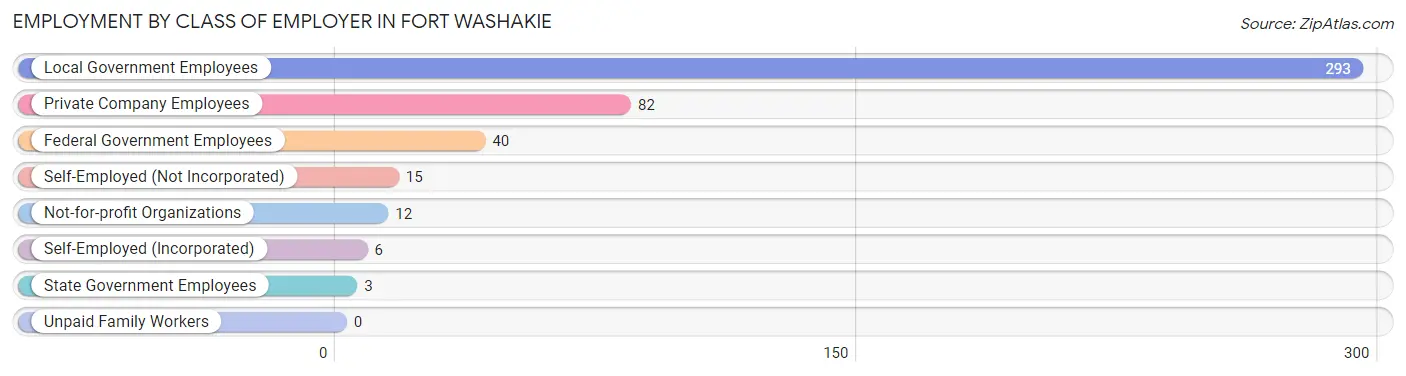
| Employer Class | # Employees | % Employees |
| Private Company Employees | 82 | 18.2% |
| Self-Employed (Incorporated) | 6 | 1.3% |
| Self-Employed (Not Incorporated) | 15 | 3.3% |
| Not-for-profit Organizations | 12 | 2.7% |
| Local Government Employees | 293 | 65.0% |
| State Government Employees | 3 | 0.7% |
| Federal Government Employees | 40 | 8.9% |
| Unpaid Family Workers | 0 | 0.0% |
| Total | 451 | 100.0% |
Employment Status by Age in Fort Washakie
According to the labor force statistics for Fort Washakie, out of the total population over 16 years of age (1,056), 55.3% or 584 individuals are in the labor force, with 18.5% or 108 of them unemployed. The age group with the highest labor force participation rate is 25 to 29 years, with 83.1% or 49 individuals in the labor force. Within the labor force, the 16 to 19 years age range has the highest percentage of unemployed individuals, with 33.3% or 10 of them being unemployed.
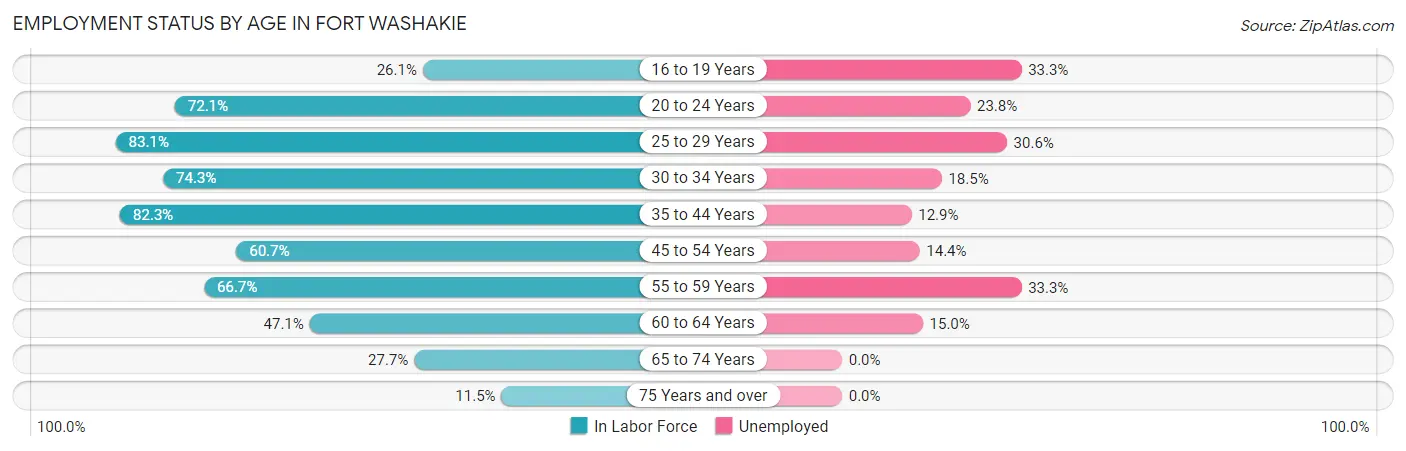
| Age Bracket | In Labor Force | Unemployed |
| 16 to 19 Years | 30 (26.1%) | 10 (33.3%) |
| 20 to 24 Years | 80 (72.1%) | 19 (23.8%) |
| 25 to 29 Years | 49 (83.1%) | 15 (30.6%) |
| 30 to 34 Years | 81 (74.3%) | 15 (18.5%) |
| 35 to 44 Years | 116 (82.3%) | 15 (12.9%) |
| 45 to 54 Years | 111 (60.7%) | 16 (14.4%) |
| 55 to 59 Years | 36 (66.7%) | 12 (33.3%) |
| 60 to 64 Years | 40 (47.1%) | 6 (15.0%) |
| 65 to 74 Years | 31 (27.7%) | 0 (0.0%) |
| 75 Years and over | 10 (11.5%) | 0 (0.0%) |
| Total | 584 (55.3%) | 108 (18.5%) |
Employment Status by Educational Attainment in Fort Washakie
According to labor force statistics for Fort Washakie, 68.6% of individuals (433) out of the total population between 25 and 64 years of age (631) are in the labor force, with 18.2% or 79 of them being unemployed. The group with the highest labor force participation rate are those with the educational attainment of bachelor's degree or higher, with 94.1% or 48 individuals in the labor force. Within the labor force, individuals with less than high school education have the highest percentage of unemployment, with 30.2% or 19 of them being unemployed.
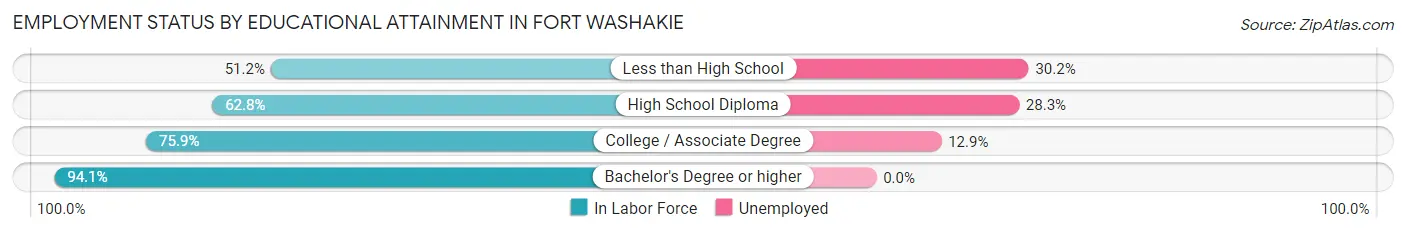
| Educational Attainment | In Labor Force | Unemployed |
| Less than High School | 63 (51.2%) | 37 (30.2%) |
| High School Diploma | 120 (62.8%) | 54 (28.3%) |
| College / Associate Degree | 202 (75.9%) | 34 (12.9%) |
| Bachelor's Degree or higher | 48 (94.1%) | 0 (0.0%) |
| Total | 433 (68.6%) | 115 (18.2%) |
Employment Occupations by Sex in Fort Washakie
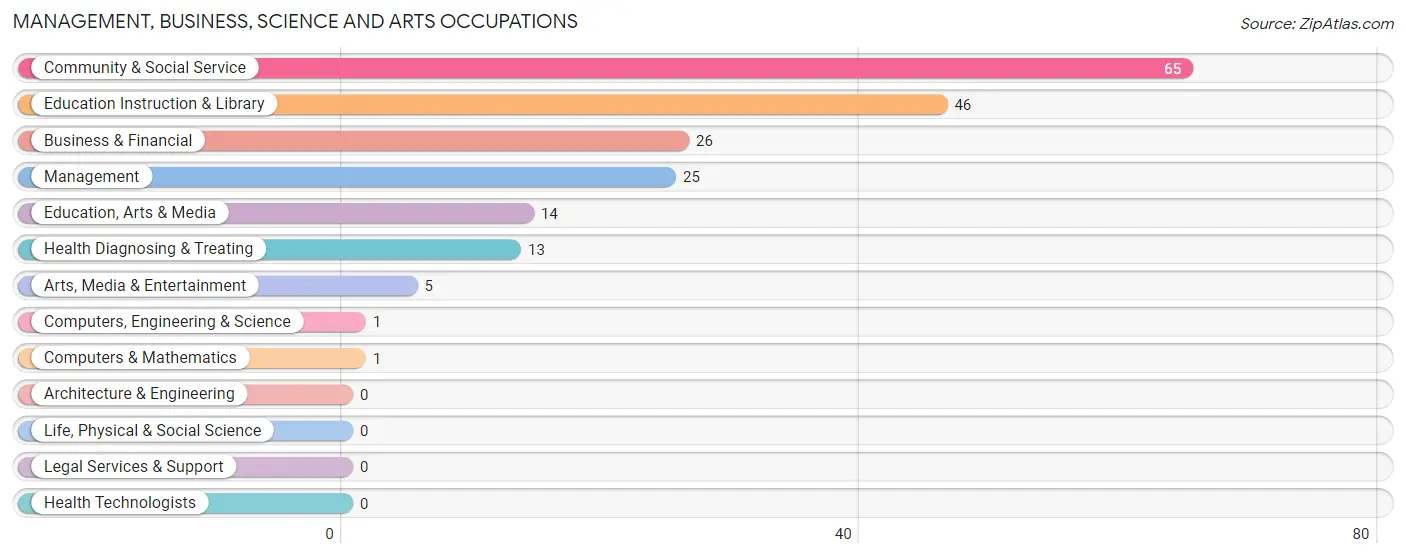
Management, Business, Science and Arts Occupations
The most common Management, Business, Science and Arts occupations in Fort Washakie are Community & Social Service (65 | 13.7%), Education Instruction & Library (46 | 9.7%), Business & Financial (26 | 5.5%), Management (25 | 5.2%), and Education, Arts & Media (14 | 2.9%).
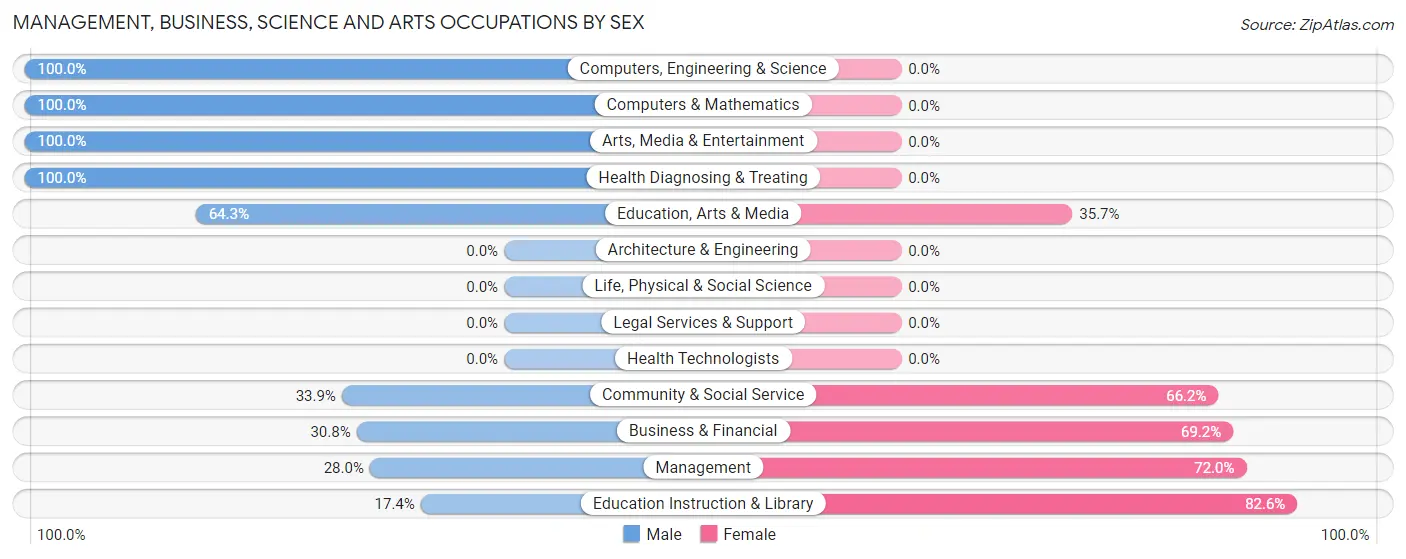
Management, Business, Science and Arts Occupations by Sex
Within the Management, Business, Science and Arts occupations in Fort Washakie, the most male-oriented occupations are Computers, Engineering & Science (100.0%), Computers & Mathematics (100.0%), and Arts, Media & Entertainment (100.0%), while the most female-oriented occupations are Education Instruction & Library (82.6%), Management (72.0%), and Business & Financial (69.2%).
| Occupation | Male | Female |
| Management | 7 (28.0%) | 18 (72.0%) |
| Business & Financial | 8 (30.8%) | 18 (69.2%) |
| Computers, Engineering & Science | 1 (100.0%) | 0 (0.0%) |
| Computers & Mathematics | 1 (100.0%) | 0 (0.0%) |
| Architecture & Engineering | 0 (0.0%) | 0 (0.0%) |
| Life, Physical & Social Science | 0 (0.0%) | 0 (0.0%) |
| Community & Social Service | 22 (33.9%) | 43 (66.1%) |
| Education, Arts & Media | 9 (64.3%) | 5 (35.7%) |
| Legal Services & Support | 0 (0.0%) | 0 (0.0%) |
| Education Instruction & Library | 8 (17.4%) | 38 (82.6%) |
| Arts, Media & Entertainment | 5 (100.0%) | 0 (0.0%) |
| Health Diagnosing & Treating | 13 (100.0%) | 0 (0.0%) |
| Health Technologists | 0 (0.0%) | 0 (0.0%) |
| Total (Category) | 51 (39.2%) | 79 (60.8%) |
| Total (Overall) | 224 (47.1%) | 252 (52.9%) |
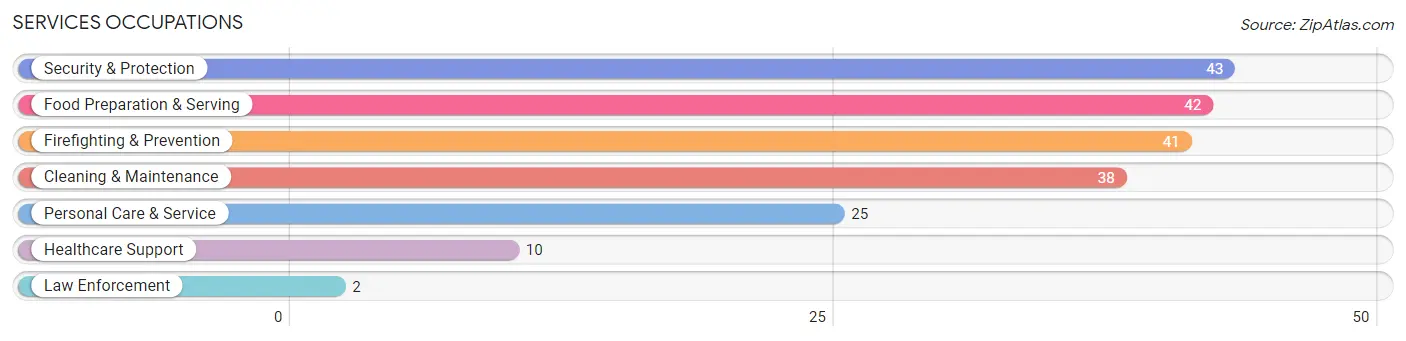
Services Occupations
The most common Services occupations in Fort Washakie are Security & Protection (43 | 9.0%), Food Preparation & Serving (42 | 8.8%), Firefighting & Prevention (41 | 8.6%), Cleaning & Maintenance (38 | 8.0%), and Personal Care & Service (25 | 5.2%).
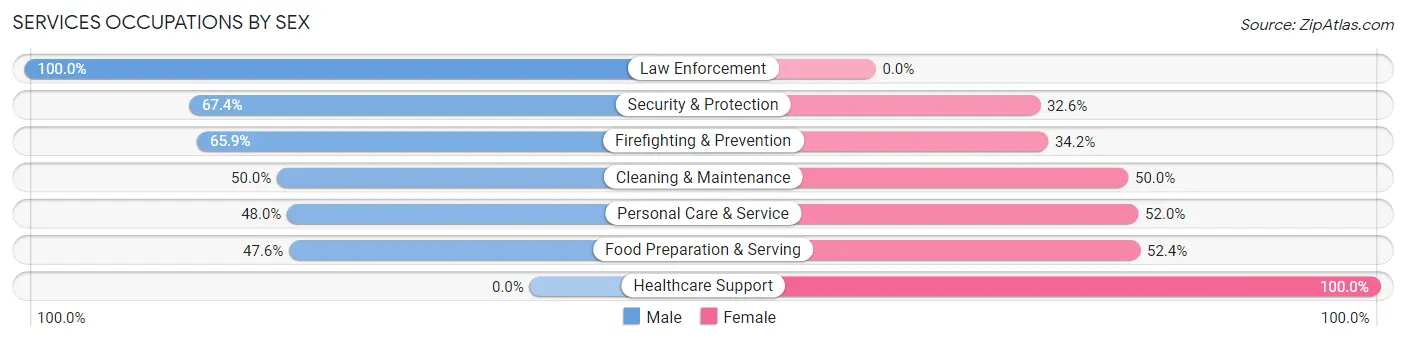
Services Occupations by Sex
Within the Services occupations in Fort Washakie, the most male-oriented occupations are Law Enforcement (100.0%), Security & Protection (67.4%), and Firefighting & Prevention (65.8%), while the most female-oriented occupations are Healthcare Support (100.0%), Food Preparation & Serving (52.4%), and Personal Care & Service (52.0%).
| Occupation | Male | Female |
| Healthcare Support | 0 (0.0%) | 10 (100.0%) |
| Security & Protection | 29 (67.4%) | 14 (32.6%) |
| Firefighting & Prevention | 27 (65.8%) | 14 (34.2%) |
| Law Enforcement | 2 (100.0%) | 0 (0.0%) |
| Food Preparation & Serving | 20 (47.6%) | 22 (52.4%) |
| Cleaning & Maintenance | 19 (50.0%) | 19 (50.0%) |
| Personal Care & Service | 12 (48.0%) | 13 (52.0%) |
| Total (Category) | 80 (50.6%) | 78 (49.4%) |
| Total (Overall) | 224 (47.1%) | 252 (52.9%) |
Sales and Office Occupations
The most common Sales and Office occupations in Fort Washakie are Office & Administration (50 | 10.5%), and Sales & Related (21 | 4.4%).
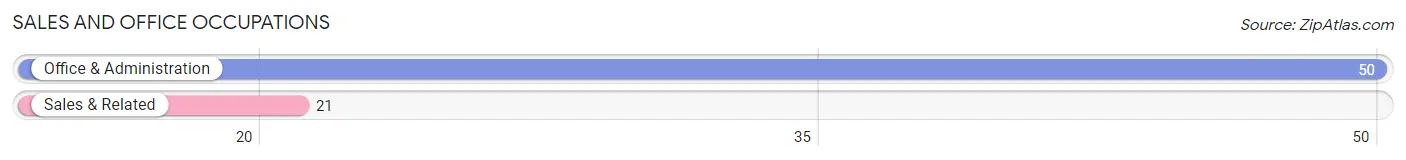
Sales and Office Occupations by Sex
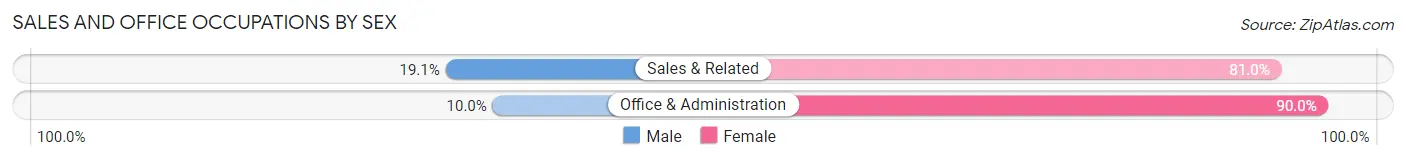
| Occupation | Male | Female |
| Sales & Related | 4 (19.1%) | 17 (80.9%) |
| Office & Administration | 5 (10.0%) | 45 (90.0%) |
| Total (Category) | 9 (12.7%) | 62 (87.3%) |
| Total (Overall) | 224 (47.1%) | 252 (52.9%) |
Natural Resources, Construction and Maintenance Occupations
The most common Natural Resources, Construction and Maintenance occupations in Fort Washakie are Construction & Extraction (31 | 6.5%), Farming, Fishing & Forestry (19 | 4.0%), and Installation, Maintenance & Repair (6 | 1.3%).
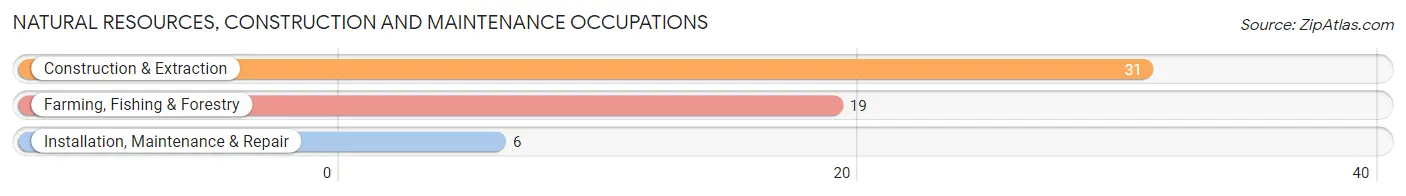
Natural Resources, Construction and Maintenance Occupations by Sex
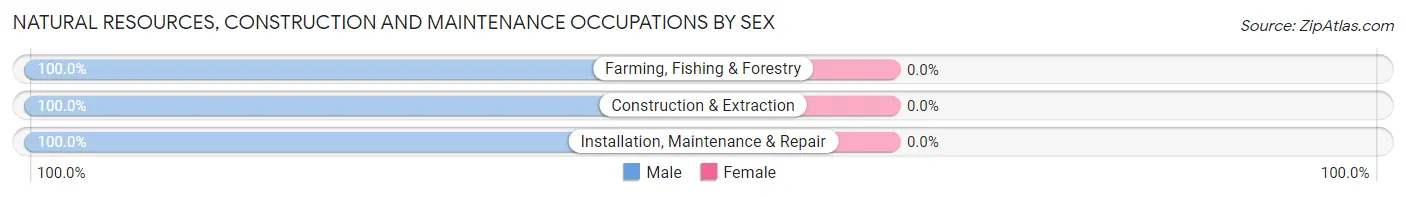
| Occupation | Male | Female |
| Farming, Fishing & Forestry | 19 (100.0%) | 0 (0.0%) |
| Construction & Extraction | 31 (100.0%) | 0 (0.0%) |
| Installation, Maintenance & Repair | 6 (100.0%) | 0 (0.0%) |
| Total (Category) | 56 (100.0%) | 0 (0.0%) |
| Total (Overall) | 224 (47.1%) | 252 (52.9%) |
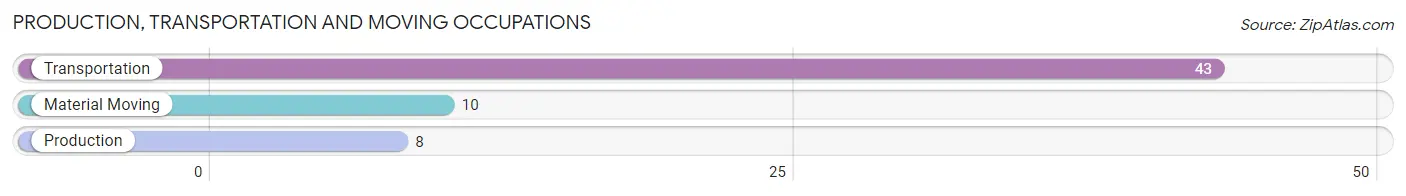
Production, Transportation and Moving Occupations
The most common Production, Transportation and Moving occupations in Fort Washakie are Transportation (43 | 9.0%), Material Moving (10 | 2.1%), and Production (8 | 1.7%).
Production, Transportation and Moving Occupations by Sex
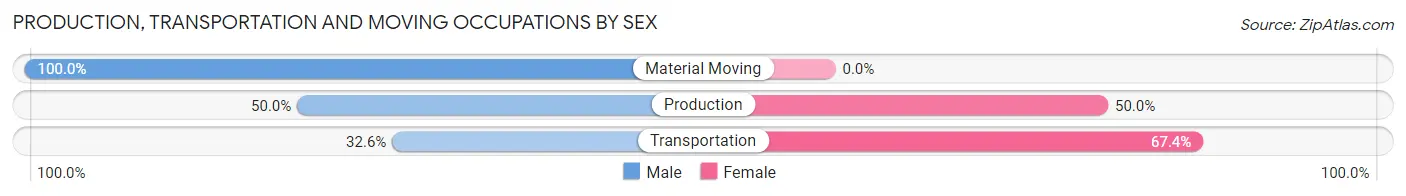
| Occupation | Male | Female |
| Production | 4 (50.0%) | 4 (50.0%) |
| Transportation | 14 (32.6%) | 29 (67.4%) |
| Material Moving | 10 (100.0%) | 0 (0.0%) |
| Total (Category) | 28 (45.9%) | 33 (54.1%) |
| Total (Overall) | 224 (47.1%) | 252 (52.9%) |
Employment Industries by Sex in Fort Washakie
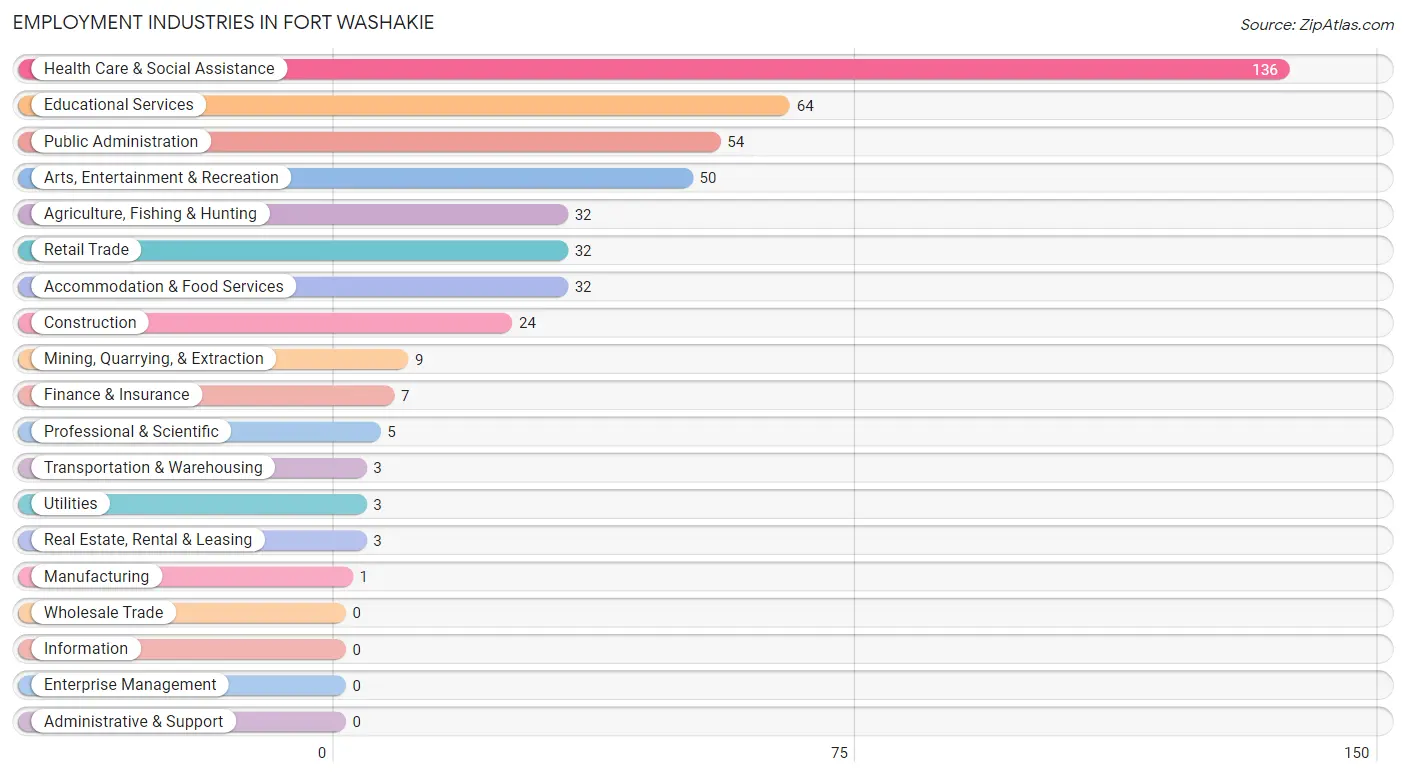
Employment Industries in Fort Washakie
The major employment industries in Fort Washakie include Health Care & Social Assistance (136 | 28.6%), Educational Services (64 | 13.5%), Public Administration (54 | 11.3%), Arts, Entertainment & Recreation (50 | 10.5%), and Agriculture, Fishing & Hunting (32 | 6.7%).
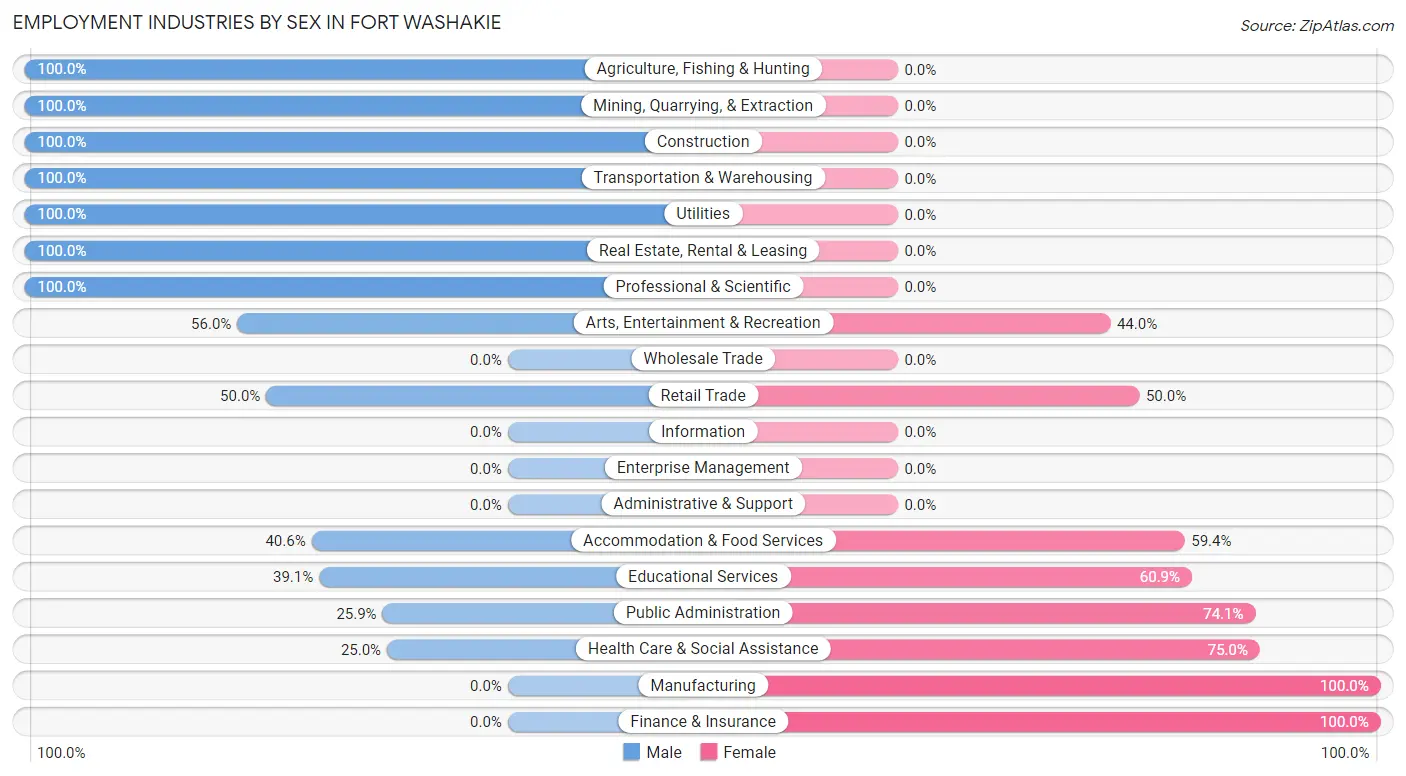
Employment Industries by Sex in Fort Washakie
The Fort Washakie industries that see more men than women are Agriculture, Fishing & Hunting (100.0%), Mining, Quarrying, & Extraction (100.0%), and Construction (100.0%), whereas the industries that tend to have a higher number of women are Manufacturing (100.0%), Finance & Insurance (100.0%), and Health Care & Social Assistance (75.0%).
| Industry | Male | Female |
| Agriculture, Fishing & Hunting | 32 (100.0%) | 0 (0.0%) |
| Mining, Quarrying, & Extraction | 9 (100.0%) | 0 (0.0%) |
| Construction | 24 (100.0%) | 0 (0.0%) |
| Manufacturing | 0 (0.0%) | 1 (100.0%) |
| Wholesale Trade | 0 (0.0%) | 0 (0.0%) |
| Retail Trade | 16 (50.0%) | 16 (50.0%) |
| Transportation & Warehousing | 3 (100.0%) | 0 (0.0%) |
| Utilities | 3 (100.0%) | 0 (0.0%) |
| Information | 0 (0.0%) | 0 (0.0%) |
| Finance & Insurance | 0 (0.0%) | 7 (100.0%) |
| Real Estate, Rental & Leasing | 3 (100.0%) | 0 (0.0%) |
| Professional & Scientific | 5 (100.0%) | 0 (0.0%) |
| Enterprise Management | 0 (0.0%) | 0 (0.0%) |
| Administrative & Support | 0 (0.0%) | 0 (0.0%) |
| Educational Services | 25 (39.1%) | 39 (60.9%) |
| Health Care & Social Assistance | 34 (25.0%) | 102 (75.0%) |
| Arts, Entertainment & Recreation | 28 (56.0%) | 22 (44.0%) |
| Accommodation & Food Services | 13 (40.6%) | 19 (59.4%) |
| Public Administration | 14 (25.9%) | 40 (74.1%) |
| Total | 224 (47.1%) | 252 (52.9%) |
Education in Fort Washakie
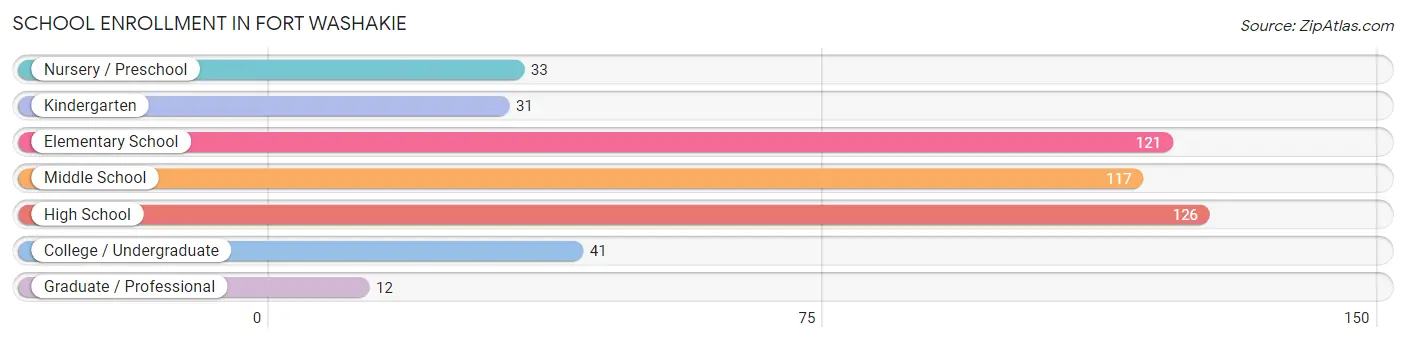
School Enrollment in Fort Washakie
The most common levels of schooling among the 481 students in Fort Washakie are high school (126 | 26.2%), elementary school (121 | 25.2%), and middle school (117 | 24.3%).
| School Level | # Students | % Students |
| Nursery / Preschool | 33 | 6.9% |
| Kindergarten | 31 | 6.4% |
| Elementary School | 121 | 25.2% |
| Middle School | 117 | 24.3% |
| High School | 126 | 26.2% |
| College / Undergraduate | 41 | 8.5% |
| Graduate / Professional | 12 | 2.5% |
| Total | 481 | 100.0% |
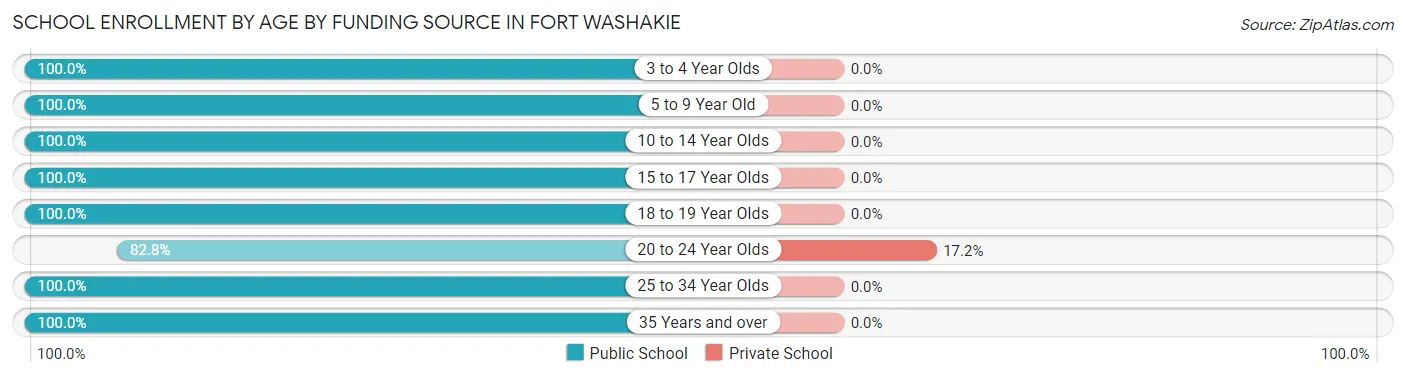
School Enrollment by Age by Funding Source in Fort Washakie
Out of a total of 481 students who are enrolled in schools in Fort Washakie, 5 (1.0%) attend a private institution, while the remaining 476 (99.0%) are enrolled in public schools. The age group of 20 to 24 year olds has the highest likelihood of being enrolled in private schools, with 5 (17.2% in the age bracket) enrolled. Conversely, the age group of 3 to 4 year olds has the lowest likelihood of being enrolled in a private school, with 30 (100.0% in the age bracket) attending a public institution.
| Age Bracket | Public School | Private School |
| 3 to 4 Year Olds | 30 (100.0%) | 0 (0.0%) |
| 5 to 9 Year Old | 142 (100.0%) | 0 (0.0%) |
| 10 to 14 Year Olds | 142 (100.0%) | 0 (0.0%) |
| 15 to 17 Year Olds | 106 (100.0%) | 0 (0.0%) |
| 18 to 19 Year Olds | 6 (100.0%) | 0 (0.0%) |
| 20 to 24 Year Olds | 24 (82.8%) | 5 (17.2%) |
| 25 to 34 Year Olds | 11 (100.0%) | 0 (0.0%) |
| 35 Years and over | 15 (100.0%) | 0 (0.0%) |
| Total | 476 (99.0%) | 5 (1.0%) |
Educational Attainment by Field of Study in Fort Washakie
Education (31 | 33.7%), business (24 | 26.1%), arts & humanities (13 | 14.1%), computers & mathematics (7 | 7.6%), and bio, nature & agricultural (5 | 5.4%) are the most common fields of study among 92 individuals in Fort Washakie who have obtained a bachelor's degree or higher.
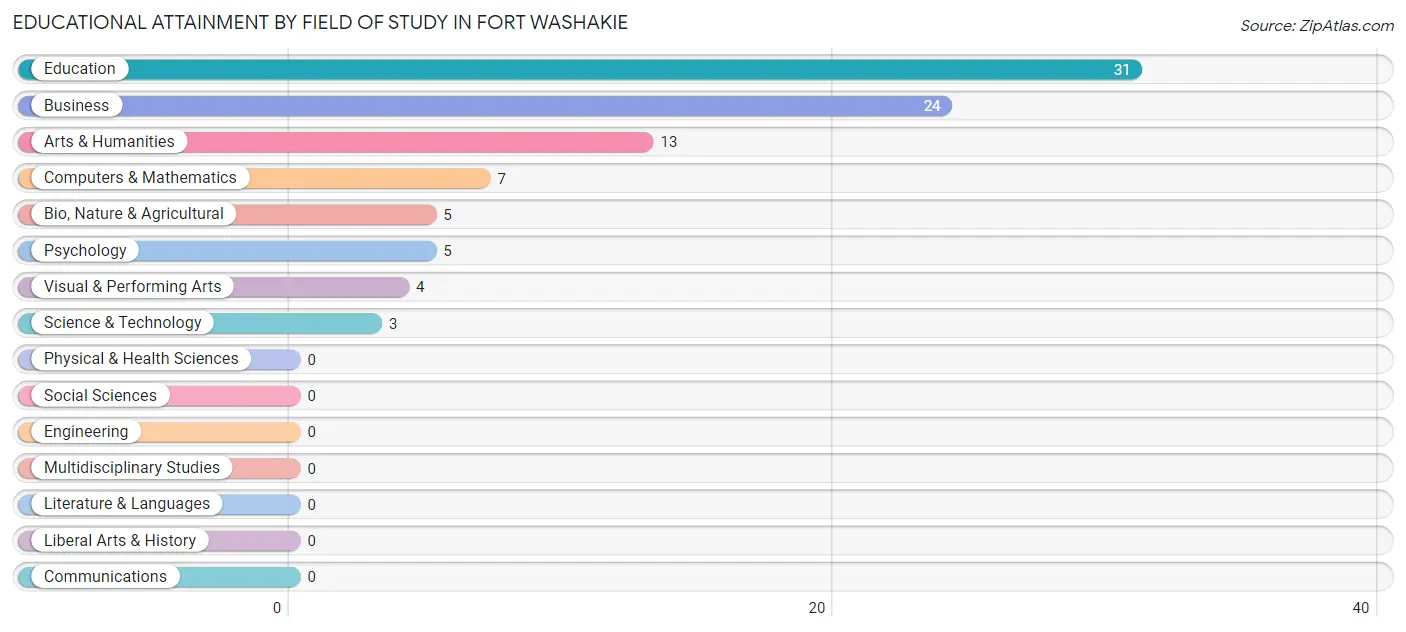
| Field of Study | # Graduates | % Graduates |
| Computers & Mathematics | 7 | 7.6% |
| Bio, Nature & Agricultural | 5 | 5.4% |
| Physical & Health Sciences | 0 | 0.0% |
| Psychology | 5 | 5.4% |
| Social Sciences | 0 | 0.0% |
| Engineering | 0 | 0.0% |
| Multidisciplinary Studies | 0 | 0.0% |
| Science & Technology | 3 | 3.3% |
| Business | 24 | 26.1% |
| Education | 31 | 33.7% |
| Literature & Languages | 0 | 0.0% |
| Liberal Arts & History | 0 | 0.0% |
| Visual & Performing Arts | 4 | 4.3% |
| Communications | 0 | 0.0% |
| Arts & Humanities | 13 | 14.1% |
| Total | 92 | 100.0% |
Transportation & Commute in Fort Washakie
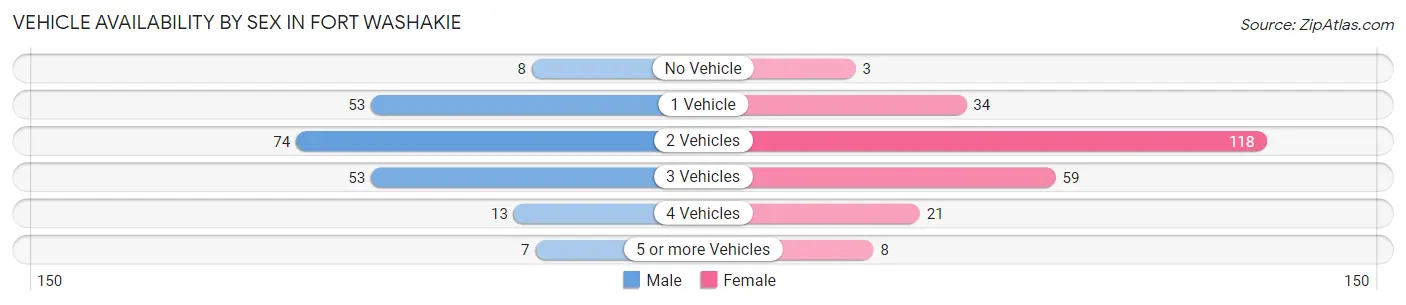
Vehicle Availability by Sex in Fort Washakie
The most prevalent vehicle ownership categories in Fort Washakie are males with 2 vehicles (74, accounting for 35.6%) and females with 2 vehicles (118, making up 30.4%).
| Vehicles Available | Male | Female |
| No Vehicle | 8 (3.8%) | 3 (1.2%) |
| 1 Vehicle | 53 (25.5%) | 34 (14.0%) |
| 2 Vehicles | 74 (35.6%) | 118 (48.6%) |
| 3 Vehicles | 53 (25.5%) | 59 (24.3%) |
| 4 Vehicles | 13 (6.2%) | 21 (8.6%) |
| 5 or more Vehicles | 7 (3.4%) | 8 (3.3%) |
| Total | 208 (100.0%) | 243 (100.0%) |
Commute Time in Fort Washakie
The most frequently occuring commute durations in Fort Washakie are 10 to 14 minutes (110 commuters, 25.4%), less than 5 minutes (90 commuters, 20.7%), and 5 to 9 minutes (87 commuters, 20.1%).
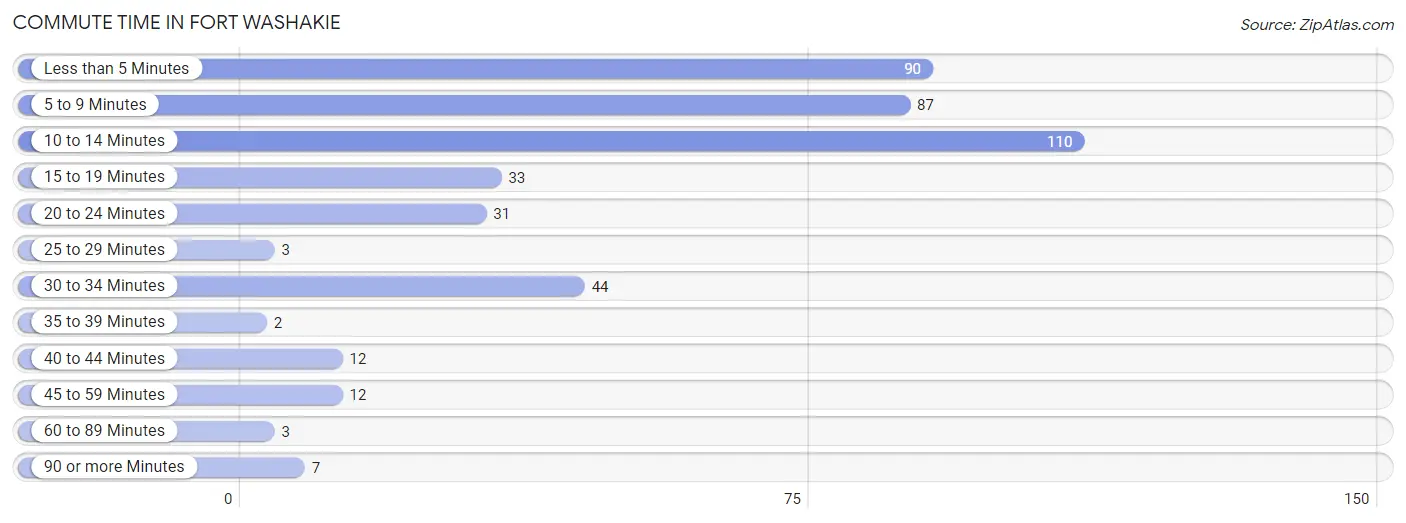
| Commute Time | # Commuters | % Commuters |
| Less than 5 Minutes | 90 | 20.7% |
| 5 to 9 Minutes | 87 | 20.1% |
| 10 to 14 Minutes | 110 | 25.4% |
| 15 to 19 Minutes | 33 | 7.6% |
| 20 to 24 Minutes | 31 | 7.1% |
| 25 to 29 Minutes | 3 | 0.7% |
| 30 to 34 Minutes | 44 | 10.1% |
| 35 to 39 Minutes | 2 | 0.5% |
| 40 to 44 Minutes | 12 | 2.8% |
| 45 to 59 Minutes | 12 | 2.8% |
| 60 to 89 Minutes | 3 | 0.7% |
| 90 or more Minutes | 7 | 1.6% |
Commute Time by Sex in Fort Washakie
The most common commute times in Fort Washakie are 5 to 9 minutes (47 commuters, 24.6%) for males and 10 to 14 minutes (77 commuters, 31.7%) for females.
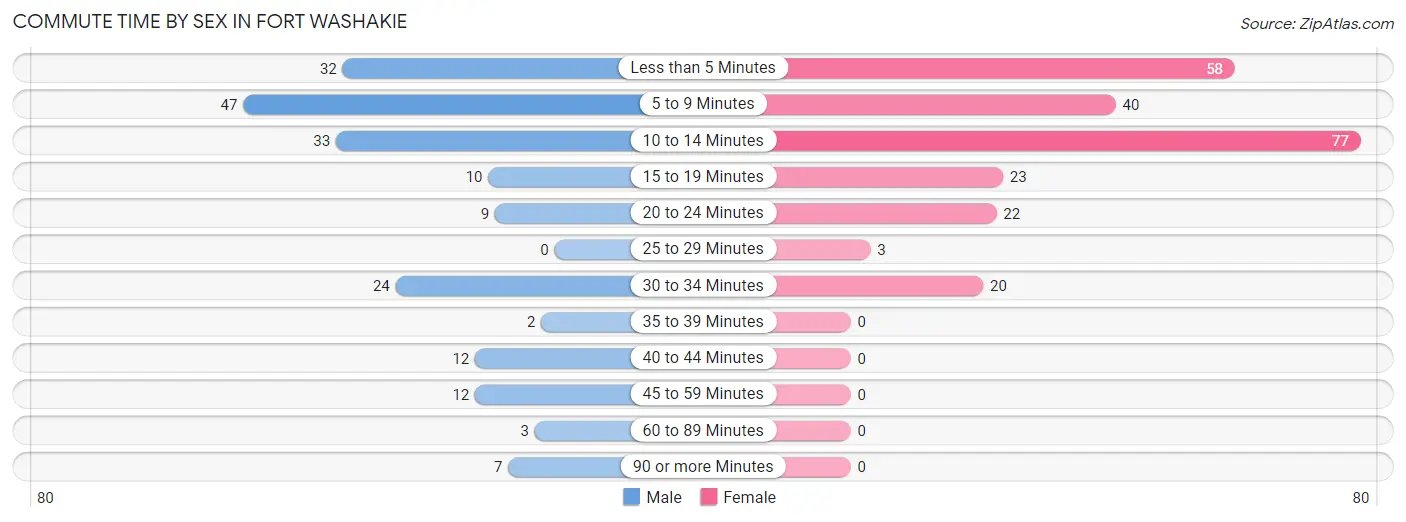
| Commute Time | Male | Female |
| Less than 5 Minutes | 32 (16.8%) | 58 (23.9%) |
| 5 to 9 Minutes | 47 (24.6%) | 40 (16.5%) |
| 10 to 14 Minutes | 33 (17.3%) | 77 (31.7%) |
| 15 to 19 Minutes | 10 (5.2%) | 23 (9.5%) |
| 20 to 24 Minutes | 9 (4.7%) | 22 (9.0%) |
| 25 to 29 Minutes | 0 (0.0%) | 3 (1.2%) |
| 30 to 34 Minutes | 24 (12.6%) | 20 (8.2%) |
| 35 to 39 Minutes | 2 (1.1%) | 0 (0.0%) |
| 40 to 44 Minutes | 12 (6.3%) | 0 (0.0%) |
| 45 to 59 Minutes | 12 (6.3%) | 0 (0.0%) |
| 60 to 89 Minutes | 3 (1.6%) | 0 (0.0%) |
| 90 or more Minutes | 7 (3.7%) | 0 (0.0%) |
Time of Departure to Work by Sex in Fort Washakie
The most frequent times of departure to work in Fort Washakie are 7:30 AM to 7:59 AM (47, 24.6%) for males and 7:30 AM to 7:59 AM (75, 30.9%) for females.
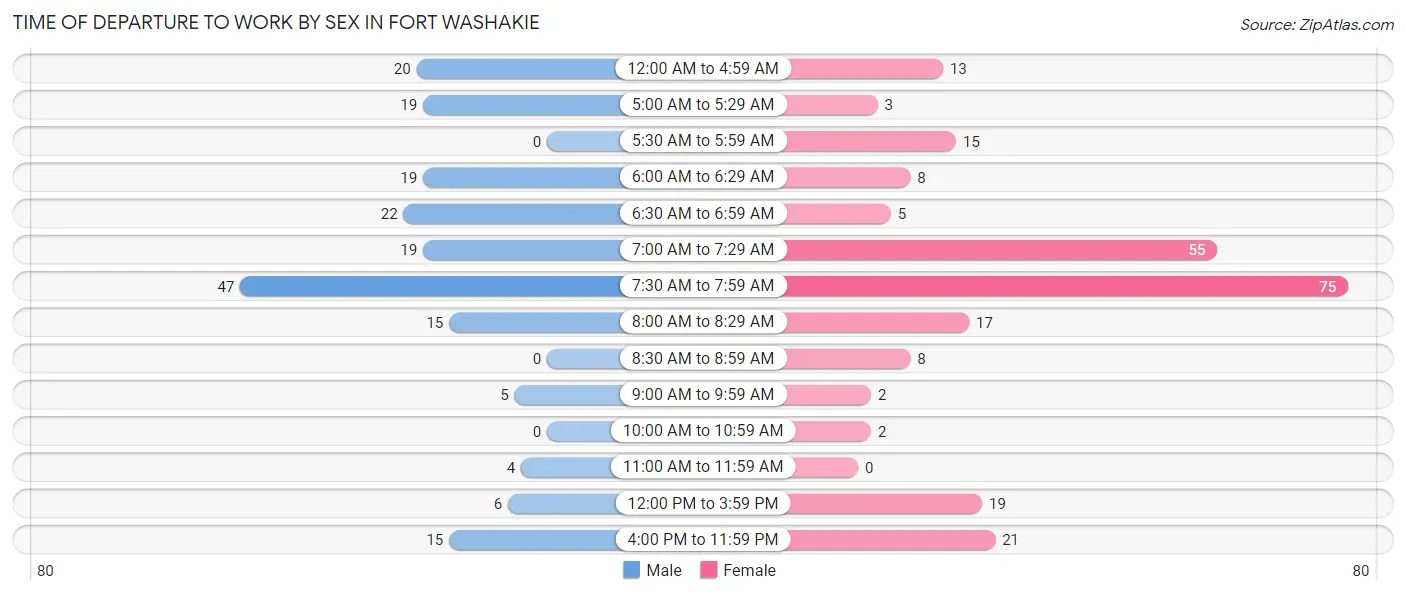
| Time of Departure | Male | Female |
| 12:00 AM to 4:59 AM | 20 (10.5%) | 13 (5.3%) |
| 5:00 AM to 5:29 AM | 19 (10.0%) | 3 (1.2%) |
| 5:30 AM to 5:59 AM | 0 (0.0%) | 15 (6.2%) |
| 6:00 AM to 6:29 AM | 19 (10.0%) | 8 (3.3%) |
| 6:30 AM to 6:59 AM | 22 (11.5%) | 5 (2.1%) |
| 7:00 AM to 7:29 AM | 19 (10.0%) | 55 (22.6%) |
| 7:30 AM to 7:59 AM | 47 (24.6%) | 75 (30.9%) |
| 8:00 AM to 8:29 AM | 15 (7.9%) | 17 (7.0%) |
| 8:30 AM to 8:59 AM | 0 (0.0%) | 8 (3.3%) |
| 9:00 AM to 9:59 AM | 5 (2.6%) | 2 (0.8%) |
| 10:00 AM to 10:59 AM | 0 (0.0%) | 2 (0.8%) |
| 11:00 AM to 11:59 AM | 4 (2.1%) | 0 (0.0%) |
| 12:00 PM to 3:59 PM | 6 (3.1%) | 19 (7.8%) |
| 4:00 PM to 11:59 PM | 15 (7.9%) | 21 (8.6%) |
| Total | 191 (100.0%) | 243 (100.0%) |
Housing Occupancy in Fort Washakie
Occupancy by Ownership in Fort Washakie
Of the total 352 dwellings in Fort Washakie, owner-occupied units account for 218 (61.9%), while renter-occupied units make up 134 (38.1%).
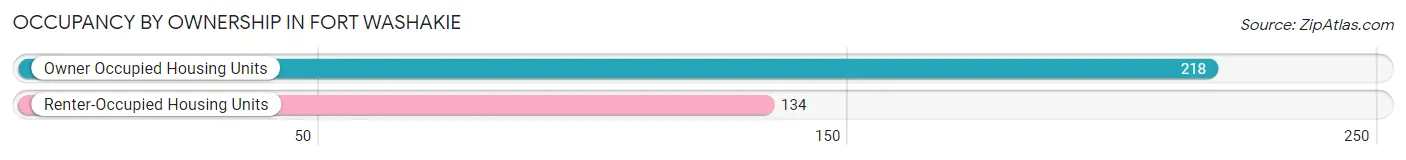
| Occupancy | # Housing Units | % Housing Units |
| Owner Occupied Housing Units | 218 | 61.9% |
| Renter-Occupied Housing Units | 134 | 38.1% |
| Total Occupied Housing Units | 352 | 100.0% |
Occupancy by Household Size in Fort Washakie
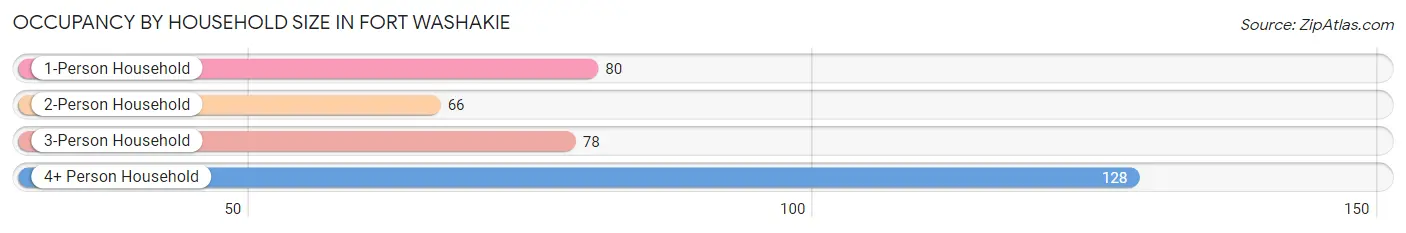
| Household Size | # Housing Units | % Housing Units |
| 1-Person Household | 80 | 22.7% |
| 2-Person Household | 66 | 18.8% |
| 3-Person Household | 78 | 22.2% |
| 4+ Person Household | 128 | 36.4% |
| Total Housing Units | 352 | 100.0% |
Occupancy by Ownership by Household Size in Fort Washakie
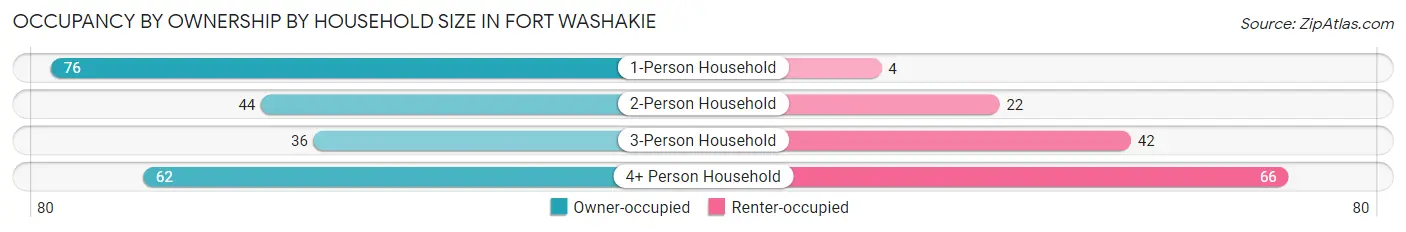
| Household Size | Owner-occupied | Renter-occupied |
| 1-Person Household | 76 (95.0%) | 4 (5.0%) |
| 2-Person Household | 44 (66.7%) | 22 (33.3%) |
| 3-Person Household | 36 (46.2%) | 42 (53.8%) |
| 4+ Person Household | 62 (48.4%) | 66 (51.6%) |
| Total Housing Units | 218 (61.9%) | 134 (38.1%) |
Occupancy by Educational Attainment in Fort Washakie
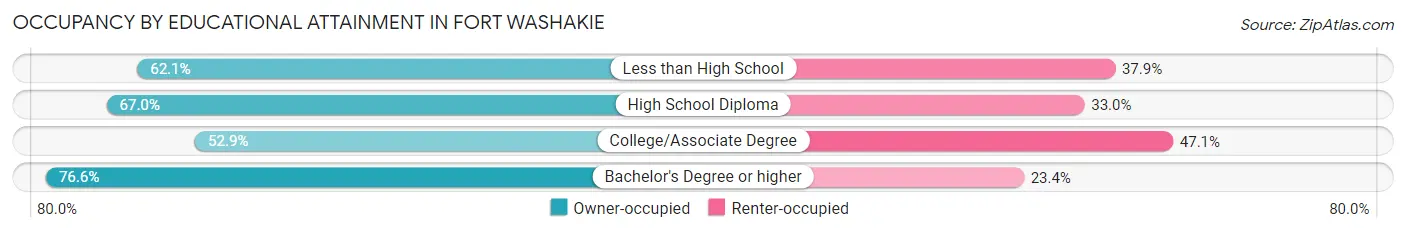
| Household Size | Owner-occupied | Renter-occupied |
| Less than High School | 41 (62.1%) | 25 (37.9%) |
| High School Diploma | 69 (67.0%) | 34 (33.0%) |
| College/Associate Degree | 72 (52.9%) | 64 (47.1%) |
| Bachelor's Degree or higher | 36 (76.6%) | 11 (23.4%) |
Occupancy by Age of Householder in Fort Washakie
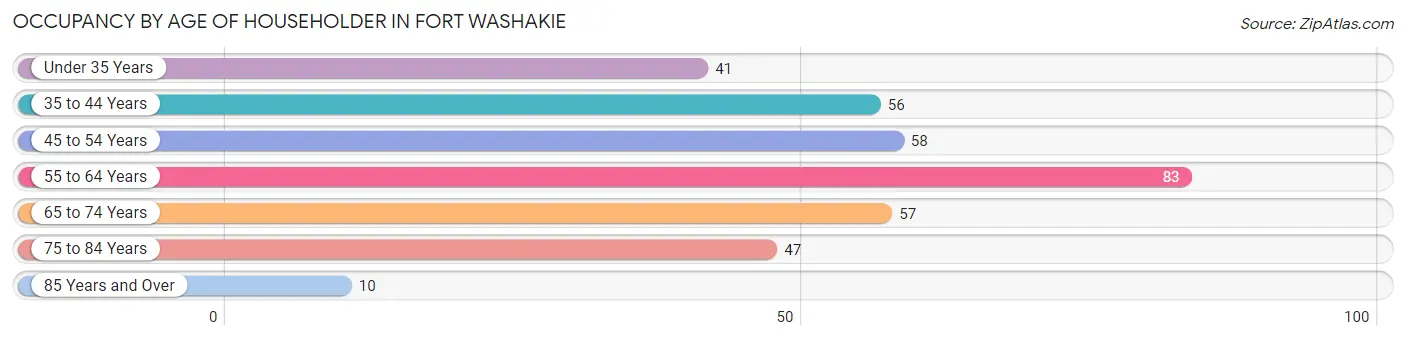
| Age Bracket | # Households | % Households |
| Under 35 Years | 41 | 11.7% |
| 35 to 44 Years | 56 | 15.9% |
| 45 to 54 Years | 58 | 16.5% |
| 55 to 64 Years | 83 | 23.6% |
| 65 to 74 Years | 57 | 16.2% |
| 75 to 84 Years | 47 | 13.4% |
| 85 Years and Over | 10 | 2.8% |
| Total | 352 | 100.0% |
Housing Finances in Fort Washakie
Median Income by Occupancy in Fort Washakie
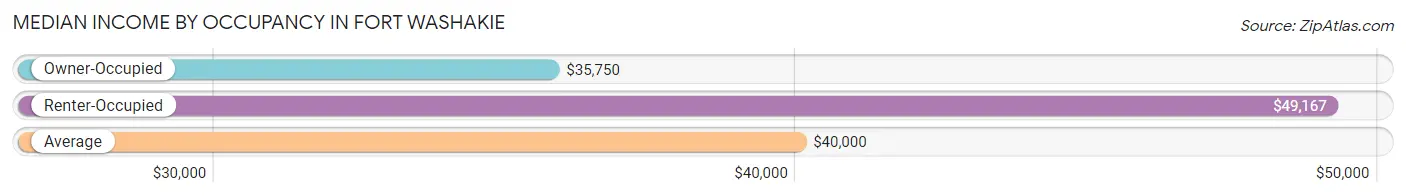
| Occupancy Type | # Households | Median Income |
| Owner-Occupied | 218 (61.9%) | $35,750 |
| Renter-Occupied | 134 (38.1%) | $49,167 |
| Average | 352 (100.0%) | $40,000 |
Occupancy by Householder Income Bracket in Fort Washakie
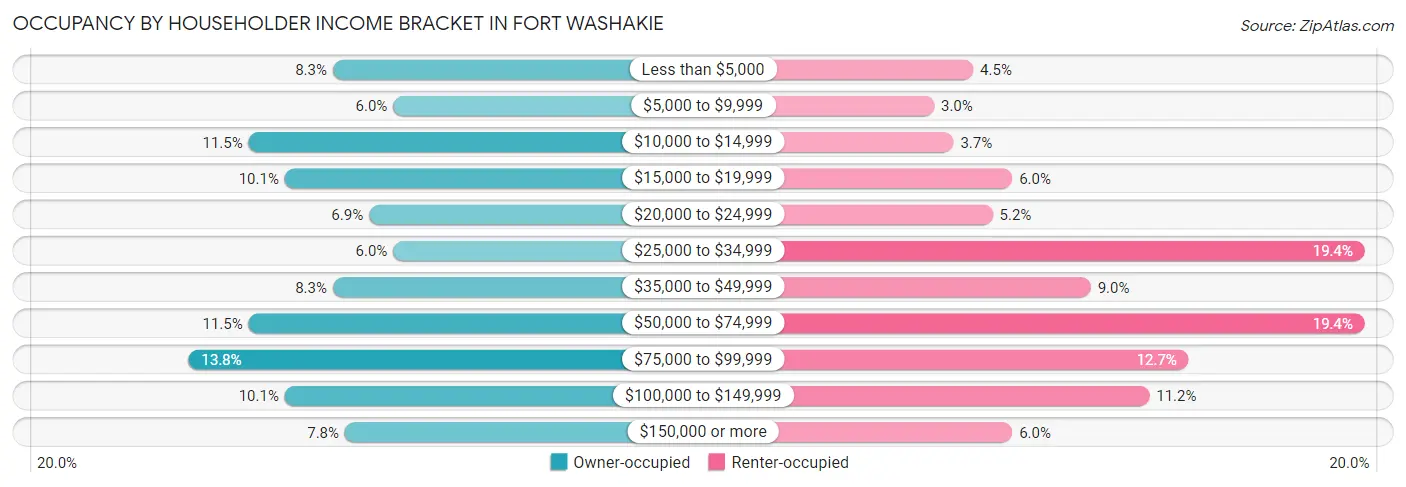
| Income Bracket | Owner-occupied | Renter-occupied |
| Less than $5,000 | 18 (8.3%) | 6 (4.5%) |
| $5,000 to $9,999 | 13 (6.0%) | 4 (3.0%) |
| $10,000 to $14,999 | 25 (11.5%) | 5 (3.7%) |
| $15,000 to $19,999 | 22 (10.1%) | 8 (6.0%) |
| $20,000 to $24,999 | 15 (6.9%) | 7 (5.2%) |
| $25,000 to $34,999 | 13 (6.0%) | 26 (19.4%) |
| $35,000 to $49,999 | 18 (8.3%) | 12 (9.0%) |
| $50,000 to $74,999 | 25 (11.5%) | 26 (19.4%) |
| $75,000 to $99,999 | 30 (13.8%) | 17 (12.7%) |
| $100,000 to $149,999 | 22 (10.1%) | 15 (11.2%) |
| $150,000 or more | 17 (7.8%) | 8 (6.0%) |
| Total | 218 (100.0%) | 134 (100.0%) |
Monthly Housing Cost Tiers in Fort Washakie
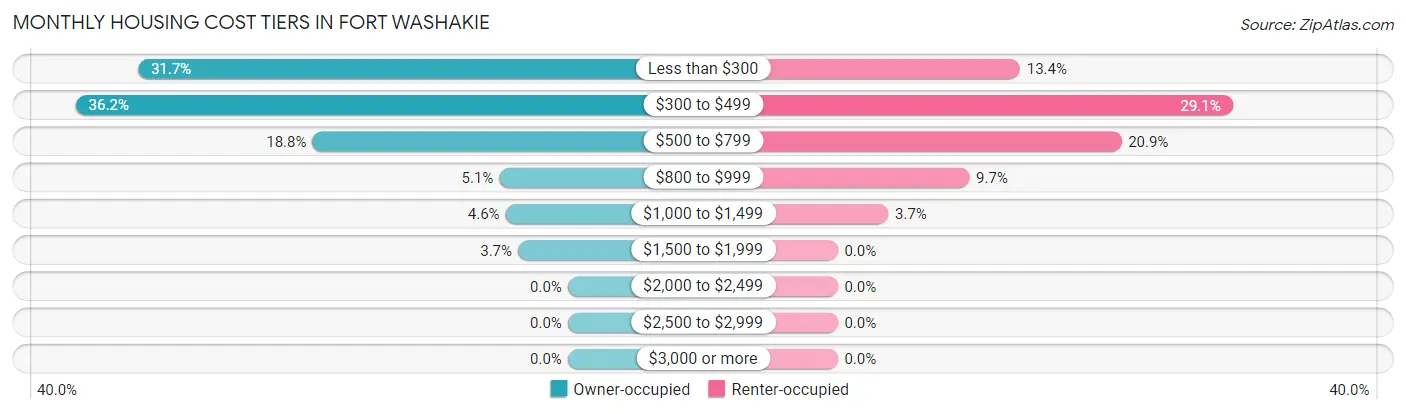
| Monthly Cost | Owner-occupied | Renter-occupied |
| Less than $300 | 69 (31.7%) | 18 (13.4%) |
| $300 to $499 | 79 (36.2%) | 39 (29.1%) |
| $500 to $799 | 41 (18.8%) | 28 (20.9%) |
| $800 to $999 | 11 (5.1%) | 13 (9.7%) |
| $1,000 to $1,499 | 10 (4.6%) | 5 (3.7%) |
| $1,500 to $1,999 | 8 (3.7%) | 0 (0.0%) |
| $2,000 to $2,499 | 0 (0.0%) | 0 (0.0%) |
| $2,500 to $2,999 | 0 (0.0%) | 0 (0.0%) |
| $3,000 or more | 0 (0.0%) | 0 (0.0%) |
| Total | 218 (100.0%) | 134 (100.0%) |
Physical Housing Characteristics in Fort Washakie
Housing Structures in Fort Washakie
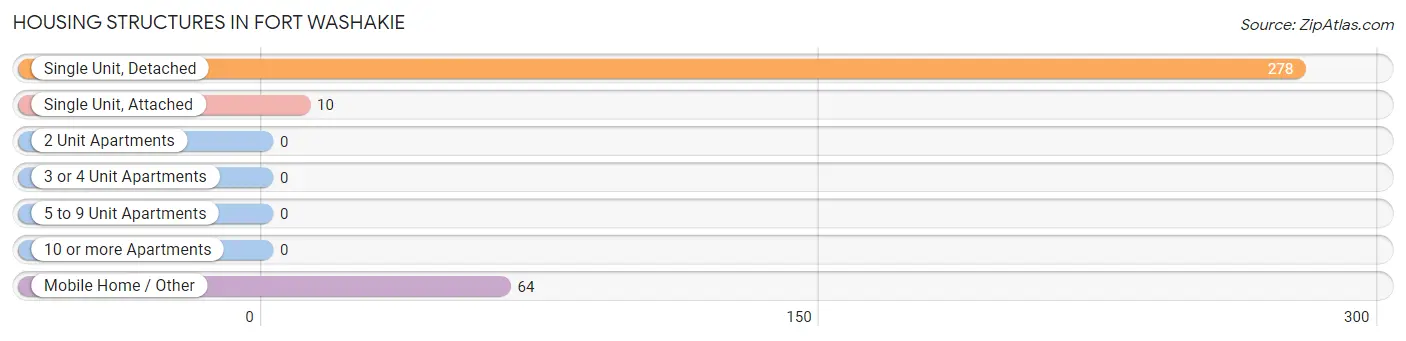
| Structure Type | # Housing Units | % Housing Units |
| Single Unit, Detached | 278 | 79.0% |
| Single Unit, Attached | 10 | 2.8% |
| 2 Unit Apartments | 0 | 0.0% |
| 3 or 4 Unit Apartments | 0 | 0.0% |
| 5 to 9 Unit Apartments | 0 | 0.0% |
| 10 or more Apartments | 0 | 0.0% |
| Mobile Home / Other | 64 | 18.2% |
| Total | 352 | 100.0% |
Housing Structures by Occupancy in Fort Washakie
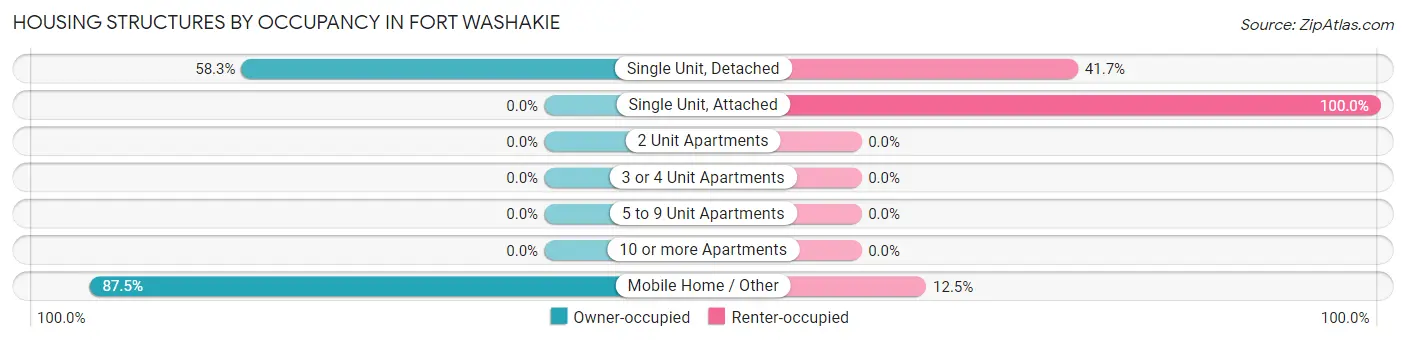
| Structure Type | Owner-occupied | Renter-occupied |
| Single Unit, Detached | 162 (58.3%) | 116 (41.7%) |
| Single Unit, Attached | 0 (0.0%) | 10 (100.0%) |
| 2 Unit Apartments | 0 (0.0%) | 0 (0.0%) |
| 3 or 4 Unit Apartments | 0 (0.0%) | 0 (0.0%) |
| 5 to 9 Unit Apartments | 0 (0.0%) | 0 (0.0%) |
| 10 or more Apartments | 0 (0.0%) | 0 (0.0%) |
| Mobile Home / Other | 56 (87.5%) | 8 (12.5%) |
| Total | 218 (61.9%) | 134 (38.1%) |
Housing Structures by Number of Rooms in Fort Washakie
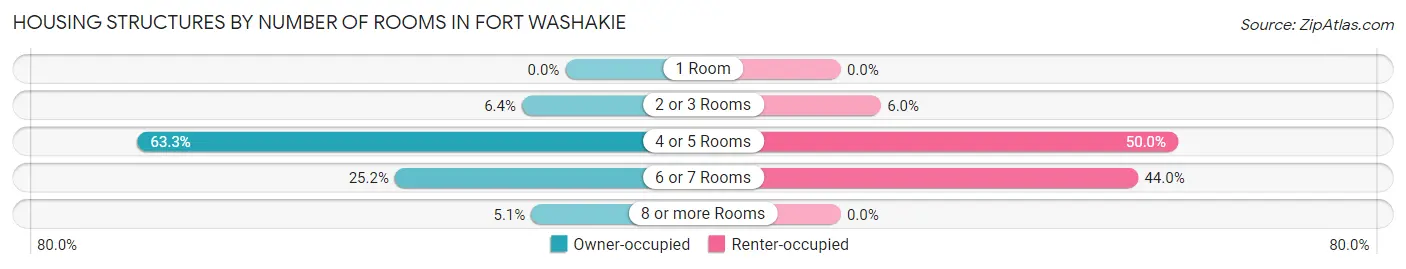
| Number of Rooms | Owner-occupied | Renter-occupied |
| 1 Room | 0 (0.0%) | 0 (0.0%) |
| 2 or 3 Rooms | 14 (6.4%) | 8 (6.0%) |
| 4 or 5 Rooms | 138 (63.3%) | 67 (50.0%) |
| 6 or 7 Rooms | 55 (25.2%) | 59 (44.0%) |
| 8 or more Rooms | 11 (5.1%) | 0 (0.0%) |
| Total | 218 (100.0%) | 134 (100.0%) |
Housing Structure by Heating Type in Fort Washakie
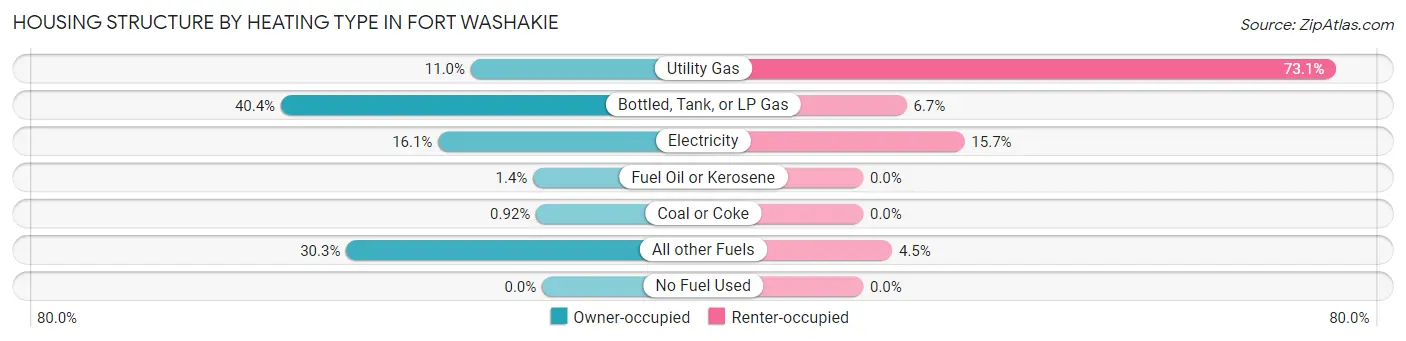
| Heating Type | Owner-occupied | Renter-occupied |
| Utility Gas | 24 (11.0%) | 98 (73.1%) |
| Bottled, Tank, or LP Gas | 88 (40.4%) | 9 (6.7%) |
| Electricity | 35 (16.1%) | 21 (15.7%) |
| Fuel Oil or Kerosene | 3 (1.4%) | 0 (0.0%) |
| Coal or Coke | 2 (0.9%) | 0 (0.0%) |
| All other Fuels | 66 (30.3%) | 6 (4.5%) |
| No Fuel Used | 0 (0.0%) | 0 (0.0%) |
| Total | 218 (100.0%) | 134 (100.0%) |
Household Vehicle Usage in Fort Washakie
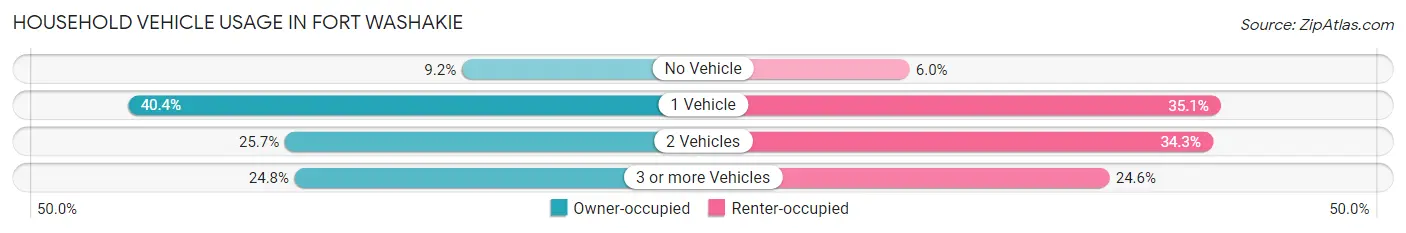
| Vehicles per Household | Owner-occupied | Renter-occupied |
| No Vehicle | 20 (9.2%) | 8 (6.0%) |
| 1 Vehicle | 88 (40.4%) | 47 (35.1%) |
| 2 Vehicles | 56 (25.7%) | 46 (34.3%) |
| 3 or more Vehicles | 54 (24.8%) | 33 (24.6%) |
| Total | 218 (100.0%) | 134 (100.0%) |
Real Estate & Mortgages in Fort Washakie
Real Estate and Mortgage Overview in Fort Washakie
| Characteristic | Without Mortgage | With Mortgage |
| Housing Units | 188 | 30 |
| Median Property Value | $176,900 | $137,500 |
| Median Household Income | $27,000 | $3 |
| Monthly Housing Costs | $408 | $0 |
| Real Estate Taxes | - | - |
Property Value by Mortgage Status in Fort Washakie
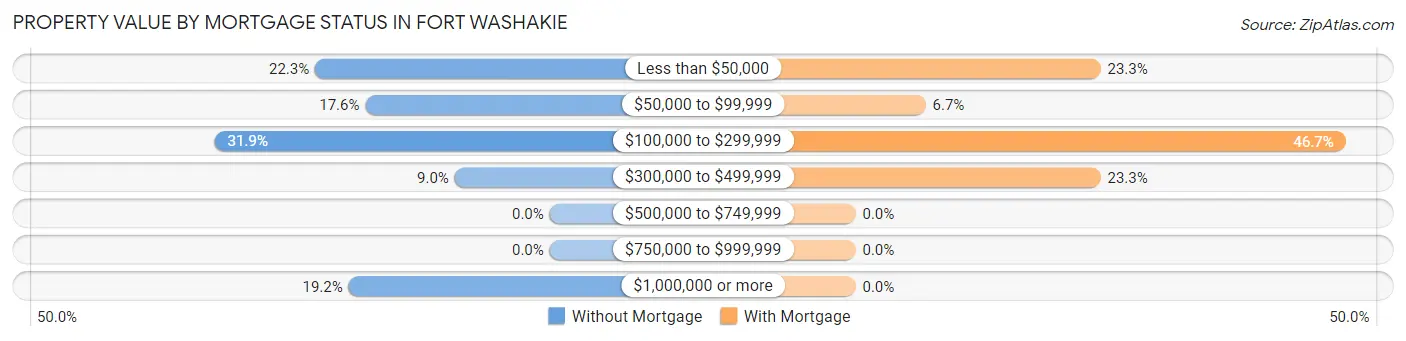
| Property Value | Without Mortgage | With Mortgage |
| Less than $50,000 | 42 (22.3%) | 7 (23.3%) |
| $50,000 to $99,999 | 33 (17.5%) | 2 (6.7%) |
| $100,000 to $299,999 | 60 (31.9%) | 14 (46.7%) |
| $300,000 to $499,999 | 17 (9.0%) | 7 (23.3%) |
| $500,000 to $749,999 | 0 (0.0%) | 0 (0.0%) |
| $750,000 to $999,999 | 0 (0.0%) | 0 (0.0%) |
| $1,000,000 or more | 36 (19.2%) | 0 (0.0%) |
| Total | 188 (100.0%) | 30 (100.0%) |
Household Income by Mortgage Status in Fort Washakie
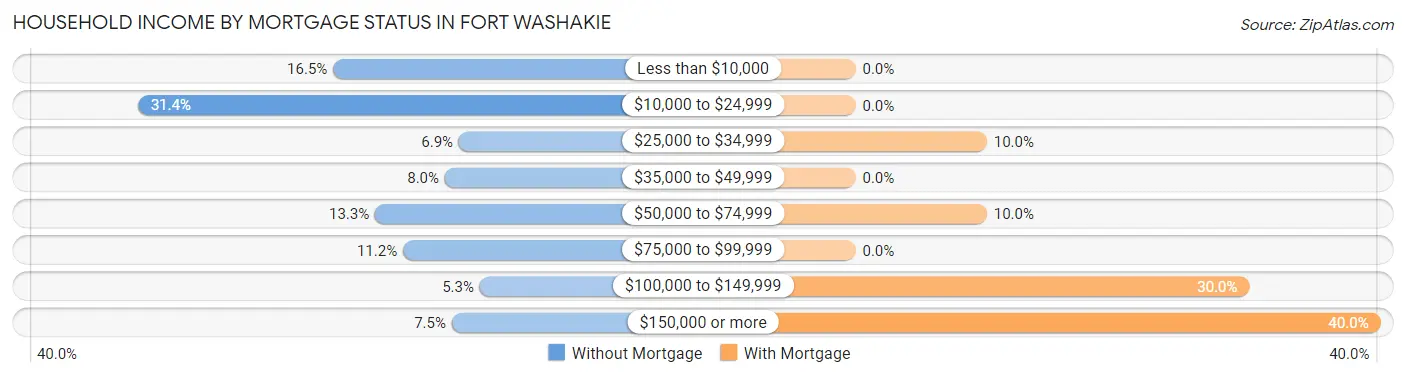
| Household Income | Without Mortgage | With Mortgage |
| Less than $10,000 | 31 (16.5%) | 0 (0.0%) |
| $10,000 to $24,999 | 59 (31.4%) | 0 (0.0%) |
| $25,000 to $34,999 | 13 (6.9%) | 3 (10.0%) |
| $35,000 to $49,999 | 15 (8.0%) | 0 (0.0%) |
| $50,000 to $74,999 | 25 (13.3%) | 3 (10.0%) |
| $75,000 to $99,999 | 21 (11.2%) | 0 (0.0%) |
| $100,000 to $149,999 | 10 (5.3%) | 9 (30.0%) |
| $150,000 or more | 14 (7.4%) | 12 (40.0%) |
| Total | 188 (100.0%) | 30 (100.0%) |
Property Value to Household Income Ratio in Fort Washakie
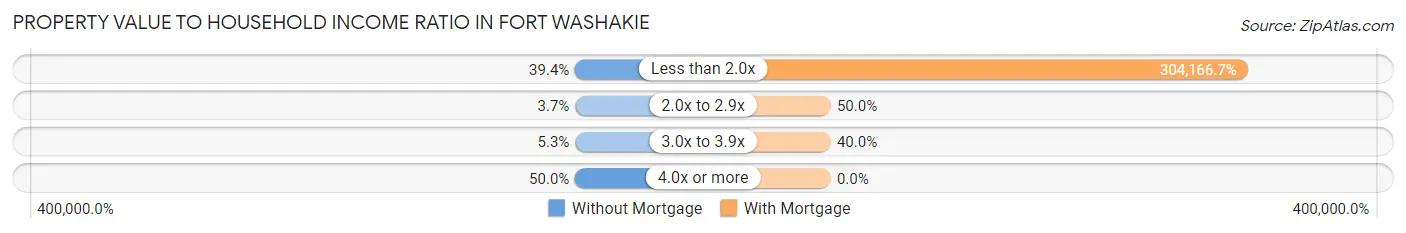
| Value-to-Income Ratio | Without Mortgage | With Mortgage |
| Less than 2.0x | 74 (39.4%) | 91,250 (304,166.7%) |
| 2.0x to 2.9x | 7 (3.7%) | 15 (50.0%) |
| 3.0x to 3.9x | 10 (5.3%) | 12 (40.0%) |
| 4.0x or more | 94 (50.0%) | 0 (0.0%) |
| Total | 188 (100.0%) | 30 (100.0%) |
Real Estate Taxes by Mortgage Status in Fort Washakie
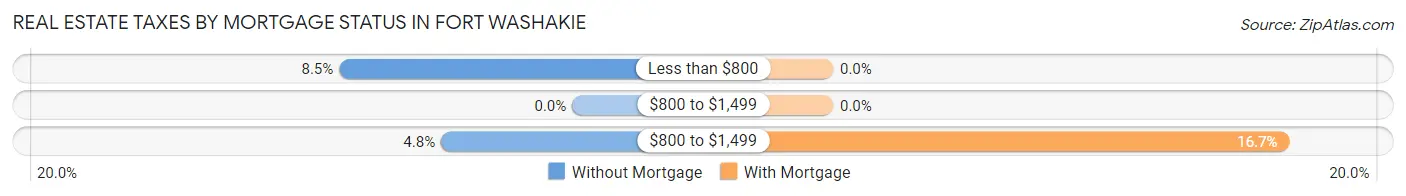
| Property Taxes | Without Mortgage | With Mortgage |
| Less than $800 | 16 (8.5%) | 0 (0.0%) |
| $800 to $1,499 | 0 (0.0%) | 0 (0.0%) |
| $800 to $1,499 | 9 (4.8%) | 5 (16.7%) |
| Total | 188 (100.0%) | 30 (100.0%) |
Health & Disability in Fort Washakie
Health Insurance Coverage by Age in Fort Washakie
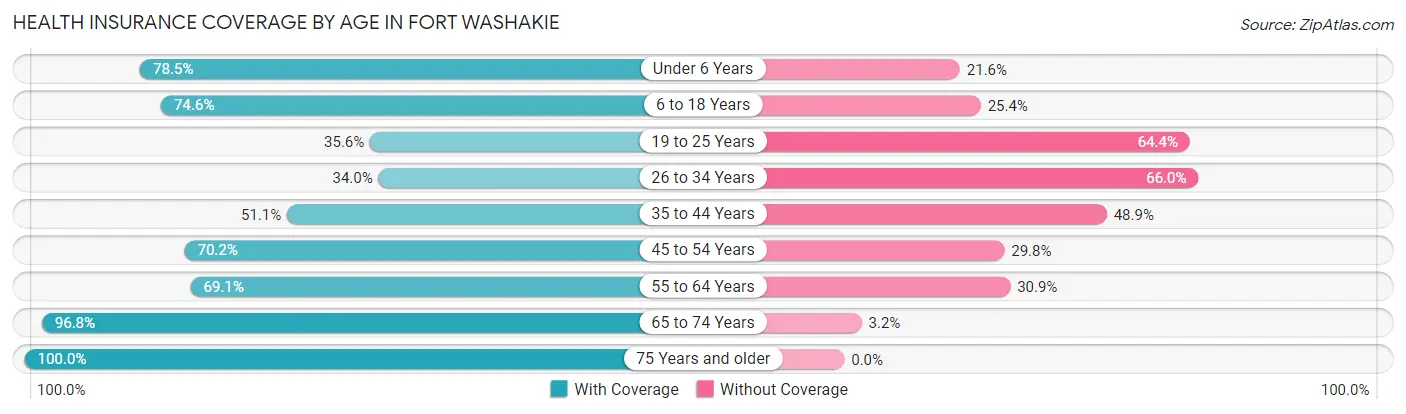
| Age Bracket | With Coverage | Without Coverage |
| Under 6 Years | 91 (78.4%) | 25 (21.5%) |
| 6 to 18 Years | 299 (74.6%) | 102 (25.4%) |
| 19 to 25 Years | 53 (35.6%) | 96 (64.4%) |
| 26 to 34 Years | 52 (34.0%) | 101 (66.0%) |
| 35 to 44 Years | 72 (51.1%) | 69 (48.9%) |
| 45 to 54 Years | 127 (70.2%) | 54 (29.8%) |
| 55 to 64 Years | 96 (69.1%) | 43 (30.9%) |
| 65 to 74 Years | 90 (96.8%) | 3 (3.2%) |
| 75 Years and older | 72 (100.0%) | 0 (0.0%) |
| Total | 952 (65.9%) | 493 (34.1%) |
Health Insurance Coverage by Citizenship Status in Fort Washakie
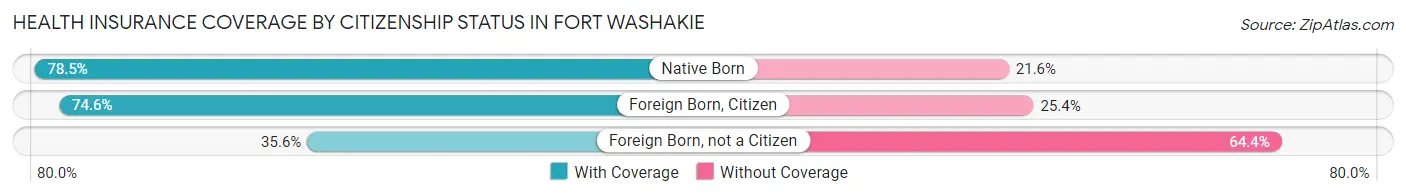
| Citizenship Status | With Coverage | Without Coverage |
| Native Born | 91 (78.4%) | 25 (21.5%) |
| Foreign Born, Citizen | 299 (74.6%) | 102 (25.4%) |
| Foreign Born, not a Citizen | 53 (35.6%) | 96 (64.4%) |
Health Insurance Coverage by Household Income in Fort Washakie
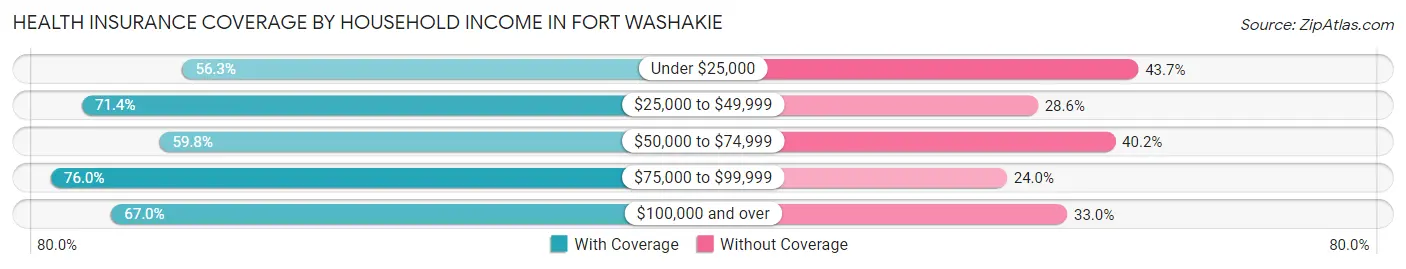
| Household Income | With Coverage | Without Coverage |
| Under $25,000 | 147 (56.3%) | 114 (43.7%) |
| $25,000 to $49,999 | 212 (71.4%) | 85 (28.6%) |
| $50,000 to $74,999 | 165 (59.8%) | 111 (40.2%) |
| $75,000 to $99,999 | 149 (76.0%) | 47 (24.0%) |
| $100,000 and over | 274 (67.0%) | 135 (33.0%) |
Public vs Private Health Insurance Coverage by Age in Fort Washakie
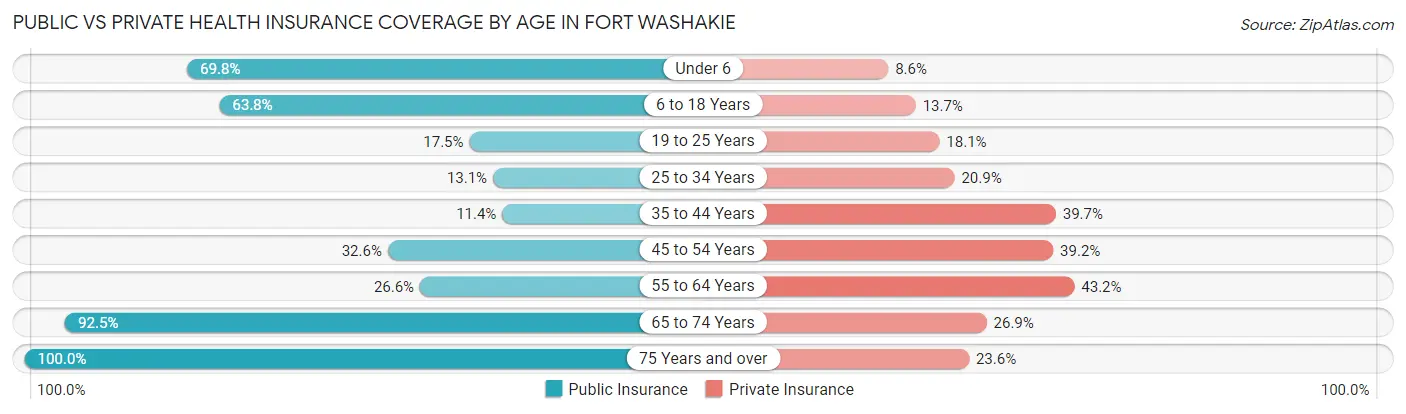
| Age Bracket | Public Insurance | Private Insurance |
| Under 6 | 81 (69.8%) | 10 (8.6%) |
| 6 to 18 Years | 256 (63.8%) | 55 (13.7%) |
| 19 to 25 Years | 26 (17.4%) | 27 (18.1%) |
| 25 to 34 Years | 20 (13.1%) | 32 (20.9%) |
| 35 to 44 Years | 16 (11.4%) | 56 (39.7%) |
| 45 to 54 Years | 59 (32.6%) | 71 (39.2%) |
| 55 to 64 Years | 37 (26.6%) | 60 (43.2%) |
| 65 to 74 Years | 86 (92.5%) | 25 (26.9%) |
| 75 Years and over | 72 (100.0%) | 17 (23.6%) |
| Total | 653 (45.2%) | 353 (24.4%) |
Disability Status by Sex by Age in Fort Washakie
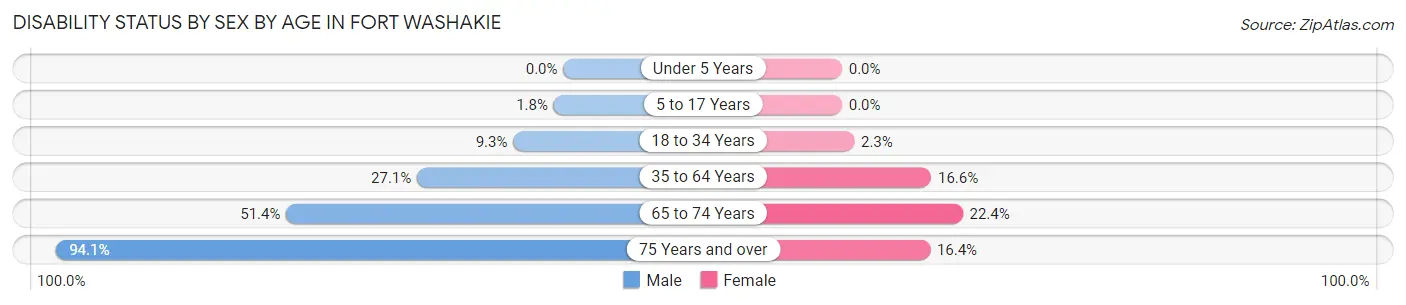
| Age Bracket | Male | Female |
| Under 5 Years | 0 (0.0%) | 0 (0.0%) |
| 5 to 17 Years | 4 (1.8%) | 0 (0.0%) |
| 18 to 34 Years | 13 (9.3%) | 4 (2.3%) |
| 35 to 64 Years | 76 (27.1%) | 30 (16.6%) |
| 65 to 74 Years | 18 (51.4%) | 13 (22.4%) |
| 75 Years and over | 16 (94.1%) | 9 (16.4%) |
Disability Class by Sex by Age in Fort Washakie
Disability Class: Hearing Difficulty
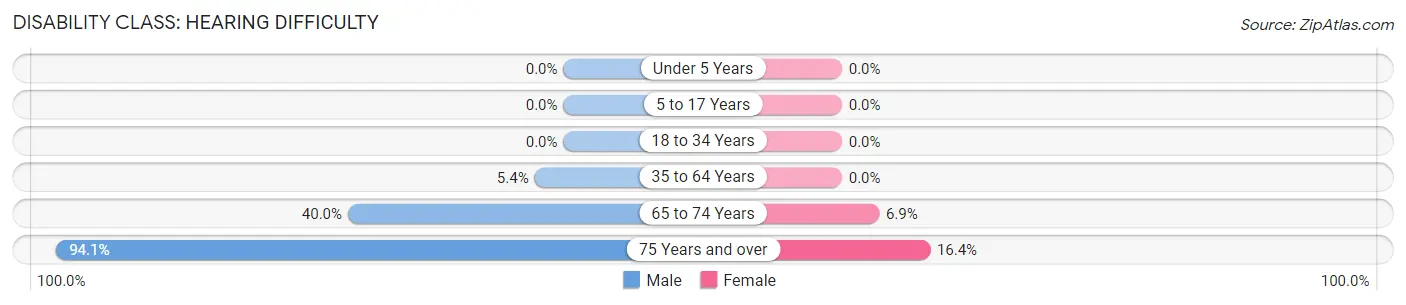
| Age Bracket | Male | Female |
| Under 5 Years | 0 (0.0%) | 0 (0.0%) |
| 5 to 17 Years | 0 (0.0%) | 0 (0.0%) |
| 18 to 34 Years | 0 (0.0%) | 0 (0.0%) |
| 35 to 64 Years | 15 (5.4%) | 0 (0.0%) |
| 65 to 74 Years | 14 (40.0%) | 4 (6.9%) |
| 75 Years and over | 16 (94.1%) | 9 (16.4%) |
Disability Class: Vision Difficulty
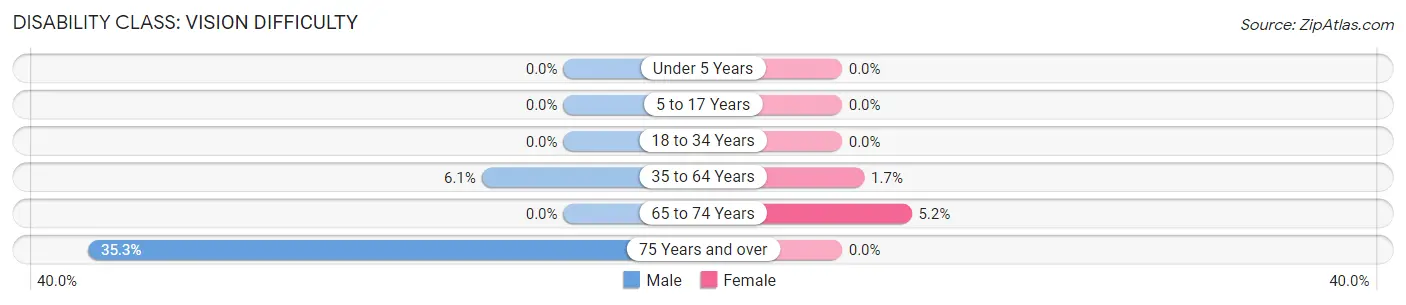
| Age Bracket | Male | Female |
| Under 5 Years | 0 (0.0%) | 0 (0.0%) |
| 5 to 17 Years | 0 (0.0%) | 0 (0.0%) |
| 18 to 34 Years | 0 (0.0%) | 0 (0.0%) |
| 35 to 64 Years | 17 (6.1%) | 3 (1.7%) |
| 65 to 74 Years | 0 (0.0%) | 3 (5.2%) |
| 75 Years and over | 6 (35.3%) | 0 (0.0%) |
Disability Class: Cognitive Difficulty
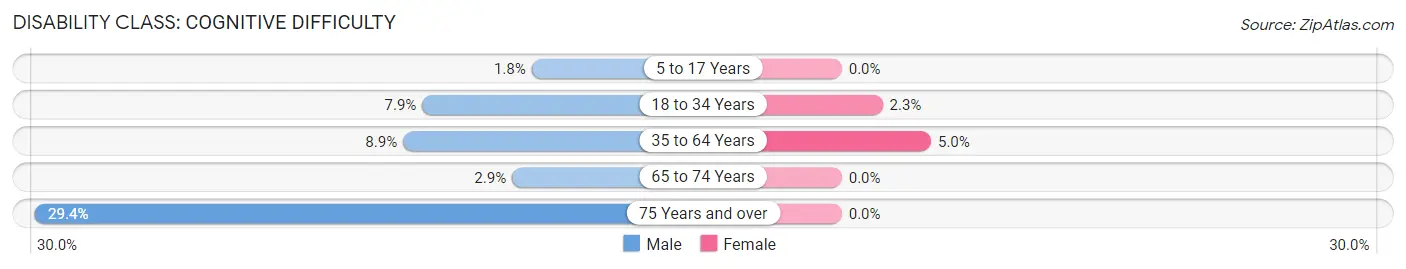
| Age Bracket | Male | Female |
| 5 to 17 Years | 4 (1.8%) | 0 (0.0%) |
| 18 to 34 Years | 11 (7.9%) | 4 (2.3%) |
| 35 to 64 Years | 25 (8.9%) | 9 (5.0%) |
| 65 to 74 Years | 1 (2.9%) | 0 (0.0%) |
| 75 Years and over | 5 (29.4%) | 0 (0.0%) |
Disability Class: Ambulatory Difficulty
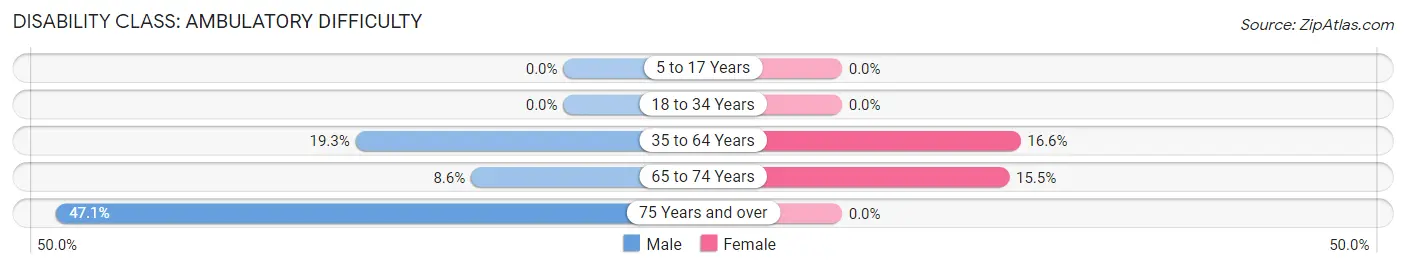
| Age Bracket | Male | Female |
| 5 to 17 Years | 0 (0.0%) | 0 (0.0%) |
| 18 to 34 Years | 0 (0.0%) | 0 (0.0%) |
| 35 to 64 Years | 54 (19.3%) | 30 (16.6%) |
| 65 to 74 Years | 3 (8.6%) | 9 (15.5%) |
| 75 Years and over | 8 (47.1%) | 0 (0.0%) |
Disability Class: Self-Care Difficulty
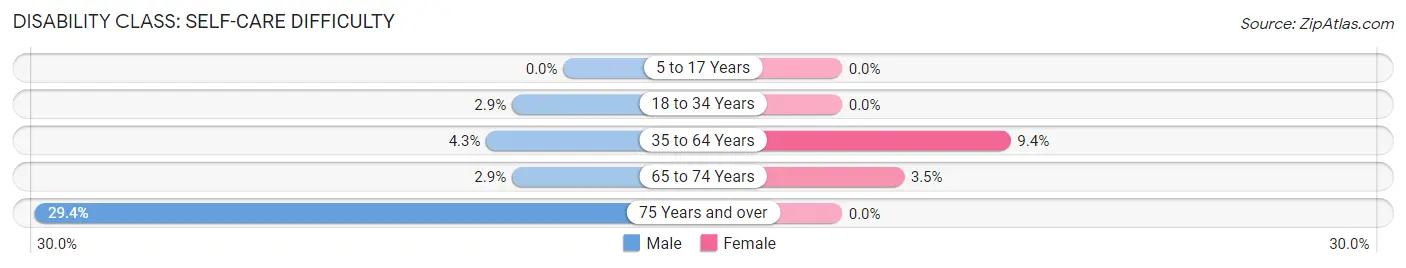
| Age Bracket | Male | Female |
| 5 to 17 Years | 0 (0.0%) | 0 (0.0%) |
| 18 to 34 Years | 4 (2.9%) | 0 (0.0%) |
| 35 to 64 Years | 12 (4.3%) | 17 (9.4%) |
| 65 to 74 Years | 1 (2.9%) | 2 (3.5%) |
| 75 Years and over | 5 (29.4%) | 0 (0.0%) |
Technology Access in Fort Washakie
Computing Device Access in Fort Washakie
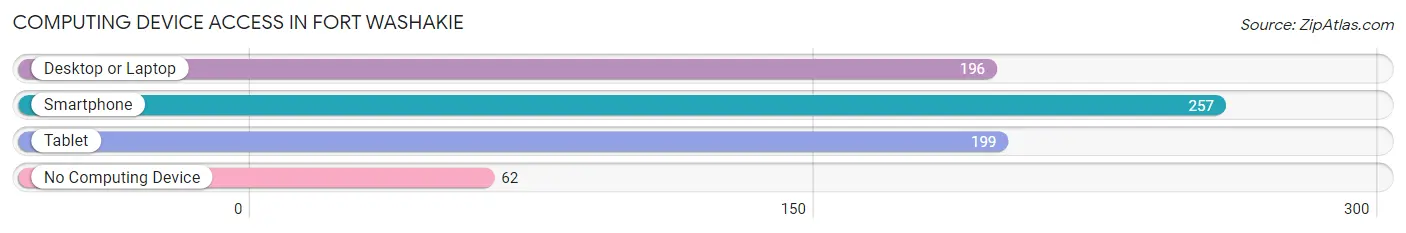
| Device Type | # Households | % Households |
| Desktop or Laptop | 196 | 55.7% |
| Smartphone | 257 | 73.0% |
| Tablet | 199 | 56.5% |
| No Computing Device | 62 | 17.6% |
| Total | 352 | 100.0% |
Internet Access in Fort Washakie
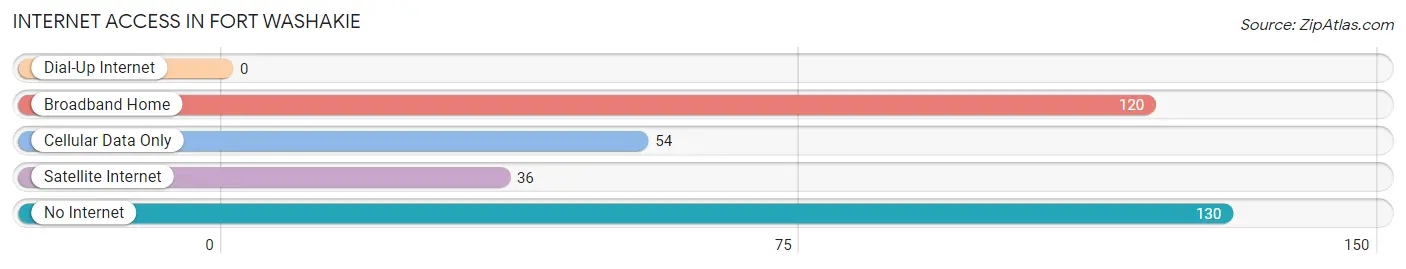
| Internet Type | # Households | % Households |
| Dial-Up Internet | 0 | 0.0% |
| Broadband Home | 120 | 34.1% |
| Cellular Data Only | 54 | 15.3% |
| Satellite Internet | 36 | 10.2% |
| No Internet | 130 | 36.9% |
| Total | 352 | 100.0% |
Fort Washakie Summary
Introduction
Located in the Wind River Valley of western Wyoming, the town of Fort Washakie is a small community with a rich history and a bright future. Founded in 1878, the town was originally established as a military post to protect the Shoshone and Arapaho tribes from hostile forces. Today, Fort Washakie is a vibrant community with a population of just over 1,000 people. The town is home to a variety of businesses, including a casino, a grocery store, and a gas station. The town is also home to the Wind River Indian Reservation, which is home to the Eastern Shoshone and Northern Arapaho tribes.
History
Fort Washakie was established in 1878 as a military post to protect the Shoshone and Arapaho tribes from hostile forces. The fort was named after Chief Washakie, a leader of the Eastern Shoshone tribe. The fort was used as a base of operations for the US Army during the Indian Wars of the late 19th century. In 1884, the fort was decommissioned and the land was sold to the Shoshone and Arapaho tribes.
The town of Fort Washakie was officially established in 1885. The town was originally a trading post for the local tribes and a stopover for travelers. In the early 20th century, the town began to grow as more settlers moved to the area. The town was incorporated in 1910 and the population grew to over 1,000 people by the 1950s.
Geography
Fort Washakie is located in the Wind River Valley of western Wyoming. The town is situated at an elevation of 6,000 feet and is surrounded by the Wind River Mountains. The town is located near the Wind River Indian Reservation, which is home to the Eastern Shoshone and Northern Arapaho tribes. The town is also located near the Wind River Canyon, which is a popular destination for hikers and outdoor enthusiasts.
Economy
The economy of Fort Washakie is largely based on tourism and the service industry. The town is home to a variety of businesses, including a casino, a grocery store, and a gas station. The town is also home to the Wind River Indian Reservation, which is home to the Eastern Shoshone and Northern Arapaho tribes. The reservation is a major employer in the area and provides jobs in the tourism, hospitality, and gaming industries.
Demographics
As of the 2010 census, the population of Fort Washakie was 1,042. The town is predominantly Native American, with the Eastern Shoshone and Northern Arapaho tribes making up the majority of the population. The town also has a small population of non-Native Americans, primarily of European descent. The median household income in the town is $30,000, and the median age is 33.
Conclusion
Fort Washakie is a small town with a rich history and a bright future. Founded in 1878, the town was originally established as a military post to protect the Shoshone and Arapaho tribes from hostile forces. Today, the town is a vibrant community with a population of just over 1,000 people. The town is home to a variety of businesses, including a casino, a grocery store, and a gas station. The town is also home to the Wind River Indian Reservation, which is home to the Eastern Shoshone and Northern Arapaho tribes. The town has a diverse economy and a population that is predominantly Native American. Fort Washakie is a unique and vibrant community that is sure to continue to grow and thrive in the years to come.
Common Questions
What is Per Capita Income in Fort Washakie?
Per Capita income in Fort Washakie is $17,814.
What is the Median Family Income in Fort Washakie?
Median Family Income in Fort Washakie is $56,042.
What is the Median Household income in Fort Washakie?
Median Household Income in Fort Washakie is $40,000.
What is Income or Wage Gap in Fort Washakie?
Income or Wage Gap in Fort Washakie is 4.9%.
Women in Fort Washakie earn 95.1 cents for every dollar earned by a man.
What is Family Income Deficit in Fort Washakie?
Family Income Deficit in Fort Washakie is $8,959.
Families that are below poverty line in Fort Washakie earn $8,959 less on average than the poverty threshold level.
What is Inequality or Gini Index in Fort Washakie?
Inequality or Gini Index in Fort Washakie is 0.49.
What is the Total Population of Fort Washakie?
Total Population of Fort Washakie is 1,481.
What is the Total Male Population of Fort Washakie?
Total Male Population of Fort Washakie is 753.
What is the Total Female Population of Fort Washakie?
Total Female Population of Fort Washakie is 728.
What is the Ratio of Males per 100 Females in Fort Washakie?
There are 103.43 Males per 100 Females in Fort Washakie.
What is the Ratio of Females per 100 Males in Fort Washakie?
There are 96.68 Females per 100 Males in Fort Washakie.
What is the Median Population Age in Fort Washakie?
Median Population Age in Fort Washakie is 31.8 Years.
What is the Average Family Size in Fort Washakie
Average Family Size in Fort Washakie is 4.8 People.
What is the Average Household Size in Fort Washakie
Average Household Size in Fort Washakie is 4.1 People.
How Large is the Labor Force in Fort Washakie?
There are 584 People in the Labor Forcein in Fort Washakie.
What is the Percentage of People in the Labor Force in Fort Washakie?
55.3% of People are in the Labor Force in Fort Washakie.
What is the Unemployment Rate in Fort Washakie?
Unemployment Rate in Fort Washakie is 18.5%.