Fort Laramie, WY Map & Demographics
Fort Laramie Map
Fort Laramie Overview
$43,703
PER CAPITA INCOME
$86,250
AVG FAMILY INCOME
$55,625
AVG HOUSEHOLD INCOME
78.0%
WAGE / INCOME GAP [ % ]
22.0¢/ $1
WAGE / INCOME GAP [ $ ]
0.35
INEQUALITY / GINI INDEX
151
TOTAL POPULATION
80
MALE POPULATION
71
FEMALE POPULATION
112.68
MALES / 100 FEMALES
88.75
FEMALES / 100 MALES
58.6
MEDIAN AGE
2.3
AVG FAMILY SIZE
1.7
AVG HOUSEHOLD SIZE
76
LABOR FORCE [ PEOPLE ]
54.3%
PERCENT IN LABOR FORCE
1.3%
UNEMPLOYMENT RATE
Fort Laramie Zip Codes
Fort Laramie Area Codes
Income in Fort Laramie
Income Overview in Fort Laramie
Per Capita Income in Fort Laramie is $43,703, while median incomes of families and households are $86,250 and $55,625 respectively.
| Characteristic | Number | Measure |
| Per Capita Income | 151 | $43,703 |
| Median Family Income | 45 | $86,250 |
| Mean Family Income | 45 | $88,980 |
| Median Household Income | 87 | $55,625 |
| Mean Household Income | 87 | $70,048 |
| Income Deficit | 45 | $0 |
| Wage / Income Gap (%) | 151 | 77.97% |
| Wage / Income Gap ($) | 151 | 22.03¢ per $1 |
| Gini / Inequality Index | 151 | 0.35 |
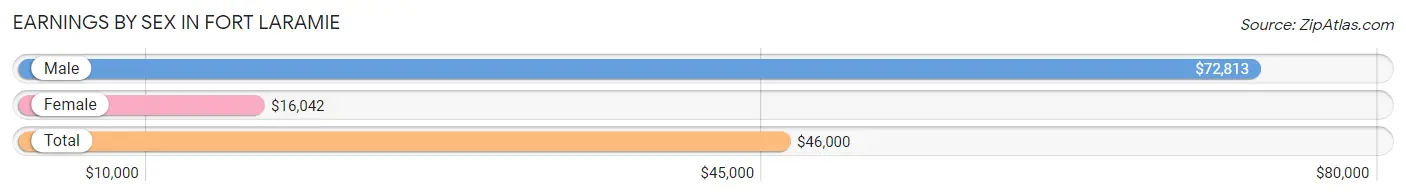
Earnings by Sex in Fort Laramie
Average Earnings in Fort Laramie are $46,000, $72,813 for men and $16,042 for women, a difference of 78.0%.
| Sex | Number | Average Earnings |
| Male | 57 (57.0%) | $72,813 |
| Female | 43 (43.0%) | $16,042 |
| Total | 100 (100.0%) | $46,000 |
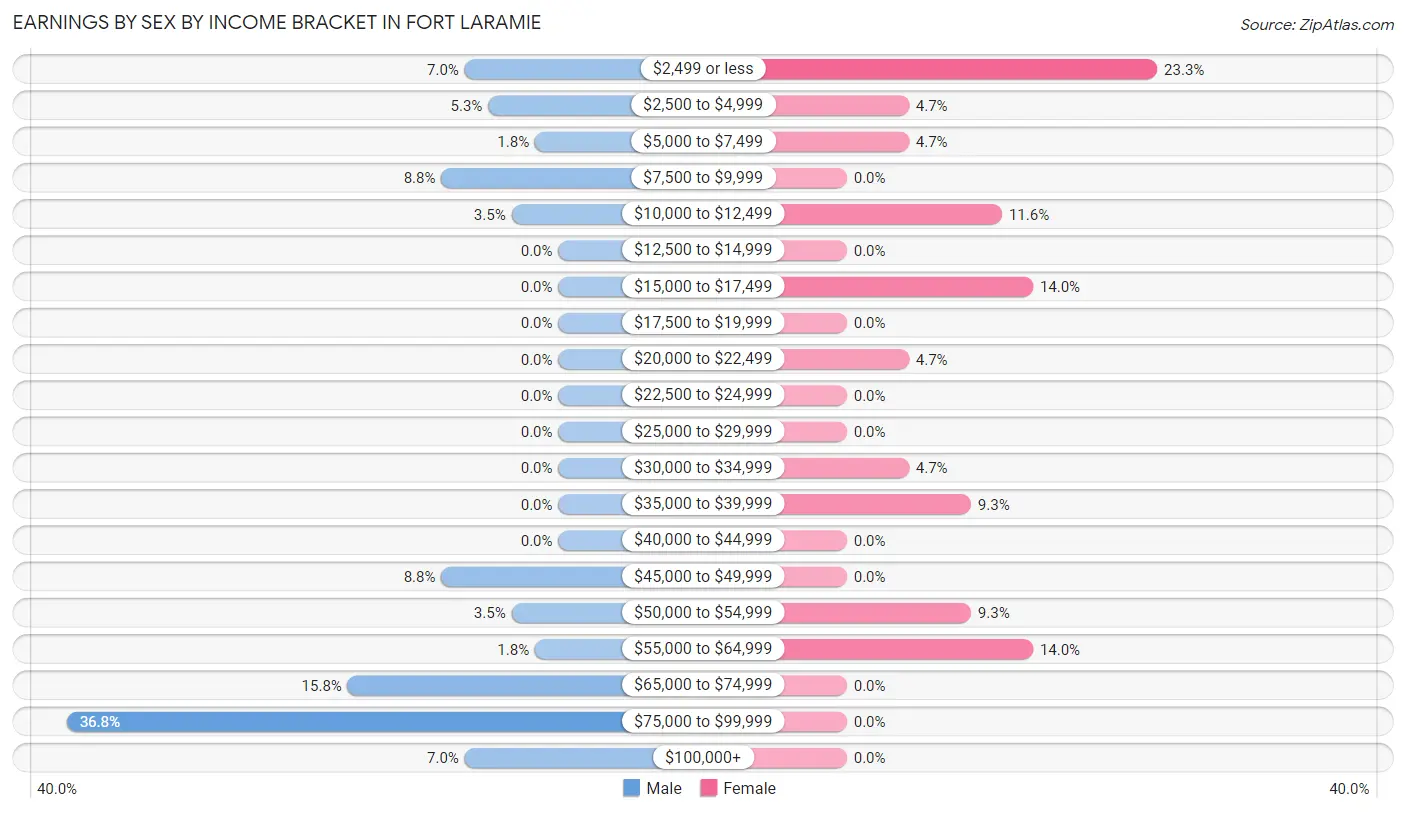
Earnings by Sex by Income Bracket in Fort Laramie
The most common earnings brackets in Fort Laramie are $75,000 to $99,999 for men (21 | 36.8%) and $2,499 or less for women (10 | 23.3%).
| Income | Male | Female |
| $2,499 or less | 4 (7.0%) | 10 (23.3%) |
| $2,500 to $4,999 | 3 (5.3%) | 2 (4.6%) |
| $5,000 to $7,499 | 1 (1.8%) | 2 (4.6%) |
| $7,500 to $9,999 | 5 (8.8%) | 0 (0.0%) |
| $10,000 to $12,499 | 2 (3.5%) | 5 (11.6%) |
| $12,500 to $14,999 | 0 (0.0%) | 0 (0.0%) |
| $15,000 to $17,499 | 0 (0.0%) | 6 (14.0%) |
| $17,500 to $19,999 | 0 (0.0%) | 0 (0.0%) |
| $20,000 to $22,499 | 0 (0.0%) | 2 (4.6%) |
| $22,500 to $24,999 | 0 (0.0%) | 0 (0.0%) |
| $25,000 to $29,999 | 0 (0.0%) | 0 (0.0%) |
| $30,000 to $34,999 | 0 (0.0%) | 2 (4.6%) |
| $35,000 to $39,999 | 0 (0.0%) | 4 (9.3%) |
| $40,000 to $44,999 | 0 (0.0%) | 0 (0.0%) |
| $45,000 to $49,999 | 5 (8.8%) | 0 (0.0%) |
| $50,000 to $54,999 | 2 (3.5%) | 4 (9.3%) |
| $55,000 to $64,999 | 1 (1.8%) | 6 (14.0%) |
| $65,000 to $74,999 | 9 (15.8%) | 0 (0.0%) |
| $75,000 to $99,999 | 21 (36.8%) | 0 (0.0%) |
| $100,000+ | 4 (7.0%) | 0 (0.0%) |
| Total | 57 (100.0%) | 43 (100.0%) |
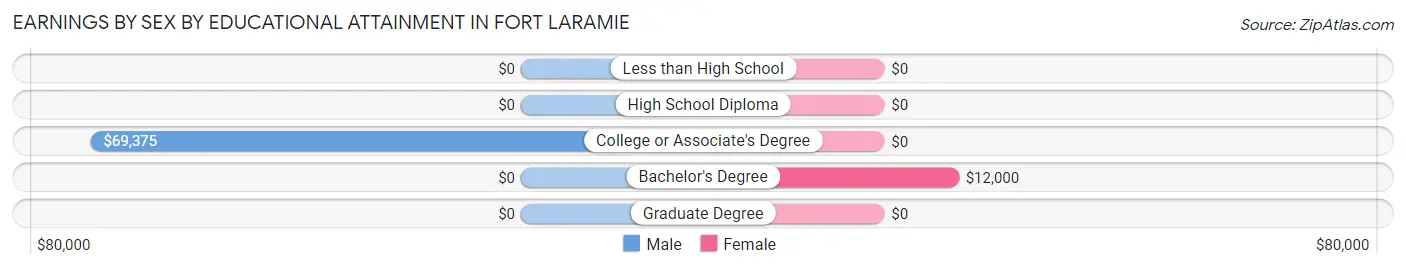
Earnings by Sex by Educational Attainment in Fort Laramie
Average earnings in Fort Laramie are $72,813 for men and $16,042 for women, a difference of 78.0%. Men with an educational attainment of college or associate's degree enjoy the highest average annual earnings of $69,375, while those with college or associate's degree education earn the least with $69,375. Women with an educational attainment of bachelor's degree earn the most with the average annual earnings of $12,000, while those with bachelor's degree education have the smallest earnings of $12,000.
| Educational Attainment | Male Income | Female Income |
| Less than High School | - | - |
| High School Diploma | - | - |
| College or Associate's Degree | $69,375 | $0 |
| Bachelor's Degree | - | - |
| Graduate Degree | - | - |
| Total | $72,813 | $16,042 |
Family Income in Fort Laramie
Family Income Brackets in Fort Laramie
According to the Fort Laramie family income data, there are 12 families falling into the $75,000 to $99,999 income range, which is the most common income bracket and makes up 26.7% of all families.
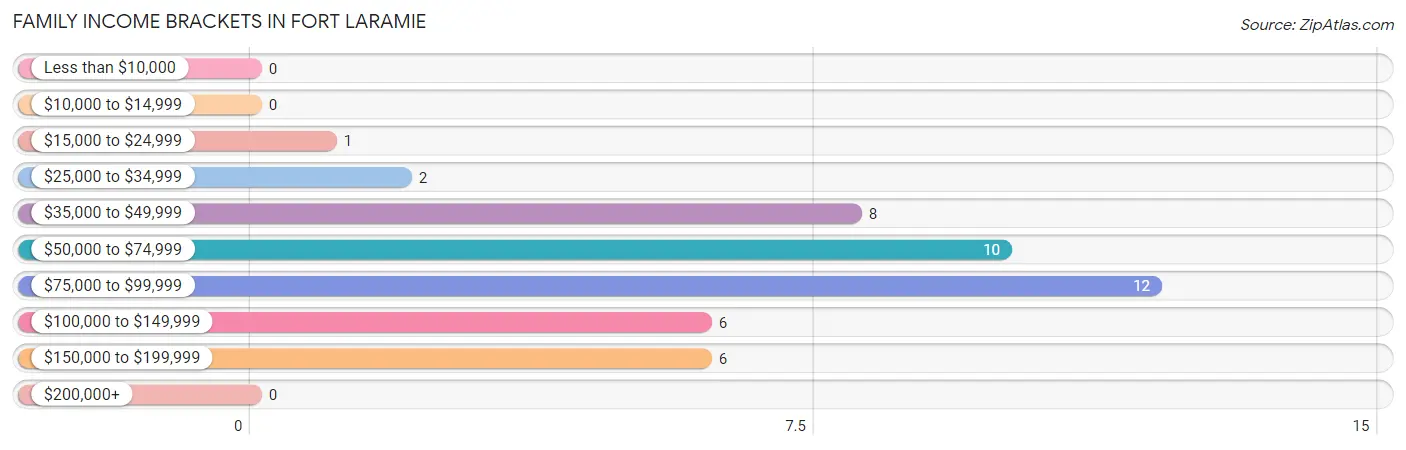
| Income Bracket | # Families | % Families |
| Less than $10,000 | 0 | 0.0% |
| $10,000 to $14,999 | 0 | 0.0% |
| $15,000 to $24,999 | 1 | 2.2% |
| $25,000 to $34,999 | 2 | 4.4% |
| $35,000 to $49,999 | 8 | 17.8% |
| $50,000 to $74,999 | 10 | 22.2% |
| $75,000 to $99,999 | 12 | 26.7% |
| $100,000 to $149,999 | 6 | 13.3% |
| $150,000 to $199,999 | 6 | 13.3% |
| $200,000+ | 0 | 0.0% |
Family Income by Famaliy Size in Fort Laramie
2-person families (37 | 82.2%) account for the highest median family income in Fort Laramie with $85,417 per family, while 2-person families (37 | 82.2%) have the highest median income of $42,708 per family member.
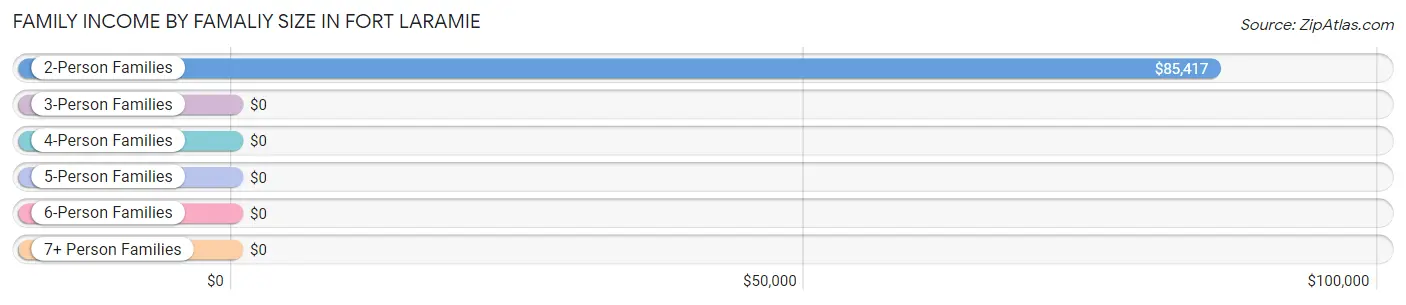
| Income Bracket | # Families | Median Income |
| 2-Person Families | 37 (82.2%) | $85,417 |
| 3-Person Families | 6 (13.3%) | $0 |
| 4-Person Families | 2 (4.4%) | $0 |
| 5-Person Families | 0 (0.0%) | $0 |
| 6-Person Families | 0 (0.0%) | $0 |
| 7+ Person Families | 0 (0.0%) | $0 |
| Total | 45 (100.0%) | $86,250 |
Family Income by Number of Earners in Fort Laramie
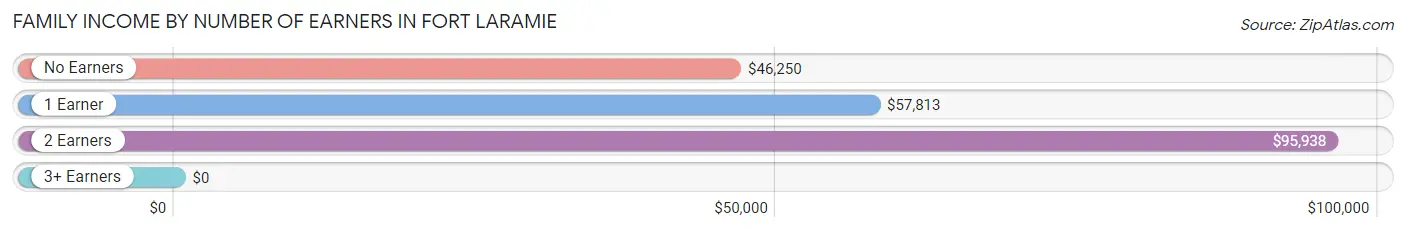
| Number of Earners | # Families | Median Income |
| No Earners | 8 (17.8%) | $46,250 |
| 1 Earner | 7 (15.6%) | $57,813 |
| 2 Earners | 29 (64.4%) | $95,938 |
| 3+ Earners | 1 (2.2%) | $0 |
| Total | 45 (100.0%) | $86,250 |
Household Income in Fort Laramie
Household Income Brackets in Fort Laramie
With 20 households falling in the category, the $25,000 to $34,999 income range is the most frequent in Fort Laramie, accounting for 23.0% of all households.
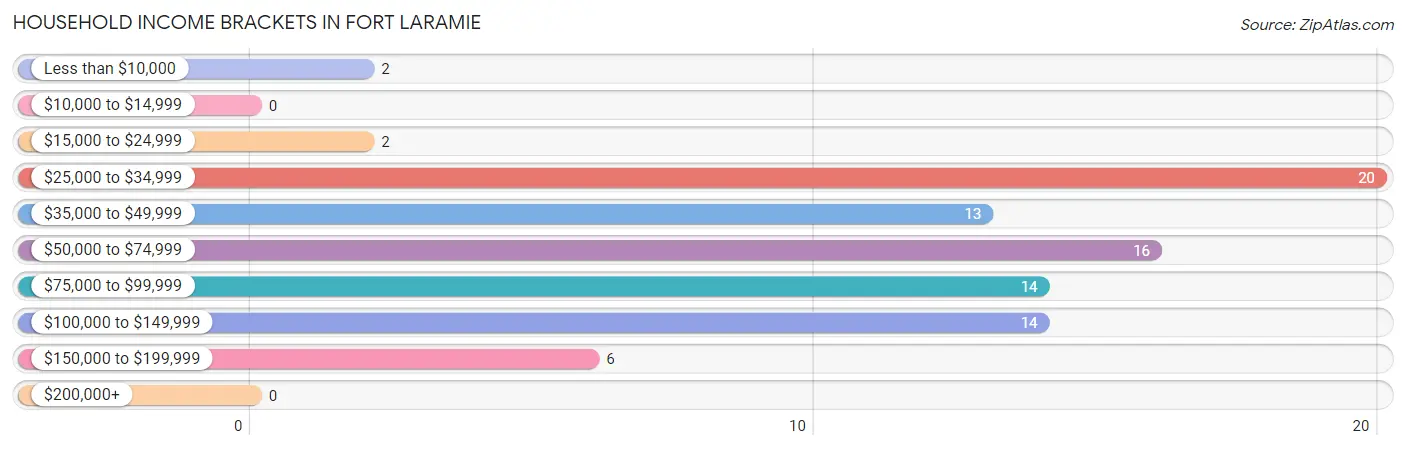
| Income Bracket | # Households | % Households |
| Less than $10,000 | 2 | 2.3% |
| $10,000 to $14,999 | 0 | 0.0% |
| $15,000 to $24,999 | 2 | 2.3% |
| $25,000 to $34,999 | 20 | 23.0% |
| $35,000 to $49,999 | 13 | 14.9% |
| $50,000 to $74,999 | 16 | 18.4% |
| $75,000 to $99,999 | 14 | 16.1% |
| $100,000 to $149,999 | 14 | 16.1% |
| $150,000 to $199,999 | 6 | 6.9% |
| $200,000+ | 0 | 0.0% |
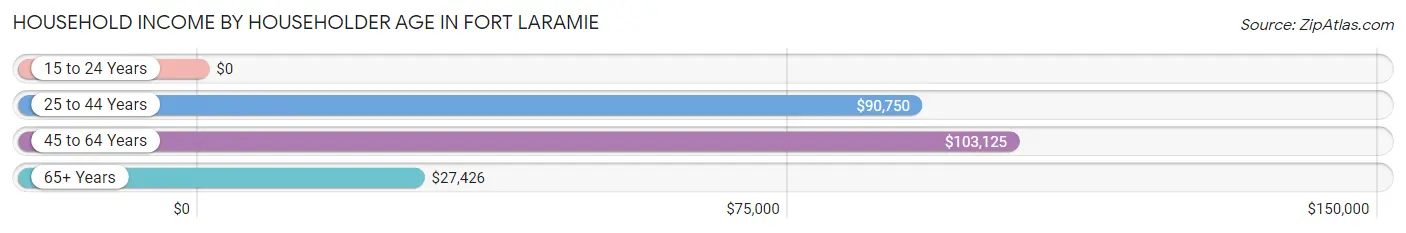
Household Income by Householder Age in Fort Laramie
The median household income in Fort Laramie is $55,625, with the highest median household income of $103,125 found in the 45 to 64 years age bracket for the primary householder. A total of 35 households (40.2%) fall into this category.
| Income Bracket | # Households | Median Income |
| 15 to 24 Years | 0 (0.0%) | $0 |
| 25 to 44 Years | 15 (17.2%) | $90,750 |
| 45 to 64 Years | 35 (40.2%) | $103,125 |
| 65+ Years | 37 (42.5%) | $27,426 |
| Total | 87 (100.0%) | $55,625 |
Poverty in Fort Laramie
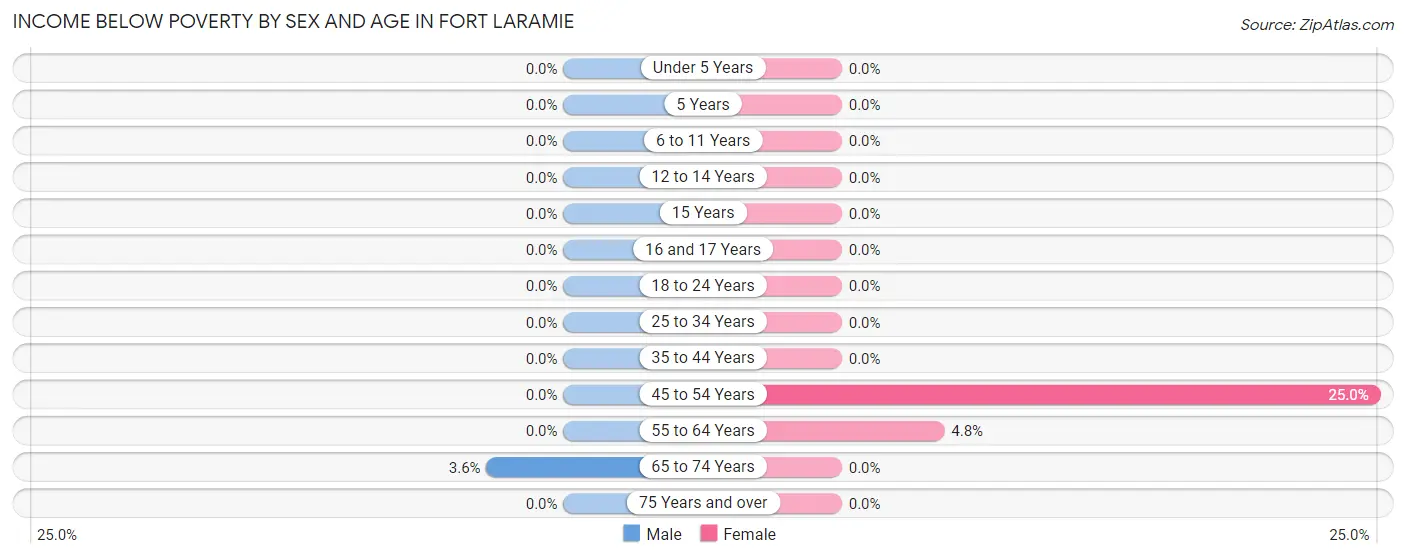
Income Below Poverty by Sex and Age in Fort Laramie
With 1.3% poverty level for males and 2.8% for females among the residents of Fort Laramie, 65 to 74 year old males and 45 to 54 year old females are the most vulnerable to poverty, with 1 males (3.6%) and 1 females (25.0%) in their respective age groups living below the poverty level.
| Age Bracket | Male | Female |
| Under 5 Years | 0 (0.0%) | 0 (0.0%) |
| 5 Years | 0 (0.0%) | 0 (0.0%) |
| 6 to 11 Years | 0 (0.0%) | 0 (0.0%) |
| 12 to 14 Years | 0 (0.0%) | 0 (0.0%) |
| 15 Years | 0 (0.0%) | 0 (0.0%) |
| 16 and 17 Years | 0 (0.0%) | 0 (0.0%) |
| 18 to 24 Years | 0 (0.0%) | 0 (0.0%) |
| 25 to 34 Years | 0 (0.0%) | 0 (0.0%) |
| 35 to 44 Years | 0 (0.0%) | 0 (0.0%) |
| 45 to 54 Years | 0 (0.0%) | 1 (25.0%) |
| 55 to 64 Years | 0 (0.0%) | 1 (4.8%) |
| 65 to 74 Years | 1 (3.6%) | 0 (0.0%) |
| 75 Years and over | 0 (0.0%) | 0 (0.0%) |
| Total | 1 (1.3%) | 2 (2.8%) |
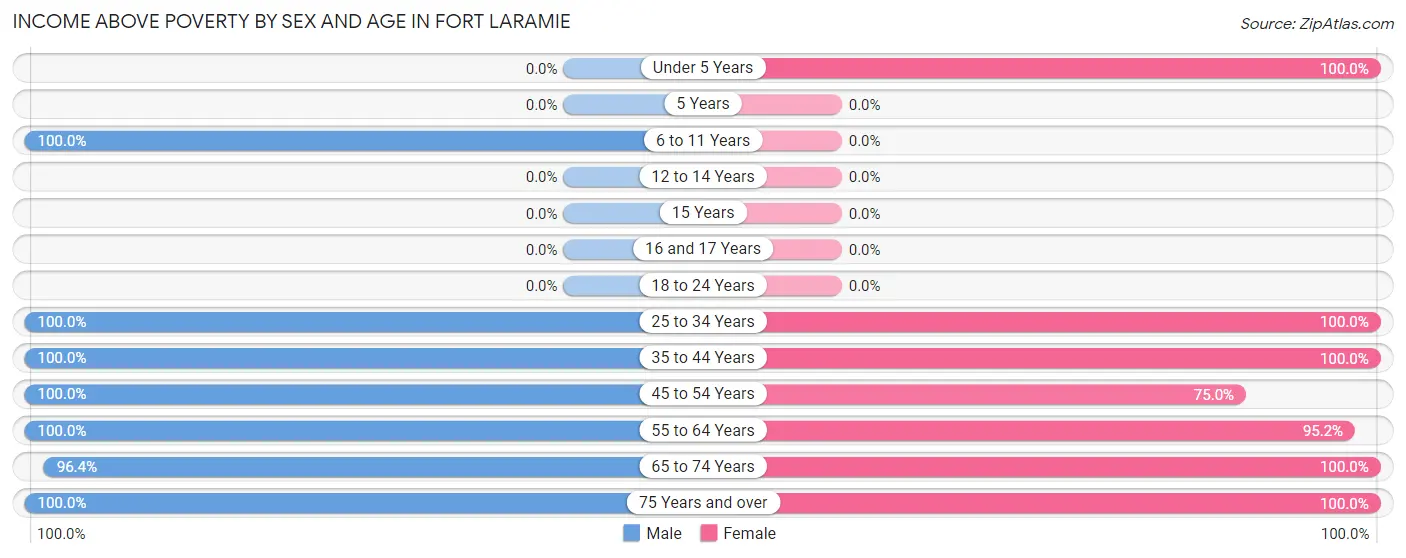
Income Above Poverty by Sex and Age in Fort Laramie
According to the poverty statistics in Fort Laramie, males aged 6 to 11 years and females aged under 5 years are the age groups that are most secure financially, with 100.0% of males and 100.0% of females in these age groups living above the poverty line.
| Age Bracket | Male | Female |
| Under 5 Years | 0 (0.0%) | 9 (100.0%) |
| 5 Years | 0 (0.0%) | 0 (0.0%) |
| 6 to 11 Years | 2 (100.0%) | 0 (0.0%) |
| 12 to 14 Years | 0 (0.0%) | 0 (0.0%) |
| 15 Years | 0 (0.0%) | 0 (0.0%) |
| 16 and 17 Years | 0 (0.0%) | 0 (0.0%) |
| 18 to 24 Years | 0 (0.0%) | 0 (0.0%) |
| 25 to 34 Years | 18 (100.0%) | 15 (100.0%) |
| 35 to 44 Years | 2 (100.0%) | 2 (100.0%) |
| 45 to 54 Years | 6 (100.0%) | 3 (75.0%) |
| 55 to 64 Years | 19 (100.0%) | 20 (95.2%) |
| 65 to 74 Years | 27 (96.4%) | 12 (100.0%) |
| 75 Years and over | 5 (100.0%) | 8 (100.0%) |
| Total | 79 (98.8%) | 69 (97.2%) |
Income Below Poverty Among Married-Couple Families in Fort Laramie
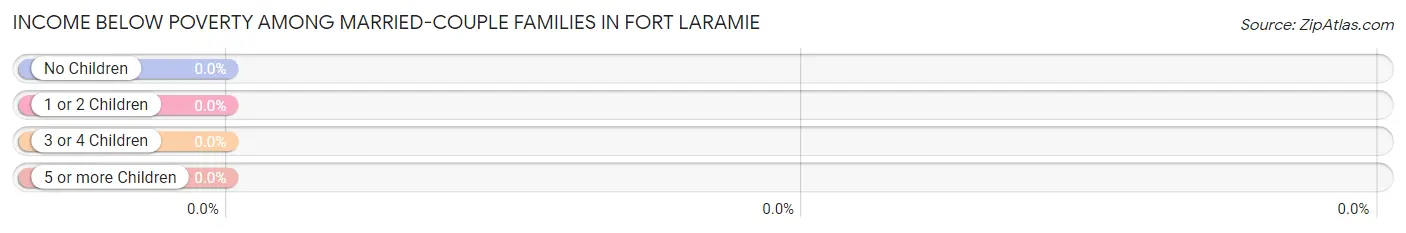
| Children | Above Poverty | Below Poverty |
| No Children | 33 (100.0%) | 0 (0.0%) |
| 1 or 2 Children | 7 (100.0%) | 0 (0.0%) |
| 3 or 4 Children | 0 (0.0%) | 0 (0.0%) |
| 5 or more Children | 0 (0.0%) | 0 (0.0%) |
| Total | 40 (100.0%) | 0 (0.0%) |
Income Below Poverty Among Single-Parent Households in Fort Laramie
| Children | Single Father | Single Mother |
| No Children | 0 (0.0%) | 0 (0.0%) |
| 1 or 2 Children | 0 (0.0%) | 0 (0.0%) |
| 3 or 4 Children | 0 (0.0%) | 0 (0.0%) |
| 5 or more Children | 0 (0.0%) | 0 (0.0%) |
| Total | 0 (0.0%) | 0 (0.0%) |
Income Below Poverty Among Married-Couple vs Single-Parent Households in Fort Laramie
| Children | Married-Couple Families | Single-Parent Households |
| No Children | 0 (0.0%) | 0 (0.0%) |
| 1 or 2 Children | 0 (0.0%) | 0 (0.0%) |
| 3 or 4 Children | 0 (0.0%) | 0 (0.0%) |
| 5 or more Children | 0 (0.0%) | 0 (0.0%) |
| Total | 0 (0.0%) | 0 (0.0%) |
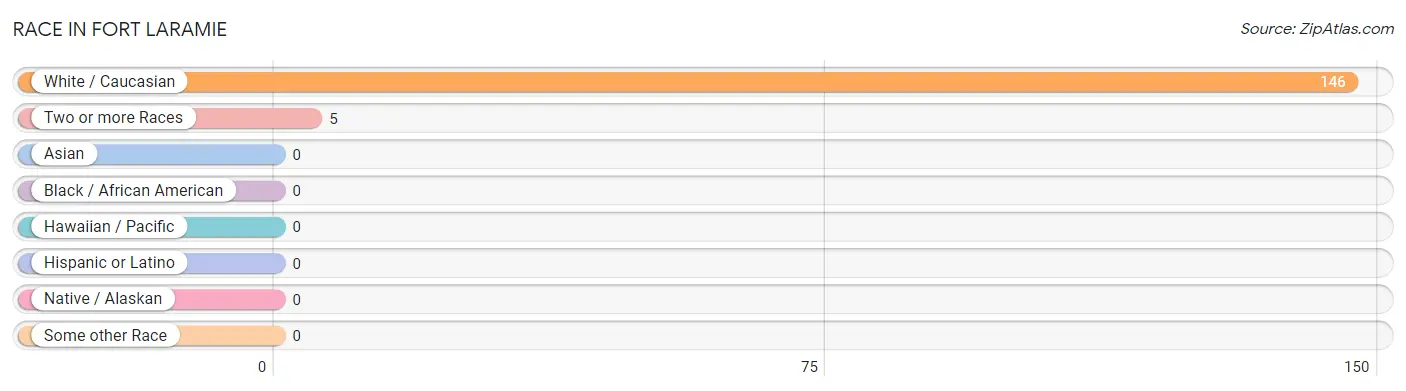
Race in Fort Laramie
The most populous races in Fort Laramie are White / Caucasian (146 | 96.7%), and Two or more Races (5 | 3.3%).
| Race | # Population | % Population |
| Asian | 0 | 0.0% |
| Black / African American | 0 | 0.0% |
| Hawaiian / Pacific | 0 | 0.0% |
| Hispanic or Latino | 0 | 0.0% |
| Native / Alaskan | 0 | 0.0% |
| White / Caucasian | 146 | 96.7% |
| Two or more Races | 5 | 3.3% |
| Some other Race | 0 | 0.0% |
| Total | 151 | 100.0% |
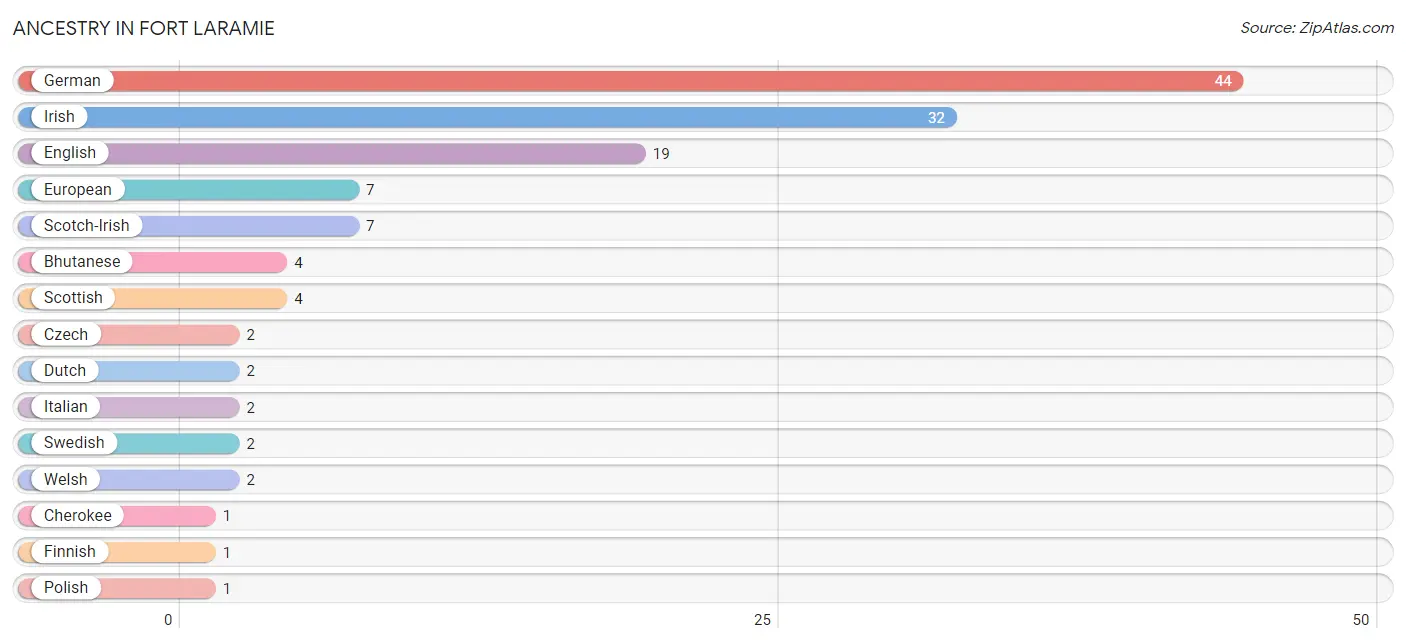
Ancestry in Fort Laramie
The most populous ancestries reported in Fort Laramie are German (44 | 29.1%), Irish (32 | 21.2%), English (19 | 12.6%), European (7 | 4.6%), and Scotch-Irish (7 | 4.6%), together accounting for 72.2% of all Fort Laramie residents.
| Ancestry | # Population | % Population |
| Bhutanese | 4 | 2.6% |
| Cherokee | 1 | 0.7% |
| Czech | 2 | 1.3% |
| Dutch | 2 | 1.3% |
| English | 19 | 12.6% |
| European | 7 | 4.6% |
| Finnish | 1 | 0.7% |
| German | 44 | 29.1% |
| Irish | 32 | 21.2% |
| Italian | 2 | 1.3% |
| Polish | 1 | 0.7% |
| Scotch-Irish | 7 | 4.6% |
| Scottish | 4 | 2.6% |
| Swedish | 2 | 1.3% |
| Welsh | 2 | 1.3% | View All 15 Rows |
Immigrants in Fort Laramie

| Immigration Origin | # Population | % Population | View All 0 Rows |
Sex and Age in Fort Laramie
Sex and Age in Fort Laramie
The most populous age groups in Fort Laramie are 25 to 29 Years (18 | 22.5%) for men and 25 to 29 Years (13 | 18.3%) for women.
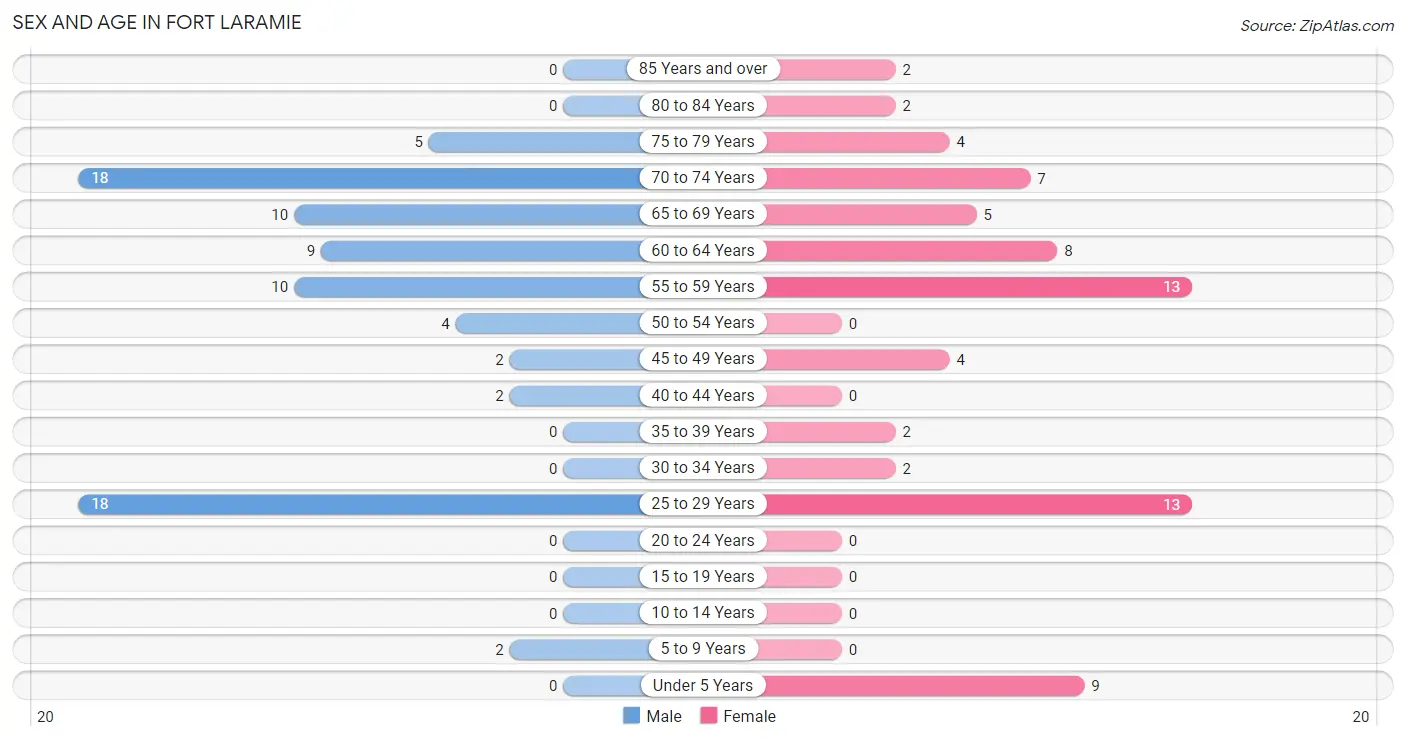
| Age Bracket | Male | Female |
| Under 5 Years | 0 (0.0%) | 9 (12.7%) |
| 5 to 9 Years | 2 (2.5%) | 0 (0.0%) |
| 10 to 14 Years | 0 (0.0%) | 0 (0.0%) |
| 15 to 19 Years | 0 (0.0%) | 0 (0.0%) |
| 20 to 24 Years | 0 (0.0%) | 0 (0.0%) |
| 25 to 29 Years | 18 (22.5%) | 13 (18.3%) |
| 30 to 34 Years | 0 (0.0%) | 2 (2.8%) |
| 35 to 39 Years | 0 (0.0%) | 2 (2.8%) |
| 40 to 44 Years | 2 (2.5%) | 0 (0.0%) |
| 45 to 49 Years | 2 (2.5%) | 4 (5.6%) |
| 50 to 54 Years | 4 (5.0%) | 0 (0.0%) |
| 55 to 59 Years | 10 (12.5%) | 13 (18.3%) |
| 60 to 64 Years | 9 (11.3%) | 8 (11.3%) |
| 65 to 69 Years | 10 (12.5%) | 5 (7.0%) |
| 70 to 74 Years | 18 (22.5%) | 7 (9.9%) |
| 75 to 79 Years | 5 (6.2%) | 4 (5.6%) |
| 80 to 84 Years | 0 (0.0%) | 2 (2.8%) |
| 85 Years and over | 0 (0.0%) | 2 (2.8%) |
| Total | 80 (100.0%) | 71 (100.0%) |
Families and Households in Fort Laramie
Median Family Size in Fort Laramie
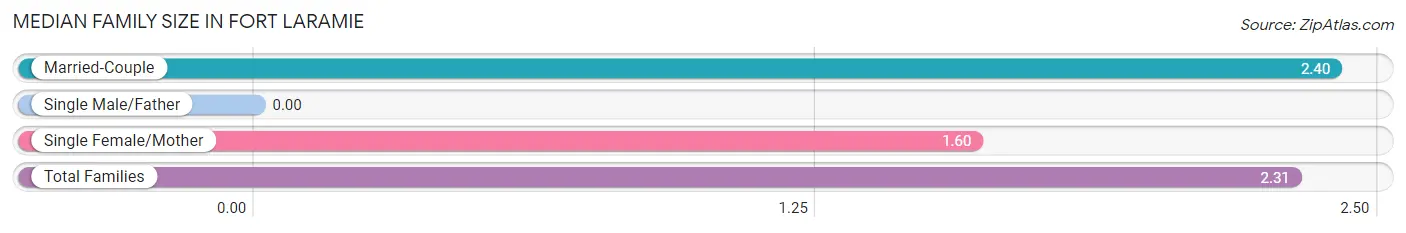
| Family Type | # Families | Family Size |
| Married-Couple | 40 (88.9%) | 2.40 |
| Single Male/Father | 0 (0.0%) | - |
| Single Female/Mother | 5 (11.1%) | 1.60 |
| Total Families | 45 (100.0%) | 2.31 |
Median Household Size in Fort Laramie
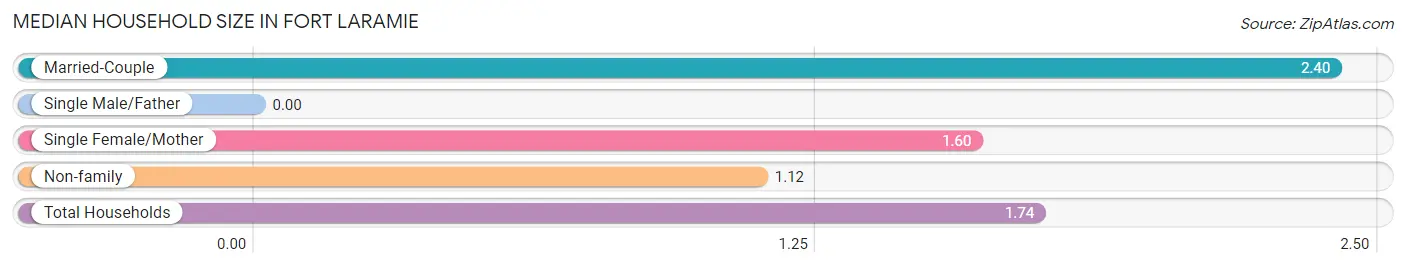
| Household Type | # Households | Household Size |
| Married-Couple | 40 (46.0%) | 2.40 |
| Single Male/Father | 0 (0.0%) | - |
| Single Female/Mother | 5 (5.8%) | 1.60 |
| Non-family | 42 (48.3%) | 1.12 |
| Total Households | 87 (100.0%) | 1.74 |
Household Size by Marriage Status in Fort Laramie
Out of a total of 87 households in Fort Laramie, 45 (51.7%) are family households, while 42 (48.3%) are nonfamily households. The most numerous type of family households are 2-person households, comprising 37, and the most common type of nonfamily households are 1-person households, comprising 34.
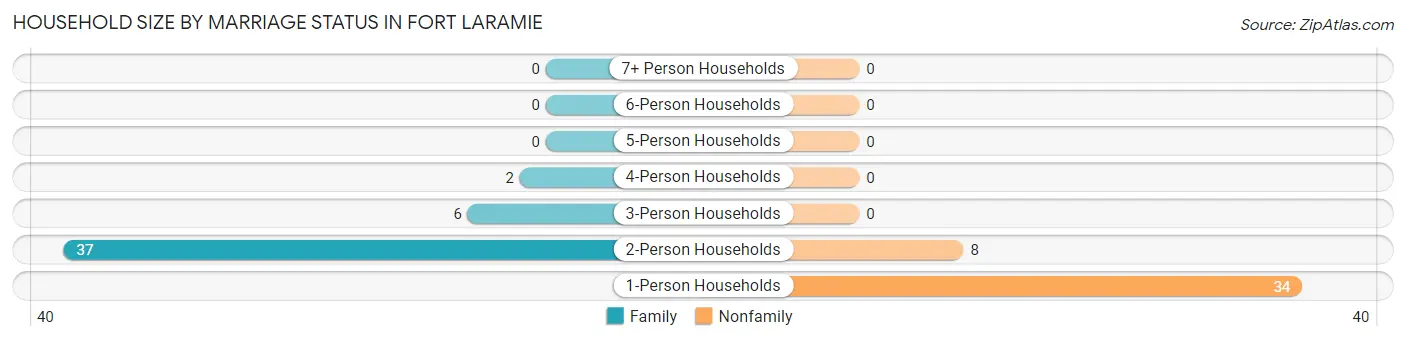
| Household Size | Family Households | Nonfamily Households |
| 1-Person Households | - | 34 (39.1%) |
| 2-Person Households | 37 (42.5%) | 8 (9.2%) |
| 3-Person Households | 6 (6.9%) | 0 (0.0%) |
| 4-Person Households | 2 (2.3%) | 0 (0.0%) |
| 5-Person Households | 0 (0.0%) | 0 (0.0%) |
| 6-Person Households | 0 (0.0%) | 0 (0.0%) |
| 7+ Person Households | 0 (0.0%) | 0 (0.0%) |
| Total | 45 (51.7%) | 42 (48.3%) |
Female Fertility in Fort Laramie
Fertility by Age in Fort Laramie
Average fertility rate in Fort Laramie is 238.0 births per 1,000 women. Women in the age bracket of 20 to 34 years have the highest fertility rate with 333.0 births per 1,000 women. Women in the age bracket of 20 to 34 years acount for 100.0% of all women with births.
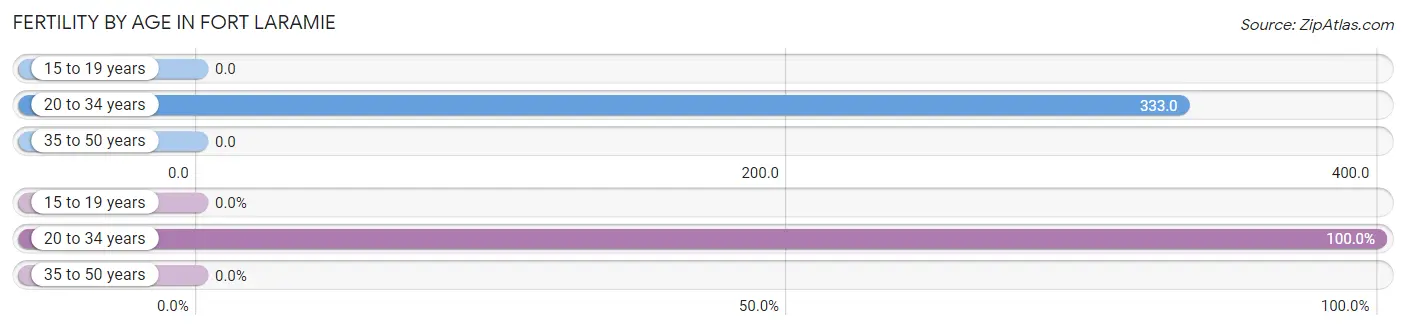
| Age Bracket | Women with Births | Births / 1,000 Women |
| 15 to 19 years | 0 (0.0%) | 0.0 |
| 20 to 34 years | 5 (100.0%) | 333.0 |
| 35 to 50 years | 0 (0.0%) | 0.0 |
| Total | 5 (100.0%) | 238.0 |
Fertility by Age by Marriage Status in Fort Laramie
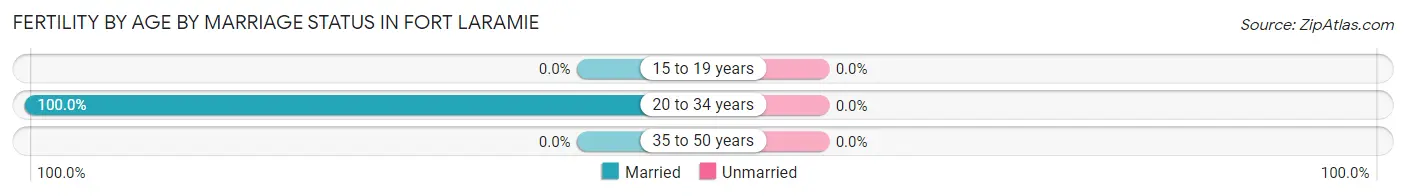
| Age Bracket | Married | Unmarried |
| 15 to 19 years | 0 (0.0%) | 0 (0.0%) |
| 20 to 34 years | 5 (100.0%) | 0 (0.0%) |
| 35 to 50 years | 0 (0.0%) | 0 (0.0%) |
| Total | 5 (100.0%) | 0 (0.0%) |
Fertility by Education in Fort Laramie
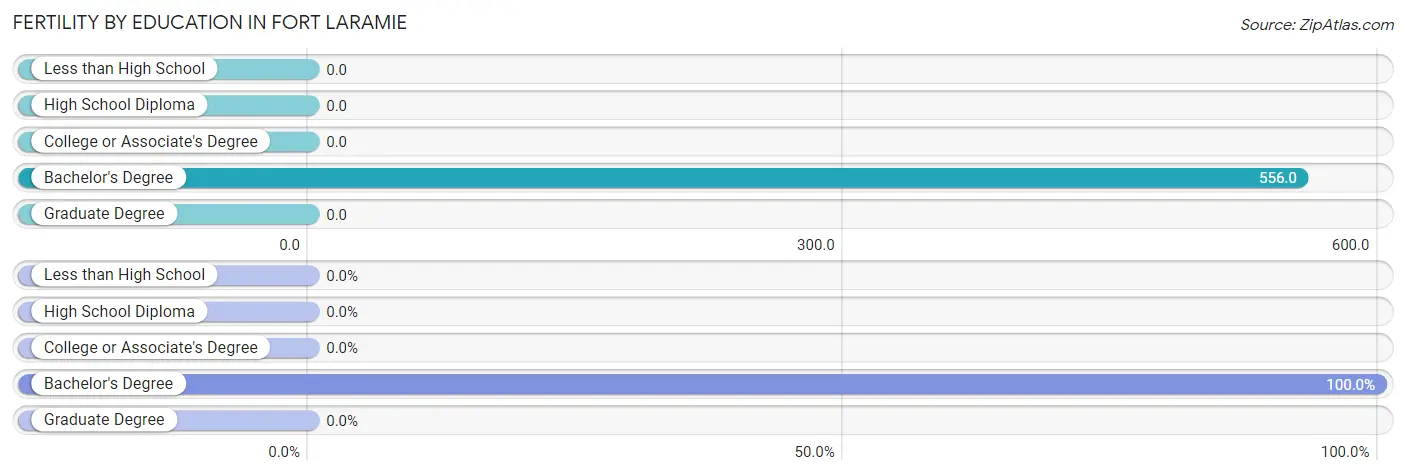
| Educational Attainment | Women with Births | Births / 1,000 Women |
| Less than High School | 0 (0.0%) | 0.0 |
| High School Diploma | 0 (0.0%) | 0.0 |
| College or Associate's Degree | 0 (0.0%) | 0.0 |
| Bachelor's Degree | 5 (100.0%) | 556.0 |
| Graduate Degree | 0 (0.0%) | 0.0 |
| Total | 5 (100.0%) | 238.0 |
Fertility by Education by Marriage Status in Fort Laramie
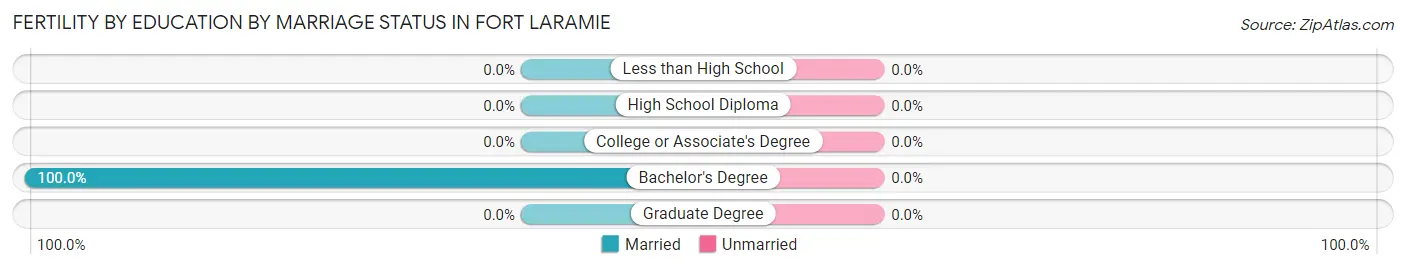
| Educational Attainment | Married | Unmarried |
| Less than High School | 0 (0.0%) | 0 (0.0%) |
| High School Diploma | 0 (0.0%) | 0 (0.0%) |
| College or Associate's Degree | 0 (0.0%) | 0 (0.0%) |
| Bachelor's Degree | 5 (100.0%) | 0 (0.0%) |
| Graduate Degree | 0 (0.0%) | 0 (0.0%) |
| Total | 5 (100.0%) | 0 (0.0%) |
Employment Characteristics in Fort Laramie
Employment by Class of Employer in Fort Laramie
Among the 74 employed individuals in Fort Laramie, private company employees (41 | 55.4%), federal government employees (17 | 23.0%), and local government employees (8 | 10.8%) make up the most common classes of employment.
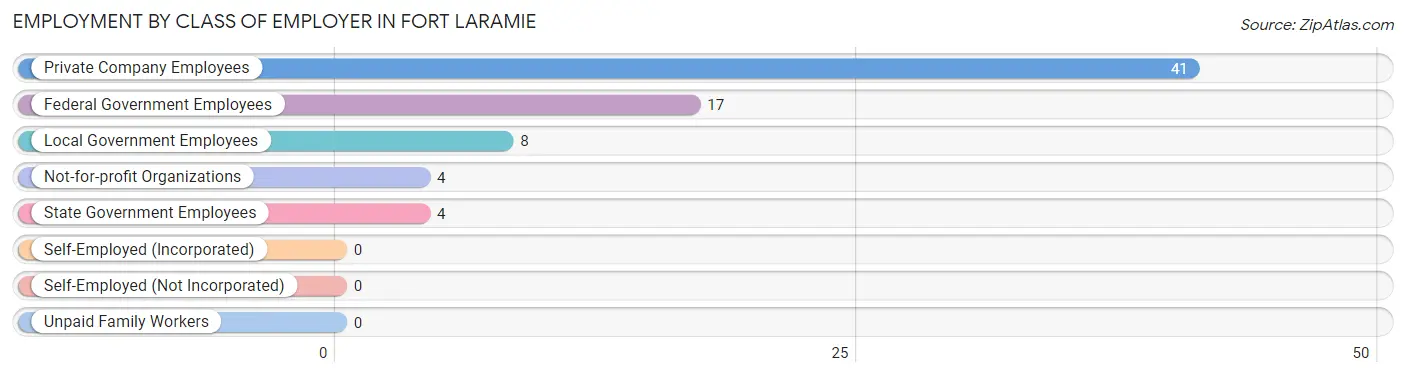
| Employer Class | # Employees | % Employees |
| Private Company Employees | 41 | 55.4% |
| Self-Employed (Incorporated) | 0 | 0.0% |
| Self-Employed (Not Incorporated) | 0 | 0.0% |
| Not-for-profit Organizations | 4 | 5.4% |
| Local Government Employees | 8 | 10.8% |
| State Government Employees | 4 | 5.4% |
| Federal Government Employees | 17 | 23.0% |
| Unpaid Family Workers | 0 | 0.0% |
| Total | 74 | 100.0% |
Employment Status by Age in Fort Laramie
According to the labor force statistics for Fort Laramie, out of the total population over 16 years of age (140), 54.3% or 76 individuals are in the labor force, with 1.3% or 1 of them unemployed. The age group with the highest labor force participation rate is 25 to 29 years, with 83.9% or 26 individuals in the labor force. Within the labor force, the 60 to 64 years age range has the highest percentage of unemployed individuals, with 11.1% or 1 of them being unemployed.
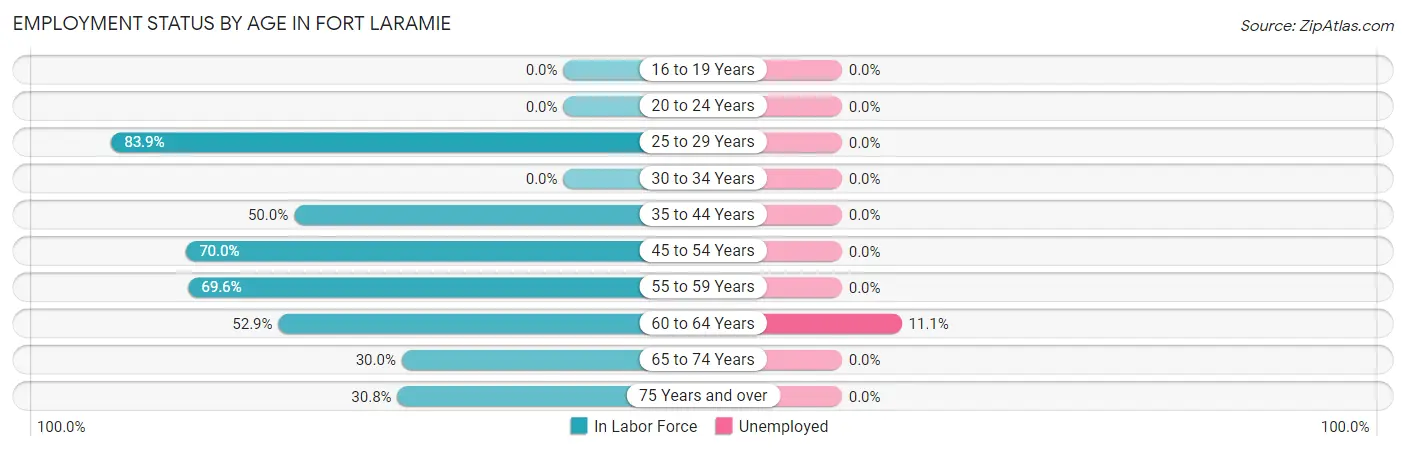
| Age Bracket | In Labor Force | Unemployed |
| 16 to 19 Years | 0 (0.0%) | 0 (0.0%) |
| 20 to 24 Years | 0 (0.0%) | 0 (0.0%) |
| 25 to 29 Years | 26 (83.9%) | 0 (0.0%) |
| 30 to 34 Years | 0 (0.0%) | 0 (0.0%) |
| 35 to 44 Years | 2 (50.0%) | 0 (0.0%) |
| 45 to 54 Years | 7 (70.0%) | 0 (0.0%) |
| 55 to 59 Years | 16 (69.6%) | 0 (0.0%) |
| 60 to 64 Years | 9 (52.9%) | 1 (11.1%) |
| 65 to 74 Years | 12 (30.0%) | 0 (0.0%) |
| 75 Years and over | 4 (30.8%) | 0 (0.0%) |
| Total | 76 (54.3%) | 1 (1.3%) |
Employment Status by Educational Attainment in Fort Laramie
According to labor force statistics for Fort Laramie, 69.0% of individuals (60) out of the total population between 25 and 64 years of age (87) are in the labor force, with 1.7% or 1 of them being unemployed. The group with the highest labor force participation rate are those with the educational attainment of high school diploma, with 70.0% or 14 individuals in the labor force. Within the labor force, individuals with college / associate degree education have the highest percentage of unemployment, with 3.1% or 1 of them being unemployed.
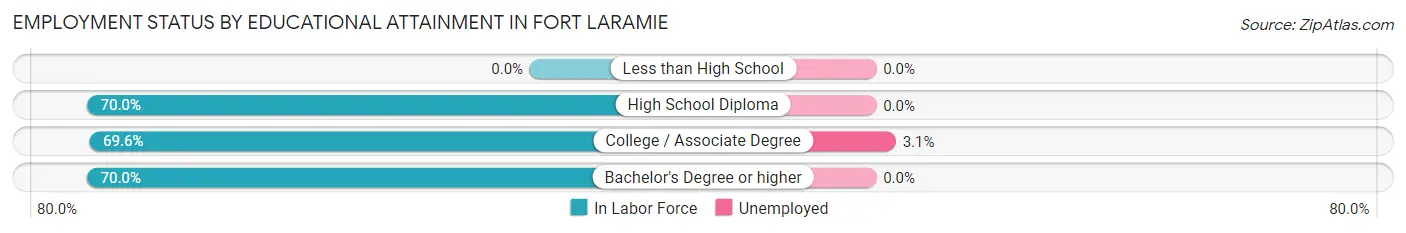
| Educational Attainment | In Labor Force | Unemployed |
| Less than High School | 0 (0.0%) | 0 (0.0%) |
| High School Diploma | 14 (70.0%) | 0 (0.0%) |
| College / Associate Degree | 32 (69.6%) | 1 (3.1%) |
| Bachelor's Degree or higher | 14 (70.0%) | 0 (0.0%) |
| Total | 60 (69.0%) | 1 (1.7%) |
Employment Occupations by Sex in Fort Laramie
Management, Business, Science and Arts Occupations
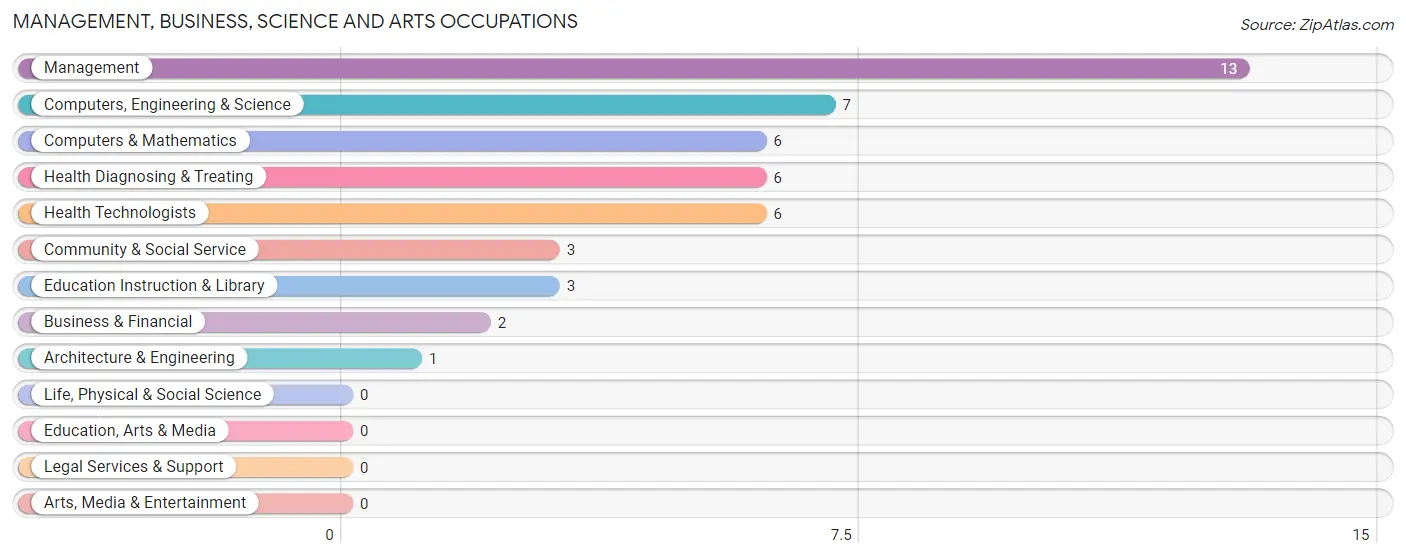
The most common Management, Business, Science and Arts occupations in Fort Laramie are Management (13 | 17.3%), Computers, Engineering & Science (7 | 9.3%), Computers & Mathematics (6 | 8.0%), Health Diagnosing & Treating (6 | 8.0%), and Health Technologists (6 | 8.0%).
Management, Business, Science and Arts Occupations by Sex
Within the Management, Business, Science and Arts occupations in Fort Laramie, the most male-oriented occupations are Management (100.0%), Computers, Engineering & Science (100.0%), and Computers & Mathematics (100.0%), while the most female-oriented occupations are Business & Financial (100.0%), Health Diagnosing & Treating (100.0%), and Health Technologists (100.0%).
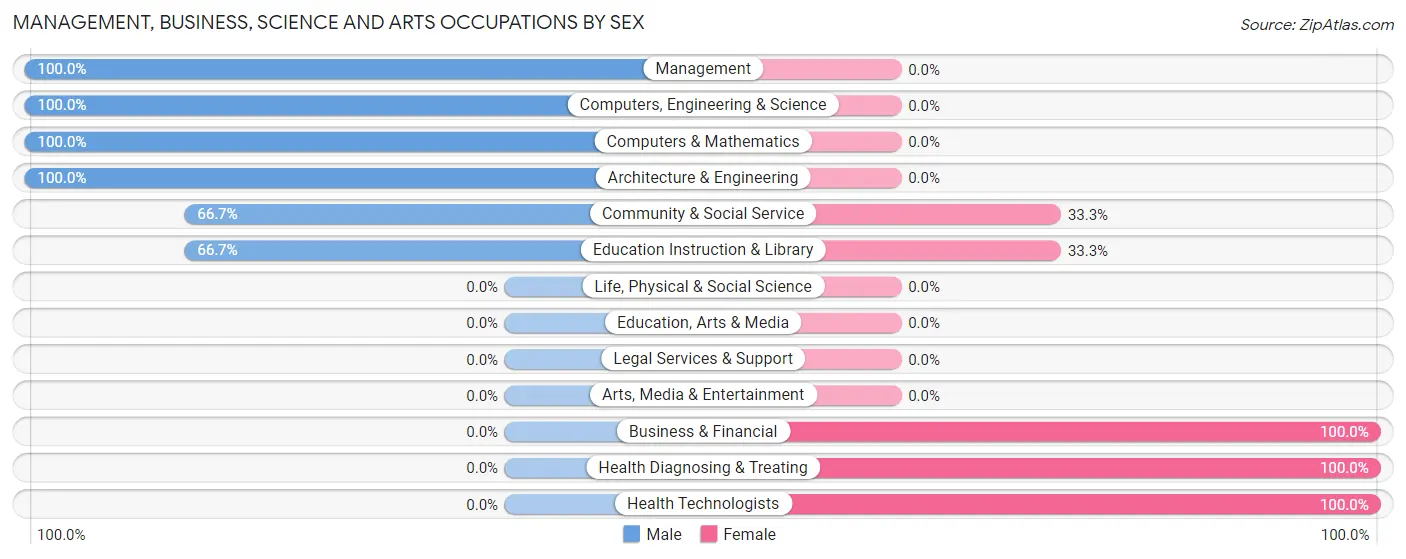
| Occupation | Male | Female |
| Management | 13 (100.0%) | 0 (0.0%) |
| Business & Financial | 0 (0.0%) | 2 (100.0%) |
| Computers, Engineering & Science | 7 (100.0%) | 0 (0.0%) |
| Computers & Mathematics | 6 (100.0%) | 0 (0.0%) |
| Architecture & Engineering | 1 (100.0%) | 0 (0.0%) |
| Life, Physical & Social Science | 0 (0.0%) | 0 (0.0%) |
| Community & Social Service | 2 (66.7%) | 1 (33.3%) |
| Education, Arts & Media | 0 (0.0%) | 0 (0.0%) |
| Legal Services & Support | 0 (0.0%) | 0 (0.0%) |
| Education Instruction & Library | 2 (66.7%) | 1 (33.3%) |
| Arts, Media & Entertainment | 0 (0.0%) | 0 (0.0%) |
| Health Diagnosing & Treating | 0 (0.0%) | 6 (100.0%) |
| Health Technologists | 0 (0.0%) | 6 (100.0%) |
| Total (Category) | 22 (71.0%) | 9 (29.0%) |
| Total (Overall) | 51 (68.0%) | 24 (32.0%) |
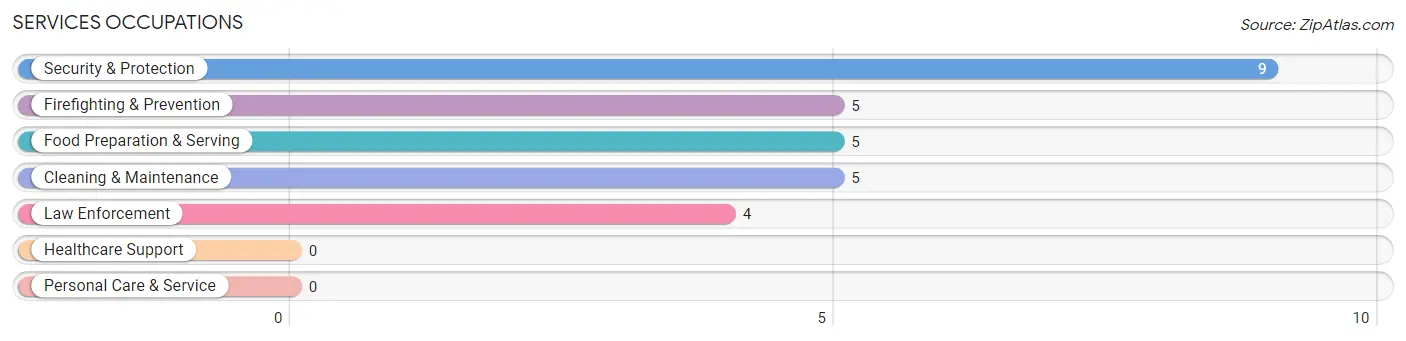
Services Occupations
The most common Services occupations in Fort Laramie are Security & Protection (9 | 12.0%), Firefighting & Prevention (5 | 6.7%), Food Preparation & Serving (5 | 6.7%), Cleaning & Maintenance (5 | 6.7%), and Law Enforcement (4 | 5.3%).
Services Occupations by Sex
Within the Services occupations in Fort Laramie, the most male-oriented occupations are Law Enforcement (100.0%), Security & Protection (66.7%), and Food Preparation & Serving (60.0%), while the most female-oriented occupations are Cleaning & Maintenance (80.0%), Firefighting & Prevention (60.0%), and Food Preparation & Serving (40.0%).
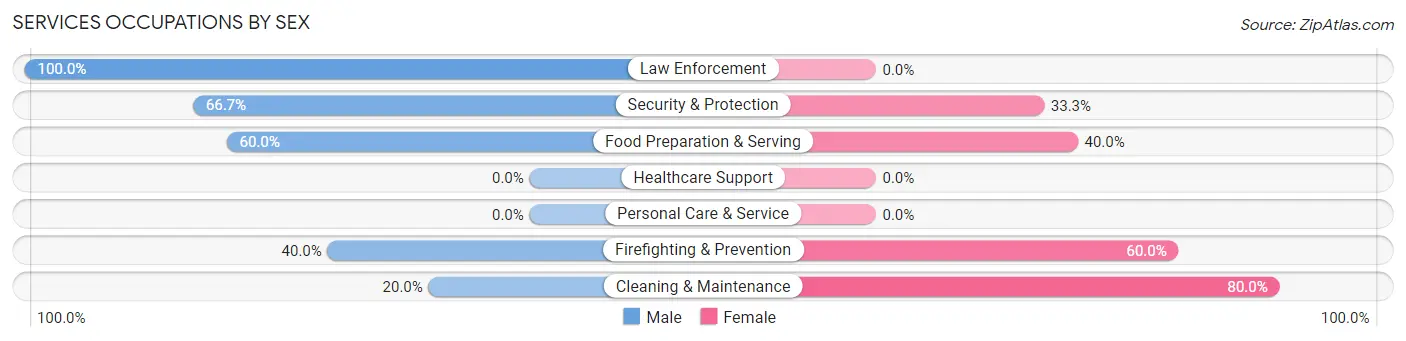
| Occupation | Male | Female |
| Healthcare Support | 0 (0.0%) | 0 (0.0%) |
| Security & Protection | 6 (66.7%) | 3 (33.3%) |
| Firefighting & Prevention | 2 (40.0%) | 3 (60.0%) |
| Law Enforcement | 4 (100.0%) | 0 (0.0%) |
| Food Preparation & Serving | 3 (60.0%) | 2 (40.0%) |
| Cleaning & Maintenance | 1 (20.0%) | 4 (80.0%) |
| Personal Care & Service | 0 (0.0%) | 0 (0.0%) |
| Total (Category) | 10 (52.6%) | 9 (47.4%) |
| Total (Overall) | 51 (68.0%) | 24 (32.0%) |
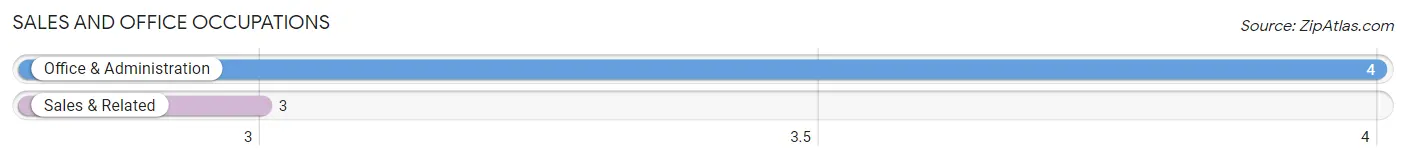
Sales and Office Occupations
The most common Sales and Office occupations in Fort Laramie are Office & Administration (4 | 5.3%), and Sales & Related (3 | 4.0%).
Sales and Office Occupations by Sex
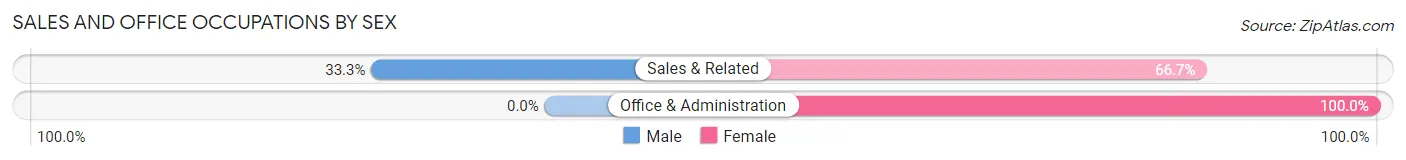
| Occupation | Male | Female |
| Sales & Related | 1 (33.3%) | 2 (66.7%) |
| Office & Administration | 0 (0.0%) | 4 (100.0%) |
| Total (Category) | 1 (14.3%) | 6 (85.7%) |
| Total (Overall) | 51 (68.0%) | 24 (32.0%) |
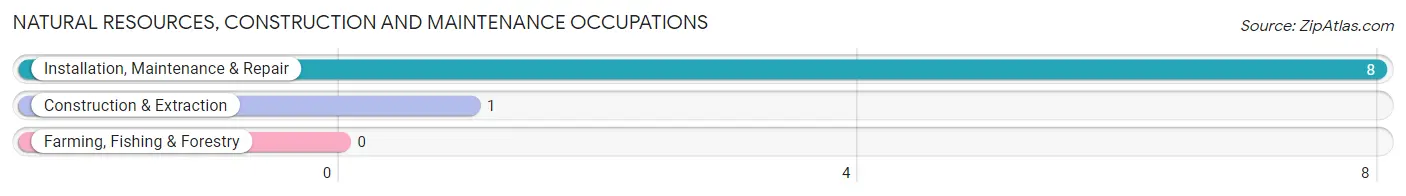
Natural Resources, Construction and Maintenance Occupations
The most common Natural Resources, Construction and Maintenance occupations in Fort Laramie are Installation, Maintenance & Repair (8 | 10.7%), and Construction & Extraction (1 | 1.3%).
Natural Resources, Construction and Maintenance Occupations by Sex
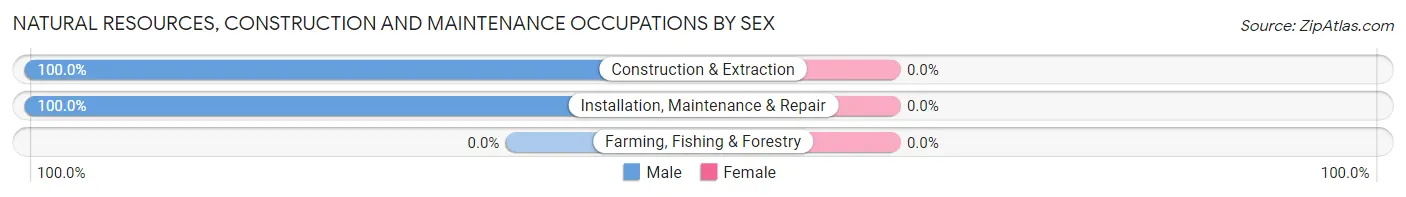
| Occupation | Male | Female |
| Farming, Fishing & Forestry | 0 (0.0%) | 0 (0.0%) |
| Construction & Extraction | 1 (100.0%) | 0 (0.0%) |
| Installation, Maintenance & Repair | 8 (100.0%) | 0 (0.0%) |
| Total (Category) | 9 (100.0%) | 0 (0.0%) |
| Total (Overall) | 51 (68.0%) | 24 (32.0%) |
Production, Transportation and Moving Occupations
The most common Production, Transportation and Moving occupations in Fort Laramie are Production (8 | 10.7%), and Transportation (1 | 1.3%).
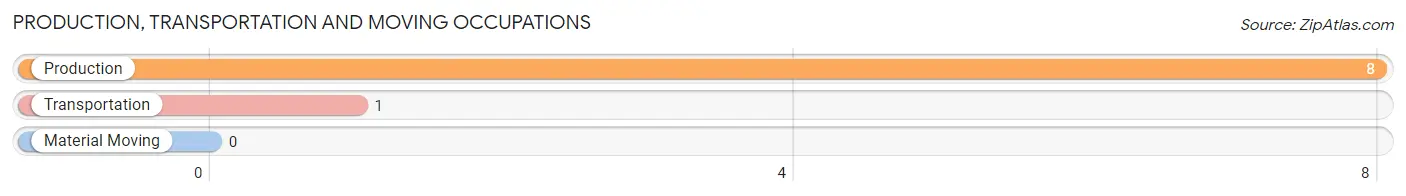
Production, Transportation and Moving Occupations by Sex
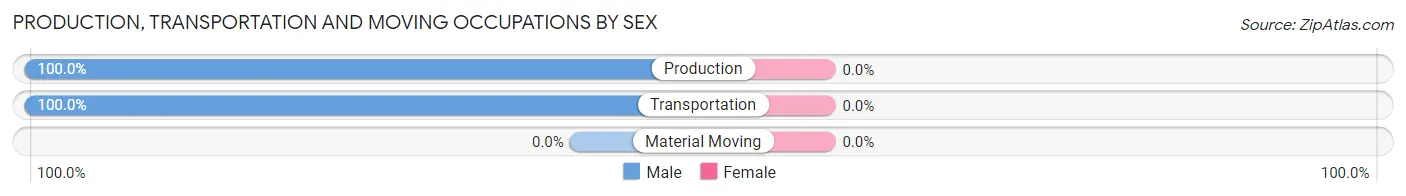
| Occupation | Male | Female |
| Production | 8 (100.0%) | 0 (0.0%) |
| Transportation | 1 (100.0%) | 0 (0.0%) |
| Material Moving | 0 (0.0%) | 0 (0.0%) |
| Total (Category) | 9 (100.0%) | 0 (0.0%) |
| Total (Overall) | 51 (68.0%) | 24 (32.0%) |
Employment Industries by Sex in Fort Laramie
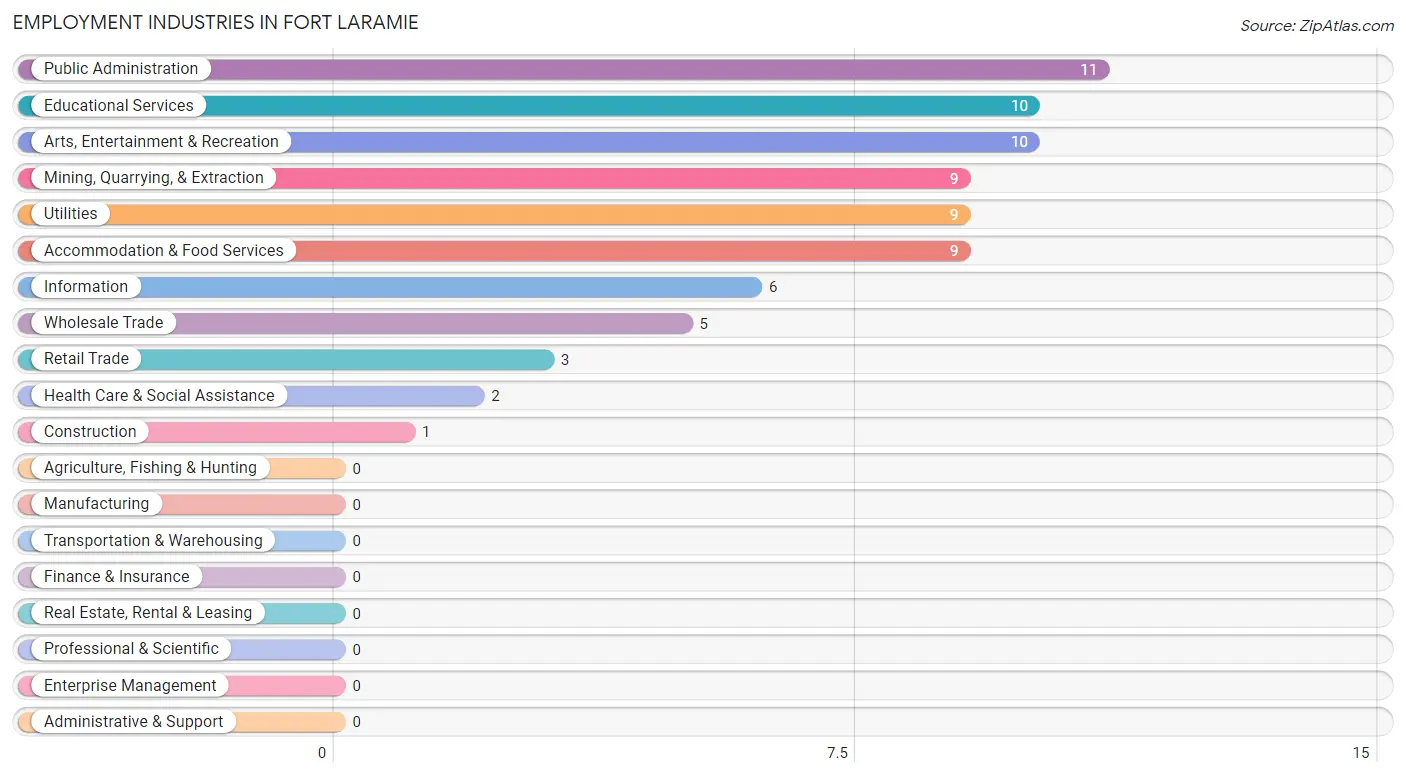
Employment Industries in Fort Laramie
The major employment industries in Fort Laramie include Public Administration (11 | 14.7%), Educational Services (10 | 13.3%), Arts, Entertainment & Recreation (10 | 13.3%), Mining, Quarrying, & Extraction (9 | 12.0%), and Utilities (9 | 12.0%).
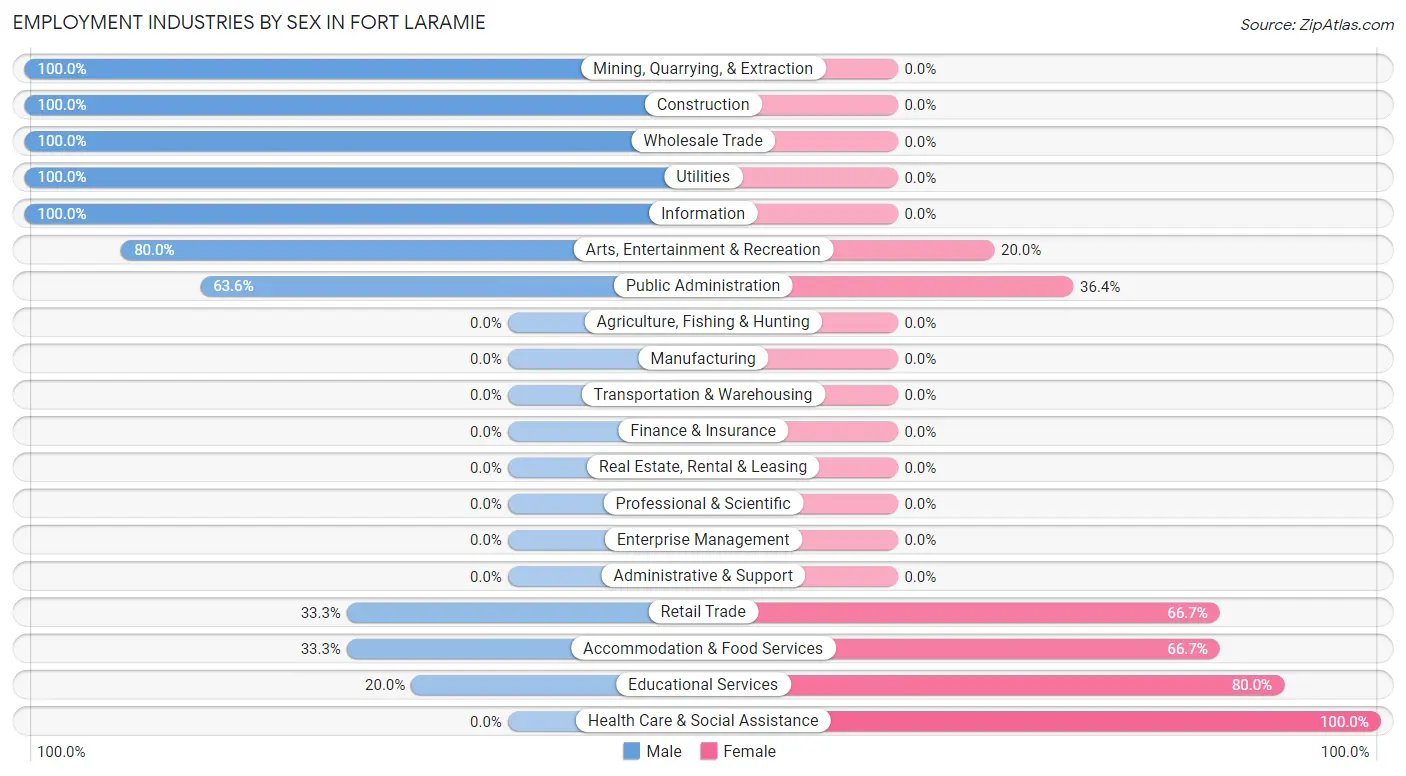
Employment Industries by Sex in Fort Laramie
The Fort Laramie industries that see more men than women are Mining, Quarrying, & Extraction (100.0%), Construction (100.0%), and Wholesale Trade (100.0%), whereas the industries that tend to have a higher number of women are Health Care & Social Assistance (100.0%), Educational Services (80.0%), and Retail Trade (66.7%).
| Industry | Male | Female |
| Agriculture, Fishing & Hunting | 0 (0.0%) | 0 (0.0%) |
| Mining, Quarrying, & Extraction | 9 (100.0%) | 0 (0.0%) |
| Construction | 1 (100.0%) | 0 (0.0%) |
| Manufacturing | 0 (0.0%) | 0 (0.0%) |
| Wholesale Trade | 5 (100.0%) | 0 (0.0%) |
| Retail Trade | 1 (33.3%) | 2 (66.7%) |
| Transportation & Warehousing | 0 (0.0%) | 0 (0.0%) |
| Utilities | 9 (100.0%) | 0 (0.0%) |
| Information | 6 (100.0%) | 0 (0.0%) |
| Finance & Insurance | 0 (0.0%) | 0 (0.0%) |
| Real Estate, Rental & Leasing | 0 (0.0%) | 0 (0.0%) |
| Professional & Scientific | 0 (0.0%) | 0 (0.0%) |
| Enterprise Management | 0 (0.0%) | 0 (0.0%) |
| Administrative & Support | 0 (0.0%) | 0 (0.0%) |
| Educational Services | 2 (20.0%) | 8 (80.0%) |
| Health Care & Social Assistance | 0 (0.0%) | 2 (100.0%) |
| Arts, Entertainment & Recreation | 8 (80.0%) | 2 (20.0%) |
| Accommodation & Food Services | 3 (33.3%) | 6 (66.7%) |
| Public Administration | 7 (63.6%) | 4 (36.4%) |
| Total | 51 (68.0%) | 24 (32.0%) |
Education in Fort Laramie
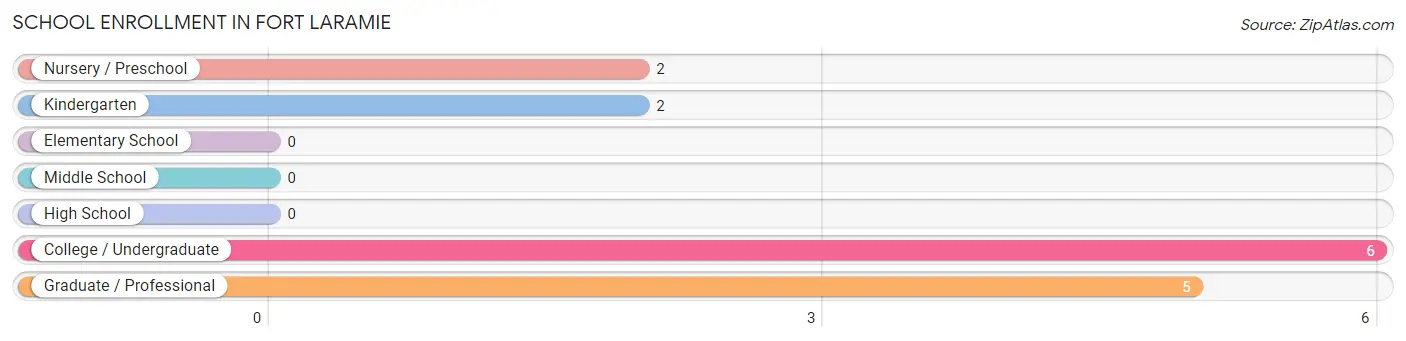
School Enrollment in Fort Laramie
The most common levels of schooling among the 15 students in Fort Laramie are college / undergraduate (6 | 40.0%), graduate / professional (5 | 33.3%), and nursery / preschool (2 | 13.3%).
| School Level | # Students | % Students |
| Nursery / Preschool | 2 | 13.3% |
| Kindergarten | 2 | 13.3% |
| Elementary School | 0 | 0.0% |
| Middle School | 0 | 0.0% |
| High School | 0 | 0.0% |
| College / Undergraduate | 6 | 40.0% |
| Graduate / Professional | 5 | 33.3% |
| Total | 15 | 100.0% |
School Enrollment by Age by Funding Source in Fort Laramie
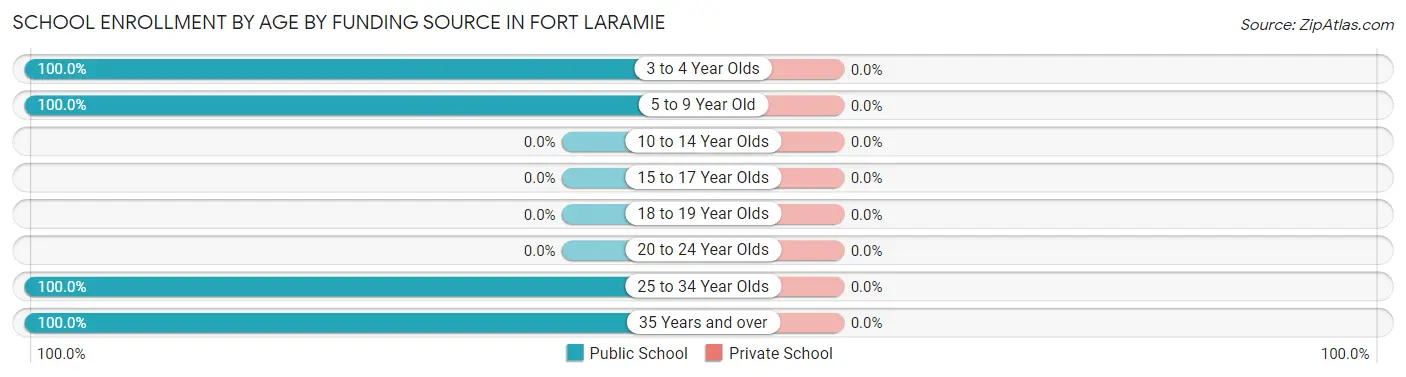
| Age Bracket | Public School | Private School |
| 3 to 4 Year Olds | 2 (100.0%) | 0 (0.0%) |
| 5 to 9 Year Old | 2 (100.0%) | 0 (0.0%) |
| 10 to 14 Year Olds | 0 (0.0%) | 0 (0.0%) |
| 15 to 17 Year Olds | 0 (0.0%) | 0 (0.0%) |
| 18 to 19 Year Olds | 0 (0.0%) | 0 (0.0%) |
| 20 to 24 Year Olds | 0 (0.0%) | 0 (0.0%) |
| 25 to 34 Year Olds | 9 (100.0%) | 0 (0.0%) |
| 35 Years and over | 2 (100.0%) | 0 (0.0%) |
| Total | 15 (100.0%) | 0 (0.0%) |
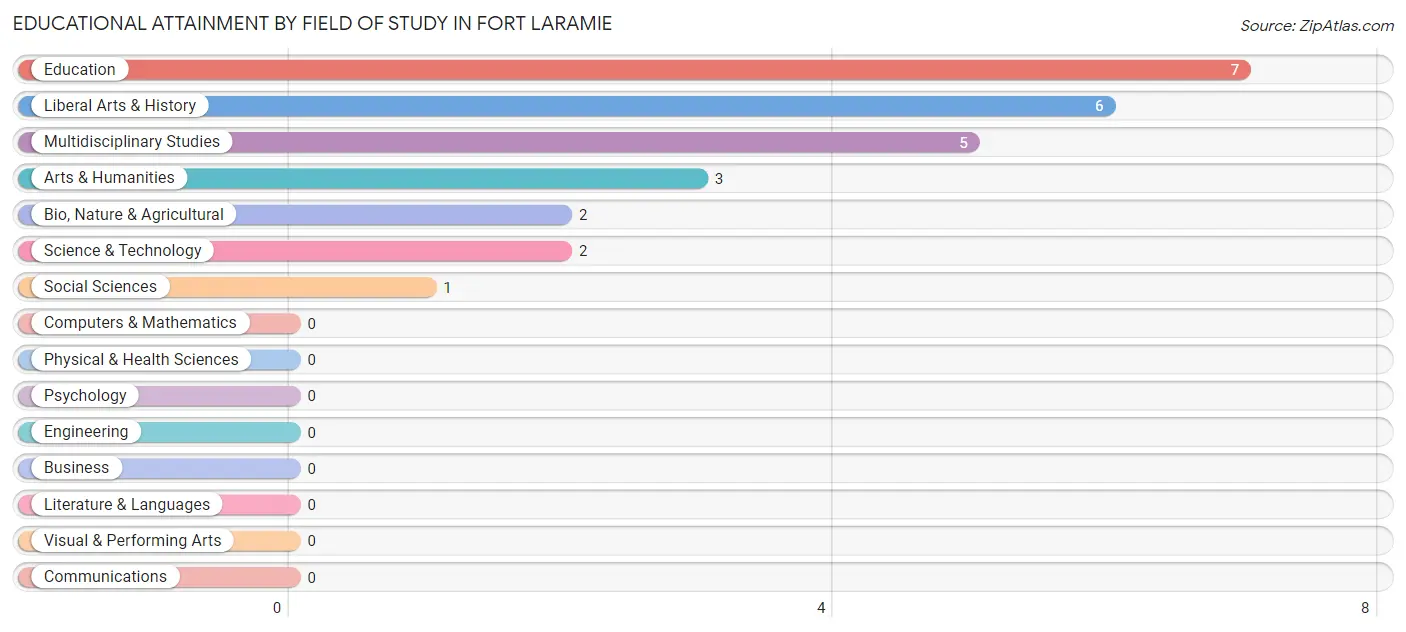
Educational Attainment by Field of Study in Fort Laramie
Education (7 | 26.9%), liberal arts & history (6 | 23.1%), multidisciplinary studies (5 | 19.2%), arts & humanities (3 | 11.5%), and bio, nature & agricultural (2 | 7.7%) are the most common fields of study among 26 individuals in Fort Laramie who have obtained a bachelor's degree or higher.
| Field of Study | # Graduates | % Graduates |
| Computers & Mathematics | 0 | 0.0% |
| Bio, Nature & Agricultural | 2 | 7.7% |
| Physical & Health Sciences | 0 | 0.0% |
| Psychology | 0 | 0.0% |
| Social Sciences | 1 | 3.8% |
| Engineering | 0 | 0.0% |
| Multidisciplinary Studies | 5 | 19.2% |
| Science & Technology | 2 | 7.7% |
| Business | 0 | 0.0% |
| Education | 7 | 26.9% |
| Literature & Languages | 0 | 0.0% |
| Liberal Arts & History | 6 | 23.1% |
| Visual & Performing Arts | 0 | 0.0% |
| Communications | 0 | 0.0% |
| Arts & Humanities | 3 | 11.5% |
| Total | 26 | 100.0% |
Transportation & Commute in Fort Laramie
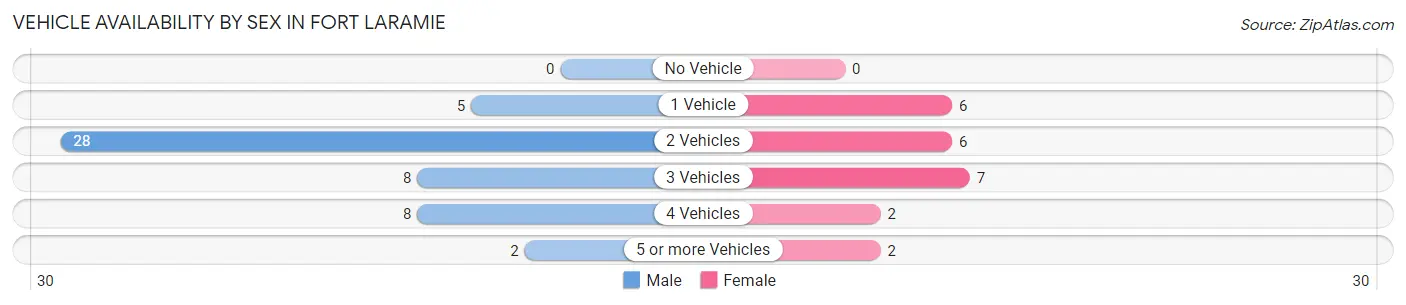
Vehicle Availability by Sex in Fort Laramie
The most prevalent vehicle ownership categories in Fort Laramie are males with 2 vehicles (28, accounting for 54.9%) and females with 2 vehicles (6, making up 121.7%).
| Vehicles Available | Male | Female |
| No Vehicle | 0 (0.0%) | 0 (0.0%) |
| 1 Vehicle | 5 (9.8%) | 6 (26.1%) |
| 2 Vehicles | 28 (54.9%) | 6 (26.1%) |
| 3 Vehicles | 8 (15.7%) | 7 (30.4%) |
| 4 Vehicles | 8 (15.7%) | 2 (8.7%) |
| 5 or more Vehicles | 2 (3.9%) | 2 (8.7%) |
| Total | 51 (100.0%) | 23 (100.0%) |
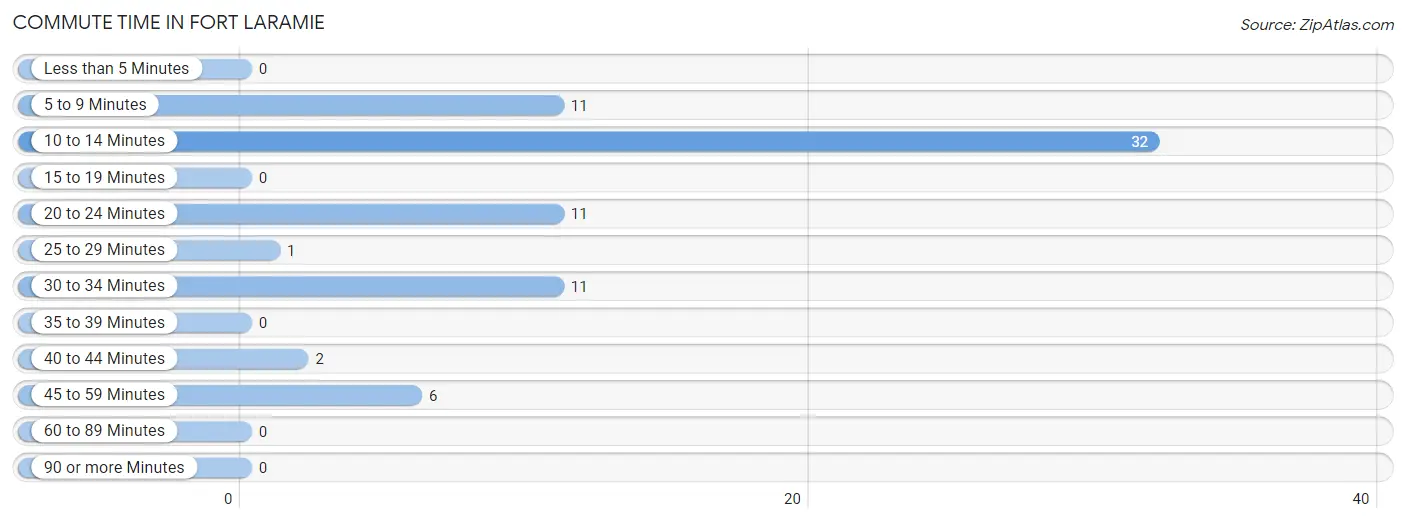
Commute Time in Fort Laramie
The most frequently occuring commute durations in Fort Laramie are 10 to 14 minutes (32 commuters, 43.2%), 5 to 9 minutes (11 commuters, 14.9%), and 20 to 24 minutes (11 commuters, 14.9%).
| Commute Time | # Commuters | % Commuters |
| Less than 5 Minutes | 0 | 0.0% |
| 5 to 9 Minutes | 11 | 14.9% |
| 10 to 14 Minutes | 32 | 43.2% |
| 15 to 19 Minutes | 0 | 0.0% |
| 20 to 24 Minutes | 11 | 14.9% |
| 25 to 29 Minutes | 1 | 1.3% |
| 30 to 34 Minutes | 11 | 14.9% |
| 35 to 39 Minutes | 0 | 0.0% |
| 40 to 44 Minutes | 2 | 2.7% |
| 45 to 59 Minutes | 6 | 8.1% |
| 60 to 89 Minutes | 0 | 0.0% |
| 90 or more Minutes | 0 | 0.0% |
Commute Time by Sex in Fort Laramie
The most common commute times in Fort Laramie are 10 to 14 minutes (24 commuters, 47.1%) for males and 30 to 34 minutes (9 commuters, 39.1%) for females.
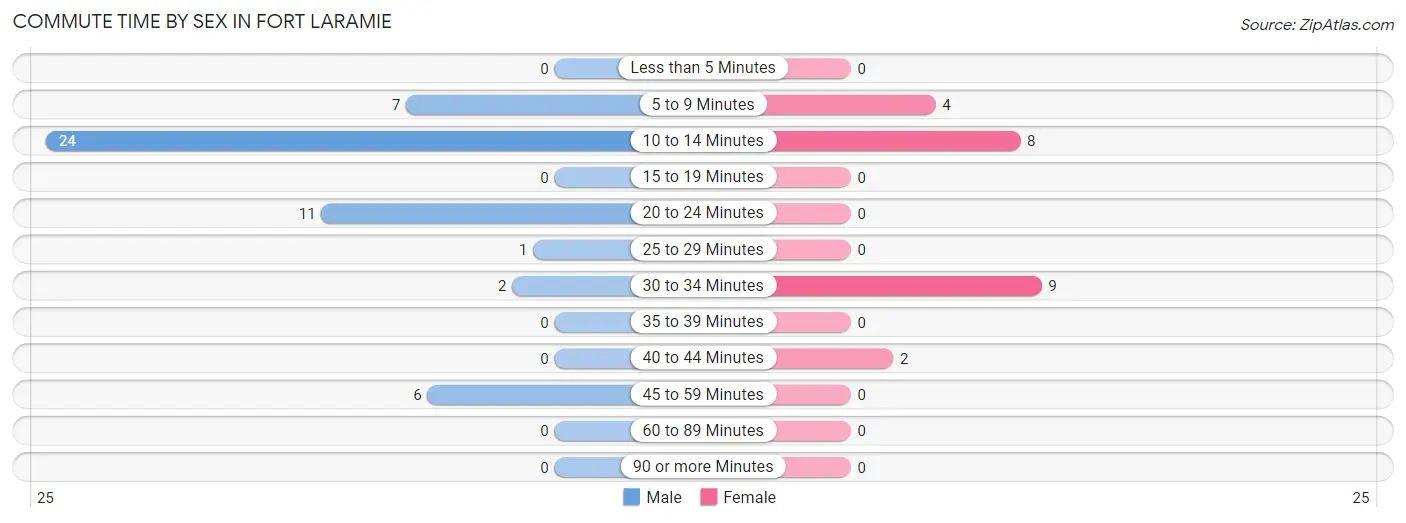
| Commute Time | Male | Female |
| Less than 5 Minutes | 0 (0.0%) | 0 (0.0%) |
| 5 to 9 Minutes | 7 (13.7%) | 4 (17.4%) |
| 10 to 14 Minutes | 24 (47.1%) | 8 (34.8%) |
| 15 to 19 Minutes | 0 (0.0%) | 0 (0.0%) |
| 20 to 24 Minutes | 11 (21.6%) | 0 (0.0%) |
| 25 to 29 Minutes | 1 (2.0%) | 0 (0.0%) |
| 30 to 34 Minutes | 2 (3.9%) | 9 (39.1%) |
| 35 to 39 Minutes | 0 (0.0%) | 0 (0.0%) |
| 40 to 44 Minutes | 0 (0.0%) | 2 (8.7%) |
| 45 to 59 Minutes | 6 (11.8%) | 0 (0.0%) |
| 60 to 89 Minutes | 0 (0.0%) | 0 (0.0%) |
| 90 or more Minutes | 0 (0.0%) | 0 (0.0%) |
Time of Departure to Work by Sex in Fort Laramie
The most frequent times of departure to work in Fort Laramie are 6:00 AM to 6:29 AM (15, 29.4%) for males and 7:00 AM to 7:29 AM (10, 43.5%) for females.
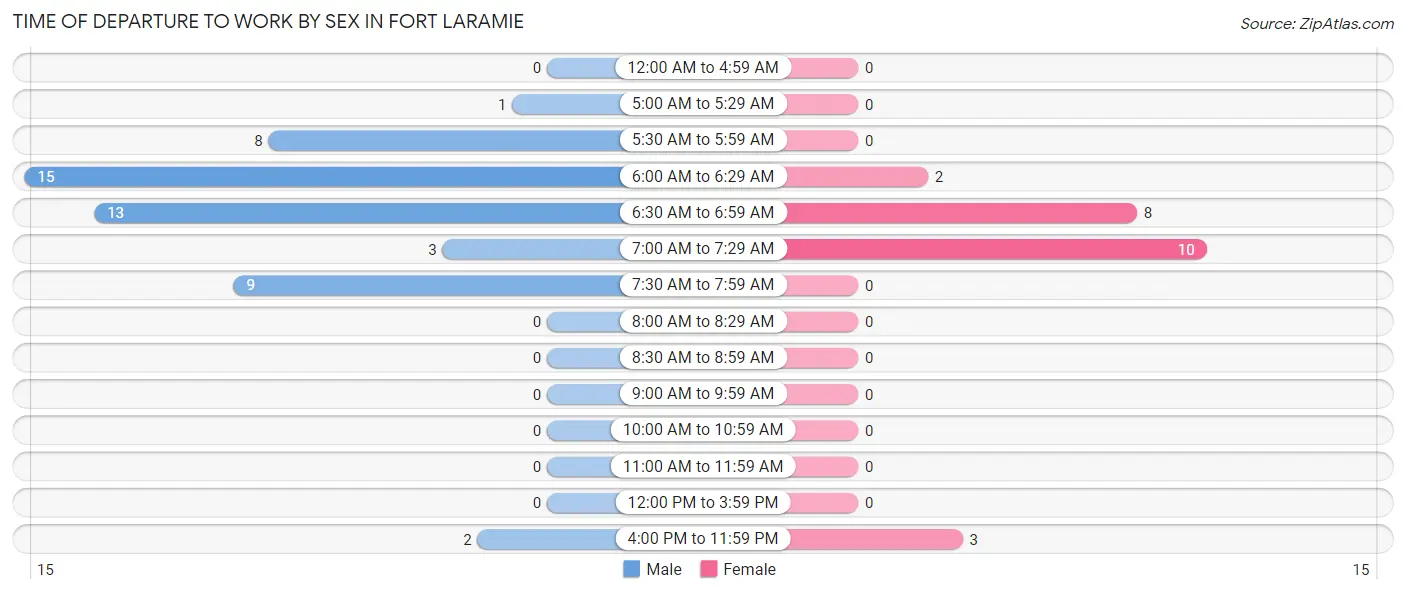
| Time of Departure | Male | Female |
| 12:00 AM to 4:59 AM | 0 (0.0%) | 0 (0.0%) |
| 5:00 AM to 5:29 AM | 1 (2.0%) | 0 (0.0%) |
| 5:30 AM to 5:59 AM | 8 (15.7%) | 0 (0.0%) |
| 6:00 AM to 6:29 AM | 15 (29.4%) | 2 (8.7%) |
| 6:30 AM to 6:59 AM | 13 (25.5%) | 8 (34.8%) |
| 7:00 AM to 7:29 AM | 3 (5.9%) | 10 (43.5%) |
| 7:30 AM to 7:59 AM | 9 (17.6%) | 0 (0.0%) |
| 8:00 AM to 8:29 AM | 0 (0.0%) | 0 (0.0%) |
| 8:30 AM to 8:59 AM | 0 (0.0%) | 0 (0.0%) |
| 9:00 AM to 9:59 AM | 0 (0.0%) | 0 (0.0%) |
| 10:00 AM to 10:59 AM | 0 (0.0%) | 0 (0.0%) |
| 11:00 AM to 11:59 AM | 0 (0.0%) | 0 (0.0%) |
| 12:00 PM to 3:59 PM | 0 (0.0%) | 0 (0.0%) |
| 4:00 PM to 11:59 PM | 2 (3.9%) | 3 (13.0%) |
| Total | 51 (100.0%) | 23 (100.0%) |
Housing Occupancy in Fort Laramie
Occupancy by Ownership in Fort Laramie
Of the total 87 dwellings in Fort Laramie, owner-occupied units account for 66 (75.9%), while renter-occupied units make up 21 (24.1%).
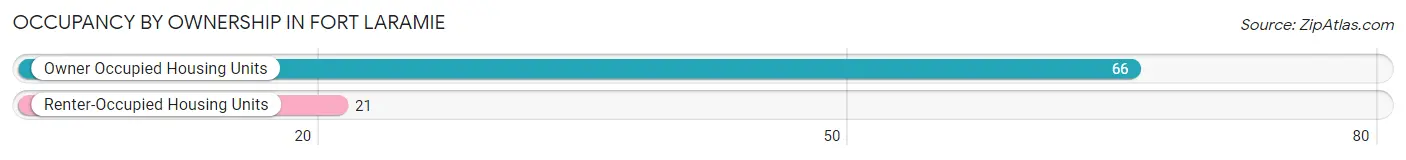
| Occupancy | # Housing Units | % Housing Units |
| Owner Occupied Housing Units | 66 | 75.9% |
| Renter-Occupied Housing Units | 21 | 24.1% |
| Total Occupied Housing Units | 87 | 100.0% |
Occupancy by Household Size in Fort Laramie
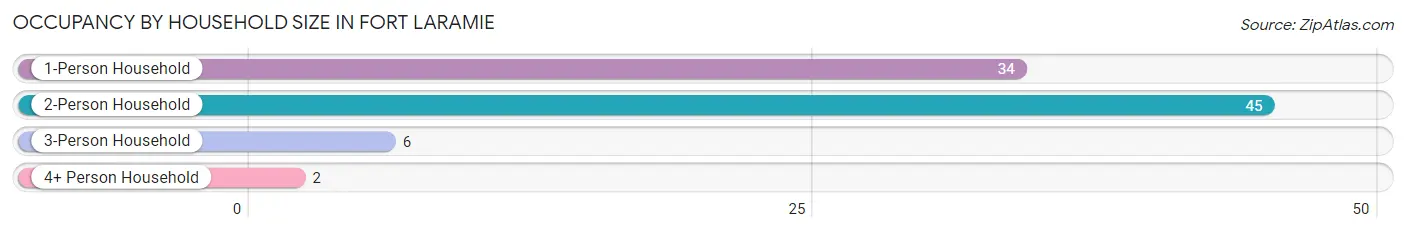
| Household Size | # Housing Units | % Housing Units |
| 1-Person Household | 34 | 39.1% |
| 2-Person Household | 45 | 51.7% |
| 3-Person Household | 6 | 6.9% |
| 4+ Person Household | 2 | 2.3% |
| Total Housing Units | 87 | 100.0% |
Occupancy by Ownership by Household Size in Fort Laramie
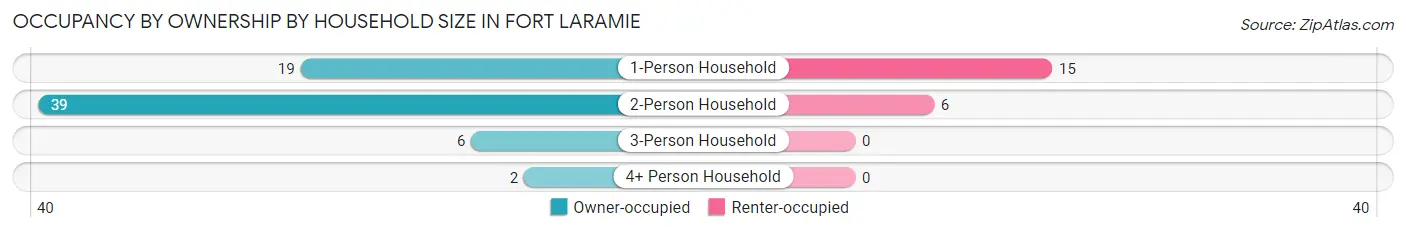
| Household Size | Owner-occupied | Renter-occupied |
| 1-Person Household | 19 (55.9%) | 15 (44.1%) |
| 2-Person Household | 39 (86.7%) | 6 (13.3%) |
| 3-Person Household | 6 (100.0%) | 0 (0.0%) |
| 4+ Person Household | 2 (100.0%) | 0 (0.0%) |
| Total Housing Units | 66 (75.9%) | 21 (24.1%) |
Occupancy by Educational Attainment in Fort Laramie
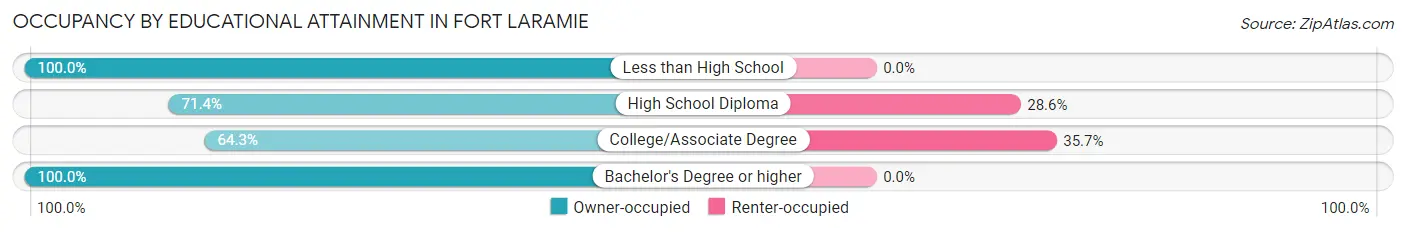
| Household Size | Owner-occupied | Renter-occupied |
| Less than High School | 1 (100.0%) | 0 (0.0%) |
| High School Diploma | 15 (71.4%) | 6 (28.6%) |
| College/Associate Degree | 27 (64.3%) | 15 (35.7%) |
| Bachelor's Degree or higher | 23 (100.0%) | 0 (0.0%) |
Occupancy by Age of Householder in Fort Laramie
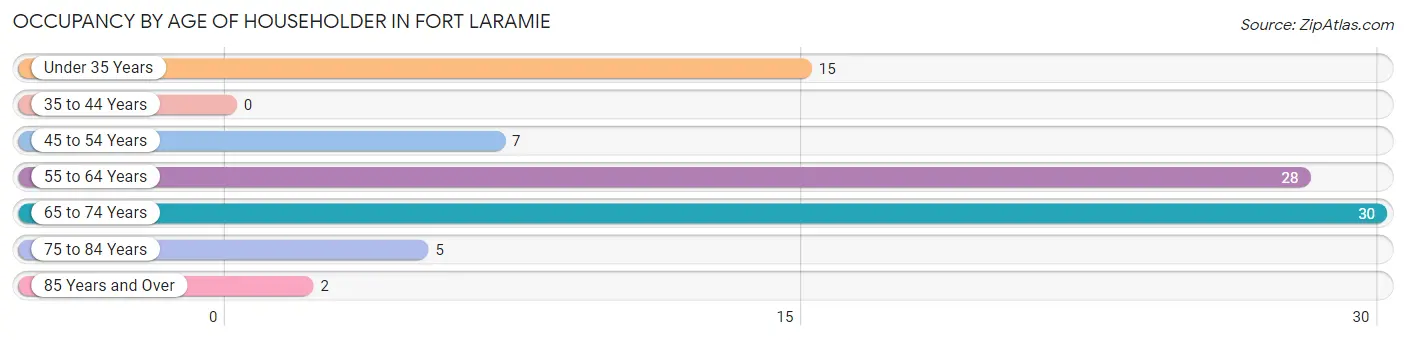
| Age Bracket | # Households | % Households |
| Under 35 Years | 15 | 17.2% |
| 35 to 44 Years | 0 | 0.0% |
| 45 to 54 Years | 7 | 8.1% |
| 55 to 64 Years | 28 | 32.2% |
| 65 to 74 Years | 30 | 34.5% |
| 75 to 84 Years | 5 | 5.8% |
| 85 Years and Over | 2 | 2.3% |
| Total | 87 | 100.0% |
Housing Finances in Fort Laramie
Median Income by Occupancy in Fort Laramie
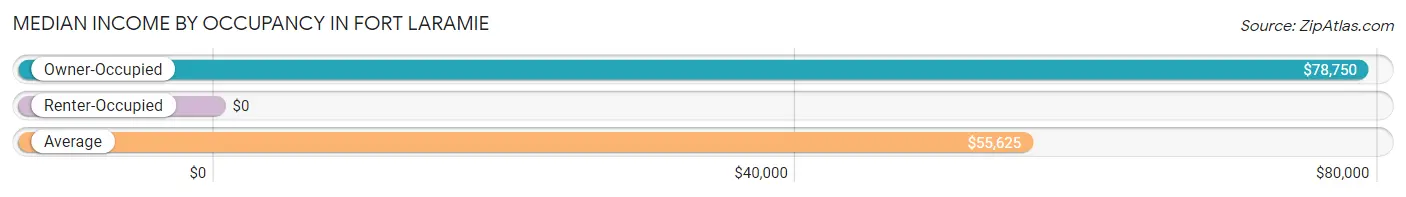
| Occupancy Type | # Households | Median Income |
| Owner-Occupied | 66 (75.9%) | $78,750 |
| Renter-Occupied | 21 (24.1%) | $0 |
| Average | 87 (100.0%) | $55,625 |
Occupancy by Householder Income Bracket in Fort Laramie
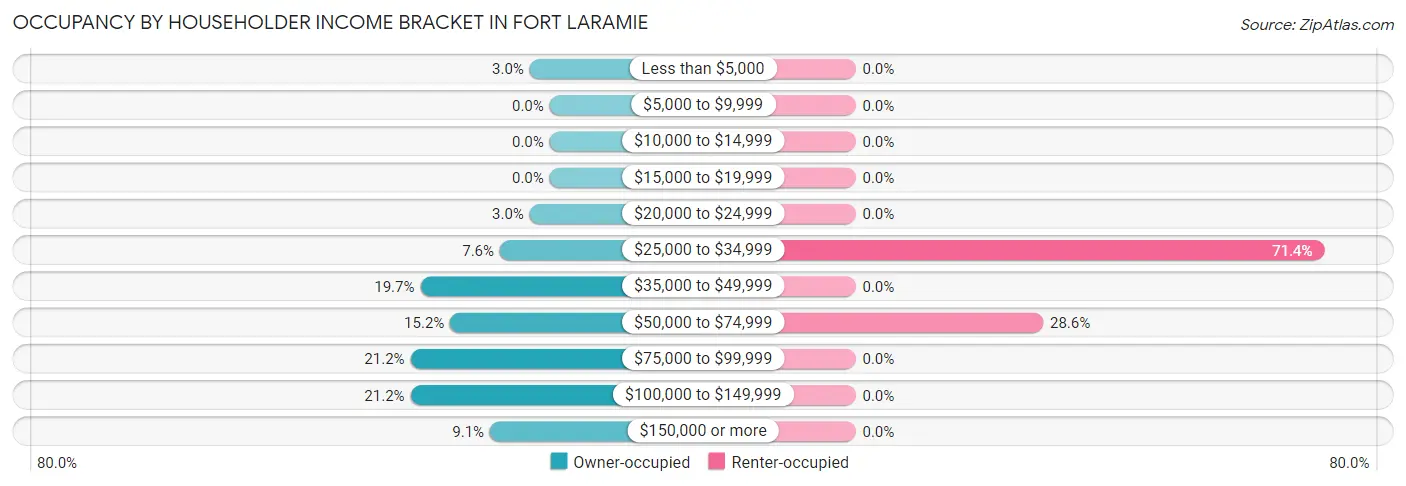
| Income Bracket | Owner-occupied | Renter-occupied |
| Less than $5,000 | 2 (3.0%) | 0 (0.0%) |
| $5,000 to $9,999 | 0 (0.0%) | 0 (0.0%) |
| $10,000 to $14,999 | 0 (0.0%) | 0 (0.0%) |
| $15,000 to $19,999 | 0 (0.0%) | 0 (0.0%) |
| $20,000 to $24,999 | 2 (3.0%) | 0 (0.0%) |
| $25,000 to $34,999 | 5 (7.6%) | 15 (71.4%) |
| $35,000 to $49,999 | 13 (19.7%) | 0 (0.0%) |
| $50,000 to $74,999 | 10 (15.1%) | 6 (28.6%) |
| $75,000 to $99,999 | 14 (21.2%) | 0 (0.0%) |
| $100,000 to $149,999 | 14 (21.2%) | 0 (0.0%) |
| $150,000 or more | 6 (9.1%) | 0 (0.0%) |
| Total | 66 (100.0%) | 21 (100.0%) |
Monthly Housing Cost Tiers in Fort Laramie
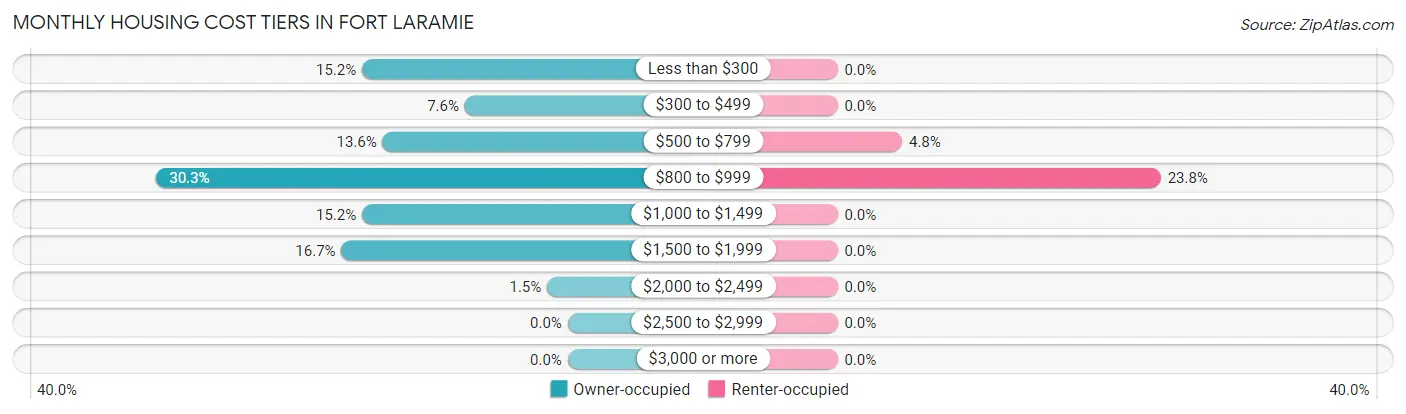
| Monthly Cost | Owner-occupied | Renter-occupied |
| Less than $300 | 10 (15.1%) | 0 (0.0%) |
| $300 to $499 | 5 (7.6%) | 0 (0.0%) |
| $500 to $799 | 9 (13.6%) | 1 (4.8%) |
| $800 to $999 | 20 (30.3%) | 5 (23.8%) |
| $1,000 to $1,499 | 10 (15.1%) | 0 (0.0%) |
| $1,500 to $1,999 | 11 (16.7%) | 0 (0.0%) |
| $2,000 to $2,499 | 1 (1.5%) | 0 (0.0%) |
| $2,500 to $2,999 | 0 (0.0%) | 0 (0.0%) |
| $3,000 or more | 0 (0.0%) | 0 (0.0%) |
| Total | 66 (100.0%) | 21 (100.0%) |
Physical Housing Characteristics in Fort Laramie
Housing Structures in Fort Laramie
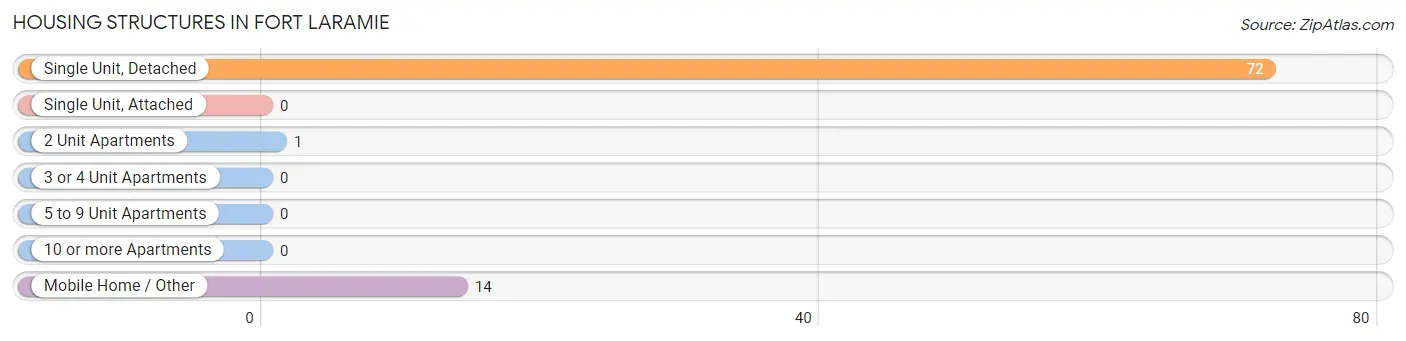
| Structure Type | # Housing Units | % Housing Units |
| Single Unit, Detached | 72 | 82.8% |
| Single Unit, Attached | 0 | 0.0% |
| 2 Unit Apartments | 1 | 1.1% |
| 3 or 4 Unit Apartments | 0 | 0.0% |
| 5 to 9 Unit Apartments | 0 | 0.0% |
| 10 or more Apartments | 0 | 0.0% |
| Mobile Home / Other | 14 | 16.1% |
| Total | 87 | 100.0% |
Housing Structures by Occupancy in Fort Laramie
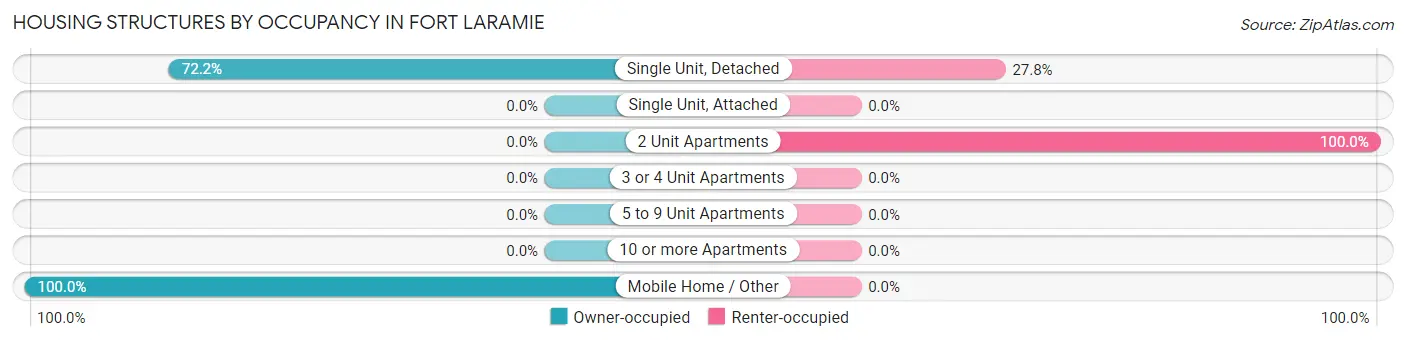
| Structure Type | Owner-occupied | Renter-occupied |
| Single Unit, Detached | 52 (72.2%) | 20 (27.8%) |
| Single Unit, Attached | 0 (0.0%) | 0 (0.0%) |
| 2 Unit Apartments | 0 (0.0%) | 1 (100.0%) |
| 3 or 4 Unit Apartments | 0 (0.0%) | 0 (0.0%) |
| 5 to 9 Unit Apartments | 0 (0.0%) | 0 (0.0%) |
| 10 or more Apartments | 0 (0.0%) | 0 (0.0%) |
| Mobile Home / Other | 14 (100.0%) | 0 (0.0%) |
| Total | 66 (75.9%) | 21 (24.1%) |
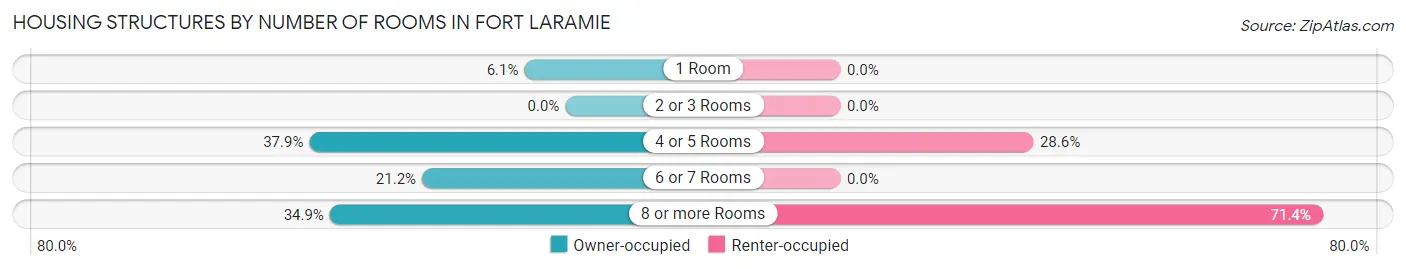
Housing Structures by Number of Rooms in Fort Laramie
| Number of Rooms | Owner-occupied | Renter-occupied |
| 1 Room | 4 (6.1%) | 0 (0.0%) |
| 2 or 3 Rooms | 0 (0.0%) | 0 (0.0%) |
| 4 or 5 Rooms | 25 (37.9%) | 6 (28.6%) |
| 6 or 7 Rooms | 14 (21.2%) | 0 (0.0%) |
| 8 or more Rooms | 23 (34.8%) | 15 (71.4%) |
| Total | 66 (100.0%) | 21 (100.0%) |
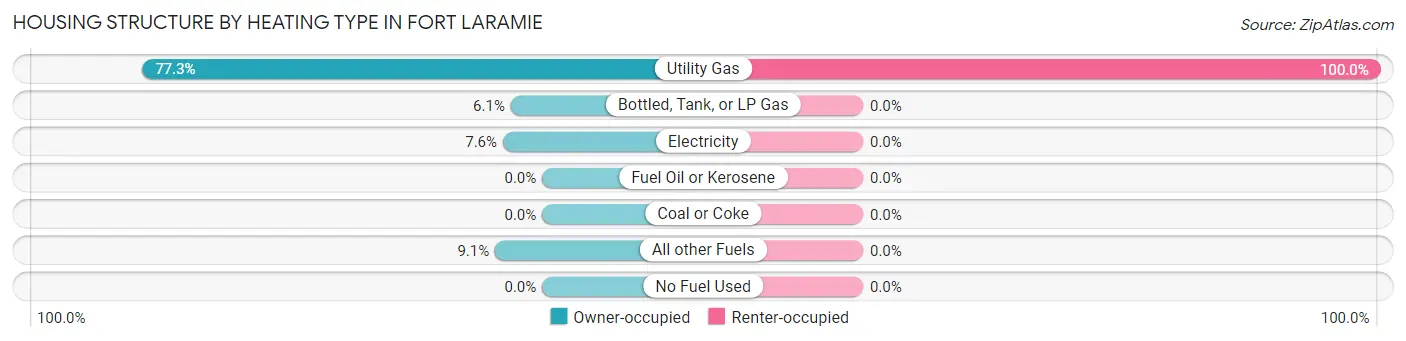
Housing Structure by Heating Type in Fort Laramie
| Heating Type | Owner-occupied | Renter-occupied |
| Utility Gas | 51 (77.3%) | 21 (100.0%) |
| Bottled, Tank, or LP Gas | 4 (6.1%) | 0 (0.0%) |
| Electricity | 5 (7.6%) | 0 (0.0%) |
| Fuel Oil or Kerosene | 0 (0.0%) | 0 (0.0%) |
| Coal or Coke | 0 (0.0%) | 0 (0.0%) |
| All other Fuels | 6 (9.1%) | 0 (0.0%) |
| No Fuel Used | 0 (0.0%) | 0 (0.0%) |
| Total | 66 (100.0%) | 21 (100.0%) |
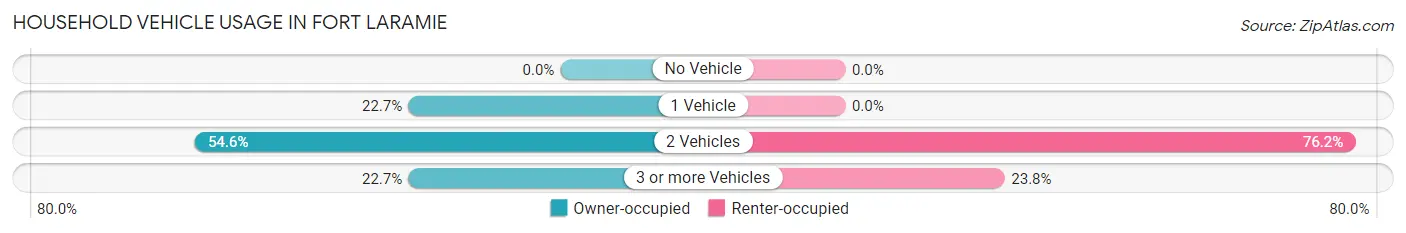
Household Vehicle Usage in Fort Laramie
| Vehicles per Household | Owner-occupied | Renter-occupied |
| No Vehicle | 0 (0.0%) | 0 (0.0%) |
| 1 Vehicle | 15 (22.7%) | 0 (0.0%) |
| 2 Vehicles | 36 (54.5%) | 16 (76.2%) |
| 3 or more Vehicles | 15 (22.7%) | 5 (23.8%) |
| Total | 66 (100.0%) | 21 (100.0%) |
Real Estate & Mortgages in Fort Laramie
Real Estate and Mortgage Overview in Fort Laramie
| Characteristic | Without Mortgage | With Mortgage |
| Housing Units | 18 | 48 |
| Median Property Value | $112,500 | $120,000 |
| Median Household Income | $48,750 | $4 |
| Monthly Housing Costs | $283 | $0 |
| Real Estate Taxes | - | - |
Property Value by Mortgage Status in Fort Laramie
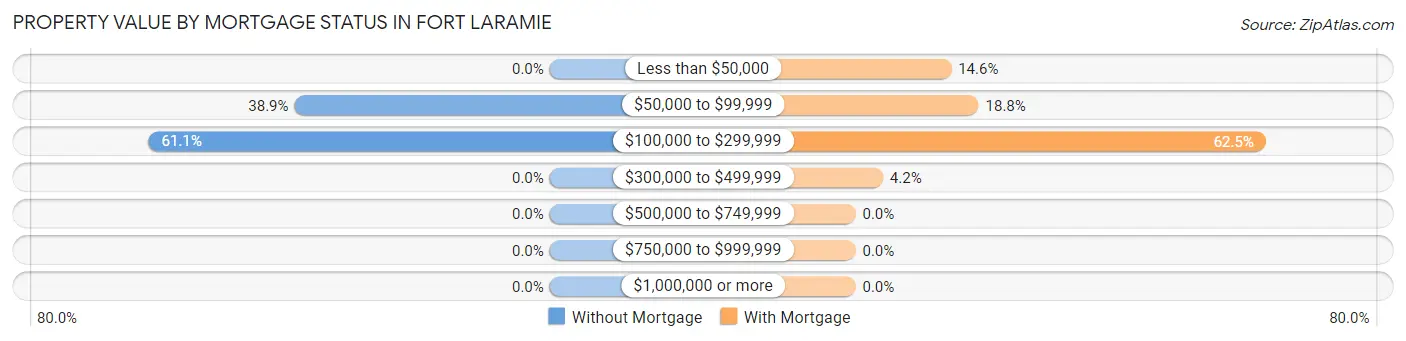
| Property Value | Without Mortgage | With Mortgage |
| Less than $50,000 | 0 (0.0%) | 7 (14.6%) |
| $50,000 to $99,999 | 7 (38.9%) | 9 (18.8%) |
| $100,000 to $299,999 | 11 (61.1%) | 30 (62.5%) |
| $300,000 to $499,999 | 0 (0.0%) | 2 (4.2%) |
| $500,000 to $749,999 | 0 (0.0%) | 0 (0.0%) |
| $750,000 to $999,999 | 0 (0.0%) | 0 (0.0%) |
| $1,000,000 or more | 0 (0.0%) | 0 (0.0%) |
| Total | 18 (100.0%) | 48 (100.0%) |
Household Income by Mortgage Status in Fort Laramie
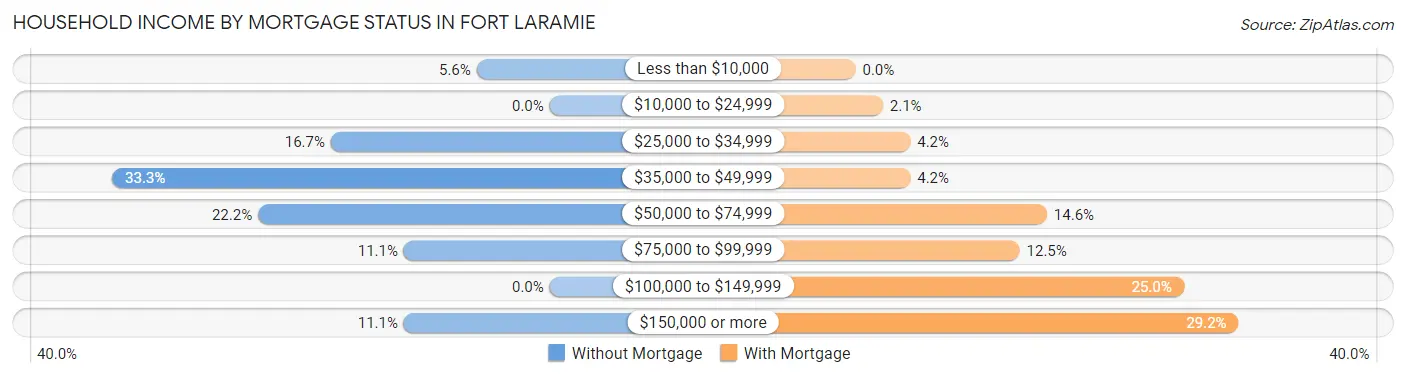
| Household Income | Without Mortgage | With Mortgage |
| Less than $10,000 | 1 (5.6%) | 0 (0.0%) |
| $10,000 to $24,999 | 0 (0.0%) | 1 (2.1%) |
| $25,000 to $34,999 | 3 (16.7%) | 2 (4.2%) |
| $35,000 to $49,999 | 6 (33.3%) | 2 (4.2%) |
| $50,000 to $74,999 | 4 (22.2%) | 7 (14.6%) |
| $75,000 to $99,999 | 2 (11.1%) | 6 (12.5%) |
| $100,000 to $149,999 | 0 (0.0%) | 12 (25.0%) |
| $150,000 or more | 2 (11.1%) | 14 (29.2%) |
| Total | 18 (100.0%) | 48 (100.0%) |
Property Value to Household Income Ratio in Fort Laramie
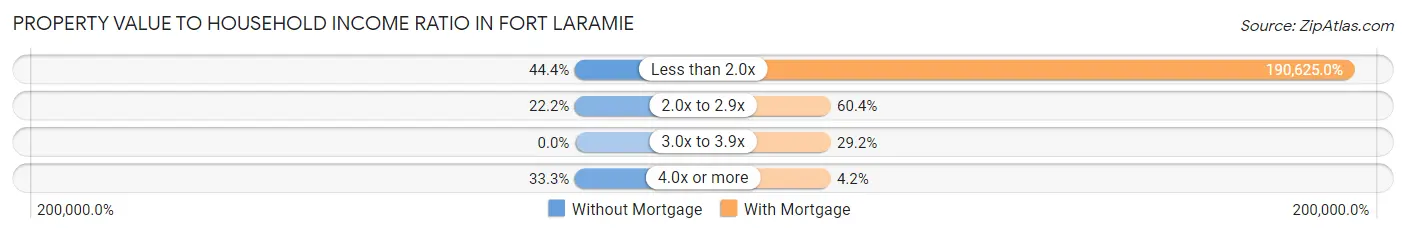
| Value-to-Income Ratio | Without Mortgage | With Mortgage |
| Less than 2.0x | 8 (44.4%) | 91,500 (190,625.0%) |
| 2.0x to 2.9x | 4 (22.2%) | 29 (60.4%) |
| 3.0x to 3.9x | 0 (0.0%) | 14 (29.2%) |
| 4.0x or more | 6 (33.3%) | 2 (4.2%) |
| Total | 18 (100.0%) | 48 (100.0%) |
Real Estate Taxes by Mortgage Status in Fort Laramie
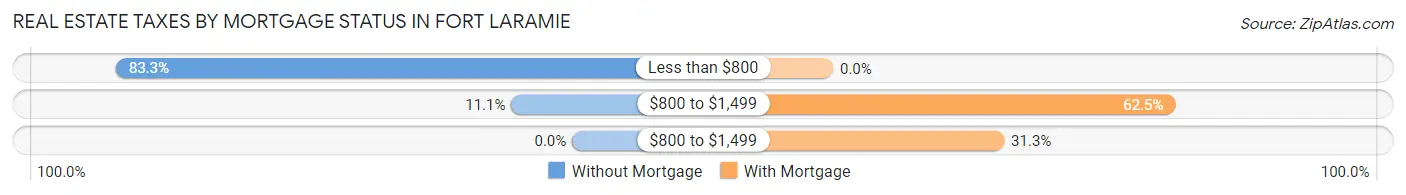
| Property Taxes | Without Mortgage | With Mortgage |
| Less than $800 | 15 (83.3%) | 0 (0.0%) |
| $800 to $1,499 | 2 (11.1%) | 30 (62.5%) |
| $800 to $1,499 | 0 (0.0%) | 15 (31.2%) |
| Total | 18 (100.0%) | 48 (100.0%) |
Health & Disability in Fort Laramie
Health Insurance Coverage by Age in Fort Laramie
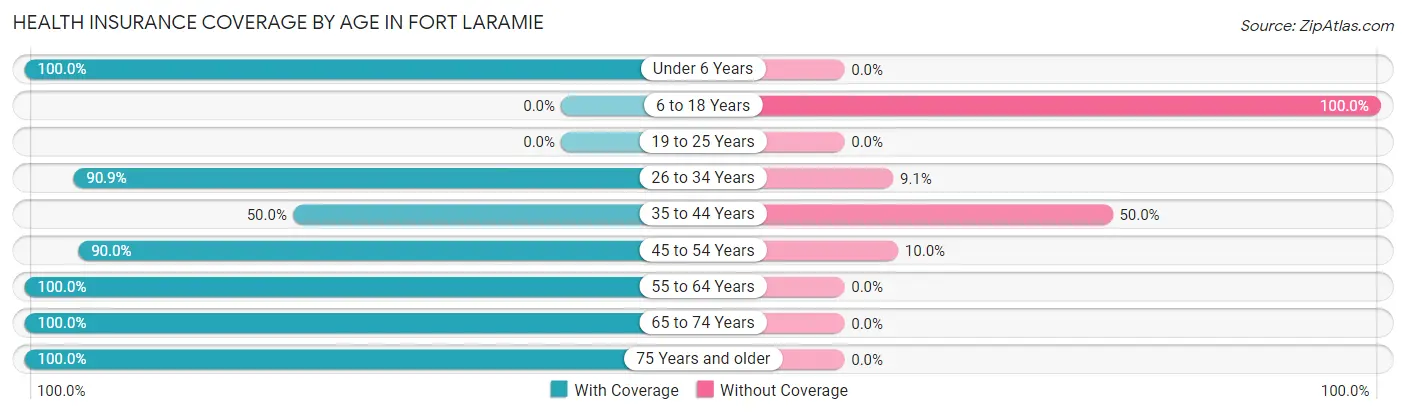
| Age Bracket | With Coverage | Without Coverage |
| Under 6 Years | 9 (100.0%) | 0 (0.0%) |
| 6 to 18 Years | 0 (0.0%) | 2 (100.0%) |
| 19 to 25 Years | 0 (0.0%) | 0 (0.0%) |
| 26 to 34 Years | 30 (90.9%) | 3 (9.1%) |
| 35 to 44 Years | 2 (50.0%) | 2 (50.0%) |
| 45 to 54 Years | 9 (90.0%) | 1 (10.0%) |
| 55 to 64 Years | 40 (100.0%) | 0 (0.0%) |
| 65 to 74 Years | 40 (100.0%) | 0 (0.0%) |
| 75 Years and older | 13 (100.0%) | 0 (0.0%) |
| Total | 143 (94.7%) | 8 (5.3%) |
Health Insurance Coverage by Citizenship Status in Fort Laramie
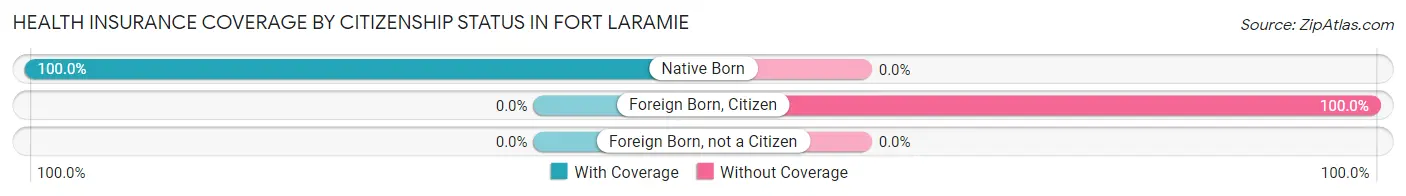
| Citizenship Status | With Coverage | Without Coverage |
| Native Born | 9 (100.0%) | 0 (0.0%) |
| Foreign Born, Citizen | 0 (0.0%) | 2 (100.0%) |
| Foreign Born, not a Citizen | 0 (0.0%) | 0 (0.0%) |
Health Insurance Coverage by Household Income in Fort Laramie
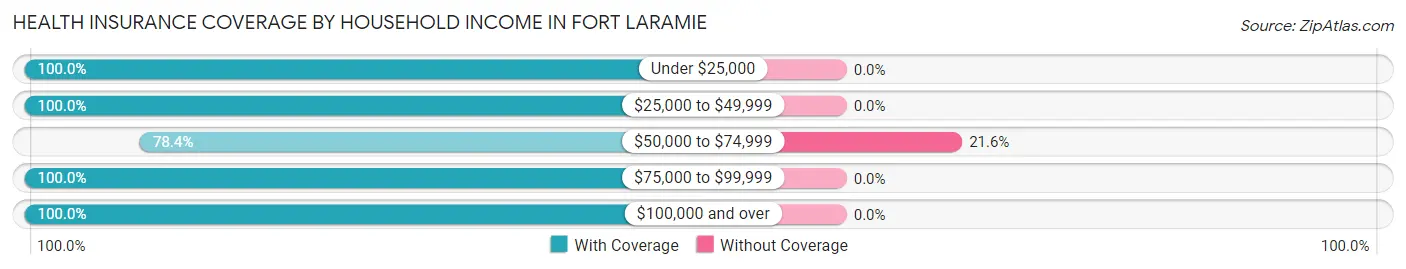
| Household Income | With Coverage | Without Coverage |
| Under $25,000 | 5 (100.0%) | 0 (0.0%) |
| $25,000 to $49,999 | 41 (100.0%) | 0 (0.0%) |
| $50,000 to $74,999 | 29 (78.4%) | 8 (21.6%) |
| $75,000 to $99,999 | 36 (100.0%) | 0 (0.0%) |
| $100,000 and over | 32 (100.0%) | 0 (0.0%) |
Public vs Private Health Insurance Coverage by Age in Fort Laramie
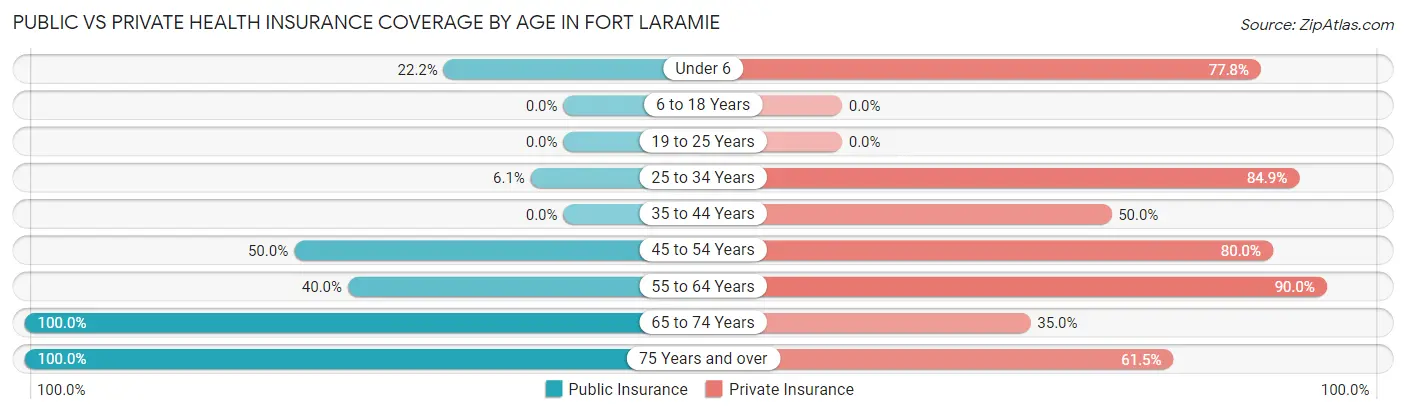
| Age Bracket | Public Insurance | Private Insurance |
| Under 6 | 2 (22.2%) | 7 (77.8%) |
| 6 to 18 Years | 0 (0.0%) | 0 (0.0%) |
| 19 to 25 Years | 0 (0.0%) | 0 (0.0%) |
| 25 to 34 Years | 2 (6.1%) | 28 (84.9%) |
| 35 to 44 Years | 0 (0.0%) | 2 (50.0%) |
| 45 to 54 Years | 5 (50.0%) | 8 (80.0%) |
| 55 to 64 Years | 16 (40.0%) | 36 (90.0%) |
| 65 to 74 Years | 40 (100.0%) | 14 (35.0%) |
| 75 Years and over | 13 (100.0%) | 8 (61.5%) |
| Total | 78 (51.7%) | 103 (68.2%) |
Disability Status by Sex by Age in Fort Laramie
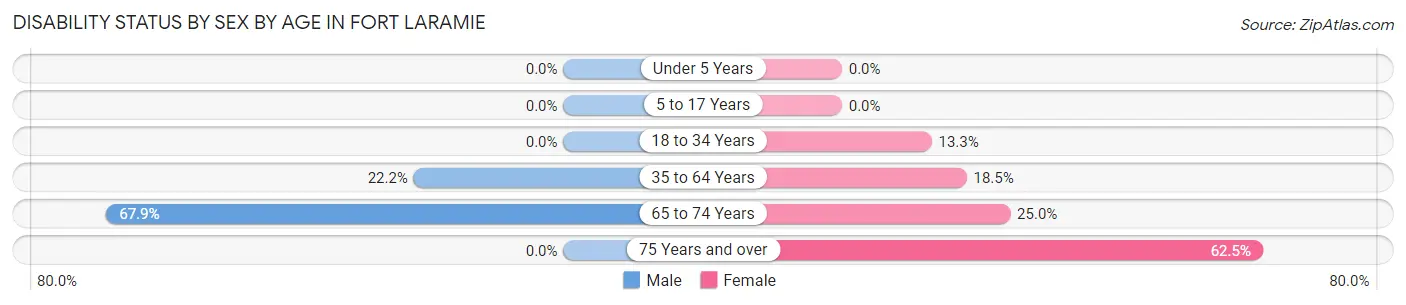
| Age Bracket | Male | Female |
| Under 5 Years | 0 (0.0%) | 0 (0.0%) |
| 5 to 17 Years | 0 (0.0%) | 0 (0.0%) |
| 18 to 34 Years | 0 (0.0%) | 2 (13.3%) |
| 35 to 64 Years | 6 (22.2%) | 5 (18.5%) |
| 65 to 74 Years | 19 (67.9%) | 3 (25.0%) |
| 75 Years and over | 0 (0.0%) | 5 (62.5%) |
Disability Class by Sex by Age in Fort Laramie
Disability Class: Hearing Difficulty
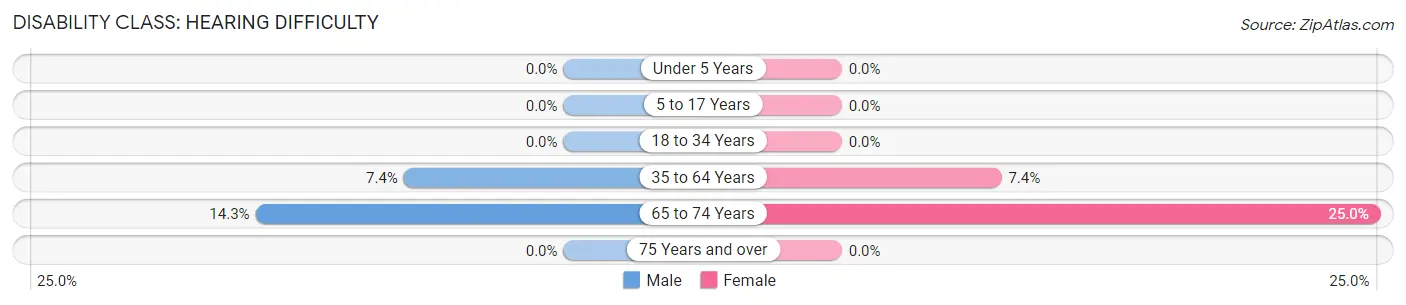
| Age Bracket | Male | Female |
| Under 5 Years | 0 (0.0%) | 0 (0.0%) |
| 5 to 17 Years | 0 (0.0%) | 0 (0.0%) |
| 18 to 34 Years | 0 (0.0%) | 0 (0.0%) |
| 35 to 64 Years | 2 (7.4%) | 2 (7.4%) |
| 65 to 74 Years | 4 (14.3%) | 3 (25.0%) |
| 75 Years and over | 0 (0.0%) | 0 (0.0%) |
Disability Class: Vision Difficulty
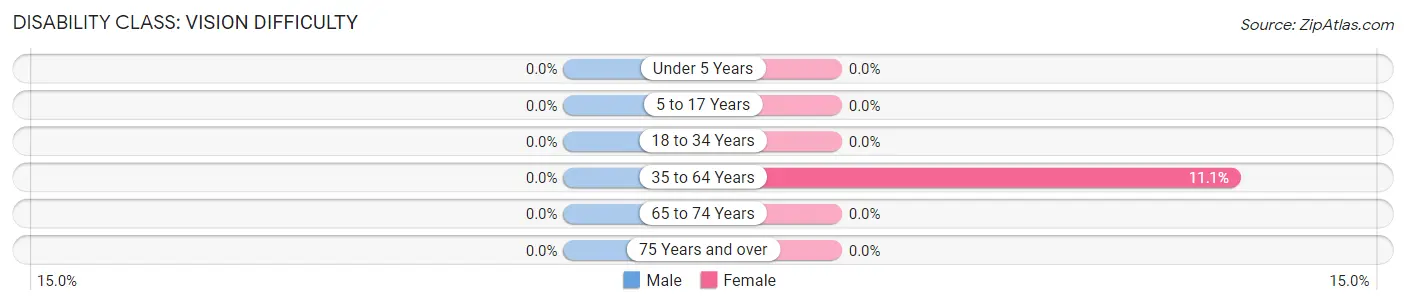
| Age Bracket | Male | Female |
| Under 5 Years | 0 (0.0%) | 0 (0.0%) |
| 5 to 17 Years | 0 (0.0%) | 0 (0.0%) |
| 18 to 34 Years | 0 (0.0%) | 0 (0.0%) |
| 35 to 64 Years | 0 (0.0%) | 3 (11.1%) |
| 65 to 74 Years | 0 (0.0%) | 0 (0.0%) |
| 75 Years and over | 0 (0.0%) | 0 (0.0%) |
Disability Class: Cognitive Difficulty
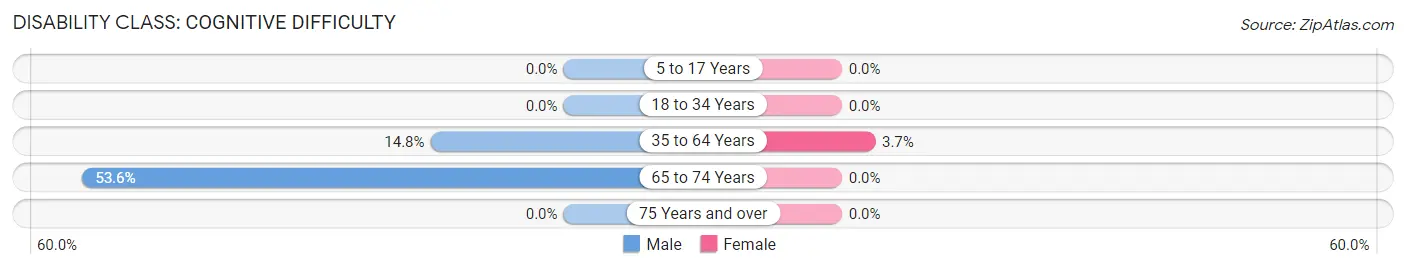
| Age Bracket | Male | Female |
| 5 to 17 Years | 0 (0.0%) | 0 (0.0%) |
| 18 to 34 Years | 0 (0.0%) | 0 (0.0%) |
| 35 to 64 Years | 4 (14.8%) | 1 (3.7%) |
| 65 to 74 Years | 15 (53.6%) | 0 (0.0%) |
| 75 Years and over | 0 (0.0%) | 0 (0.0%) |
Disability Class: Ambulatory Difficulty
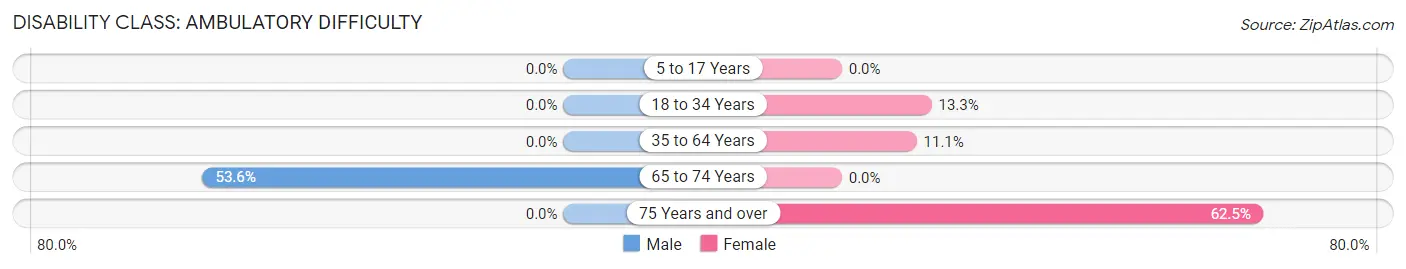
| Age Bracket | Male | Female |
| 5 to 17 Years | 0 (0.0%) | 0 (0.0%) |
| 18 to 34 Years | 0 (0.0%) | 2 (13.3%) |
| 35 to 64 Years | 0 (0.0%) | 3 (11.1%) |
| 65 to 74 Years | 15 (53.6%) | 0 (0.0%) |
| 75 Years and over | 0 (0.0%) | 5 (62.5%) |
Disability Class: Self-Care Difficulty
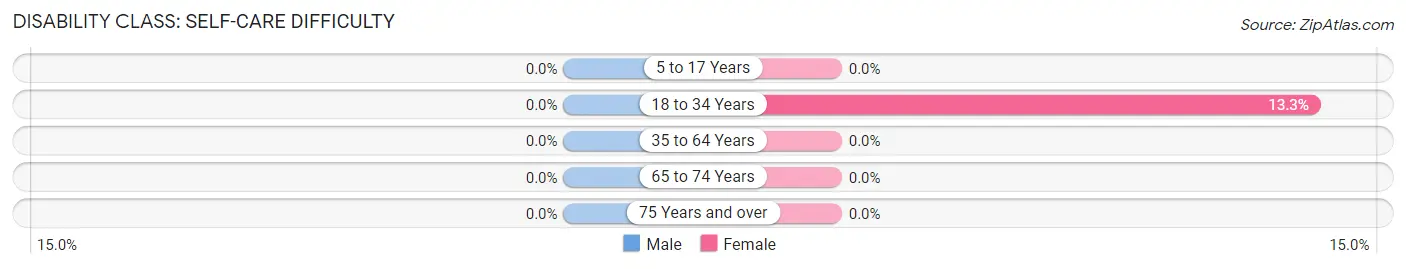
| Age Bracket | Male | Female |
| 5 to 17 Years | 0 (0.0%) | 0 (0.0%) |
| 18 to 34 Years | 0 (0.0%) | 2 (13.3%) |
| 35 to 64 Years | 0 (0.0%) | 0 (0.0%) |
| 65 to 74 Years | 0 (0.0%) | 0 (0.0%) |
| 75 Years and over | 0 (0.0%) | 0 (0.0%) |
Technology Access in Fort Laramie
Computing Device Access in Fort Laramie
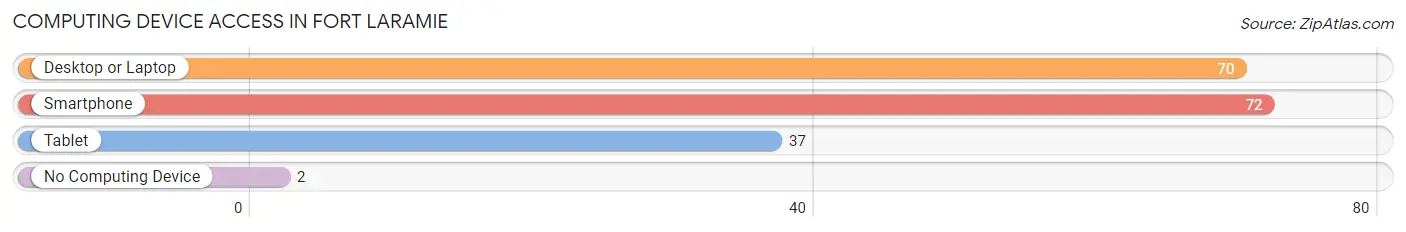
| Device Type | # Households | % Households |
| Desktop or Laptop | 70 | 80.5% |
| Smartphone | 72 | 82.8% |
| Tablet | 37 | 42.5% |
| No Computing Device | 2 | 2.3% |
| Total | 87 | 100.0% |
Internet Access in Fort Laramie
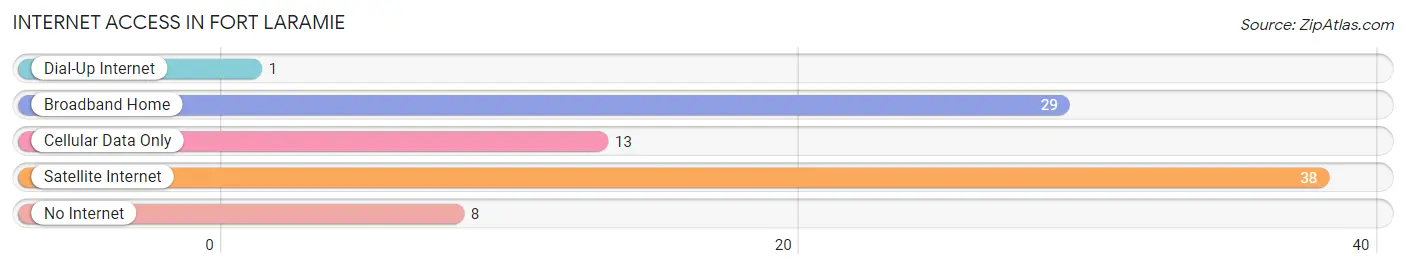
| Internet Type | # Households | % Households |
| Dial-Up Internet | 1 | 1.1% |
| Broadband Home | 29 | 33.3% |
| Cellular Data Only | 13 | 14.9% |
| Satellite Internet | 38 | 43.7% |
| No Internet | 8 | 9.2% |
| Total | 87 | 100.0% |
Fort Laramie Summary
Fort Laramie is a small town located in the eastern part of Wyoming, United States. It is situated on the Laramie River, near the border with Nebraska. The town was founded in 1834 as a fur trading post and was later used as a military post. It is now a National Historic Site and is home to a population of around 500 people.
History
Fort Laramie was originally established as a fur trading post in 1834 by the American Fur Company. The post was located at the confluence of the Laramie and North Platte Rivers, and was used as a trading post for trappers and traders. The post was also used as a base for the U.S. Army during the Indian Wars of the mid-1800s. In 1849, the post was officially designated as Fort Laramie and was used as a military post until 1890. During this time, the fort was used to protect settlers and travelers on the Oregon Trail.
In 1868, the fort was the site of the Treaty of Fort Laramie, which established the Great Sioux Reservation. This treaty was signed by the Sioux, Cheyenne, Arapaho, and other Native American tribes, and was meant to protect their rights and lands. The treaty was later broken by the U.S. government, leading to the Great Sioux War of 1876-77.
In 1890, the fort was decommissioned and the land was sold to private owners. The town of Fort Laramie was established in 1891 and the fort was designated as a National Historic Site in 1938.
Geography
Fort Laramie is located in the eastern part of Wyoming, near the border with Nebraska. It is situated on the Laramie River, which is a tributary of the North Platte River. The town is located at an elevation of 4,890 feet (1,490 m) and has a total area of 0.9 square miles (2.3 km2).
The town is located in a semi-arid climate, with hot summers and cold winters. The average annual temperature is 48 °F (9 °C), and the average annual precipitation is 16.5 inches (420 mm).
Economy
The economy of Fort Laramie is largely based on tourism. The town is home to the Fort Laramie National Historic Site, which attracts visitors from all over the world. The town also has a few small businesses, including a gas station, a grocery store, and a few restaurants.
Demographics
As of the 2010 census, the population of Fort Laramie was 498. The racial makeup of the town was 95.2% White, 0.2% African American, 0.4% Native American, 0.2% Asian, 0.2% Pacific Islander, 0.4% from other races, and 3.6% from two or more races. Hispanic or Latino of any race were 1.2% of the population.
The median income for a household in the town was $37,500, and the median income for a family was $41,250. The per capita income for the town was $17,845. About 11.2% of families and 13.2% of the population were below the poverty line, including 16.7% of those under age 18 and none of those age 65 or over.
Common Questions
What is Per Capita Income in Fort Laramie?
Per Capita income in Fort Laramie is $43,703.
What is the Median Family Income in Fort Laramie?
Median Family Income in Fort Laramie is $86,250.
What is the Median Household income in Fort Laramie?
Median Household Income in Fort Laramie is $55,625.
What is Income or Wage Gap in Fort Laramie?
Income or Wage Gap in Fort Laramie is 78.0%.
Women in Fort Laramie earn 22.0 cents for every dollar earned by a man.
What is Inequality or Gini Index in Fort Laramie?
Inequality or Gini Index in Fort Laramie is 0.35.
What is the Total Population of Fort Laramie?
Total Population of Fort Laramie is 151.
What is the Total Male Population of Fort Laramie?
Total Male Population of Fort Laramie is 80.
What is the Total Female Population of Fort Laramie?
Total Female Population of Fort Laramie is 71.
What is the Ratio of Males per 100 Females in Fort Laramie?
There are 112.68 Males per 100 Females in Fort Laramie.
What is the Ratio of Females per 100 Males in Fort Laramie?
There are 88.75 Females per 100 Males in Fort Laramie.
What is the Median Population Age in Fort Laramie?
Median Population Age in Fort Laramie is 58.6 Years.
What is the Average Family Size in Fort Laramie
Average Family Size in Fort Laramie is 2.3 People.
What is the Average Household Size in Fort Laramie
Average Household Size in Fort Laramie is 1.7 People.
How Large is the Labor Force in Fort Laramie?
There are 76 People in the Labor Forcein in Fort Laramie.
What is the Percentage of People in the Labor Force in Fort Laramie?
54.3% of People are in the Labor Force in Fort Laramie.
What is the Unemployment Rate in Fort Laramie?
Unemployment Rate in Fort Laramie is 1.3%.