Dubois, WY Map & Demographics
Dubois Map
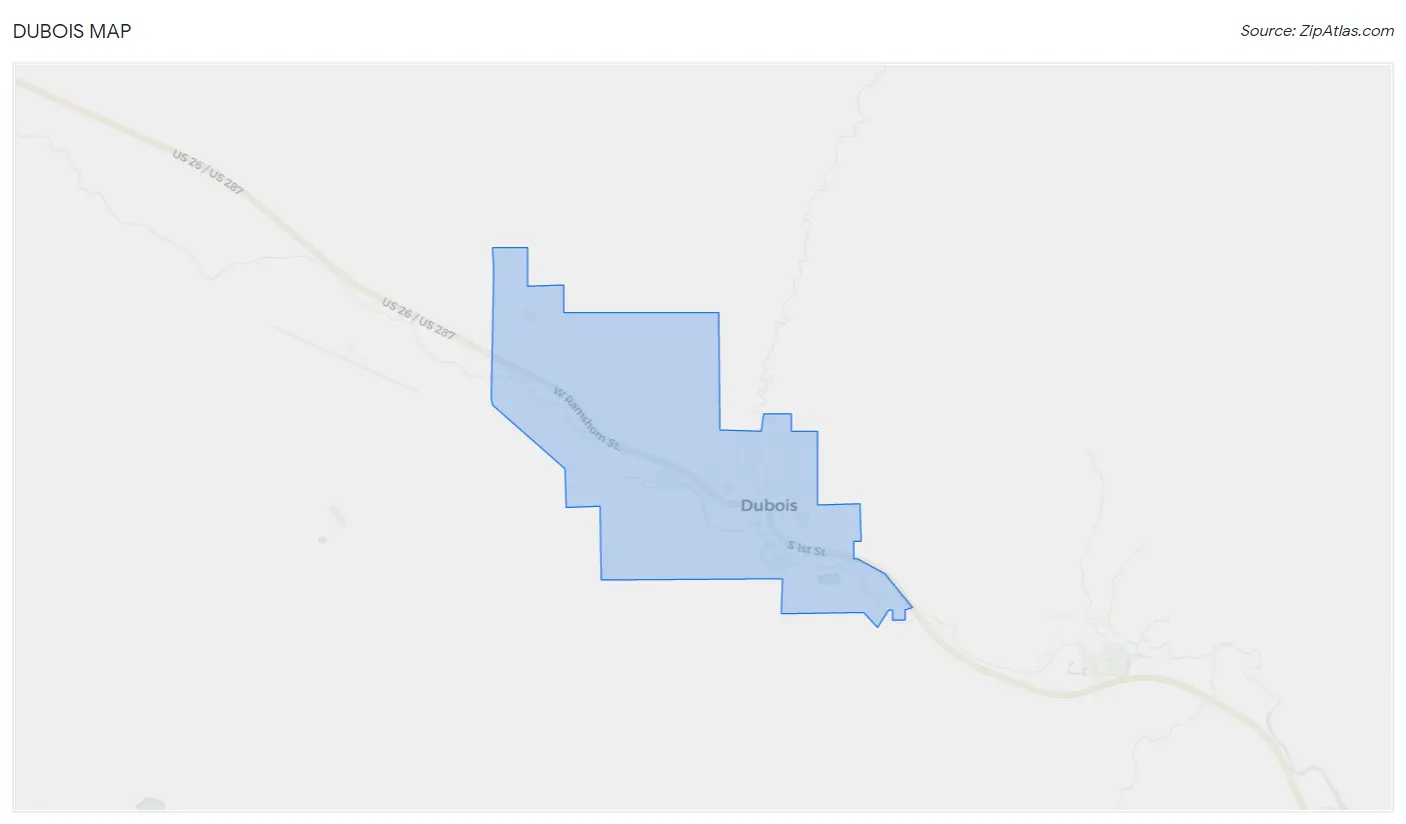
Dubois Overview
$33,485
PER CAPITA INCOME
$78,558
AVG FAMILY INCOME
$57,614
AVG HOUSEHOLD INCOME
34.3%
WAGE / INCOME GAP [ % ]
65.7¢/ $1
WAGE / INCOME GAP [ $ ]
0.44
INEQUALITY / GINI INDEX
778
TOTAL POPULATION
454
MALE POPULATION
324
FEMALE POPULATION
140.12
MALES / 100 FEMALES
71.37
FEMALES / 100 MALES
52.5
MEDIAN AGE
2.8
AVG FAMILY SIZE
1.9
AVG HOUSEHOLD SIZE
381
LABOR FORCE [ PEOPLE ]
58.3%
PERCENT IN LABOR FORCE
5.5%
UNEMPLOYMENT RATE
Dubois Zip Codes
Dubois Area Codes
Income in Dubois
Income Overview in Dubois
Per Capita Income in Dubois is $33,485, while median incomes of families and households are $78,558 and $57,614 respectively.
| Characteristic | Number | Measure |
| Per Capita Income | 778 | $33,485 |
| Median Family Income | 179 | $78,558 |
| Mean Family Income | 179 | $71,572 |
| Median Household Income | 401 | $57,614 |
| Mean Household Income | 401 | $66,454 |
| Income Deficit | 179 | $0 |
| Wage / Income Gap (%) | 778 | 34.33% |
| Wage / Income Gap ($) | 778 | 65.67¢ per $1 |
| Gini / Inequality Index | 778 | 0.44 |
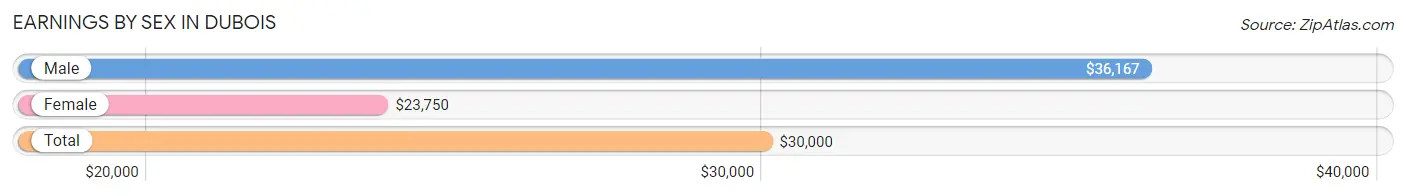
Earnings by Sex in Dubois
Average Earnings in Dubois are $30,000, $36,167 for men and $23,750 for women, a difference of 34.3%.
| Sex | Number | Average Earnings |
| Male | 272 (63.3%) | $36,167 |
| Female | 158 (36.7%) | $23,750 |
| Total | 430 (100.0%) | $30,000 |
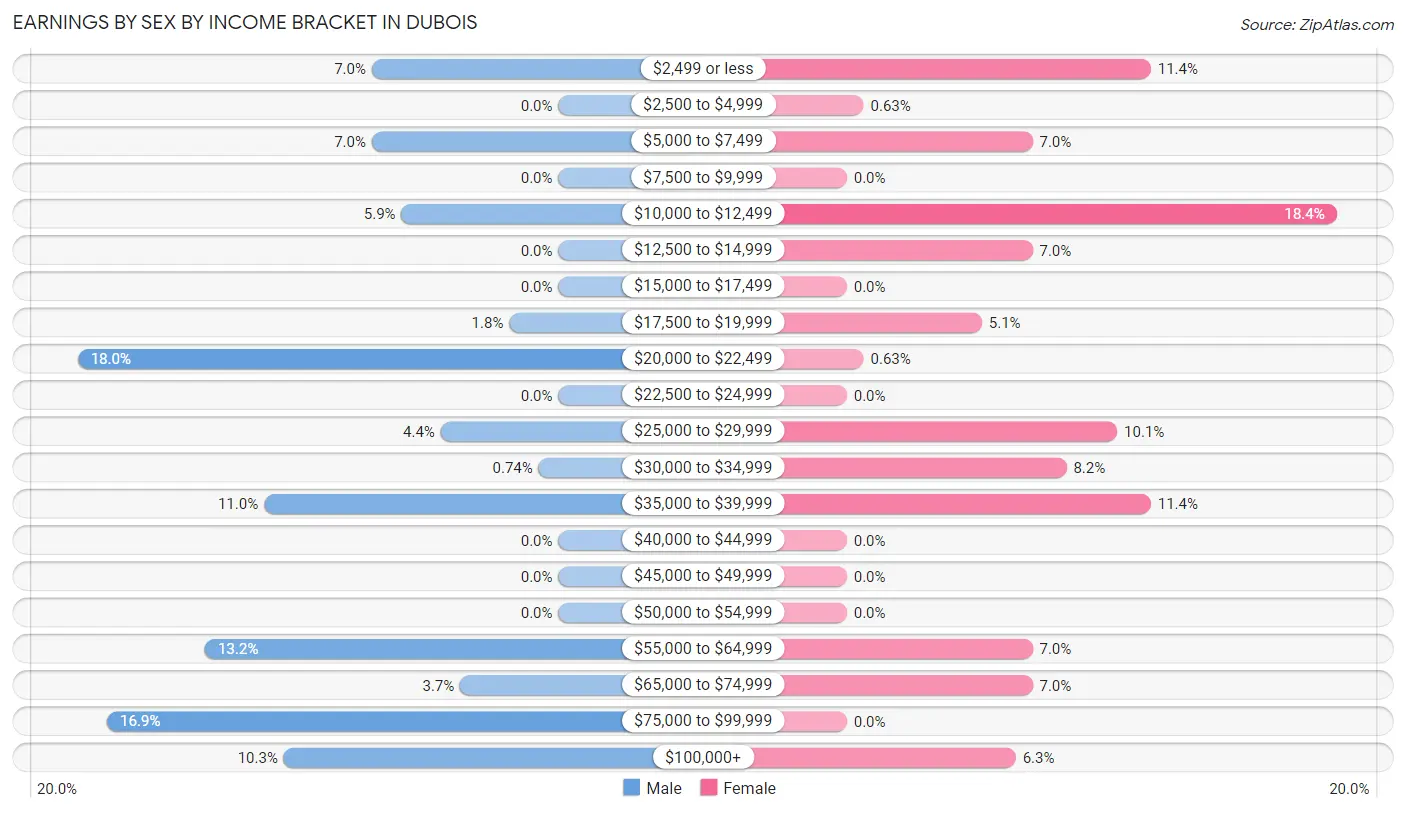
Earnings by Sex by Income Bracket in Dubois
The most common earnings brackets in Dubois are $20,000 to $22,499 for men (49 | 18.0%) and $10,000 to $12,499 for women (29 | 18.3%).
| Income | Male | Female |
| $2,499 or less | 19 (7.0%) | 18 (11.4%) |
| $2,500 to $4,999 | 0 (0.0%) | 1 (0.6%) |
| $5,000 to $7,499 | 19 (7.0%) | 11 (7.0%) |
| $7,500 to $9,999 | 0 (0.0%) | 0 (0.0%) |
| $10,000 to $12,499 | 16 (5.9%) | 29 (18.3%) |
| $12,500 to $14,999 | 0 (0.0%) | 11 (7.0%) |
| $15,000 to $17,499 | 0 (0.0%) | 0 (0.0%) |
| $17,500 to $19,999 | 5 (1.8%) | 8 (5.1%) |
| $20,000 to $22,499 | 49 (18.0%) | 1 (0.6%) |
| $22,500 to $24,999 | 0 (0.0%) | 0 (0.0%) |
| $25,000 to $29,999 | 12 (4.4%) | 16 (10.1%) |
| $30,000 to $34,999 | 2 (0.7%) | 13 (8.2%) |
| $35,000 to $39,999 | 30 (11.0%) | 18 (11.4%) |
| $40,000 to $44,999 | 0 (0.0%) | 0 (0.0%) |
| $45,000 to $49,999 | 0 (0.0%) | 0 (0.0%) |
| $50,000 to $54,999 | 0 (0.0%) | 0 (0.0%) |
| $55,000 to $64,999 | 36 (13.2%) | 11 (7.0%) |
| $65,000 to $74,999 | 10 (3.7%) | 11 (7.0%) |
| $75,000 to $99,999 | 46 (16.9%) | 0 (0.0%) |
| $100,000+ | 28 (10.3%) | 10 (6.3%) |
| Total | 272 (100.0%) | 158 (100.0%) |
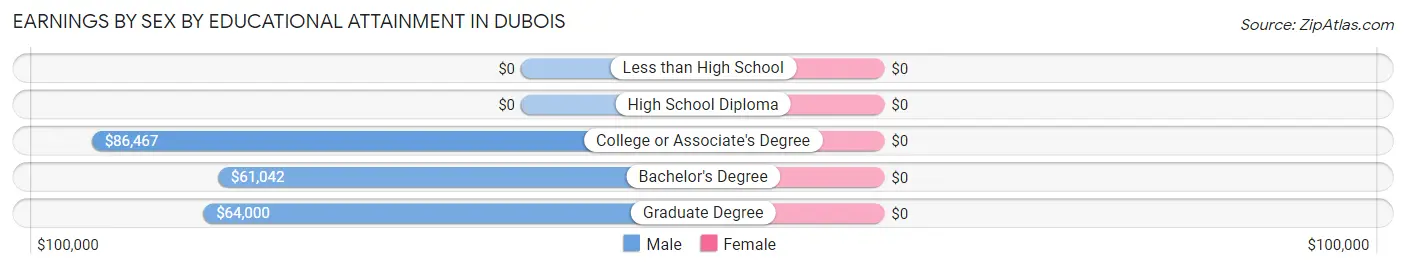
Earnings by Sex by Educational Attainment in Dubois
| Educational Attainment | Male Income | Female Income |
| Less than High School | - | - |
| High School Diploma | - | - |
| College or Associate's Degree | $86,467 | $0 |
| Bachelor's Degree | $61,042 | $0 |
| Graduate Degree | $64,000 | $0 |
| Total | $58,636 | $27,344 |
Family Income in Dubois
Family Income Brackets in Dubois
According to the Dubois family income data, there are 73 families falling into the $75,000 to $99,999 income range, which is the most common income bracket and makes up 40.8% of all families.
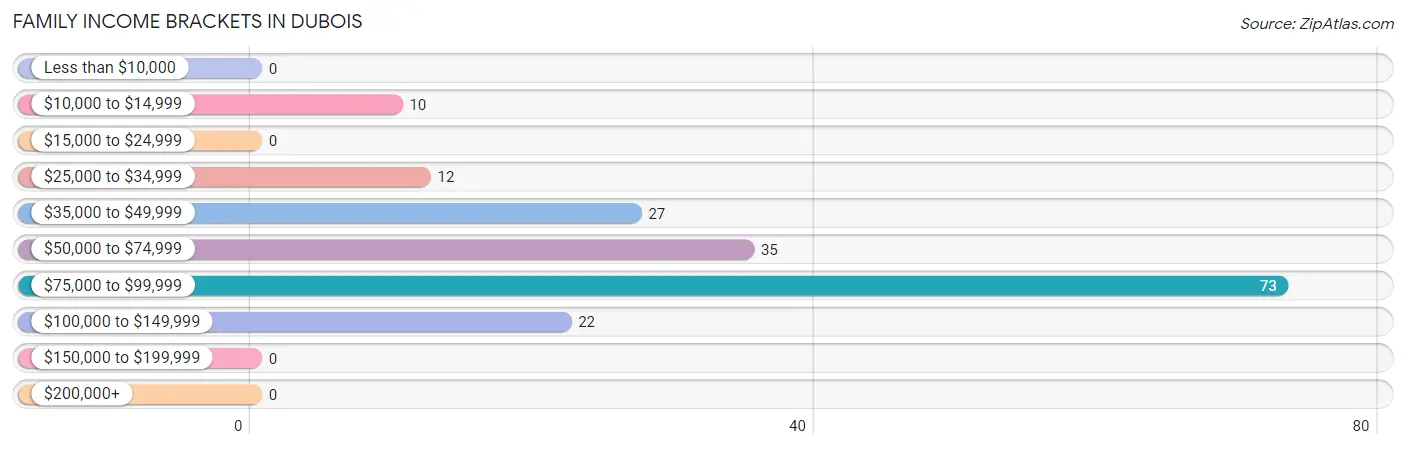
| Income Bracket | # Families | % Families |
| Less than $10,000 | 0 | 0.0% |
| $10,000 to $14,999 | 10 | 5.6% |
| $15,000 to $24,999 | 0 | 0.0% |
| $25,000 to $34,999 | 12 | 6.7% |
| $35,000 to $49,999 | 27 | 15.1% |
| $50,000 to $74,999 | 35 | 19.6% |
| $75,000 to $99,999 | 73 | 40.8% |
| $100,000 to $149,999 | 22 | 12.3% |
| $150,000 to $199,999 | 0 | 0.0% |
| $200,000+ | 0 | 0.0% |
Family Income by Famaliy Size in Dubois
2-person families (109 | 60.9%) account for the highest median family income in Dubois with $78,942 per family, while 2-person families (109 | 60.9%) have the highest median income of $39,471 per family member.
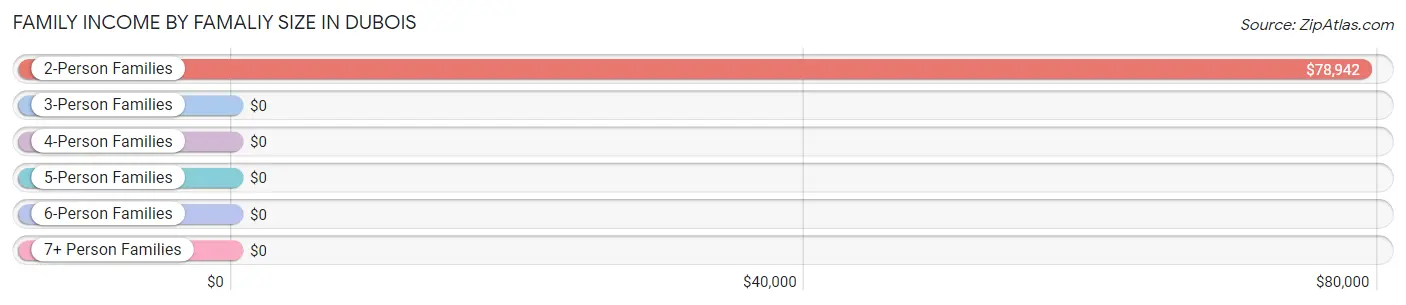
| Income Bracket | # Families | Median Income |
| 2-Person Families | 109 (60.9%) | $78,942 |
| 3-Person Families | 21 (11.7%) | $0 |
| 4-Person Families | 49 (27.4%) | $0 |
| 5-Person Families | 0 (0.0%) | $0 |
| 6-Person Families | 0 (0.0%) | $0 |
| 7+ Person Families | 0 (0.0%) | $0 |
| Total | 179 (100.0%) | $78,558 |
Family Income by Number of Earners in Dubois
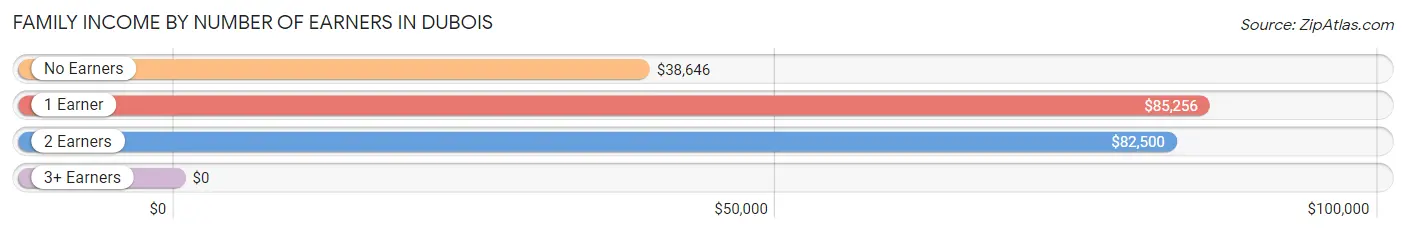
| Number of Earners | # Families | Median Income |
| No Earners | 35 (19.6%) | $38,646 |
| 1 Earner | 70 (39.1%) | $85,256 |
| 2 Earners | 62 (34.6%) | $82,500 |
| 3+ Earners | 12 (6.7%) | $0 |
| Total | 179 (100.0%) | $78,558 |
Household Income in Dubois
Household Income Brackets in Dubois
With 86 households falling in the category, the $75,000 to $99,999 income range is the most frequent in Dubois, accounting for 21.4% of all households.
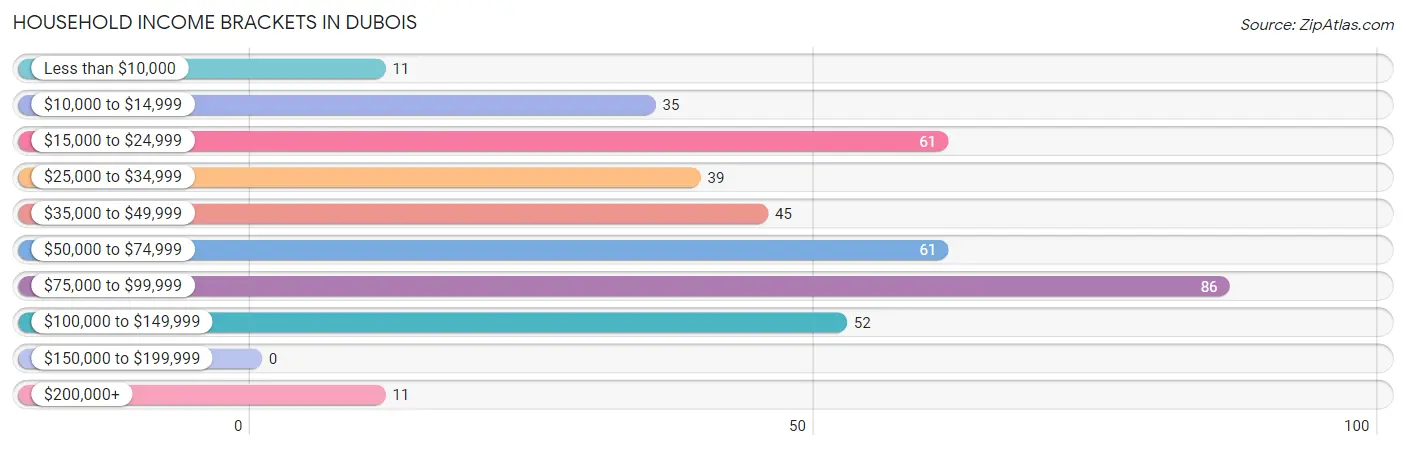
| Income Bracket | # Households | % Households |
| Less than $10,000 | 11 | 2.7% |
| $10,000 to $14,999 | 35 | 8.7% |
| $15,000 to $24,999 | 61 | 15.2% |
| $25,000 to $34,999 | 39 | 9.7% |
| $35,000 to $49,999 | 45 | 11.2% |
| $50,000 to $74,999 | 61 | 15.2% |
| $75,000 to $99,999 | 86 | 21.4% |
| $100,000 to $149,999 | 52 | 13.0% |
| $150,000 to $199,999 | 0 | 0.0% |
| $200,000+ | 11 | 2.7% |
Household Income by Householder Age in Dubois
The median household income in Dubois is $57,614, with the highest median household income of $85,769 found in the 45 to 64 years age bracket for the primary householder. A total of 158 households (39.4%) fall into this category.
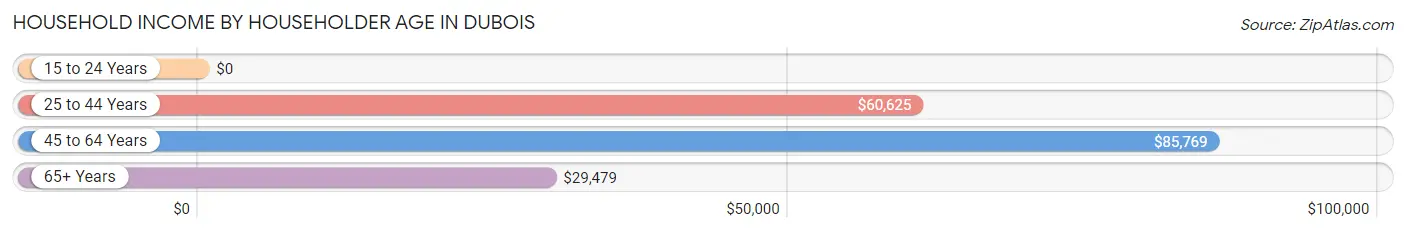
| Income Bracket | # Households | Median Income |
| 15 to 24 Years | 0 (0.0%) | $0 |
| 25 to 44 Years | 92 (22.9%) | $60,625 |
| 45 to 64 Years | 158 (39.4%) | $85,769 |
| 65+ Years | 151 (37.7%) | $29,479 |
| Total | 401 (100.0%) | $57,614 |
Poverty in Dubois
Income Below Poverty by Sex and Age in Dubois
With 10.4% poverty level for males and 12.7% for females among the residents of Dubois, 6 to 11 year old males and 18 to 24 year old females are the most vulnerable to poverty, with 10 males (31.2%) and 20 females (66.7%) in their respective age groups living below the poverty level.
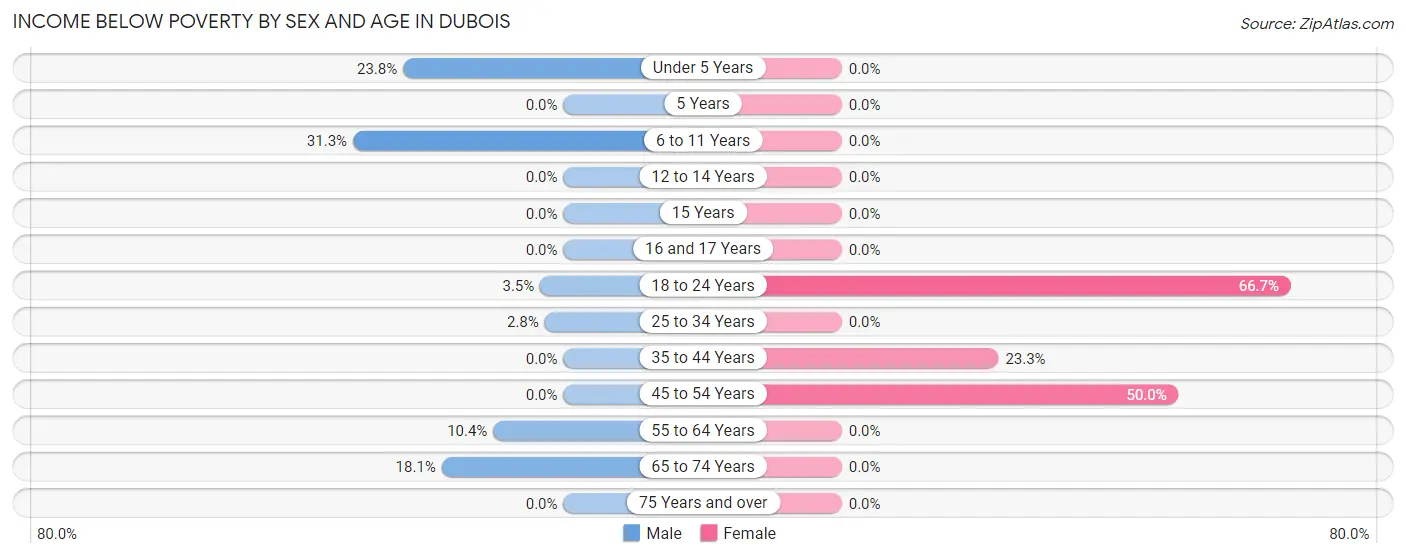
| Age Bracket | Male | Female |
| Under 5 Years | 10 (23.8%) | 0 (0.0%) |
| 5 Years | 0 (0.0%) | 0 (0.0%) |
| 6 to 11 Years | 10 (31.2%) | 0 (0.0%) |
| 12 to 14 Years | 0 (0.0%) | 0 (0.0%) |
| 15 Years | 0 (0.0%) | 0 (0.0%) |
| 16 and 17 Years | 0 (0.0%) | 0 (0.0%) |
| 18 to 24 Years | 1 (3.5%) | 20 (66.7%) |
| 25 to 34 Years | 1 (2.8%) | 0 (0.0%) |
| 35 to 44 Years | 0 (0.0%) | 10 (23.3%) |
| 45 to 54 Years | 0 (0.0%) | 11 (50.0%) |
| 55 to 64 Years | 10 (10.4%) | 0 (0.0%) |
| 65 to 74 Years | 15 (18.1%) | 0 (0.0%) |
| 75 Years and over | 0 (0.0%) | 0 (0.0%) |
| Total | 47 (10.4%) | 41 (12.7%) |
Income Above Poverty by Sex and Age in Dubois
According to the poverty statistics in Dubois, males aged 5 years and females aged 6 to 11 years are the age groups that are most secure financially, with 100.0% of males and 100.0% of females in these age groups living above the poverty line.
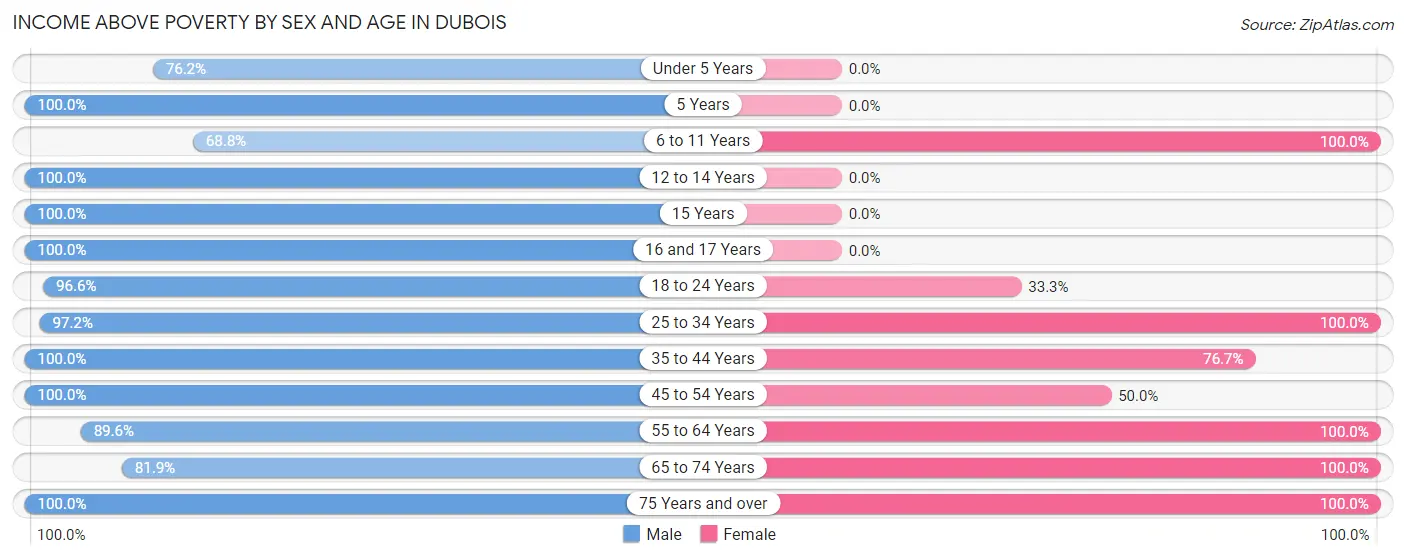
| Age Bracket | Male | Female |
| Under 5 Years | 32 (76.2%) | 0 (0.0%) |
| 5 Years | 11 (100.0%) | 0 (0.0%) |
| 6 to 11 Years | 22 (68.8%) | 12 (100.0%) |
| 12 to 14 Years | 11 (100.0%) | 0 (0.0%) |
| 15 Years | 16 (100.0%) | 0 (0.0%) |
| 16 and 17 Years | 19 (100.0%) | 0 (0.0%) |
| 18 to 24 Years | 28 (96.6%) | 10 (33.3%) |
| 25 to 34 Years | 35 (97.2%) | 37 (100.0%) |
| 35 to 44 Years | 33 (100.0%) | 33 (76.7%) |
| 45 to 54 Years | 29 (100.0%) | 11 (50.0%) |
| 55 to 64 Years | 86 (89.6%) | 67 (100.0%) |
| 65 to 74 Years | 68 (81.9%) | 73 (100.0%) |
| 75 Years and over | 13 (100.0%) | 40 (100.0%) |
| Total | 403 (89.6%) | 283 (87.4%) |
Income Below Poverty Among Married-Couple Families in Dubois
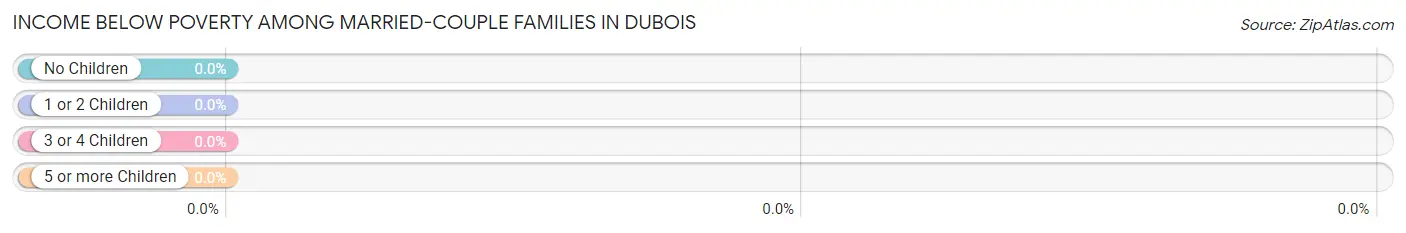
| Children | Above Poverty | Below Poverty |
| No Children | 87 (100.0%) | 0 (0.0%) |
| 1 or 2 Children | 49 (100.0%) | 0 (0.0%) |
| 3 or 4 Children | 0 (0.0%) | 0 (0.0%) |
| 5 or more Children | 0 (0.0%) | 0 (0.0%) |
| Total | 136 (100.0%) | 0 (0.0%) |
Income Below Poverty Among Single-Parent Households in Dubois
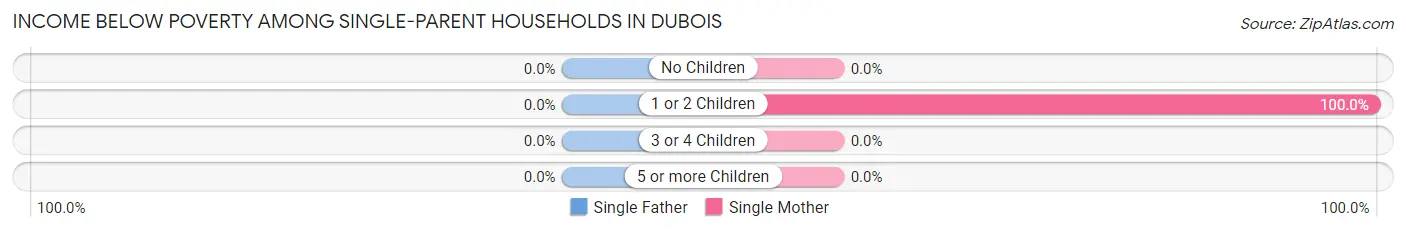
| Children | Single Father | Single Mother |
| No Children | 0 (0.0%) | 0 (0.0%) |
| 1 or 2 Children | 0 (0.0%) | 10 (100.0%) |
| 3 or 4 Children | 0 (0.0%) | 0 (0.0%) |
| 5 or more Children | 0 (0.0%) | 0 (0.0%) |
| Total | 0 (0.0%) | 10 (47.6%) |
Income Below Poverty Among Married-Couple vs Single-Parent Households in Dubois
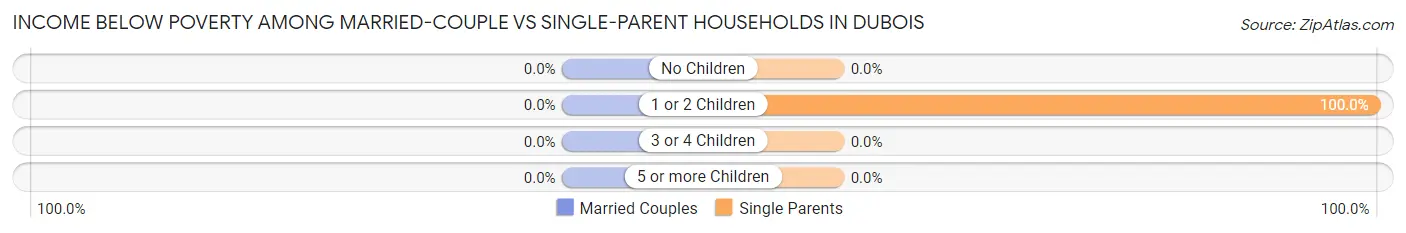
| Children | Married-Couple Families | Single-Parent Households |
| No Children | 0 (0.0%) | 0 (0.0%) |
| 1 or 2 Children | 0 (0.0%) | 10 (100.0%) |
| 3 or 4 Children | 0 (0.0%) | 0 (0.0%) |
| 5 or more Children | 0 (0.0%) | 0 (0.0%) |
| Total | 0 (0.0%) | 10 (23.3%) |
Race in Dubois
The most populous races in Dubois are White / Caucasian (724 | 93.1%), Two or more Races (39 | 5.0%), and Hispanic or Latino (21 | 2.7%).
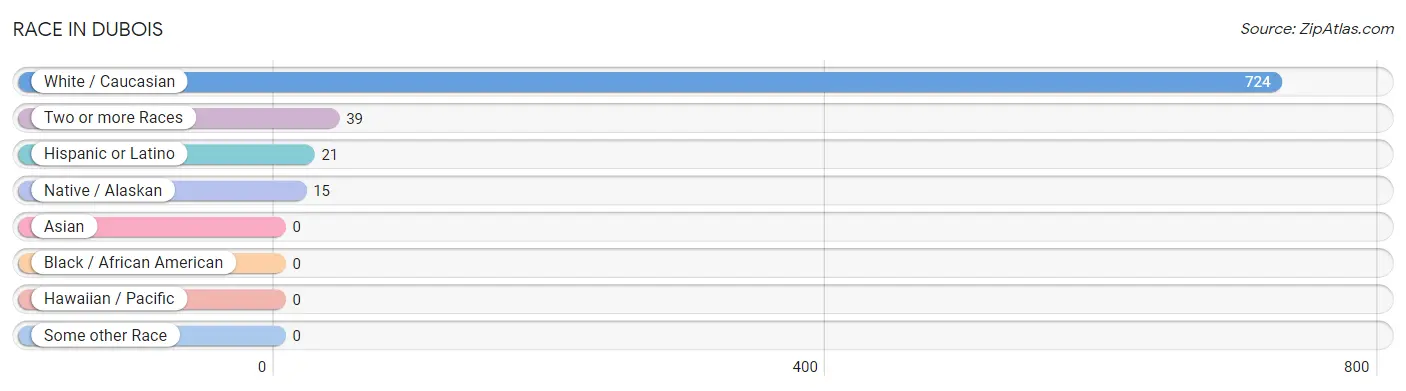
| Race | # Population | % Population |
| Asian | 0 | 0.0% |
| Black / African American | 0 | 0.0% |
| Hawaiian / Pacific | 0 | 0.0% |
| Hispanic or Latino | 21 | 2.7% |
| Native / Alaskan | 15 | 1.9% |
| White / Caucasian | 724 | 93.1% |
| Two or more Races | 39 | 5.0% |
| Some other Race | 0 | 0.0% |
| Total | 778 | 100.0% |
Ancestry in Dubois
The most populous ancestries reported in Dubois are German (230 | 29.6%), Irish (159 | 20.4%), English (104 | 13.4%), Norwegian (34 | 4.4%), and Scottish (32 | 4.1%), together accounting for 71.9% of all Dubois residents.
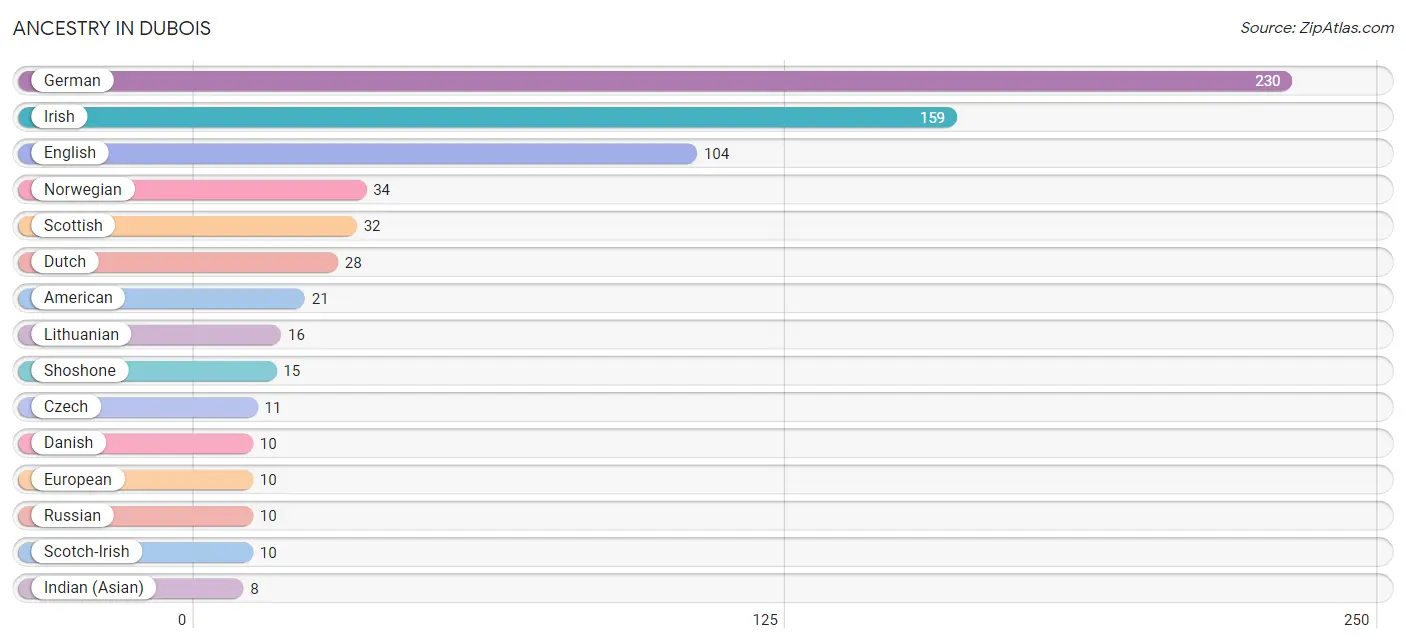
| Ancestry | # Population | % Population |
| American | 21 | 2.7% |
| Austrian | 6 | 0.8% |
| Bhutanese | 1 | 0.1% |
| Choctaw | 6 | 0.8% |
| Czech | 11 | 1.4% |
| Danish | 10 | 1.3% |
| Dutch | 28 | 3.6% |
| English | 104 | 13.4% |
| European | 10 | 1.3% |
| German | 230 | 29.6% |
| Indian (Asian) | 8 | 1.0% |
| Irish | 159 | 20.4% |
| Italian | 3 | 0.4% |
| Lithuanian | 16 | 2.1% |
| Mexican | 1 | 0.1% |
| Norwegian | 34 | 4.4% |
| Polish | 5 | 0.6% |
| Russian | 10 | 1.3% |
| Scotch-Irish | 10 | 1.3% |
| Scottish | 32 | 4.1% |
| Shoshone | 15 | 1.9% |
| Swedish | 2 | 0.3% |
| Welsh | 8 | 1.0% | View All 23 Rows |
Immigrants in Dubois
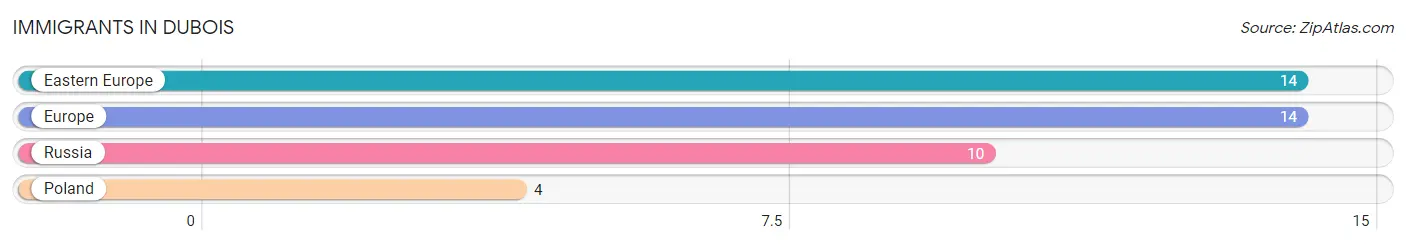
The most numerous immigrant groups reported in Dubois came from Eastern Europe (14 | 1.8%), Europe (14 | 1.8%), Russia (10 | 1.3%), and Poland (4 | 0.5%), together accounting for 5.4% of all Dubois residents.
| Immigration Origin | # Population | % Population |
| Eastern Europe | 14 | 1.8% |
| Europe | 14 | 1.8% |
| Poland | 4 | 0.5% |
| Russia | 10 | 1.3% | View All 4 Rows |
Sex and Age in Dubois
Sex and Age in Dubois
The most populous age groups in Dubois are 15 to 19 Years (63 | 13.9%) for men and 70 to 74 Years (45 | 13.9%) for women.
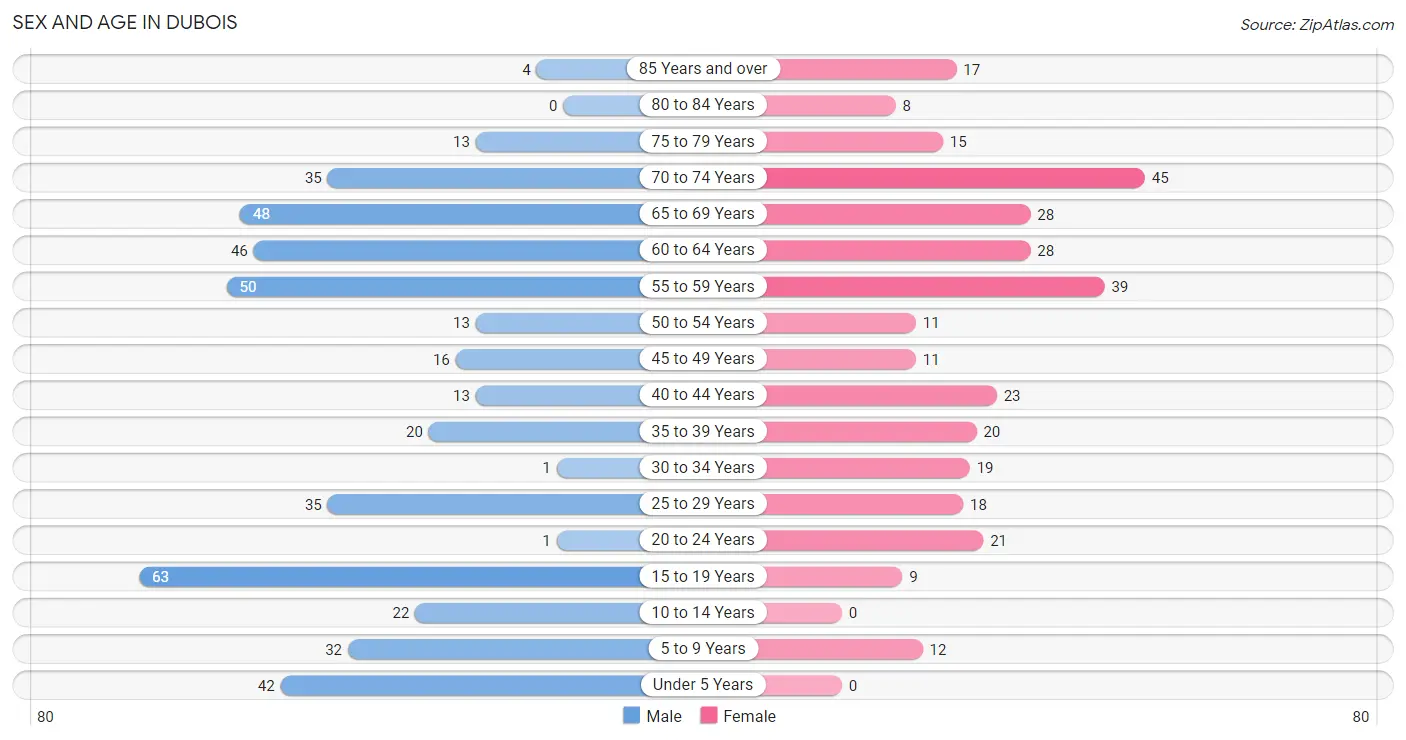
| Age Bracket | Male | Female |
| Under 5 Years | 42 (9.2%) | 0 (0.0%) |
| 5 to 9 Years | 32 (7.0%) | 12 (3.7%) |
| 10 to 14 Years | 22 (4.9%) | 0 (0.0%) |
| 15 to 19 Years | 63 (13.9%) | 9 (2.8%) |
| 20 to 24 Years | 1 (0.2%) | 21 (6.5%) |
| 25 to 29 Years | 35 (7.7%) | 18 (5.6%) |
| 30 to 34 Years | 1 (0.2%) | 19 (5.9%) |
| 35 to 39 Years | 20 (4.4%) | 20 (6.2%) |
| 40 to 44 Years | 13 (2.9%) | 23 (7.1%) |
| 45 to 49 Years | 16 (3.5%) | 11 (3.4%) |
| 50 to 54 Years | 13 (2.9%) | 11 (3.4%) |
| 55 to 59 Years | 50 (11.0%) | 39 (12.0%) |
| 60 to 64 Years | 46 (10.1%) | 28 (8.6%) |
| 65 to 69 Years | 48 (10.6%) | 28 (8.6%) |
| 70 to 74 Years | 35 (7.7%) | 45 (13.9%) |
| 75 to 79 Years | 13 (2.9%) | 15 (4.6%) |
| 80 to 84 Years | 0 (0.0%) | 8 (2.5%) |
| 85 Years and over | 4 (0.9%) | 17 (5.2%) |
| Total | 454 (100.0%) | 324 (100.0%) |
Families and Households in Dubois
Median Family Size in Dubois
The median family size in Dubois is 2.81 persons per family, with single female/mother families (21 | 11.7%) accounting for the largest median family size of 3.95 persons per family. On the other hand, single male/father families (22 | 12.3%) represent the smallest median family size with 2.23 persons per family.
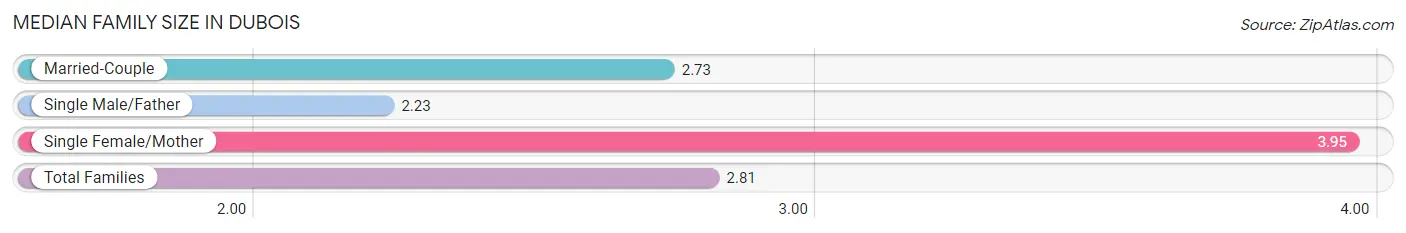
| Family Type | # Families | Family Size |
| Married-Couple | 136 (76.0%) | 2.73 |
| Single Male/Father | 22 (12.3%) | 2.23 |
| Single Female/Mother | 21 (11.7%) | 3.95 |
| Total Families | 179 (100.0%) | 2.81 |
Median Household Size in Dubois
The median household size in Dubois is 1.92 persons per household, with single female/mother households (21 | 5.2%) accounting for the largest median household size of 3.95 persons per household. non-family households (222 | 55.4%) represent the smallest median household size with 1.11 persons per household.
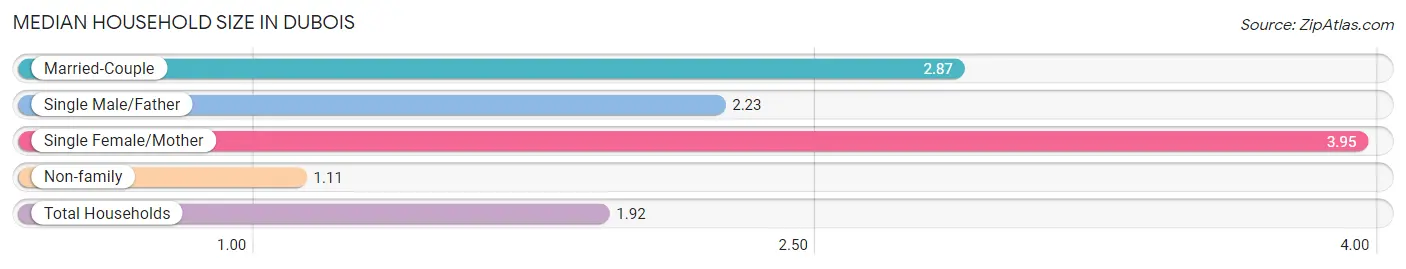
| Household Type | # Households | Household Size |
| Married-Couple | 136 (33.9%) | 2.87 |
| Single Male/Father | 22 (5.5%) | 2.23 |
| Single Female/Mother | 21 (5.2%) | 3.95 |
| Non-family | 222 (55.4%) | 1.11 |
| Total Households | 401 (100.0%) | 1.92 |
Household Size by Marriage Status in Dubois
Out of a total of 401 households in Dubois, 179 (44.6%) are family households, while 222 (55.4%) are nonfamily households. The most numerous type of family households are 2-person households, comprising 109, and the most common type of nonfamily households are 1-person households, comprising 196.
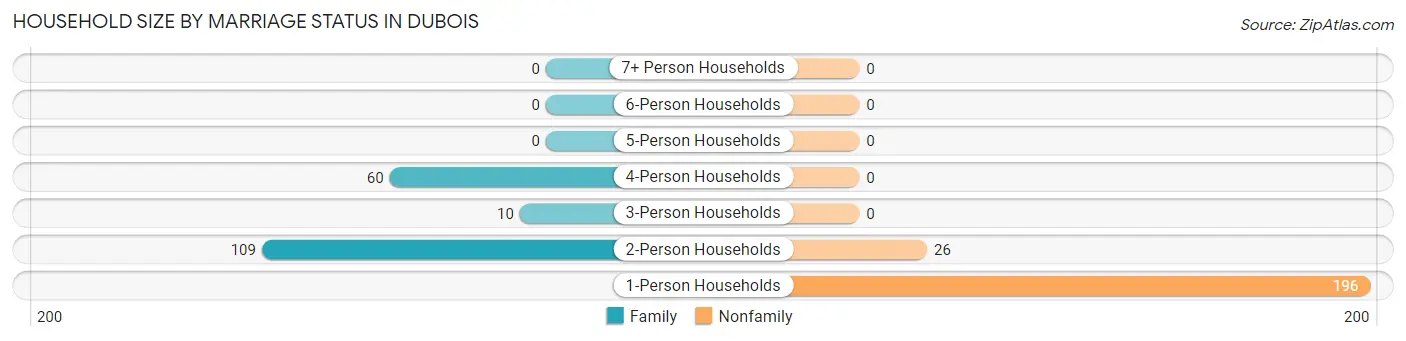
| Household Size | Family Households | Nonfamily Households |
| 1-Person Households | - | 196 (48.9%) |
| 2-Person Households | 109 (27.2%) | 26 (6.5%) |
| 3-Person Households | 10 (2.5%) | 0 (0.0%) |
| 4-Person Households | 60 (15.0%) | 0 (0.0%) |
| 5-Person Households | 0 (0.0%) | 0 (0.0%) |
| 6-Person Households | 0 (0.0%) | 0 (0.0%) |
| 7+ Person Households | 0 (0.0%) | 0 (0.0%) |
| Total | 179 (44.6%) | 222 (55.4%) |
Female Fertility in Dubois
Fertility by Age in Dubois
Average fertility rate in Dubois is 83.0 births per 1,000 women. Women in the age bracket of 20 to 34 years have the highest fertility rate with 190.0 births per 1,000 women. Women in the age bracket of 20 to 34 years acount for 100.0% of all women with births.
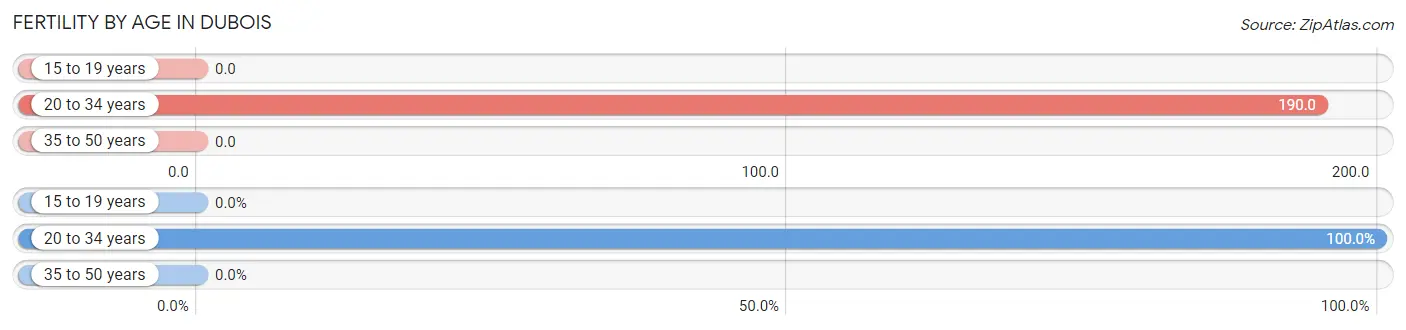
| Age Bracket | Women with Births | Births / 1,000 Women |
| 15 to 19 years | 0 (0.0%) | 0.0 |
| 20 to 34 years | 11 (100.0%) | 190.0 |
| 35 to 50 years | 0 (0.0%) | 0.0 |
| Total | 11 (100.0%) | 83.0 |
Fertility by Age by Marriage Status in Dubois
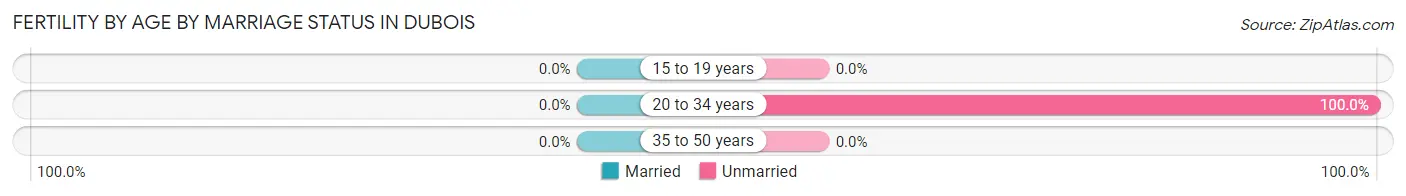
| Age Bracket | Married | Unmarried |
| 15 to 19 years | 0 (0.0%) | 0 (0.0%) |
| 20 to 34 years | 0 (0.0%) | 11 (100.0%) |
| 35 to 50 years | 0 (0.0%) | 0 (0.0%) |
| Total | 0 (0.0%) | 11 (100.0%) |
Fertility by Education in Dubois
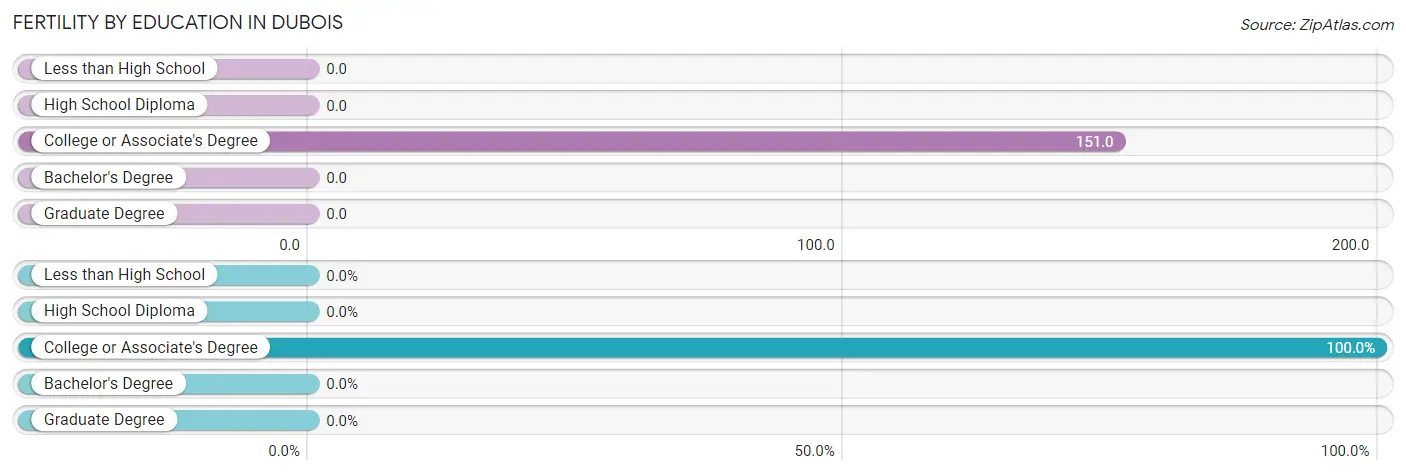
| Educational Attainment | Women with Births | Births / 1,000 Women |
| Less than High School | 0 (0.0%) | 0.0 |
| High School Diploma | 0 (0.0%) | 0.0 |
| College or Associate's Degree | 11 (100.0%) | 151.0 |
| Bachelor's Degree | 0 (0.0%) | 0.0 |
| Graduate Degree | 0 (0.0%) | 0.0 |
| Total | 11 (100.0%) | 83.0 |
Fertility by Education by Marriage Status in Dubois
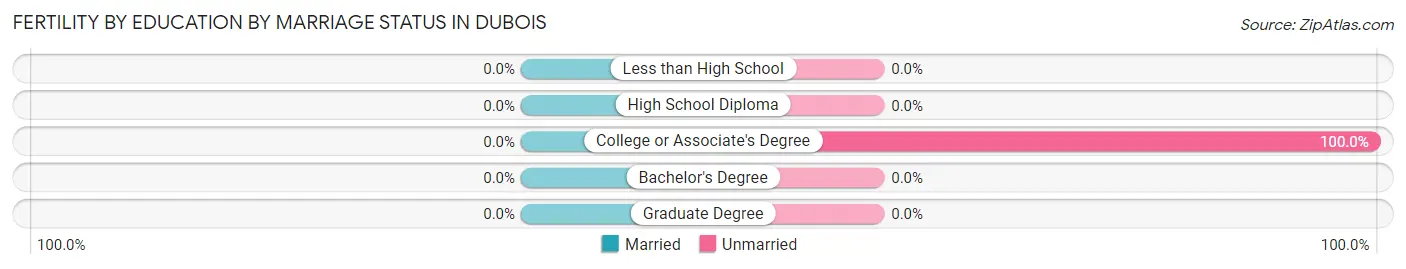
| Educational Attainment | Married | Unmarried |
| Less than High School | 0 (0.0%) | 0 (0.0%) |
| High School Diploma | 0 (0.0%) | 0 (0.0%) |
| College or Associate's Degree | 0 (0.0%) | 11 (100.0%) |
| Bachelor's Degree | 0 (0.0%) | 0 (0.0%) |
| Graduate Degree | 0 (0.0%) | 0 (0.0%) |
| Total | 0 (0.0%) | 11 (100.0%) |
Employment Characteristics in Dubois
Employment by Class of Employer in Dubois
Among the 360 employed individuals in Dubois, private company employees (227 | 63.1%), self-employed (not incorporated) (36 | 10.0%), and local government employees (32 | 8.9%) make up the most common classes of employment.
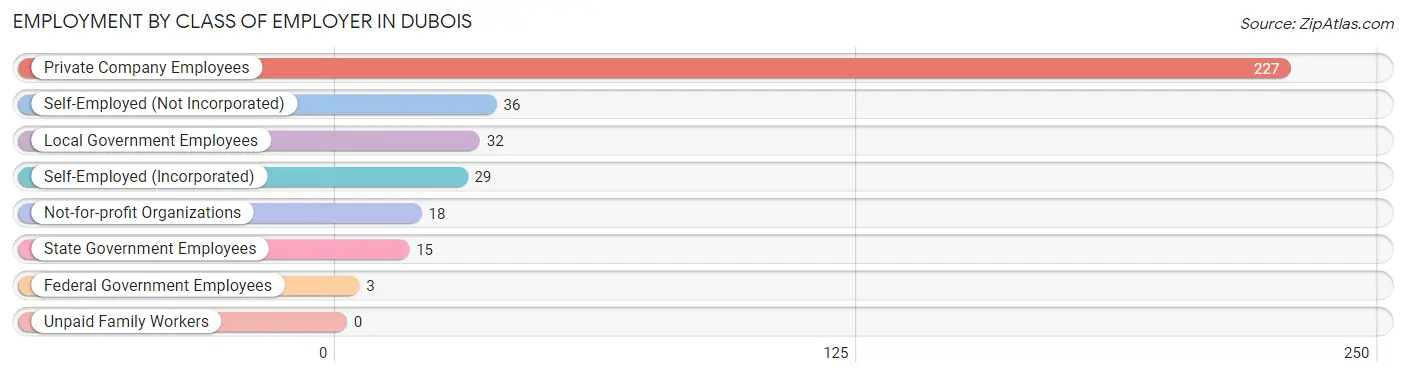
| Employer Class | # Employees | % Employees |
| Private Company Employees | 227 | 63.1% |
| Self-Employed (Incorporated) | 29 | 8.1% |
| Self-Employed (Not Incorporated) | 36 | 10.0% |
| Not-for-profit Organizations | 18 | 5.0% |
| Local Government Employees | 32 | 8.9% |
| State Government Employees | 15 | 4.2% |
| Federal Government Employees | 3 | 0.8% |
| Unpaid Family Workers | 0 | 0.0% |
| Total | 360 | 100.0% |
Employment Status by Age in Dubois
According to the labor force statistics for Dubois, out of the total population over 16 years of age (654), 58.3% or 381 individuals are in the labor force, with 5.5% or 21 of them unemployed. The age group with the highest labor force participation rate is 20 to 24 years, with 100.0% or 22 individuals in the labor force. Within the labor force, the 60 to 64 years age range has the highest percentage of unemployed individuals, with 31.3% or 10 of them being unemployed.
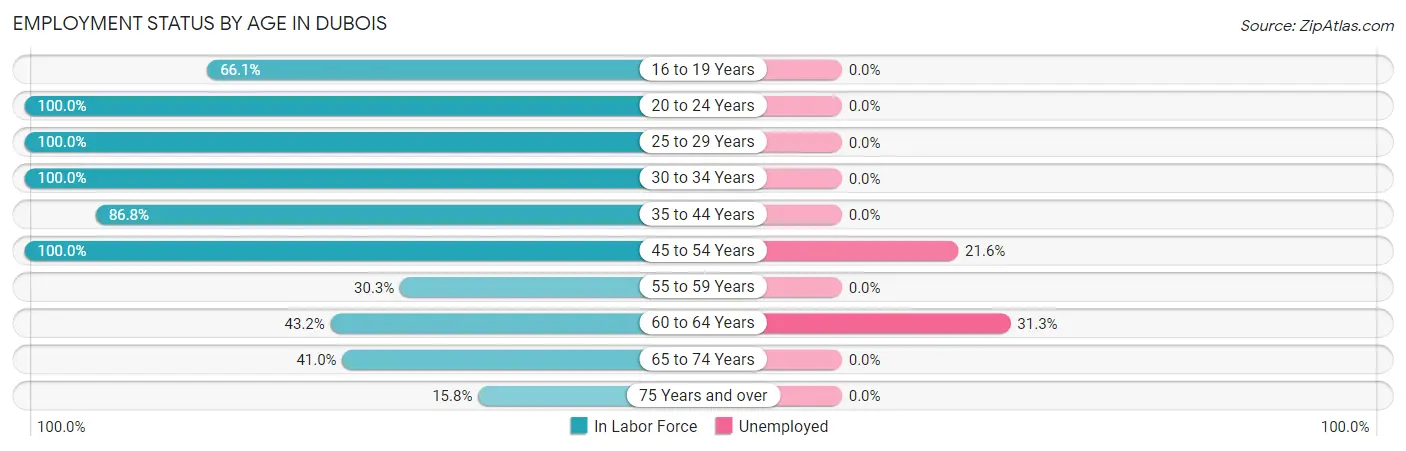
| Age Bracket | In Labor Force | Unemployed |
| 16 to 19 Years | 37 (66.1%) | 0 (0.0%) |
| 20 to 24 Years | 22 (100.0%) | 0 (0.0%) |
| 25 to 29 Years | 53 (100.0%) | 0 (0.0%) |
| 30 to 34 Years | 20 (100.0%) | 0 (0.0%) |
| 35 to 44 Years | 66 (86.8%) | 0 (0.0%) |
| 45 to 54 Years | 51 (100.0%) | 11 (21.6%) |
| 55 to 59 Years | 27 (30.3%) | 0 (0.0%) |
| 60 to 64 Years | 32 (43.2%) | 10 (31.3%) |
| 65 to 74 Years | 64 (41.0%) | 0 (0.0%) |
| 75 Years and over | 9 (15.8%) | 0 (0.0%) |
| Total | 381 (58.3%) | 21 (5.5%) |
Employment Status by Educational Attainment in Dubois
According to labor force statistics for Dubois, 68.6% of individuals (249) out of the total population between 25 and 64 years of age (363) are in the labor force, with 8.4% or 21 of them being unemployed. The group with the highest labor force participation rate are those with the educational attainment of less than high school, with 100.0% or 26 individuals in the labor force. Within the labor force, individuals with college / associate degree education have the highest percentage of unemployment, with 17.2% or 11 of them being unemployed.
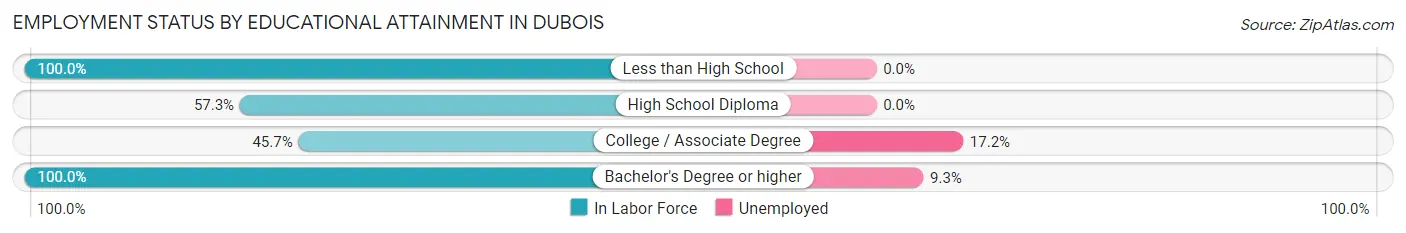
| Educational Attainment | In Labor Force | Unemployed |
| Less than High School | 26 (100.0%) | 0 (0.0%) |
| High School Diploma | 51 (57.3%) | 0 (0.0%) |
| College / Associate Degree | 64 (45.7%) | 24 (17.2%) |
| Bachelor's Degree or higher | 108 (100.0%) | 10 (9.3%) |
| Total | 249 (68.6%) | 30 (8.4%) |
Employment Occupations by Sex in Dubois
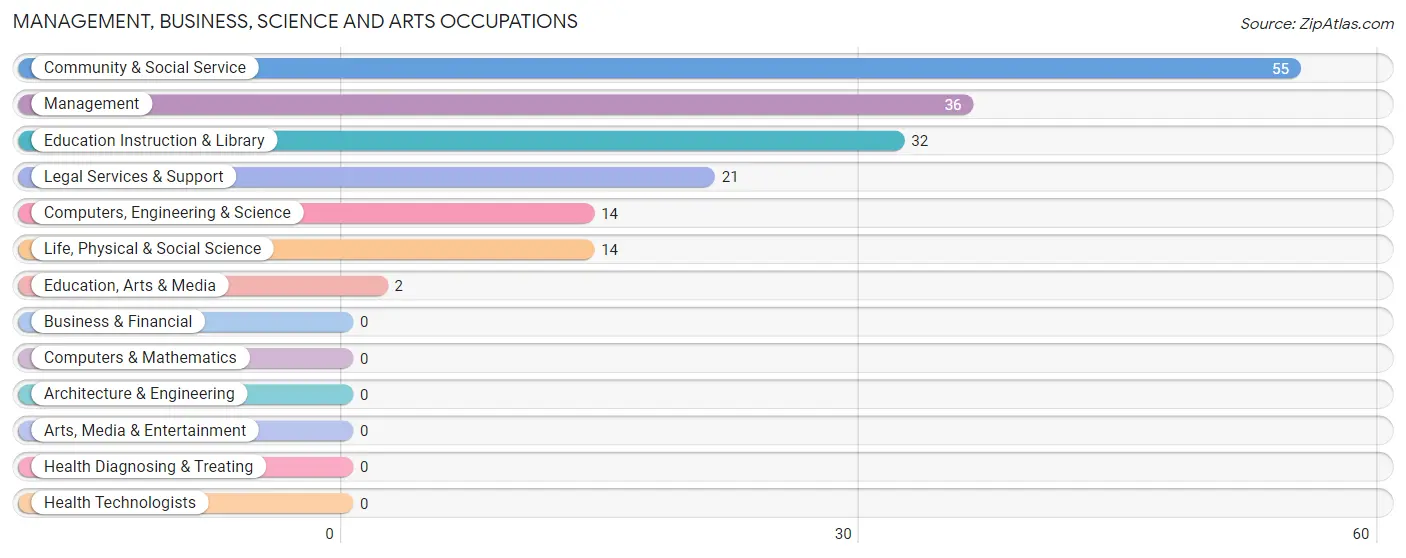
Management, Business, Science and Arts Occupations
The most common Management, Business, Science and Arts occupations in Dubois are Community & Social Service (55 | 15.3%), Management (36 | 10.0%), Education Instruction & Library (32 | 8.9%), Legal Services & Support (21 | 5.8%), and Computers, Engineering & Science (14 | 3.9%).
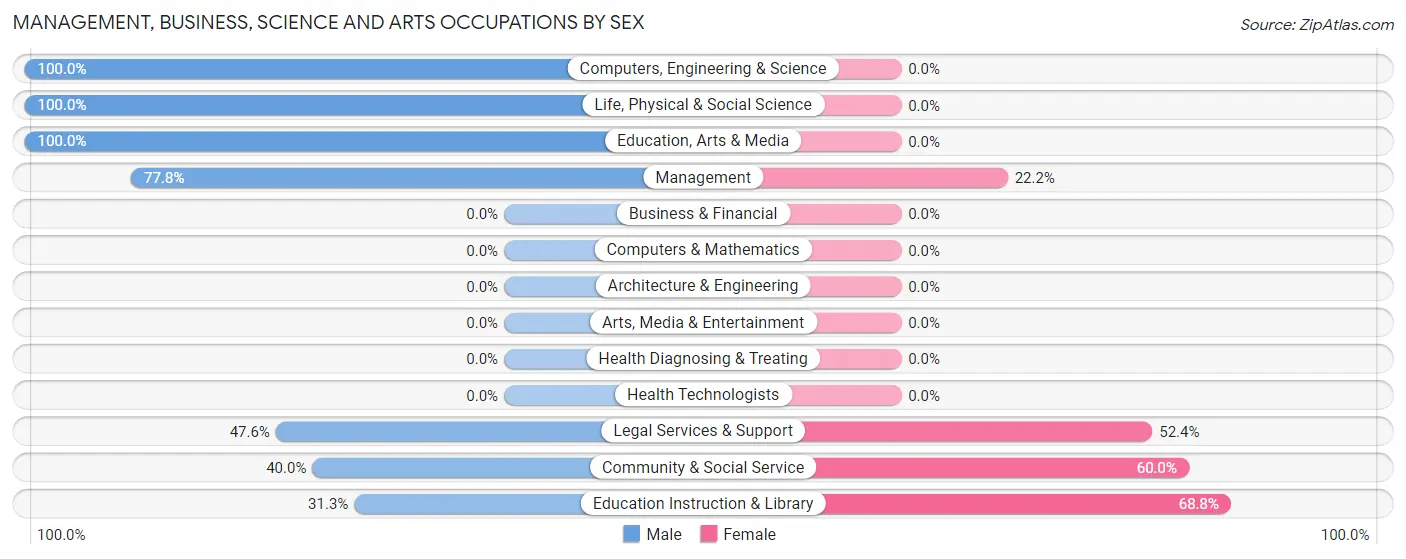
Management, Business, Science and Arts Occupations by Sex
Within the Management, Business, Science and Arts occupations in Dubois, the most male-oriented occupations are Computers, Engineering & Science (100.0%), Life, Physical & Social Science (100.0%), and Education, Arts & Media (100.0%), while the most female-oriented occupations are Education Instruction & Library (68.8%), Community & Social Service (60.0%), and Legal Services & Support (52.4%).
| Occupation | Male | Female |
| Management | 28 (77.8%) | 8 (22.2%) |
| Business & Financial | 0 (0.0%) | 0 (0.0%) |
| Computers, Engineering & Science | 14 (100.0%) | 0 (0.0%) |
| Computers & Mathematics | 0 (0.0%) | 0 (0.0%) |
| Architecture & Engineering | 0 (0.0%) | 0 (0.0%) |
| Life, Physical & Social Science | 14 (100.0%) | 0 (0.0%) |
| Community & Social Service | 22 (40.0%) | 33 (60.0%) |
| Education, Arts & Media | 2 (100.0%) | 0 (0.0%) |
| Legal Services & Support | 10 (47.6%) | 11 (52.4%) |
| Education Instruction & Library | 10 (31.2%) | 22 (68.8%) |
| Arts, Media & Entertainment | 0 (0.0%) | 0 (0.0%) |
| Health Diagnosing & Treating | 0 (0.0%) | 0 (0.0%) |
| Health Technologists | 0 (0.0%) | 0 (0.0%) |
| Total (Category) | 64 (61.0%) | 41 (39.1%) |
| Total (Overall) | 212 (58.9%) | 148 (41.1%) |
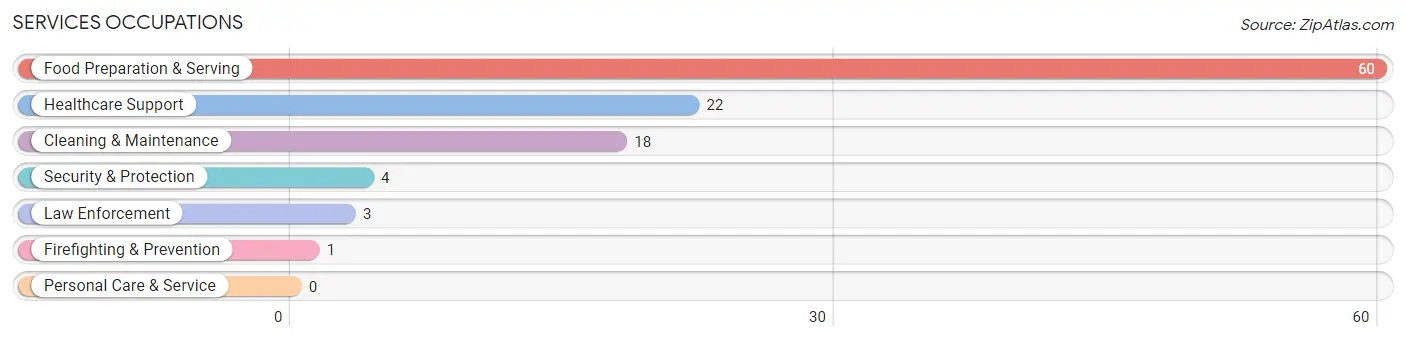
Services Occupations
The most common Services occupations in Dubois are Food Preparation & Serving (60 | 16.7%), Healthcare Support (22 | 6.1%), Cleaning & Maintenance (18 | 5.0%), Security & Protection (4 | 1.1%), and Law Enforcement (3 | 0.8%).
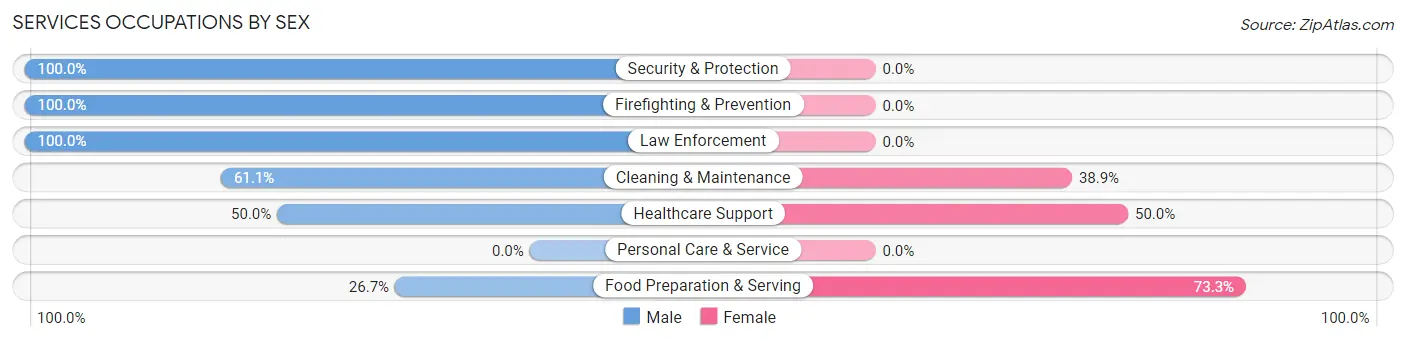
Services Occupations by Sex
Within the Services occupations in Dubois, the most male-oriented occupations are Security & Protection (100.0%), Firefighting & Prevention (100.0%), and Law Enforcement (100.0%), while the most female-oriented occupations are Food Preparation & Serving (73.3%), Healthcare Support (50.0%), and Cleaning & Maintenance (38.9%).
| Occupation | Male | Female |
| Healthcare Support | 11 (50.0%) | 11 (50.0%) |
| Security & Protection | 4 (100.0%) | 0 (0.0%) |
| Firefighting & Prevention | 1 (100.0%) | 0 (0.0%) |
| Law Enforcement | 3 (100.0%) | 0 (0.0%) |
| Food Preparation & Serving | 16 (26.7%) | 44 (73.3%) |
| Cleaning & Maintenance | 11 (61.1%) | 7 (38.9%) |
| Personal Care & Service | 0 (0.0%) | 0 (0.0%) |
| Total (Category) | 42 (40.4%) | 62 (59.6%) |
| Total (Overall) | 212 (58.9%) | 148 (41.1%) |
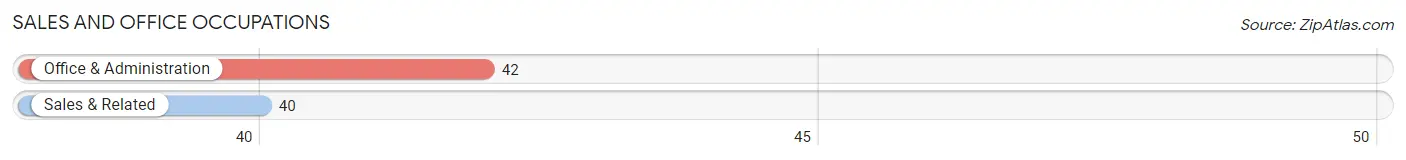
Sales and Office Occupations
The most common Sales and Office occupations in Dubois are Office & Administration (42 | 11.7%), and Sales & Related (40 | 11.1%).
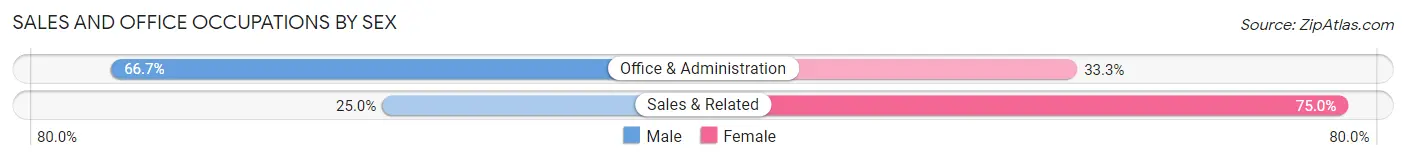
Sales and Office Occupations by Sex
| Occupation | Male | Female |
| Sales & Related | 10 (25.0%) | 30 (75.0%) |
| Office & Administration | 28 (66.7%) | 14 (33.3%) |
| Total (Category) | 38 (46.3%) | 44 (53.7%) |
| Total (Overall) | 212 (58.9%) | 148 (41.1%) |
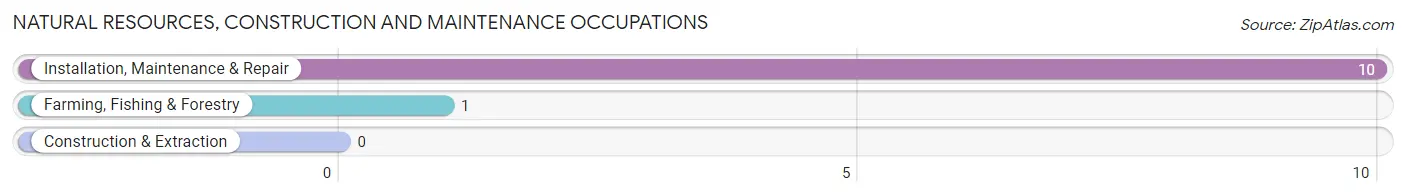
Natural Resources, Construction and Maintenance Occupations
The most common Natural Resources, Construction and Maintenance occupations in Dubois are Installation, Maintenance & Repair (10 | 2.8%), and Farming, Fishing & Forestry (1 | 0.3%).
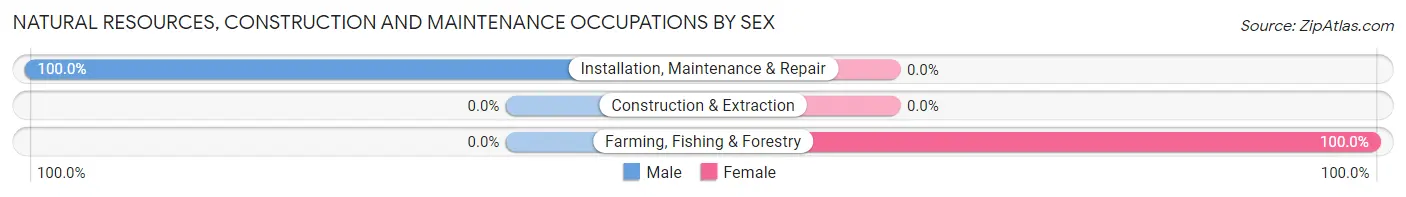
Natural Resources, Construction and Maintenance Occupations by Sex
| Occupation | Male | Female |
| Farming, Fishing & Forestry | 0 (0.0%) | 1 (100.0%) |
| Construction & Extraction | 0 (0.0%) | 0 (0.0%) |
| Installation, Maintenance & Repair | 10 (100.0%) | 0 (0.0%) |
| Total (Category) | 10 (90.9%) | 1 (9.1%) |
| Total (Overall) | 212 (58.9%) | 148 (41.1%) |
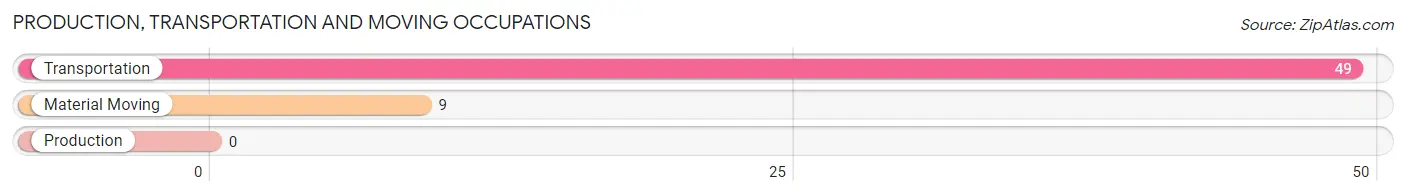
Production, Transportation and Moving Occupations
The most common Production, Transportation and Moving occupations in Dubois are Transportation (49 | 13.6%), and Material Moving (9 | 2.5%).
Production, Transportation and Moving Occupations by Sex
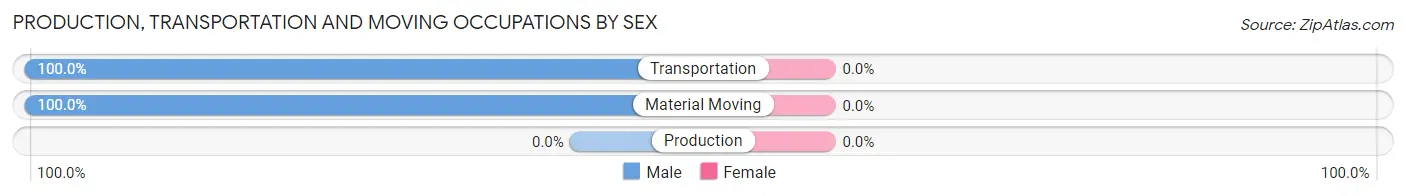
| Occupation | Male | Female |
| Production | 0 (0.0%) | 0 (0.0%) |
| Transportation | 49 (100.0%) | 0 (0.0%) |
| Material Moving | 9 (100.0%) | 0 (0.0%) |
| Total (Category) | 58 (100.0%) | 0 (0.0%) |
| Total (Overall) | 212 (58.9%) | 148 (41.1%) |
Employment Industries by Sex in Dubois
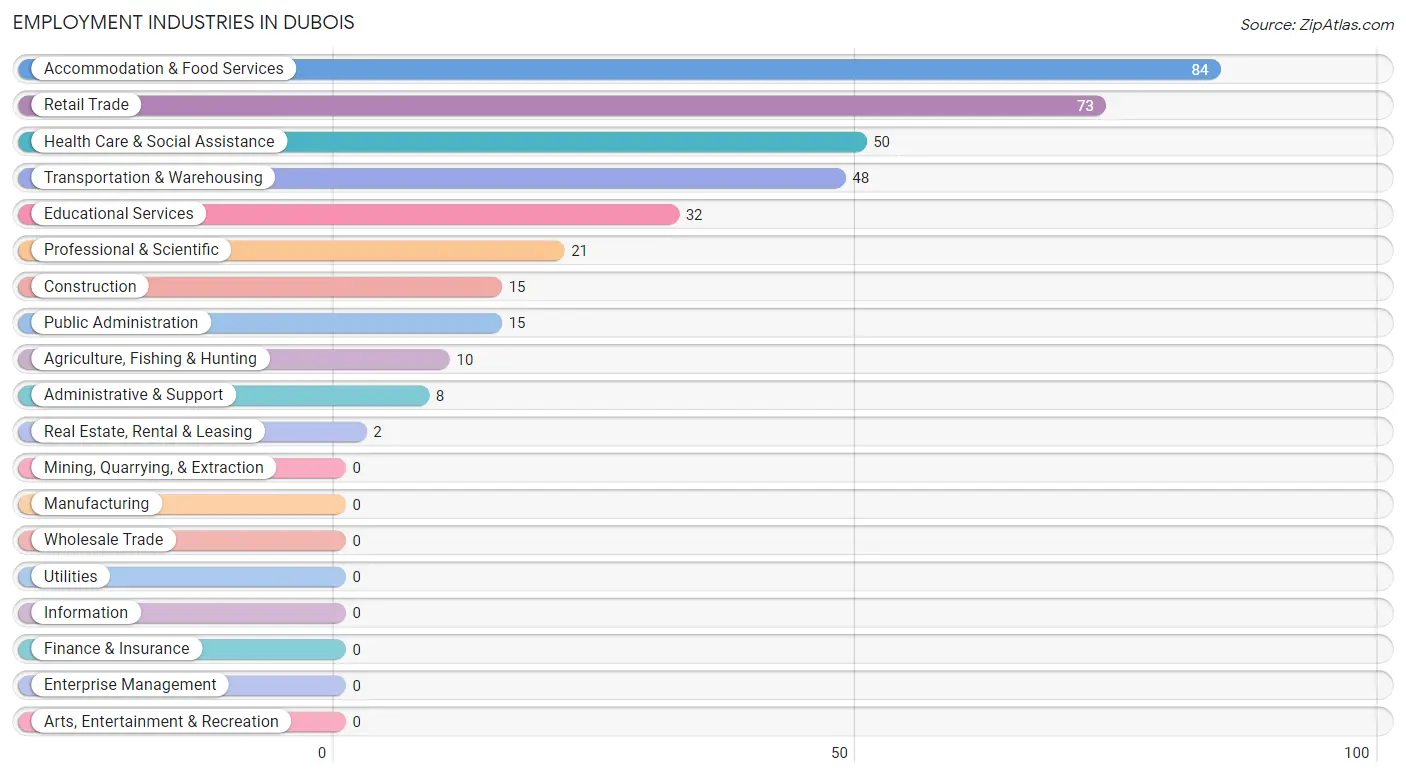
Employment Industries in Dubois
The major employment industries in Dubois include Accommodation & Food Services (84 | 23.3%), Retail Trade (73 | 20.3%), Health Care & Social Assistance (50 | 13.9%), Transportation & Warehousing (48 | 13.3%), and Educational Services (32 | 8.9%).
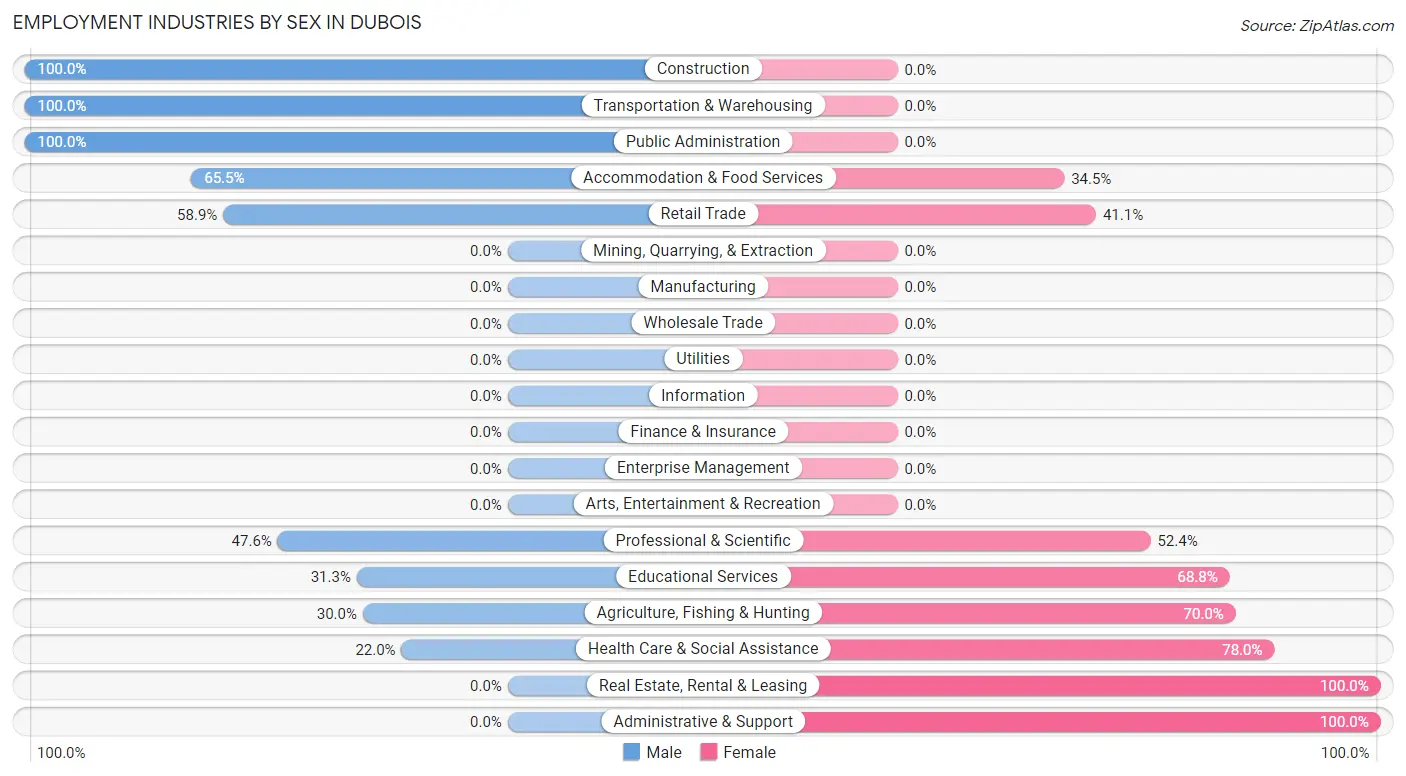
Employment Industries by Sex in Dubois
The Dubois industries that see more men than women are Construction (100.0%), Transportation & Warehousing (100.0%), and Public Administration (100.0%), whereas the industries that tend to have a higher number of women are Real Estate, Rental & Leasing (100.0%), Administrative & Support (100.0%), and Health Care & Social Assistance (78.0%).
| Industry | Male | Female |
| Agriculture, Fishing & Hunting | 3 (30.0%) | 7 (70.0%) |
| Mining, Quarrying, & Extraction | 0 (0.0%) | 0 (0.0%) |
| Construction | 15 (100.0%) | 0 (0.0%) |
| Manufacturing | 0 (0.0%) | 0 (0.0%) |
| Wholesale Trade | 0 (0.0%) | 0 (0.0%) |
| Retail Trade | 43 (58.9%) | 30 (41.1%) |
| Transportation & Warehousing | 48 (100.0%) | 0 (0.0%) |
| Utilities | 0 (0.0%) | 0 (0.0%) |
| Information | 0 (0.0%) | 0 (0.0%) |
| Finance & Insurance | 0 (0.0%) | 0 (0.0%) |
| Real Estate, Rental & Leasing | 0 (0.0%) | 2 (100.0%) |
| Professional & Scientific | 10 (47.6%) | 11 (52.4%) |
| Enterprise Management | 0 (0.0%) | 0 (0.0%) |
| Administrative & Support | 0 (0.0%) | 8 (100.0%) |
| Educational Services | 10 (31.2%) | 22 (68.8%) |
| Health Care & Social Assistance | 11 (22.0%) | 39 (78.0%) |
| Arts, Entertainment & Recreation | 0 (0.0%) | 0 (0.0%) |
| Accommodation & Food Services | 55 (65.5%) | 29 (34.5%) |
| Public Administration | 15 (100.0%) | 0 (0.0%) |
| Total | 212 (58.9%) | 148 (41.1%) |
Education in Dubois
School Enrollment in Dubois
The most common levels of schooling among the 115 students in Dubois are high school (44 | 38.3%), elementary school (33 | 28.7%), and middle school (22 | 19.1%).
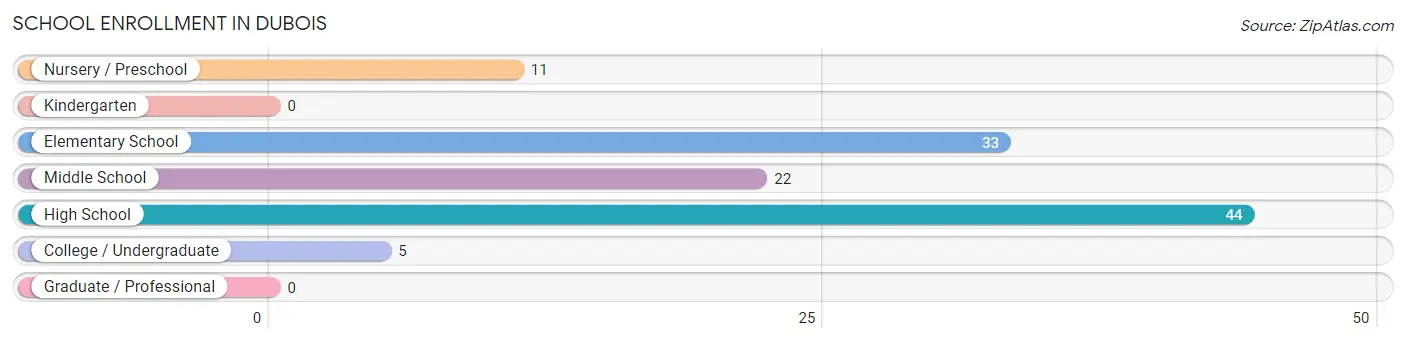
| School Level | # Students | % Students |
| Nursery / Preschool | 11 | 9.6% |
| Kindergarten | 0 | 0.0% |
| Elementary School | 33 | 28.7% |
| Middle School | 22 | 19.1% |
| High School | 44 | 38.3% |
| College / Undergraduate | 5 | 4.3% |
| Graduate / Professional | 0 | 0.0% |
| Total | 115 | 100.0% |
School Enrollment by Age by Funding Source in Dubois
Out of a total of 115 students who are enrolled in schools in Dubois, 1 (0.9%) attend a private institution, while the remaining 114 (99.1%) are enrolled in public schools. The age group of 20 to 24 year olds has the highest likelihood of being enrolled in private schools, with 1 (100.0% in the age bracket) enrolled. Conversely, the age group of 5 to 9 year old has the lowest likelihood of being enrolled in a private school, with 44 (100.0% in the age bracket) attending a public institution.
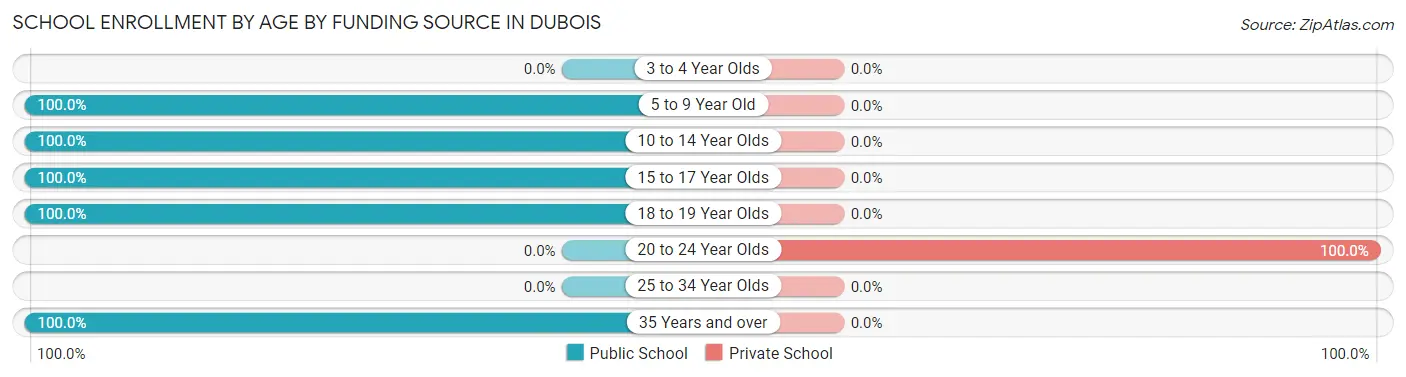
| Age Bracket | Public School | Private School |
| 3 to 4 Year Olds | 0 (0.0%) | 0 (0.0%) |
| 5 to 9 Year Old | 44 (100.0%) | 0 (0.0%) |
| 10 to 14 Year Olds | 22 (100.0%) | 0 (0.0%) |
| 15 to 17 Year Olds | 16 (100.0%) | 0 (0.0%) |
| 18 to 19 Year Olds | 28 (100.0%) | 0 (0.0%) |
| 20 to 24 Year Olds | 0 (0.0%) | 1 (100.0%) |
| 25 to 34 Year Olds | 0 (0.0%) | 0 (0.0%) |
| 35 Years and over | 4 (100.0%) | 0 (0.0%) |
| Total | 114 (99.1%) | 1 (0.9%) |
Educational Attainment by Field of Study in Dubois
Liberal arts & history (34 | 16.0%), visual & performing arts (28 | 13.2%), computers & mathematics (24 | 11.3%), bio, nature & agricultural (24 | 11.3%), and physical & health sciences (20 | 9.4%) are the most common fields of study among 212 individuals in Dubois who have obtained a bachelor's degree or higher.
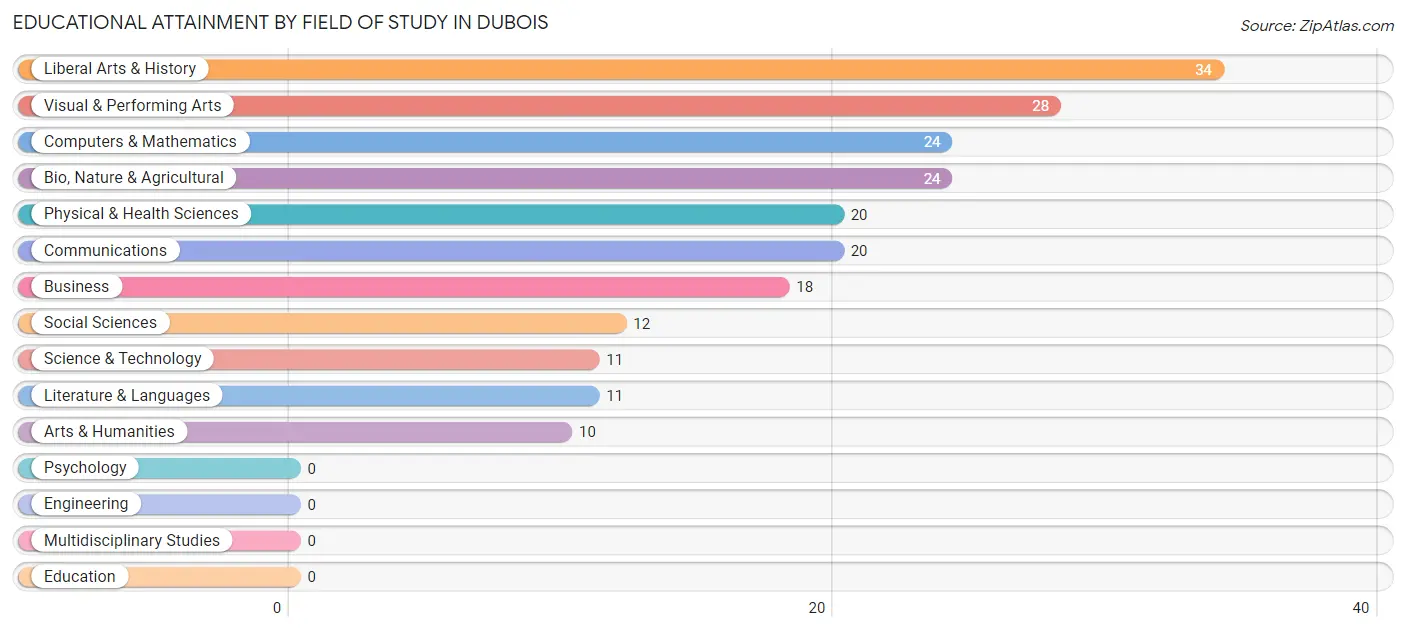
| Field of Study | # Graduates | % Graduates |
| Computers & Mathematics | 24 | 11.3% |
| Bio, Nature & Agricultural | 24 | 11.3% |
| Physical & Health Sciences | 20 | 9.4% |
| Psychology | 0 | 0.0% |
| Social Sciences | 12 | 5.7% |
| Engineering | 0 | 0.0% |
| Multidisciplinary Studies | 0 | 0.0% |
| Science & Technology | 11 | 5.2% |
| Business | 18 | 8.5% |
| Education | 0 | 0.0% |
| Literature & Languages | 11 | 5.2% |
| Liberal Arts & History | 34 | 16.0% |
| Visual & Performing Arts | 28 | 13.2% |
| Communications | 20 | 9.4% |
| Arts & Humanities | 10 | 4.7% |
| Total | 212 | 100.0% |
Transportation & Commute in Dubois
Vehicle Availability by Sex in Dubois
The most prevalent vehicle ownership categories in Dubois are males with 2 vehicles (63, accounting for 30.3%) and females with 2 vehicles (102, making up 43.1%).
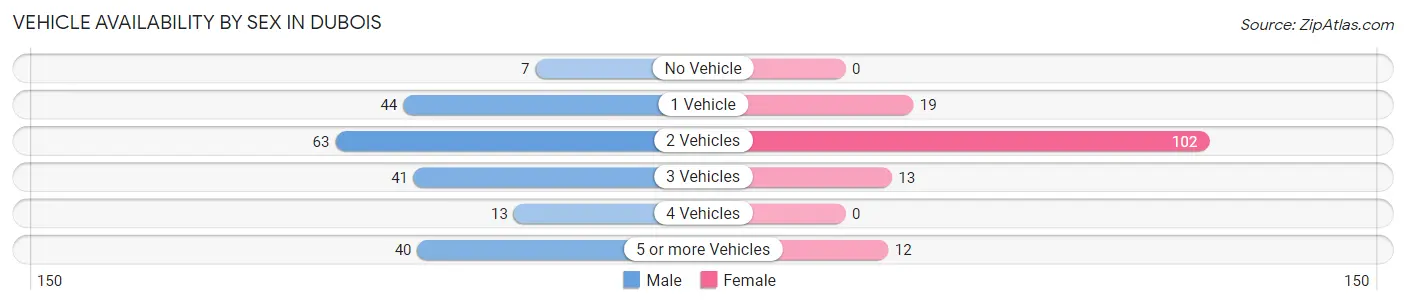
| Vehicles Available | Male | Female |
| No Vehicle | 7 (3.4%) | 0 (0.0%) |
| 1 Vehicle | 44 (21.1%) | 19 (13.0%) |
| 2 Vehicles | 63 (30.3%) | 102 (69.9%) |
| 3 Vehicles | 41 (19.7%) | 13 (8.9%) |
| 4 Vehicles | 13 (6.2%) | 0 (0.0%) |
| 5 or more Vehicles | 40 (19.2%) | 12 (8.2%) |
| Total | 208 (100.0%) | 146 (100.0%) |
Commute Time in Dubois
The most frequently occuring commute durations in Dubois are 5 to 9 minutes (125 commuters, 38.9%), less than 5 minutes (58 commuters, 18.1%), and 10 to 14 minutes (39 commuters, 12.1%).
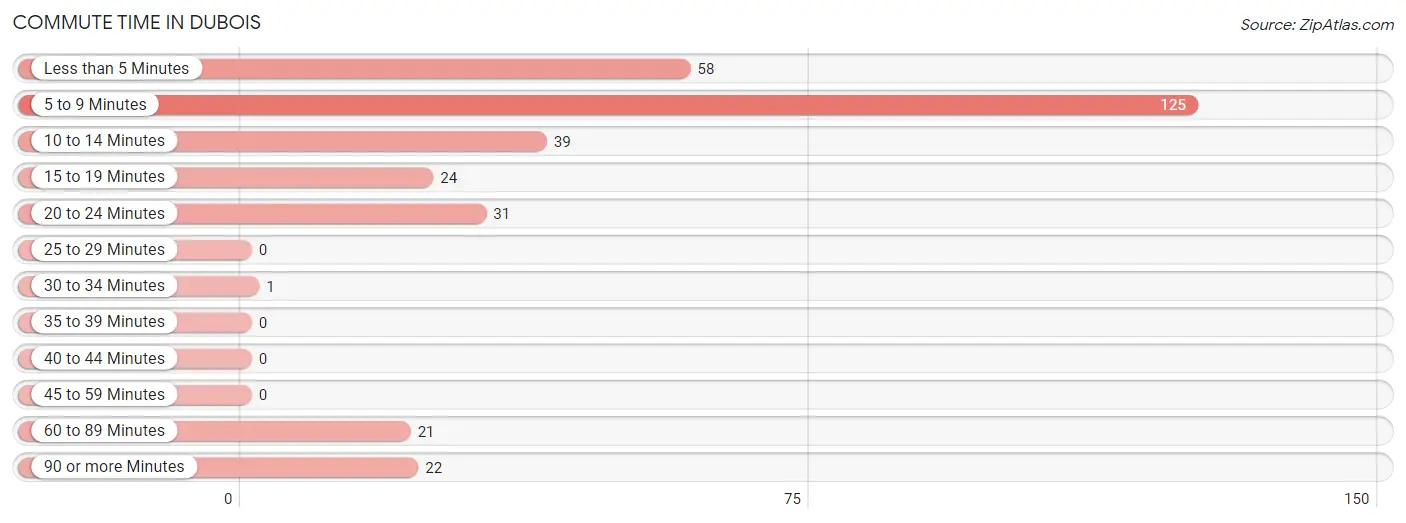
| Commute Time | # Commuters | % Commuters |
| Less than 5 Minutes | 58 | 18.1% |
| 5 to 9 Minutes | 125 | 38.9% |
| 10 to 14 Minutes | 39 | 12.1% |
| 15 to 19 Minutes | 24 | 7.5% |
| 20 to 24 Minutes | 31 | 9.7% |
| 25 to 29 Minutes | 0 | 0.0% |
| 30 to 34 Minutes | 1 | 0.3% |
| 35 to 39 Minutes | 0 | 0.0% |
| 40 to 44 Minutes | 0 | 0.0% |
| 45 to 59 Minutes | 0 | 0.0% |
| 60 to 89 Minutes | 21 | 6.5% |
| 90 or more Minutes | 22 | 6.9% |
Commute Time by Sex in Dubois
The most common commute times in Dubois are 5 to 9 minutes (62 commuters, 29.4%) for males and 5 to 9 minutes (63 commuters, 57.3%) for females.
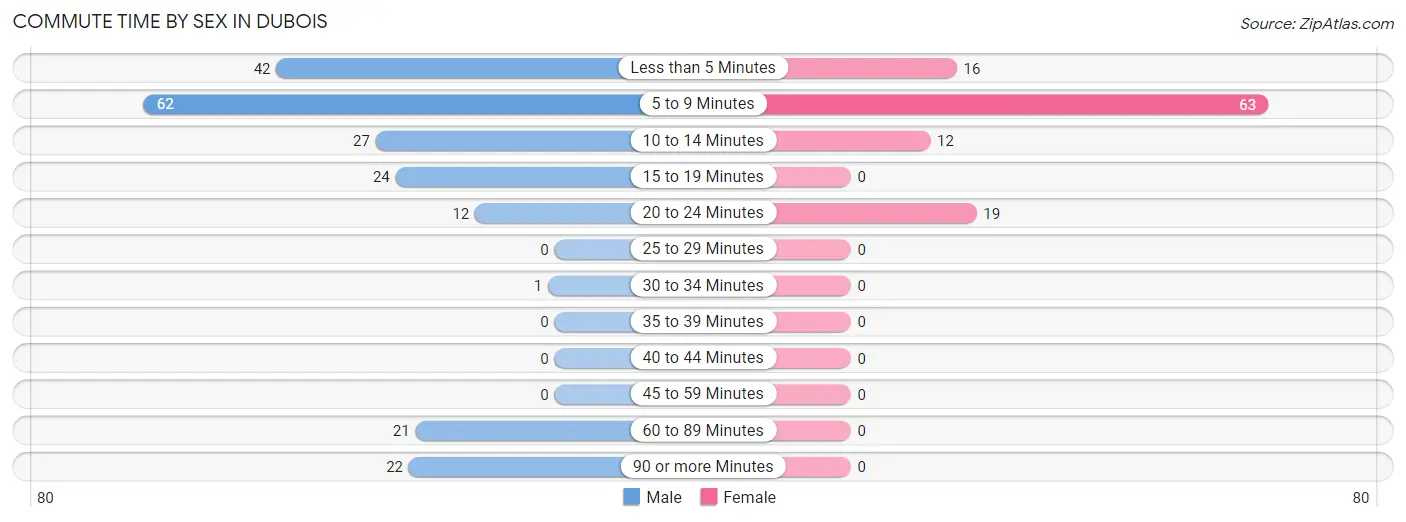
| Commute Time | Male | Female |
| Less than 5 Minutes | 42 (19.9%) | 16 (14.5%) |
| 5 to 9 Minutes | 62 (29.4%) | 63 (57.3%) |
| 10 to 14 Minutes | 27 (12.8%) | 12 (10.9%) |
| 15 to 19 Minutes | 24 (11.4%) | 0 (0.0%) |
| 20 to 24 Minutes | 12 (5.7%) | 19 (17.3%) |
| 25 to 29 Minutes | 0 (0.0%) | 0 (0.0%) |
| 30 to 34 Minutes | 1 (0.5%) | 0 (0.0%) |
| 35 to 39 Minutes | 0 (0.0%) | 0 (0.0%) |
| 40 to 44 Minutes | 0 (0.0%) | 0 (0.0%) |
| 45 to 59 Minutes | 0 (0.0%) | 0 (0.0%) |
| 60 to 89 Minutes | 21 (10.0%) | 0 (0.0%) |
| 90 or more Minutes | 22 (10.4%) | 0 (0.0%) |
Time of Departure to Work by Sex in Dubois
The most frequent times of departure to work in Dubois are 7:00 AM to 7:29 AM (49, 23.2%) for males and 12:00 PM to 3:59 PM (29, 26.4%) for females.
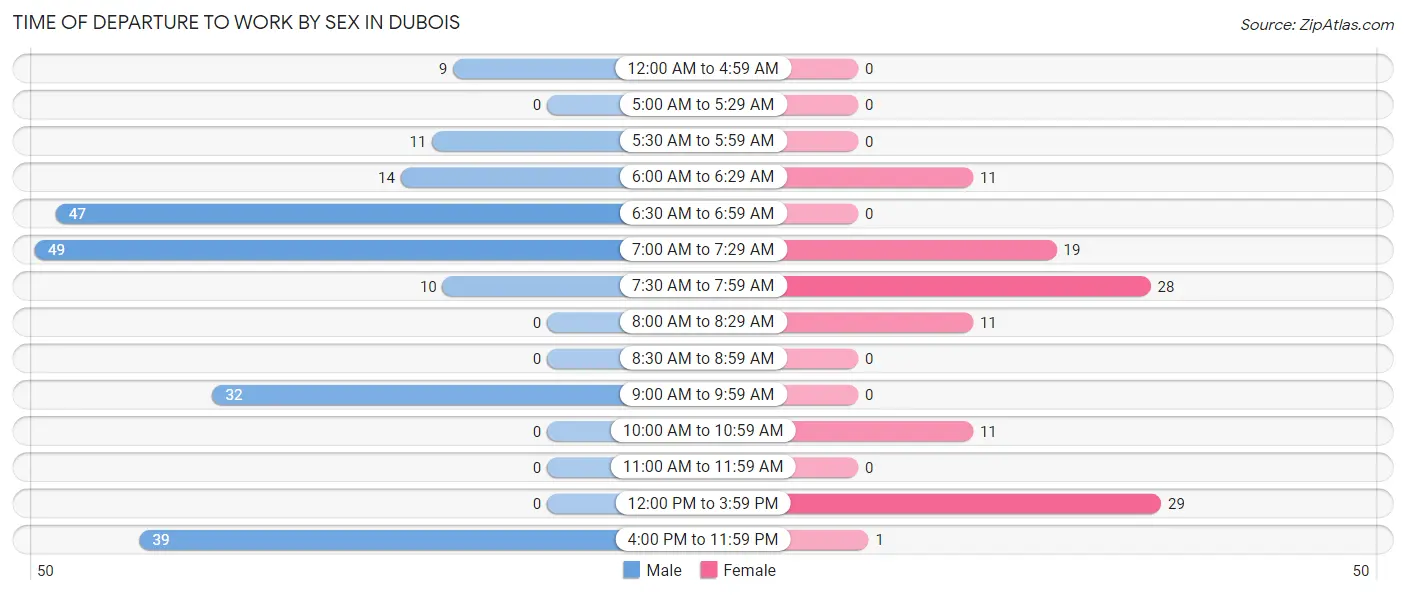
| Time of Departure | Male | Female |
| 12:00 AM to 4:59 AM | 9 (4.3%) | 0 (0.0%) |
| 5:00 AM to 5:29 AM | 0 (0.0%) | 0 (0.0%) |
| 5:30 AM to 5:59 AM | 11 (5.2%) | 0 (0.0%) |
| 6:00 AM to 6:29 AM | 14 (6.6%) | 11 (10.0%) |
| 6:30 AM to 6:59 AM | 47 (22.3%) | 0 (0.0%) |
| 7:00 AM to 7:29 AM | 49 (23.2%) | 19 (17.3%) |
| 7:30 AM to 7:59 AM | 10 (4.7%) | 28 (25.5%) |
| 8:00 AM to 8:29 AM | 0 (0.0%) | 11 (10.0%) |
| 8:30 AM to 8:59 AM | 0 (0.0%) | 0 (0.0%) |
| 9:00 AM to 9:59 AM | 32 (15.2%) | 0 (0.0%) |
| 10:00 AM to 10:59 AM | 0 (0.0%) | 11 (10.0%) |
| 11:00 AM to 11:59 AM | 0 (0.0%) | 0 (0.0%) |
| 12:00 PM to 3:59 PM | 0 (0.0%) | 29 (26.4%) |
| 4:00 PM to 11:59 PM | 39 (18.5%) | 1 (0.9%) |
| Total | 211 (100.0%) | 110 (100.0%) |
Housing Occupancy in Dubois
Occupancy by Ownership in Dubois
Of the total 401 dwellings in Dubois, owner-occupied units account for 264 (65.8%), while renter-occupied units make up 137 (34.2%).
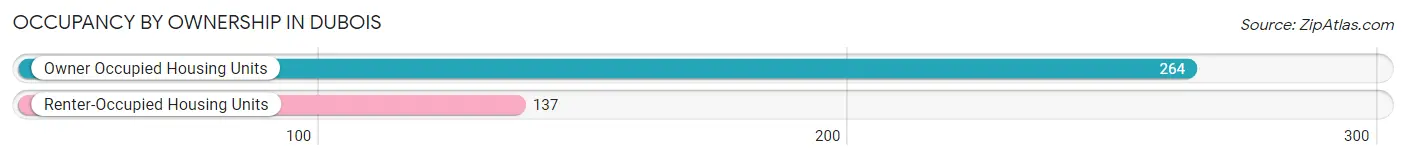
| Occupancy | # Housing Units | % Housing Units |
| Owner Occupied Housing Units | 264 | 65.8% |
| Renter-Occupied Housing Units | 137 | 34.2% |
| Total Occupied Housing Units | 401 | 100.0% |
Occupancy by Household Size in Dubois
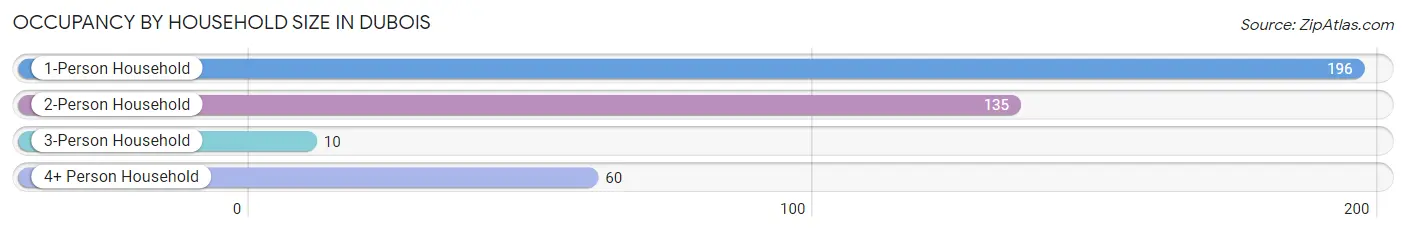
| Household Size | # Housing Units | % Housing Units |
| 1-Person Household | 196 | 48.9% |
| 2-Person Household | 135 | 33.7% |
| 3-Person Household | 10 | 2.5% |
| 4+ Person Household | 60 | 15.0% |
| Total Housing Units | 401 | 100.0% |
Occupancy by Ownership by Household Size in Dubois
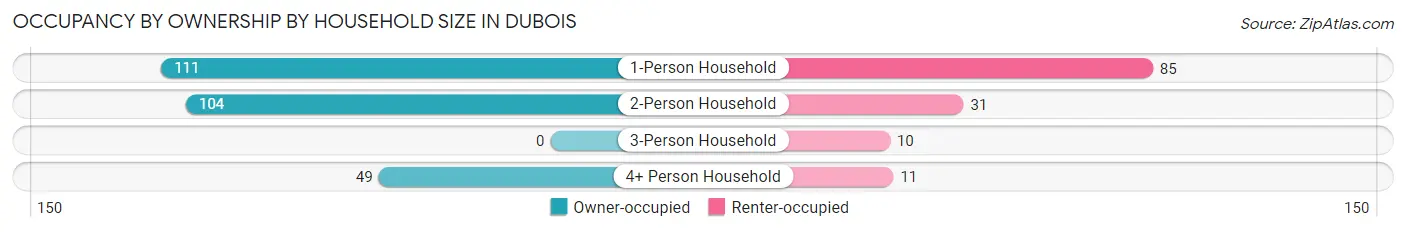
| Household Size | Owner-occupied | Renter-occupied |
| 1-Person Household | 111 (56.6%) | 85 (43.4%) |
| 2-Person Household | 104 (77.0%) | 31 (23.0%) |
| 3-Person Household | 0 (0.0%) | 10 (100.0%) |
| 4+ Person Household | 49 (81.7%) | 11 (18.3%) |
| Total Housing Units | 264 (65.8%) | 137 (34.2%) |
Occupancy by Educational Attainment in Dubois
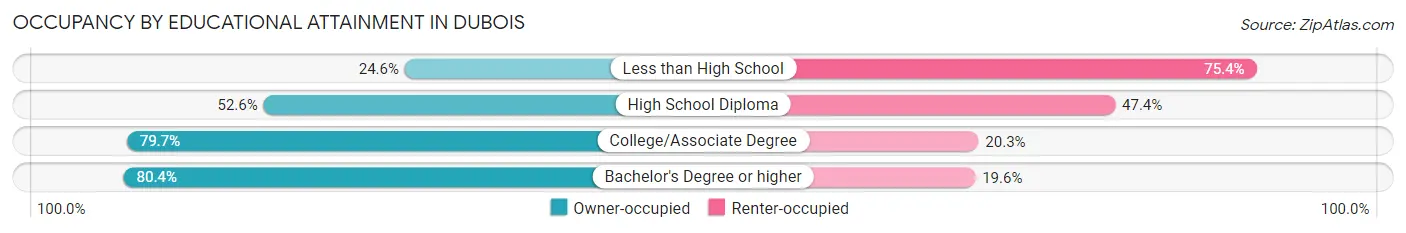
| Household Size | Owner-occupied | Renter-occupied |
| Less than High School | 16 (24.6%) | 49 (75.4%) |
| High School Diploma | 40 (52.6%) | 36 (47.4%) |
| College/Associate Degree | 118 (79.7%) | 30 (20.3%) |
| Bachelor's Degree or higher | 90 (80.4%) | 22 (19.6%) |
Occupancy by Age of Householder in Dubois
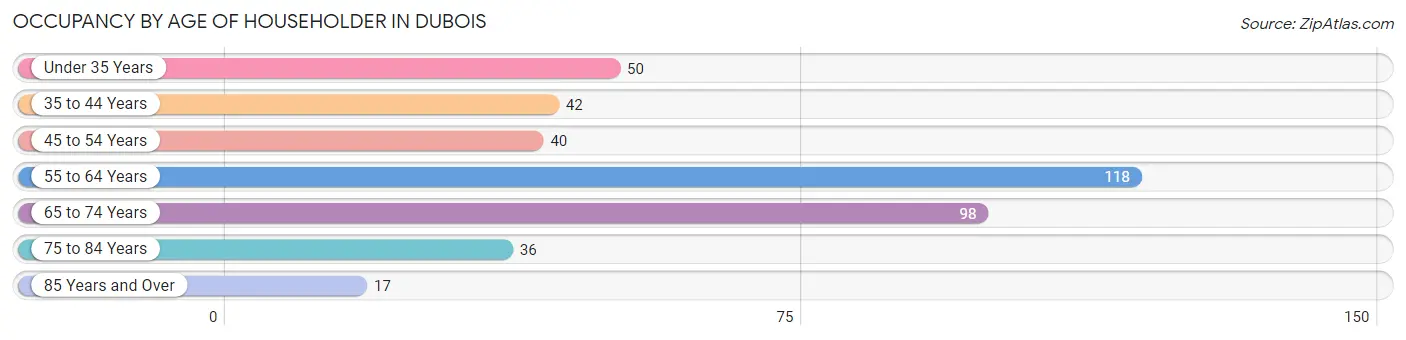
| Age Bracket | # Households | % Households |
| Under 35 Years | 50 | 12.5% |
| 35 to 44 Years | 42 | 10.5% |
| 45 to 54 Years | 40 | 10.0% |
| 55 to 64 Years | 118 | 29.4% |
| 65 to 74 Years | 98 | 24.4% |
| 75 to 84 Years | 36 | 9.0% |
| 85 Years and Over | 17 | 4.2% |
| Total | 401 | 100.0% |
Housing Finances in Dubois
Median Income by Occupancy in Dubois
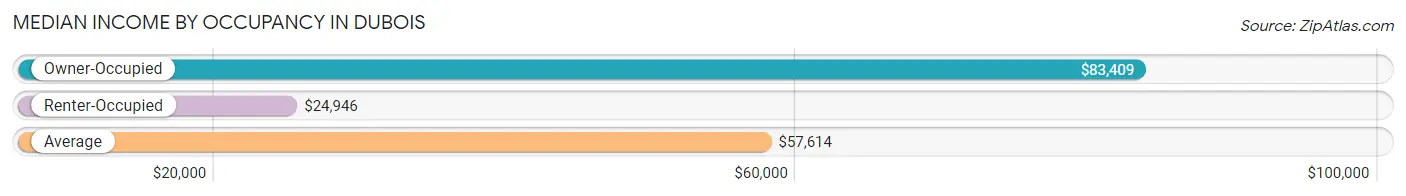
| Occupancy Type | # Households | Median Income |
| Owner-Occupied | 264 (65.8%) | $83,409 |
| Renter-Occupied | 137 (34.2%) | $24,946 |
| Average | 401 (100.0%) | $57,614 |
Occupancy by Householder Income Bracket in Dubois
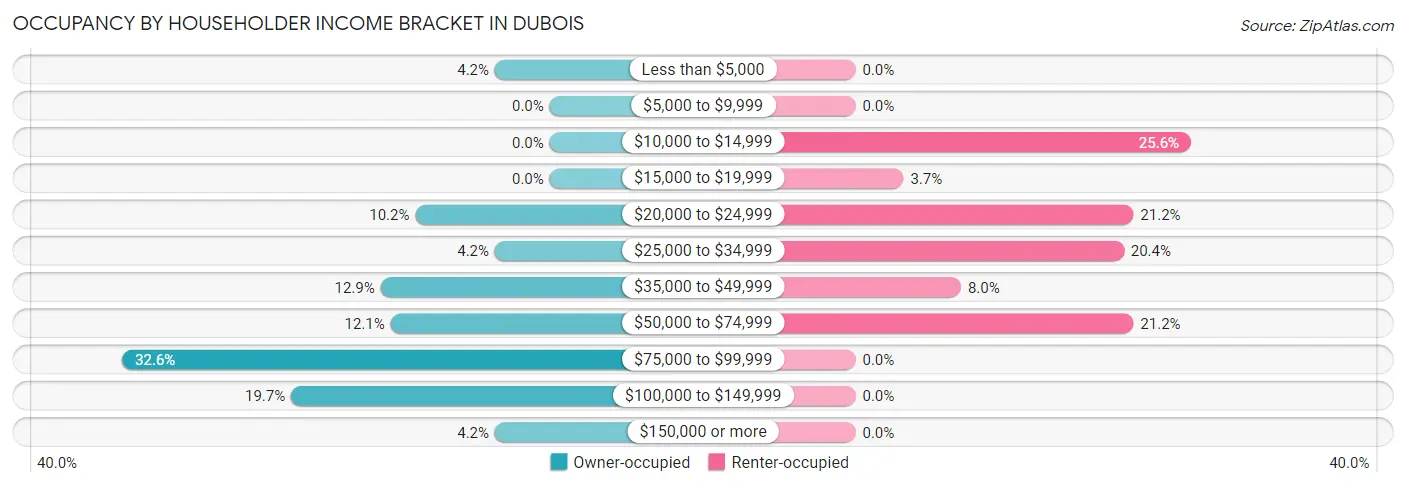
| Income Bracket | Owner-occupied | Renter-occupied |
| Less than $5,000 | 11 (4.2%) | 0 (0.0%) |
| $5,000 to $9,999 | 0 (0.0%) | 0 (0.0%) |
| $10,000 to $14,999 | 0 (0.0%) | 35 (25.6%) |
| $15,000 to $19,999 | 0 (0.0%) | 5 (3.6%) |
| $20,000 to $24,999 | 27 (10.2%) | 29 (21.2%) |
| $25,000 to $34,999 | 11 (4.2%) | 28 (20.4%) |
| $35,000 to $49,999 | 34 (12.9%) | 11 (8.0%) |
| $50,000 to $74,999 | 32 (12.1%) | 29 (21.2%) |
| $75,000 to $99,999 | 86 (32.6%) | 0 (0.0%) |
| $100,000 to $149,999 | 52 (19.7%) | 0 (0.0%) |
| $150,000 or more | 11 (4.2%) | 0 (0.0%) |
| Total | 264 (100.0%) | 137 (100.0%) |
Monthly Housing Cost Tiers in Dubois
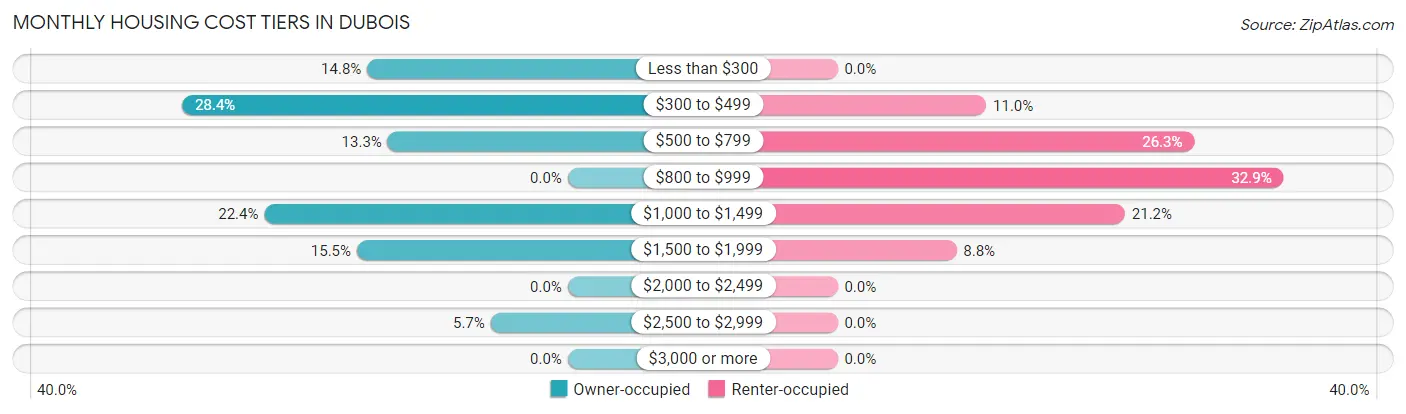
| Monthly Cost | Owner-occupied | Renter-occupied |
| Less than $300 | 39 (14.8%) | 0 (0.0%) |
| $300 to $499 | 75 (28.4%) | 15 (11.0%) |
| $500 to $799 | 35 (13.3%) | 36 (26.3%) |
| $800 to $999 | 0 (0.0%) | 45 (32.9%) |
| $1,000 to $1,499 | 59 (22.4%) | 29 (21.2%) |
| $1,500 to $1,999 | 41 (15.5%) | 12 (8.8%) |
| $2,000 to $2,499 | 0 (0.0%) | 0 (0.0%) |
| $2,500 to $2,999 | 15 (5.7%) | 0 (0.0%) |
| $3,000 or more | 0 (0.0%) | 0 (0.0%) |
| Total | 264 (100.0%) | 137 (100.0%) |
Physical Housing Characteristics in Dubois
Housing Structures in Dubois
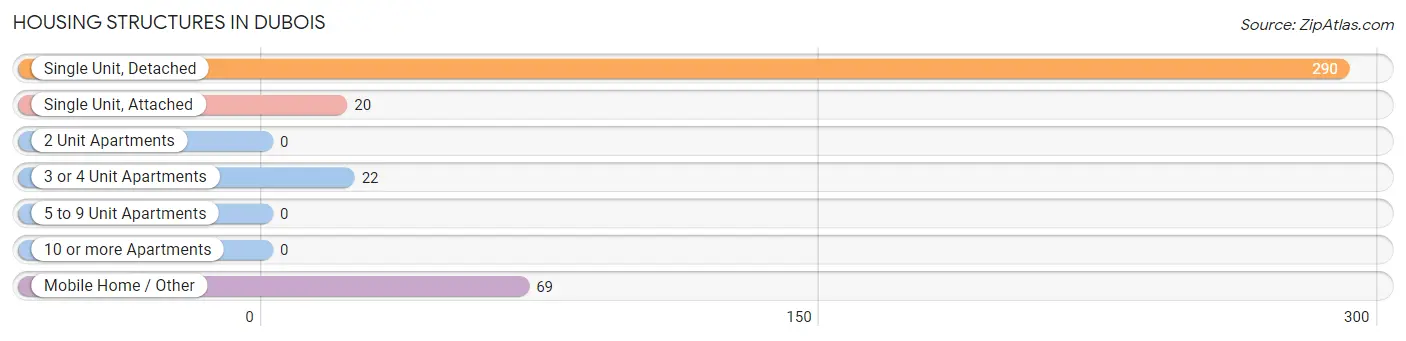
| Structure Type | # Housing Units | % Housing Units |
| Single Unit, Detached | 290 | 72.3% |
| Single Unit, Attached | 20 | 5.0% |
| 2 Unit Apartments | 0 | 0.0% |
| 3 or 4 Unit Apartments | 22 | 5.5% |
| 5 to 9 Unit Apartments | 0 | 0.0% |
| 10 or more Apartments | 0 | 0.0% |
| Mobile Home / Other | 69 | 17.2% |
| Total | 401 | 100.0% |
Housing Structures by Occupancy in Dubois
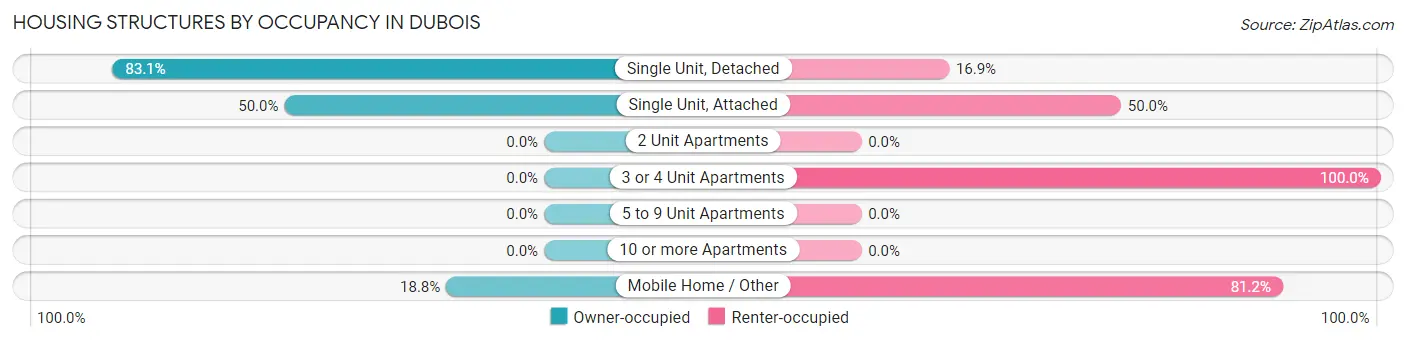
| Structure Type | Owner-occupied | Renter-occupied |
| Single Unit, Detached | 241 (83.1%) | 49 (16.9%) |
| Single Unit, Attached | 10 (50.0%) | 10 (50.0%) |
| 2 Unit Apartments | 0 (0.0%) | 0 (0.0%) |
| 3 or 4 Unit Apartments | 0 (0.0%) | 22 (100.0%) |
| 5 to 9 Unit Apartments | 0 (0.0%) | 0 (0.0%) |
| 10 or more Apartments | 0 (0.0%) | 0 (0.0%) |
| Mobile Home / Other | 13 (18.8%) | 56 (81.2%) |
| Total | 264 (65.8%) | 137 (34.2%) |
Housing Structures by Number of Rooms in Dubois
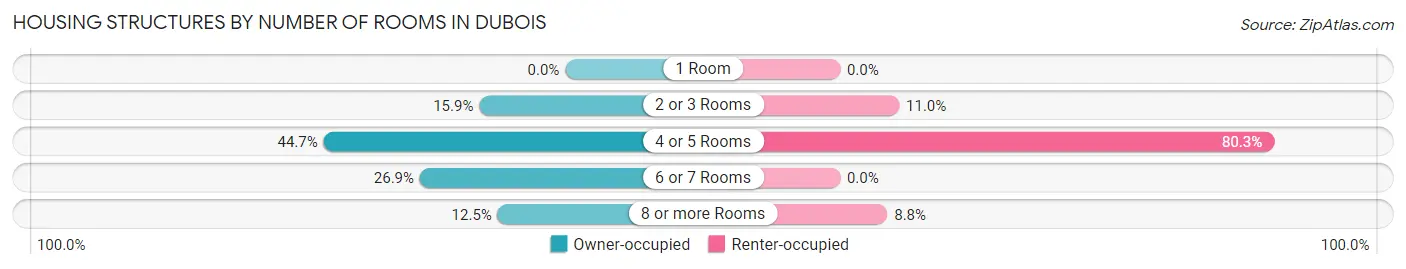
| Number of Rooms | Owner-occupied | Renter-occupied |
| 1 Room | 0 (0.0%) | 0 (0.0%) |
| 2 or 3 Rooms | 42 (15.9%) | 15 (11.0%) |
| 4 or 5 Rooms | 118 (44.7%) | 110 (80.3%) |
| 6 or 7 Rooms | 71 (26.9%) | 0 (0.0%) |
| 8 or more Rooms | 33 (12.5%) | 12 (8.8%) |
| Total | 264 (100.0%) | 137 (100.0%) |
Housing Structure by Heating Type in Dubois
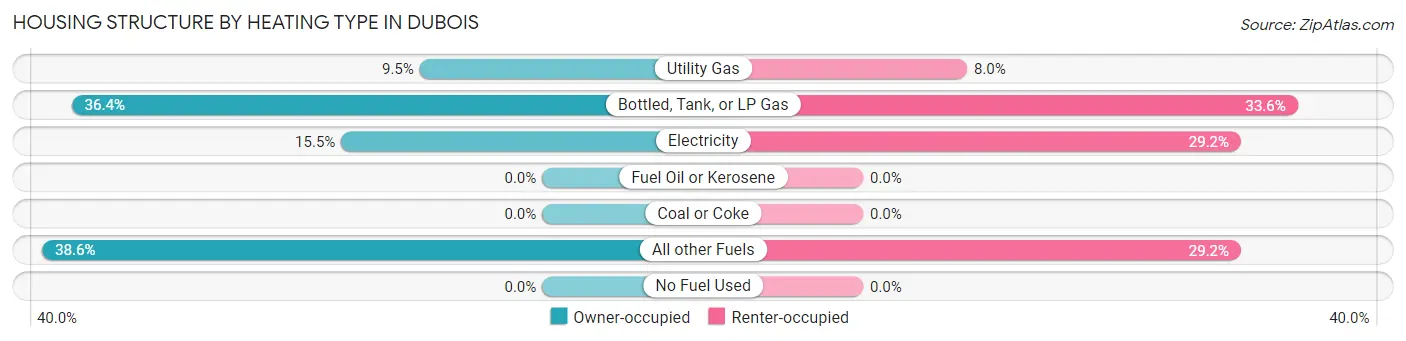
| Heating Type | Owner-occupied | Renter-occupied |
| Utility Gas | 25 (9.5%) | 11 (8.0%) |
| Bottled, Tank, or LP Gas | 96 (36.4%) | 46 (33.6%) |
| Electricity | 41 (15.5%) | 40 (29.2%) |
| Fuel Oil or Kerosene | 0 (0.0%) | 0 (0.0%) |
| Coal or Coke | 0 (0.0%) | 0 (0.0%) |
| All other Fuels | 102 (38.6%) | 40 (29.2%) |
| No Fuel Used | 0 (0.0%) | 0 (0.0%) |
| Total | 264 (100.0%) | 137 (100.0%) |
Household Vehicle Usage in Dubois
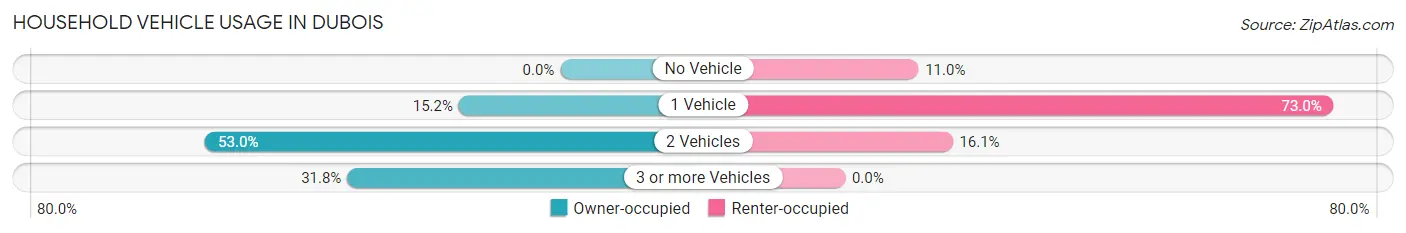
| Vehicles per Household | Owner-occupied | Renter-occupied |
| No Vehicle | 0 (0.0%) | 15 (11.0%) |
| 1 Vehicle | 40 (15.1%) | 100 (73.0%) |
| 2 Vehicles | 140 (53.0%) | 22 (16.1%) |
| 3 or more Vehicles | 84 (31.8%) | 0 (0.0%) |
| Total | 264 (100.0%) | 137 (100.0%) |
Real Estate & Mortgages in Dubois
Real Estate and Mortgage Overview in Dubois
| Characteristic | Without Mortgage | With Mortgage |
| Housing Units | 131 | 133 |
| Median Property Value | $207,600 | $211,200 |
| Median Household Income | $79,107 | $11 |
| Monthly Housing Costs | $384 | $0 |
| Real Estate Taxes | $1,227 | $0 |
Property Value by Mortgage Status in Dubois
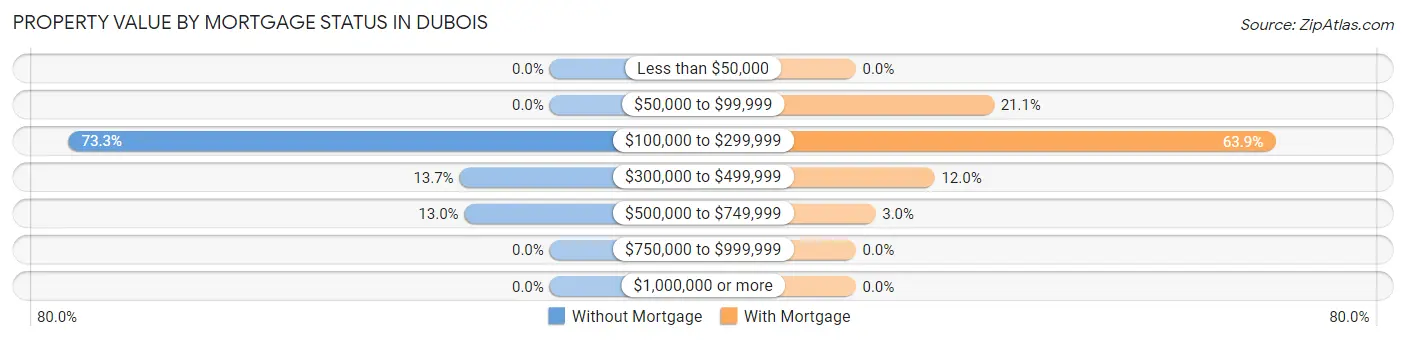
| Property Value | Without Mortgage | With Mortgage |
| Less than $50,000 | 0 (0.0%) | 0 (0.0%) |
| $50,000 to $99,999 | 0 (0.0%) | 28 (21.0%) |
| $100,000 to $299,999 | 96 (73.3%) | 85 (63.9%) |
| $300,000 to $499,999 | 18 (13.7%) | 16 (12.0%) |
| $500,000 to $749,999 | 17 (13.0%) | 4 (3.0%) |
| $750,000 to $999,999 | 0 (0.0%) | 0 (0.0%) |
| $1,000,000 or more | 0 (0.0%) | 0 (0.0%) |
| Total | 131 (100.0%) | 133 (100.0%) |
Household Income by Mortgage Status in Dubois
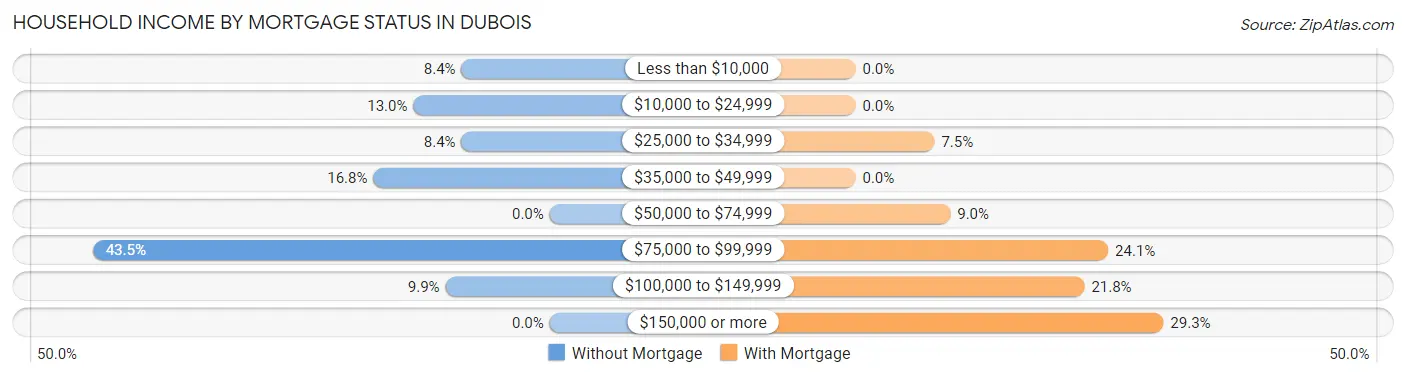
| Household Income | Without Mortgage | With Mortgage |
| Less than $10,000 | 11 (8.4%) | 0 (0.0%) |
| $10,000 to $24,999 | 17 (13.0%) | 0 (0.0%) |
| $25,000 to $34,999 | 11 (8.4%) | 10 (7.5%) |
| $35,000 to $49,999 | 22 (16.8%) | 0 (0.0%) |
| $50,000 to $74,999 | 0 (0.0%) | 12 (9.0%) |
| $75,000 to $99,999 | 57 (43.5%) | 32 (24.1%) |
| $100,000 to $149,999 | 13 (9.9%) | 29 (21.8%) |
| $150,000 or more | 0 (0.0%) | 39 (29.3%) |
| Total | 131 (100.0%) | 133 (100.0%) |
Property Value to Household Income Ratio in Dubois
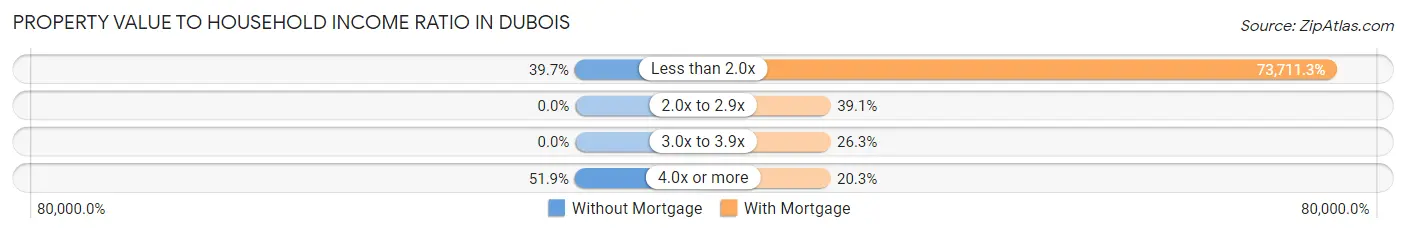
| Value-to-Income Ratio | Without Mortgage | With Mortgage |
| Less than 2.0x | 52 (39.7%) | 98,036 (73,711.3%) |
| 2.0x to 2.9x | 0 (0.0%) | 52 (39.1%) |
| 3.0x to 3.9x | 0 (0.0%) | 35 (26.3%) |
| 4.0x or more | 68 (51.9%) | 27 (20.3%) |
| Total | 131 (100.0%) | 133 (100.0%) |
Real Estate Taxes by Mortgage Status in Dubois
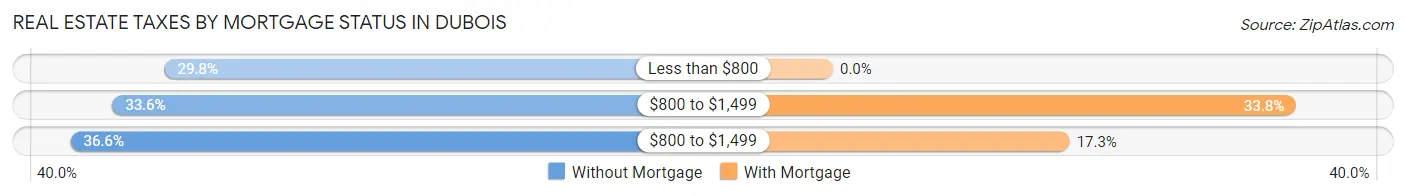
| Property Taxes | Without Mortgage | With Mortgage |
| Less than $800 | 39 (29.8%) | 0 (0.0%) |
| $800 to $1,499 | 44 (33.6%) | 45 (33.8%) |
| $800 to $1,499 | 48 (36.6%) | 23 (17.3%) |
| Total | 131 (100.0%) | 133 (100.0%) |
Health & Disability in Dubois
Health Insurance Coverage by Age in Dubois
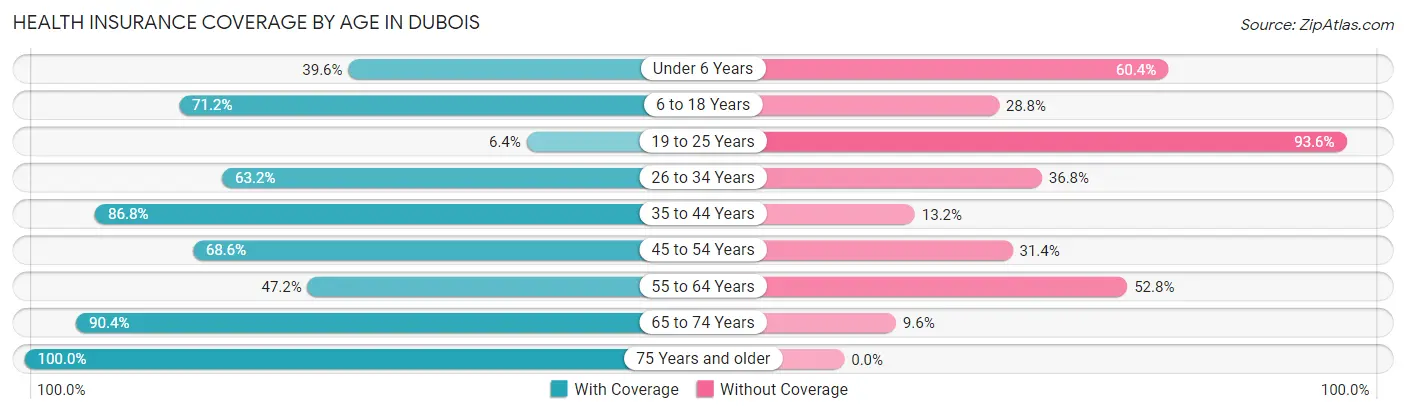
| Age Bracket | With Coverage | Without Coverage |
| Under 6 Years | 21 (39.6%) | 32 (60.4%) |
| 6 to 18 Years | 84 (71.2%) | 34 (28.8%) |
| 19 to 25 Years | 3 (6.4%) | 44 (93.6%) |
| 26 to 34 Years | 36 (63.2%) | 21 (36.8%) |
| 35 to 44 Years | 66 (86.8%) | 10 (13.2%) |
| 45 to 54 Years | 35 (68.6%) | 16 (31.4%) |
| 55 to 64 Years | 77 (47.2%) | 86 (52.8%) |
| 65 to 74 Years | 141 (90.4%) | 15 (9.6%) |
| 75 Years and older | 53 (100.0%) | 0 (0.0%) |
| Total | 516 (66.7%) | 258 (33.3%) |
Health Insurance Coverage by Citizenship Status in Dubois
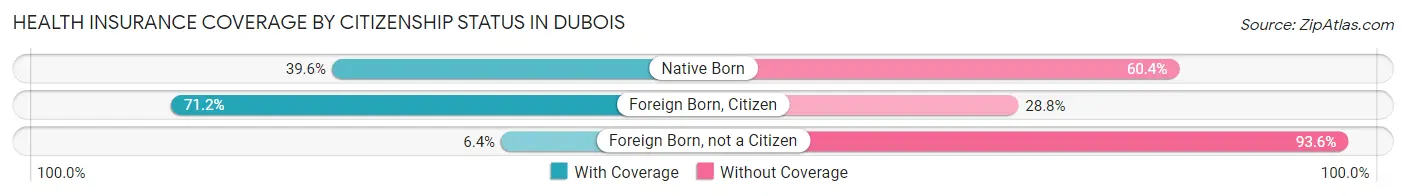
| Citizenship Status | With Coverage | Without Coverage |
| Native Born | 21 (39.6%) | 32 (60.4%) |
| Foreign Born, Citizen | 84 (71.2%) | 34 (28.8%) |
| Foreign Born, not a Citizen | 3 (6.4%) | 44 (93.6%) |
Health Insurance Coverage by Household Income in Dubois
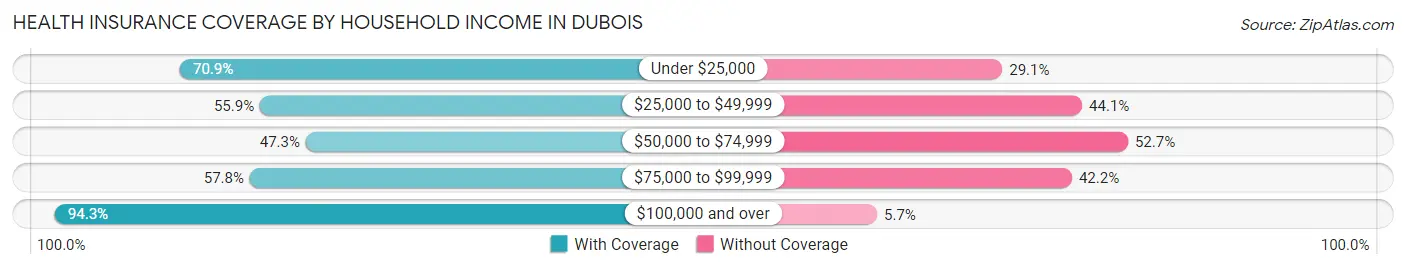
| Household Income | With Coverage | Without Coverage |
| Under $25,000 | 90 (70.9%) | 37 (29.1%) |
| $25,000 to $49,999 | 90 (55.9%) | 71 (44.1%) |
| $50,000 to $74,999 | 53 (47.3%) | 59 (52.7%) |
| $75,000 to $99,999 | 111 (57.8%) | 81 (42.2%) |
| $100,000 and over | 166 (94.3%) | 10 (5.7%) |
Public vs Private Health Insurance Coverage by Age in Dubois
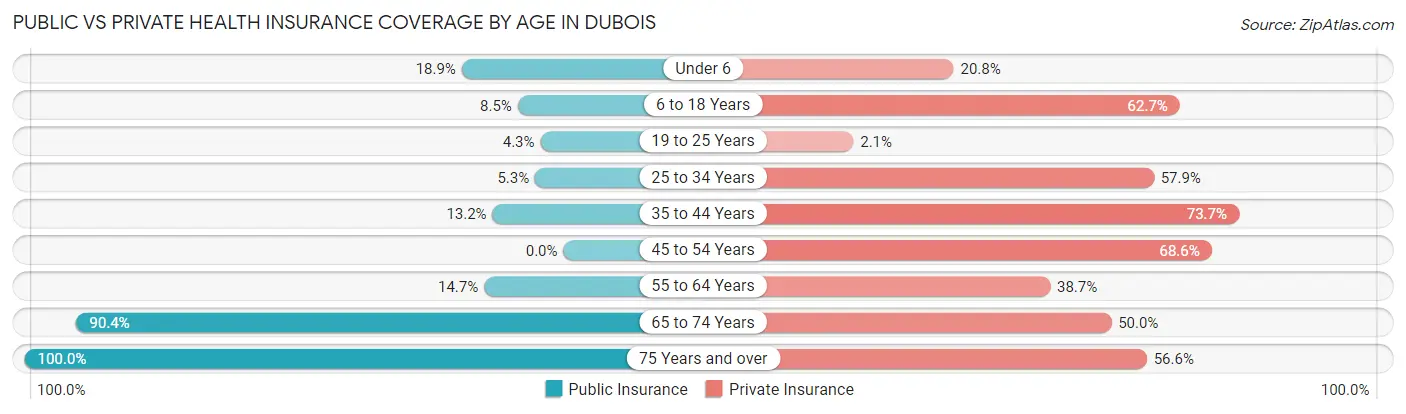
| Age Bracket | Public Insurance | Private Insurance |
| Under 6 | 10 (18.9%) | 11 (20.7%) |
| 6 to 18 Years | 10 (8.5%) | 74 (62.7%) |
| 19 to 25 Years | 2 (4.3%) | 1 (2.1%) |
| 25 to 34 Years | 3 (5.3%) | 33 (57.9%) |
| 35 to 44 Years | 10 (13.2%) | 56 (73.7%) |
| 45 to 54 Years | 0 (0.0%) | 35 (68.6%) |
| 55 to 64 Years | 24 (14.7%) | 63 (38.7%) |
| 65 to 74 Years | 141 (90.4%) | 78 (50.0%) |
| 75 Years and over | 53 (100.0%) | 30 (56.6%) |
| Total | 253 (32.7%) | 381 (49.2%) |
Disability Status by Sex by Age in Dubois
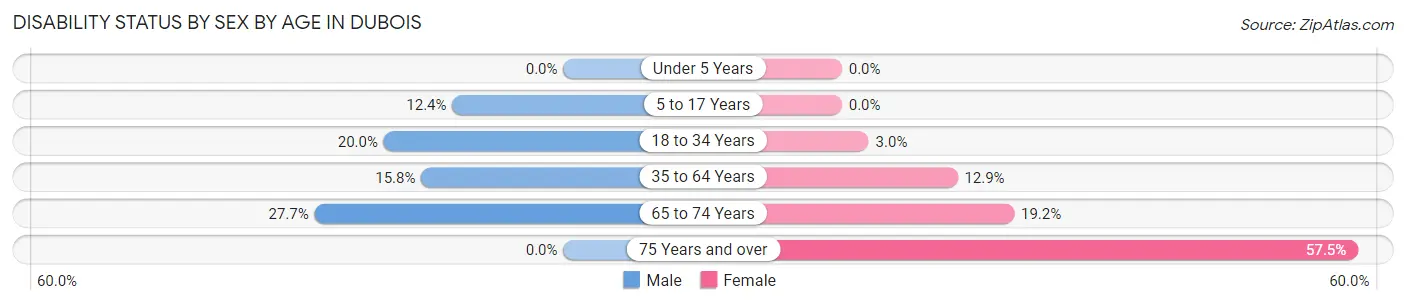
| Age Bracket | Male | Female |
| Under 5 Years | 0 (0.0%) | 0 (0.0%) |
| 5 to 17 Years | 11 (12.4%) | 0 (0.0%) |
| 18 to 34 Years | 13 (20.0%) | 2 (3.0%) |
| 35 to 64 Years | 25 (15.8%) | 17 (12.9%) |
| 65 to 74 Years | 23 (27.7%) | 14 (19.2%) |
| 75 Years and over | 0 (0.0%) | 23 (57.5%) |
Disability Class by Sex by Age in Dubois
Disability Class: Hearing Difficulty
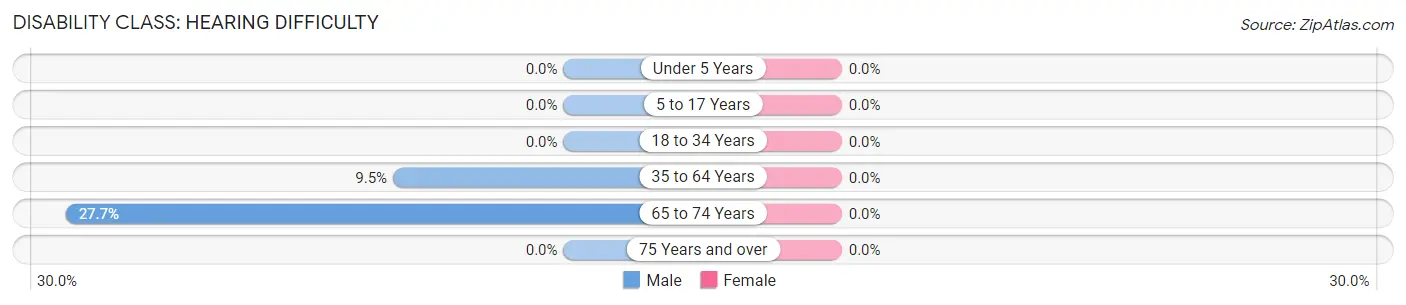
| Age Bracket | Male | Female |
| Under 5 Years | 0 (0.0%) | 0 (0.0%) |
| 5 to 17 Years | 0 (0.0%) | 0 (0.0%) |
| 18 to 34 Years | 0 (0.0%) | 0 (0.0%) |
| 35 to 64 Years | 15 (9.5%) | 0 (0.0%) |
| 65 to 74 Years | 23 (27.7%) | 0 (0.0%) |
| 75 Years and over | 0 (0.0%) | 0 (0.0%) |
Disability Class: Vision Difficulty
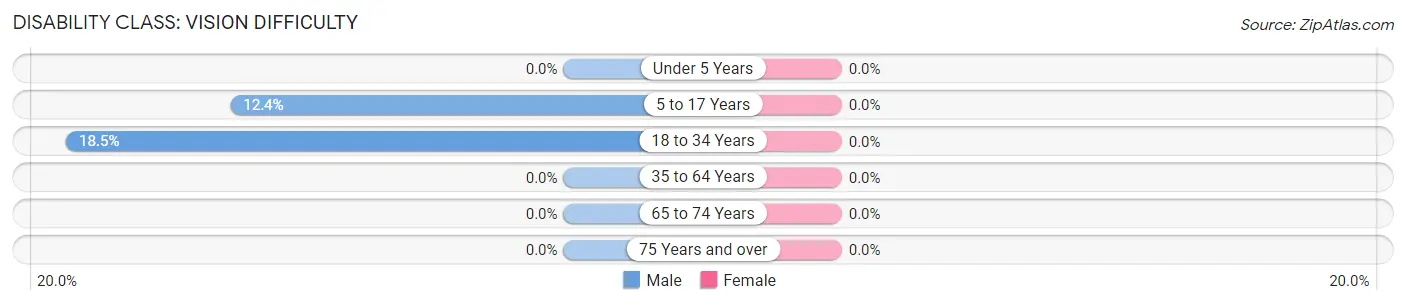
| Age Bracket | Male | Female |
| Under 5 Years | 0 (0.0%) | 0 (0.0%) |
| 5 to 17 Years | 11 (12.4%) | 0 (0.0%) |
| 18 to 34 Years | 12 (18.5%) | 0 (0.0%) |
| 35 to 64 Years | 0 (0.0%) | 0 (0.0%) |
| 65 to 74 Years | 0 (0.0%) | 0 (0.0%) |
| 75 Years and over | 0 (0.0%) | 0 (0.0%) |
Disability Class: Cognitive Difficulty
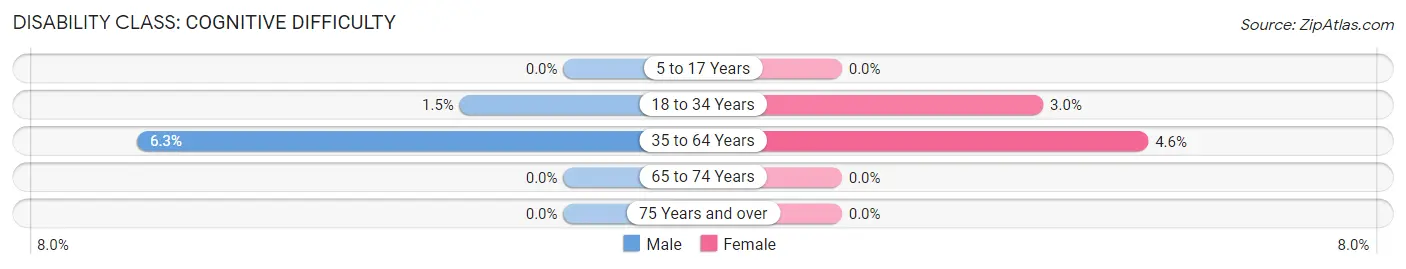
| Age Bracket | Male | Female |
| 5 to 17 Years | 0 (0.0%) | 0 (0.0%) |
| 18 to 34 Years | 1 (1.5%) | 2 (3.0%) |
| 35 to 64 Years | 10 (6.3%) | 6 (4.5%) |
| 65 to 74 Years | 0 (0.0%) | 0 (0.0%) |
| 75 Years and over | 0 (0.0%) | 0 (0.0%) |
Disability Class: Ambulatory Difficulty
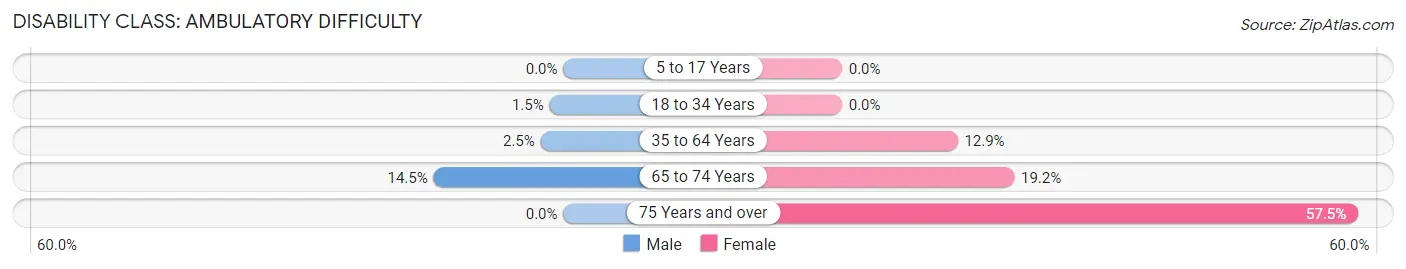
| Age Bracket | Male | Female |
| 5 to 17 Years | 0 (0.0%) | 0 (0.0%) |
| 18 to 34 Years | 1 (1.5%) | 0 (0.0%) |
| 35 to 64 Years | 4 (2.5%) | 17 (12.9%) |
| 65 to 74 Years | 12 (14.5%) | 14 (19.2%) |
| 75 Years and over | 0 (0.0%) | 23 (57.5%) |
Disability Class: Self-Care Difficulty
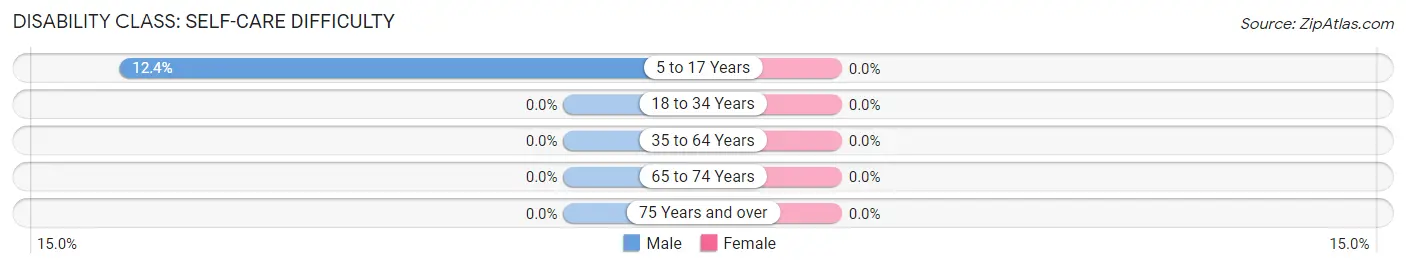
| Age Bracket | Male | Female |
| 5 to 17 Years | 11 (12.4%) | 0 (0.0%) |
| 18 to 34 Years | 0 (0.0%) | 0 (0.0%) |
| 35 to 64 Years | 0 (0.0%) | 0 (0.0%) |
| 65 to 74 Years | 0 (0.0%) | 0 (0.0%) |
| 75 Years and over | 0 (0.0%) | 0 (0.0%) |
Technology Access in Dubois
Computing Device Access in Dubois
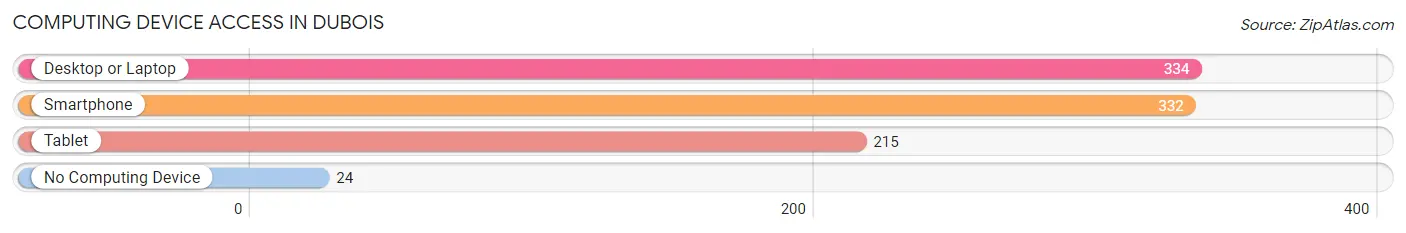
| Device Type | # Households | % Households |
| Desktop or Laptop | 334 | 83.3% |
| Smartphone | 332 | 82.8% |
| Tablet | 215 | 53.6% |
| No Computing Device | 24 | 6.0% |
| Total | 401 | 100.0% |
Internet Access in Dubois
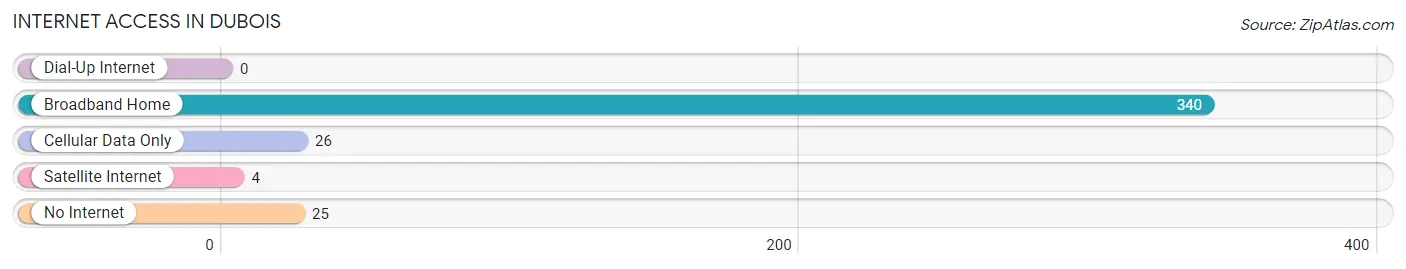
| Internet Type | # Households | % Households |
| Dial-Up Internet | 0 | 0.0% |
| Broadband Home | 340 | 84.8% |
| Cellular Data Only | 26 | 6.5% |
| Satellite Internet | 4 | 1.0% |
| No Internet | 25 | 6.2% |
| Total | 401 | 100.0% |
Dubois Summary
History
DuBois, Wyoming is a small town located in Fremont County, Wyoming. It was founded in 1884 by a group of settlers from Dubois, Indiana. The town was named after the Indiana town, and the settlers brought with them the same name. The town was originally a farming and ranching community, and the settlers quickly established a post office and a school.
The town grew slowly over the years, and by the early 1900s, it had become a bustling community with a population of around 500 people. The town was home to several businesses, including a hotel, a general store, a bank, and a blacksmith shop.
In the 1920s, the town experienced a period of growth and prosperity. The town was home to several businesses, including a movie theater, a bowling alley, and a dance hall. The town also had a newspaper, the Dubois Times, which was published from 1921 to 1929.
The Great Depression hit the town hard, and many of the businesses closed. The population of the town declined, and by 1940, it had dropped to just over 200 people.
The town experienced a resurgence in the 1950s, when the nearby oil fields were discovered. The town became a hub for oil and gas exploration, and the population began to grow again. By the 1970s, the population had grown to over 500 people.
Today, Dubois is a small town with a population of around 800 people. It is still a farming and ranching community, and the town is home to several businesses, including a grocery store, a hardware store, and a restaurant.
Geography
Dubois is located in Fremont County, Wyoming, in the Wind River Valley. The town is situated at an elevation of 6,000 feet, and it is surrounded by the Wind River Mountains. The town is located on the banks of the Wind River, and it is approximately 30 miles from the city of Riverton.
The town is located in a semi-arid climate, with hot summers and cold winters. The average annual temperature is around 50 degrees Fahrenheit, and the average annual precipitation is around 10 inches.
Economy
The economy of Dubois is largely based on agriculture and ranching. The town is home to several farms and ranches, and the local economy is supported by the production of hay, wheat, and other crops.
The town is also home to several businesses, including a grocery store, a hardware store, and a restaurant. The town is also home to several tourist attractions, including the Dubois Museum and the Dubois Rodeo.
Demographics
As of the 2010 census, the population of Dubois was 803 people. The racial makeup of the town was 97.2% White, 0.2% African American, 0.4% Native American, 0.2% Asian, 0.2% from other races, and 1.9% from two or more races. Hispanic or Latino of any race were 1.2% of the population.
The median income for a household in the town was $37,500, and the median income for a family was $41,250. The per capita income for the town was $17,845. About 11.2% of families and 14.2% of the population were below the poverty line, including 17.2% of those under age 18 and 8.3% of those age 65 or over.
Common Questions
What is Per Capita Income in Dubois?
Per Capita income in Dubois is $33,485.
What is the Median Family Income in Dubois?
Median Family Income in Dubois is $78,558.
What is the Median Household income in Dubois?
Median Household Income in Dubois is $57,614.
What is Income or Wage Gap in Dubois?
Income or Wage Gap in Dubois is 34.3%.
Women in Dubois earn 65.7 cents for every dollar earned by a man.
What is Inequality or Gini Index in Dubois?
Inequality or Gini Index in Dubois is 0.44.
What is the Total Population of Dubois?
Total Population of Dubois is 778.
What is the Total Male Population of Dubois?
Total Male Population of Dubois is 454.
What is the Total Female Population of Dubois?
Total Female Population of Dubois is 324.
What is the Ratio of Males per 100 Females in Dubois?
There are 140.12 Males per 100 Females in Dubois.
What is the Ratio of Females per 100 Males in Dubois?
There are 71.37 Females per 100 Males in Dubois.
What is the Median Population Age in Dubois?
Median Population Age in Dubois is 52.5 Years.
What is the Average Family Size in Dubois
Average Family Size in Dubois is 2.8 People.
What is the Average Household Size in Dubois
Average Household Size in Dubois is 1.9 People.
How Large is the Labor Force in Dubois?
There are 381 People in the Labor Forcein in Dubois.
What is the Percentage of People in the Labor Force in Dubois?
58.3% of People are in the Labor Force in Dubois.
What is the Unemployment Rate in Dubois?
Unemployment Rate in Dubois is 5.5%.