Dixon, WY Map & Demographics
Dixon Map
Dixon Overview
$20,742
PER CAPITA INCOME
$66,500
AVG HOUSEHOLD INCOME
53.1%
WAGE / INCOME GAP [ % ]
46.9¢/ $1
WAGE / INCOME GAP [ $ ]
0.28
INEQUALITY / GINI INDEX
310
TOTAL POPULATION
207
MALE POPULATION
103
FEMALE POPULATION
200.97
MALES / 100 FEMALES
49.76
FEMALES / 100 MALES
14.4
MEDIAN AGE
5.0
AVG FAMILY SIZE
4.4
AVG HOUSEHOLD SIZE
110
LABOR FORCE [ PEOPLE ]
73.8%
PERCENT IN LABOR FORCE
Dixon Zip Codes
Dixon Area Codes
Income in Dixon
Income Overview in Dixon
| Characteristic | Number | Measure |
| Per Capita Income | 310 | $20,742 |
| Median Family Income | 46 | $0 |
| Mean Family Income | 46 | $55,383 |
| Median Household Income | 70 | $66,500 |
| Mean Household Income | 70 | $65,214 |
| Income Deficit | 46 | $0 |
| Wage / Income Gap (%) | 310 | 53.06% |
| Wage / Income Gap ($) | 310 | 46.94¢ per $1 |
| Gini / Inequality Index | 310 | 0.28 |
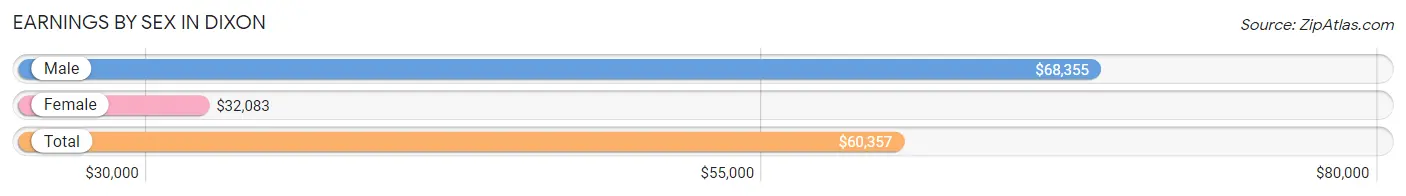
Earnings by Sex in Dixon
Average Earnings in Dixon are $60,357, $68,355 for men and $32,083 for women, a difference of 53.1%.
| Sex | Number | Average Earnings |
| Male | 72 (65.4%) | $68,355 |
| Female | 38 (34.5%) | $32,083 |
| Total | 110 (100.0%) | $60,357 |
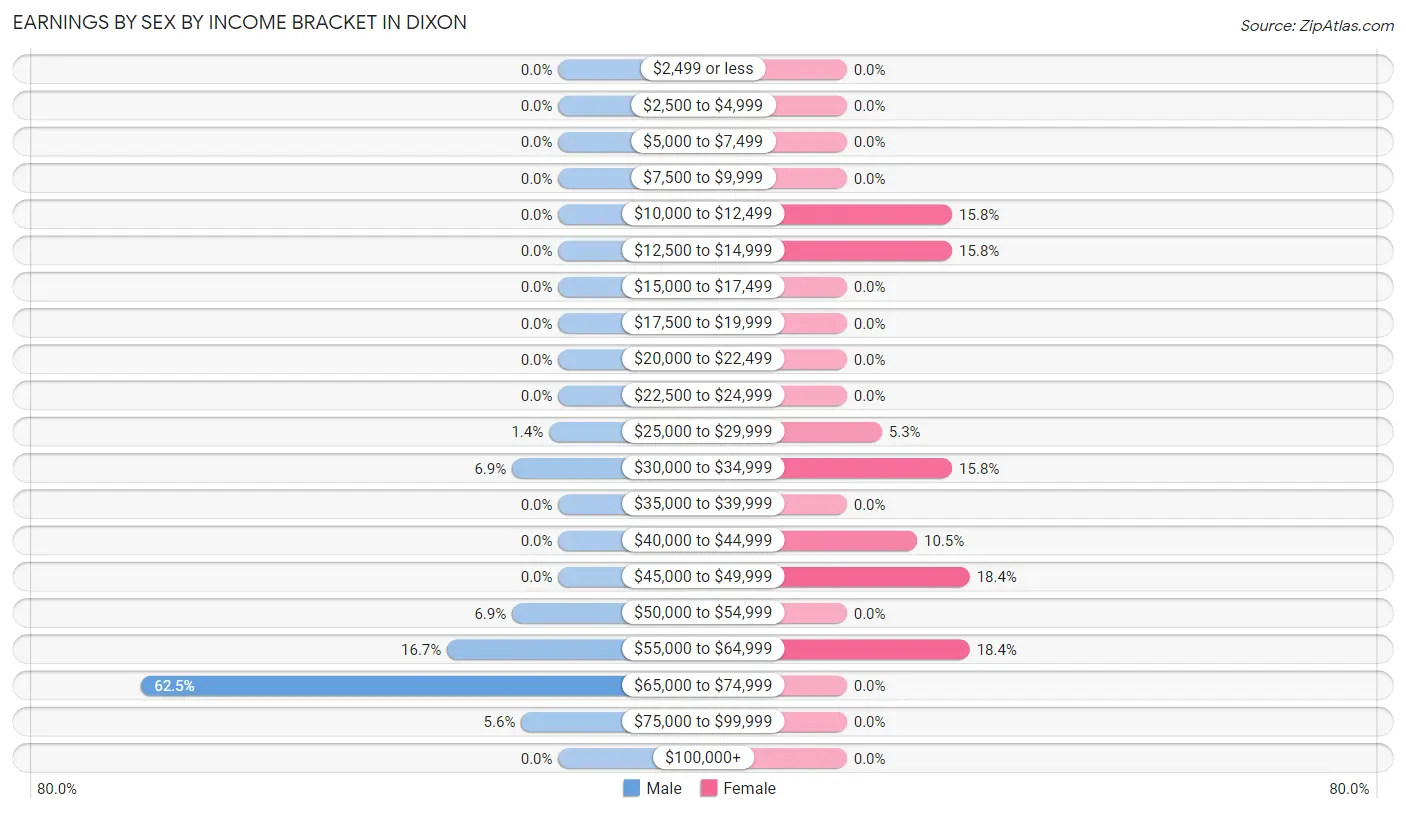
Earnings by Sex by Income Bracket in Dixon
The most common earnings brackets in Dixon are $65,000 to $74,999 for men (45 | 62.5%) and $45,000 to $49,999 for women (7 | 18.4%).
| Income | Male | Female |
| $2,499 or less | 0 (0.0%) | 0 (0.0%) |
| $2,500 to $4,999 | 0 (0.0%) | 0 (0.0%) |
| $5,000 to $7,499 | 0 (0.0%) | 0 (0.0%) |
| $7,500 to $9,999 | 0 (0.0%) | 0 (0.0%) |
| $10,000 to $12,499 | 0 (0.0%) | 6 (15.8%) |
| $12,500 to $14,999 | 0 (0.0%) | 6 (15.8%) |
| $15,000 to $17,499 | 0 (0.0%) | 0 (0.0%) |
| $17,500 to $19,999 | 0 (0.0%) | 0 (0.0%) |
| $20,000 to $22,499 | 0 (0.0%) | 0 (0.0%) |
| $22,500 to $24,999 | 0 (0.0%) | 0 (0.0%) |
| $25,000 to $29,999 | 1 (1.4%) | 2 (5.3%) |
| $30,000 to $34,999 | 5 (6.9%) | 6 (15.8%) |
| $35,000 to $39,999 | 0 (0.0%) | 0 (0.0%) |
| $40,000 to $44,999 | 0 (0.0%) | 4 (10.5%) |
| $45,000 to $49,999 | 0 (0.0%) | 7 (18.4%) |
| $50,000 to $54,999 | 5 (6.9%) | 0 (0.0%) |
| $55,000 to $64,999 | 12 (16.7%) | 7 (18.4%) |
| $65,000 to $74,999 | 45 (62.5%) | 0 (0.0%) |
| $75,000 to $99,999 | 4 (5.6%) | 0 (0.0%) |
| $100,000+ | 0 (0.0%) | 0 (0.0%) |
| Total | 72 (100.0%) | 38 (100.0%) |
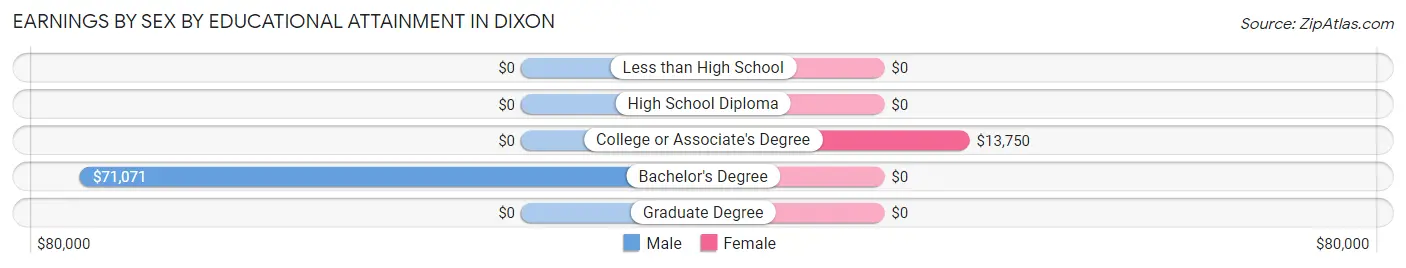
Earnings by Sex by Educational Attainment in Dixon
Average earnings in Dixon are $68,355 for men and $41,250 for women, a difference of 39.7%. Men with an educational attainment of bachelor's degree enjoy the highest average annual earnings of $71,071, while those with bachelor's degree education earn the least with $71,071. Women with an educational attainment of college or associate's degree earn the most with the average annual earnings of $13,750, while those with college or associate's degree education have the smallest earnings of $13,750.
| Educational Attainment | Male Income | Female Income |
| Less than High School | - | - |
| High School Diploma | - | - |
| College or Associate's Degree | - | - |
| Bachelor's Degree | $71,071 | $0 |
| Graduate Degree | - | - |
| Total | $68,355 | $41,250 |
Family Income in Dixon
Family Income Brackets in Dixon
According to the Dixon family income data, there are 16 families falling into the less than $10,000 income range, which is the most common income bracket and makes up 34.8% of all families.
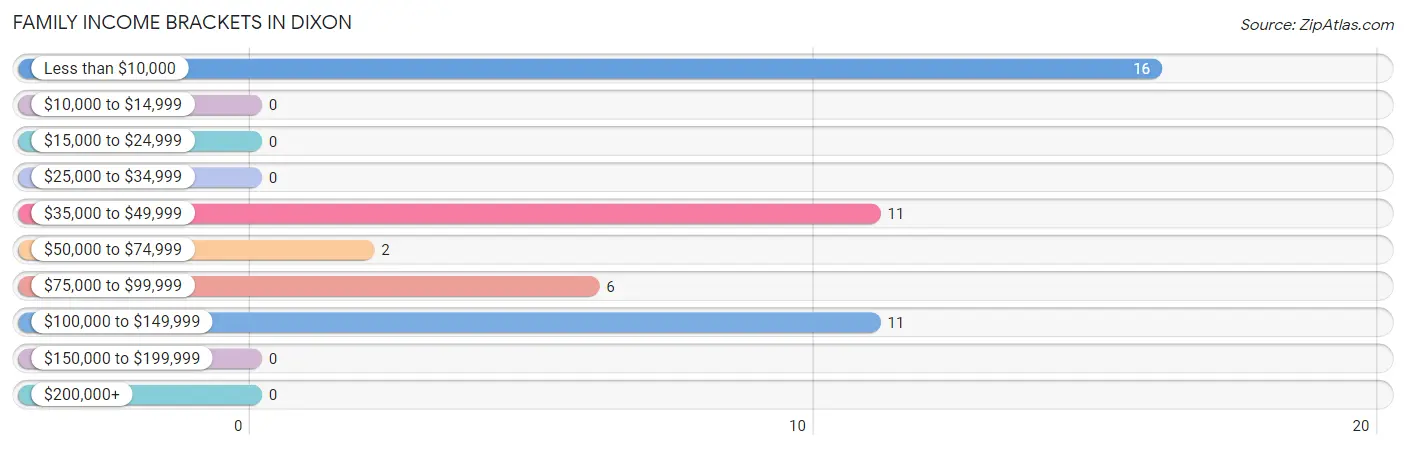
| Income Bracket | # Families | % Families |
| Less than $10,000 | 16 | 34.8% |
| $10,000 to $14,999 | 0 | 0.0% |
| $15,000 to $24,999 | 0 | 0.0% |
| $25,000 to $34,999 | 0 | 0.0% |
| $35,000 to $49,999 | 11 | 23.9% |
| $50,000 to $74,999 | 2 | 4.3% |
| $75,000 to $99,999 | 6 | 13.0% |
| $100,000 to $149,999 | 11 | 23.9% |
| $150,000 to $199,999 | 0 | 0.0% |
| $200,000+ | 0 | 0.0% |
Family Income by Famaliy Size in Dixon
4-person families (25 | 54.3%) account for the highest median family income in Dixon with $2,499 per family, while 4-person families (25 | 54.3%) have the highest median income of $625 per family member.
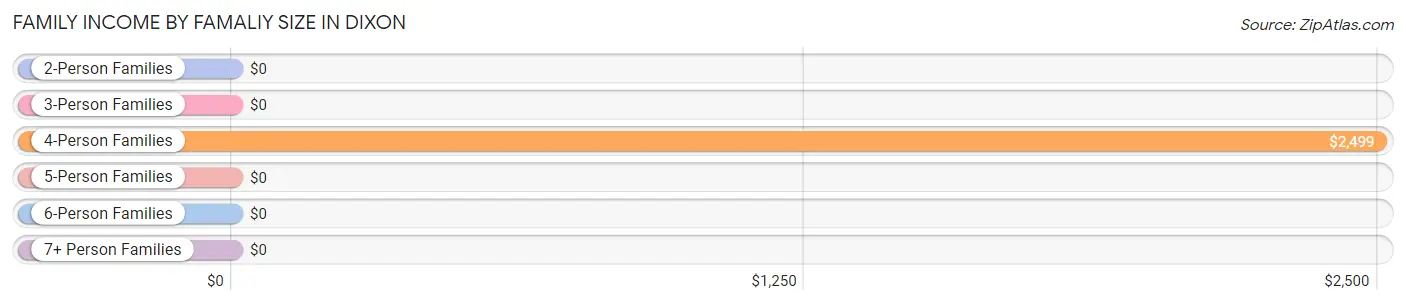
| Income Bracket | # Families | Median Income |
| 2-Person Families | 6 (13.0%) | $0 |
| 3-Person Families | 13 (28.3%) | $0 |
| 4-Person Families | 25 (54.3%) | $2,499 |
| 5-Person Families | 0 (0.0%) | $0 |
| 6-Person Families | 0 (0.0%) | $0 |
| 7+ Person Families | 2 (4.3%) | $0 |
| Total | 46 (100.0%) | $0 |
Family Income by Number of Earners in Dixon
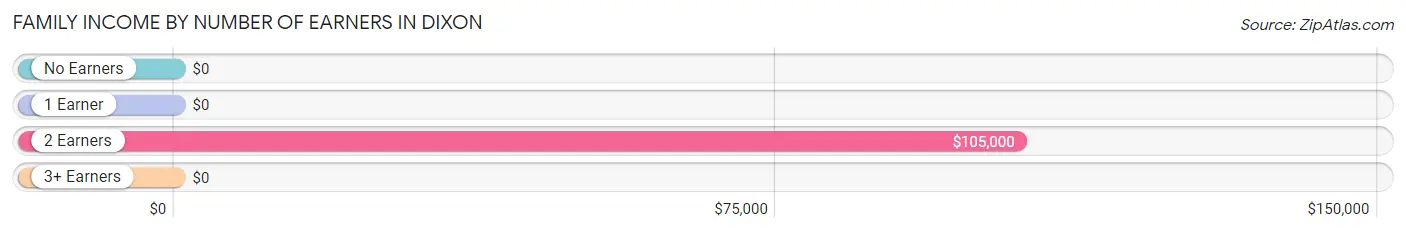
| Number of Earners | # Families | Median Income |
| No Earners | 16 (34.8%) | $0 |
| 1 Earner | 8 (17.4%) | $0 |
| 2 Earners | 22 (47.8%) | $105,000 |
| 3+ Earners | 0 (0.0%) | $0 |
| Total | 46 (100.0%) | $0 |
Household Income in Dixon
Household Income Brackets in Dixon
With 23 households falling in the category, the $50,000 to $74,999 income range is the most frequent in Dixon, accounting for 32.9% of all households.
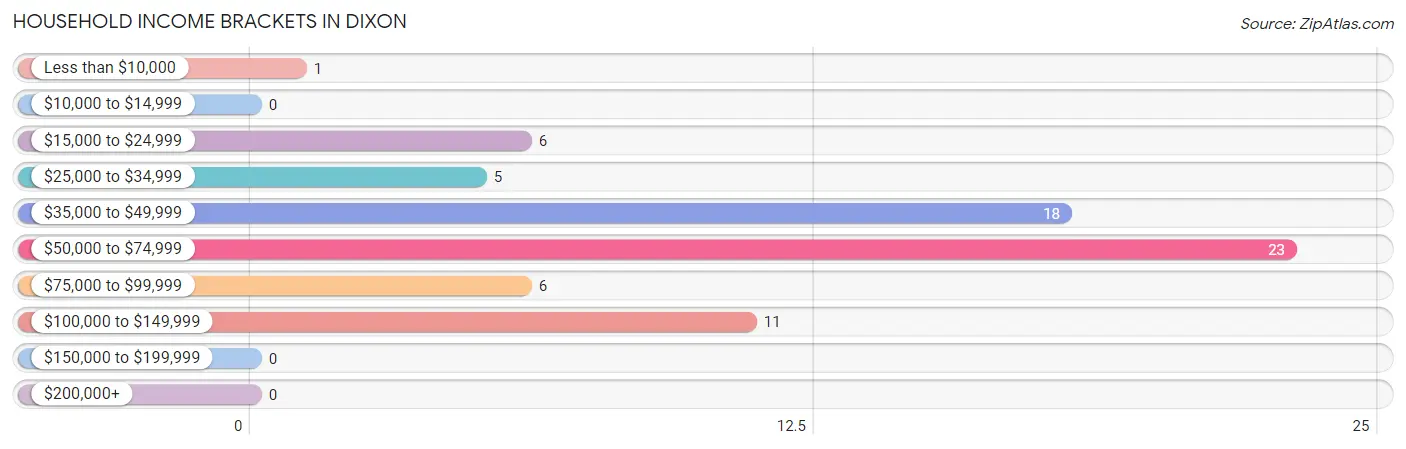
| Income Bracket | # Households | % Households |
| Less than $10,000 | 1 | 1.4% |
| $10,000 to $14,999 | 0 | 0.0% |
| $15,000 to $24,999 | 6 | 8.6% |
| $25,000 to $34,999 | 5 | 7.1% |
| $35,000 to $49,999 | 18 | 25.7% |
| $50,000 to $74,999 | 23 | 32.9% |
| $75,000 to $99,999 | 6 | 8.6% |
| $100,000 to $149,999 | 11 | 15.7% |
| $150,000 to $199,999 | 0 | 0.0% |
| $200,000+ | 0 | 0.0% |
Household Income by Householder Age in Dixon
The median household income in Dixon is $66,500, with the highest median household income of $68,906 found in the 25 to 44 years age bracket for the primary householder. A total of 36 households (51.4%) fall into this category. Meanwhile, the 15 to 24 years age bracket for the primary householder has the lowest median household income of $0, with 6 households (8.6%) in this group.
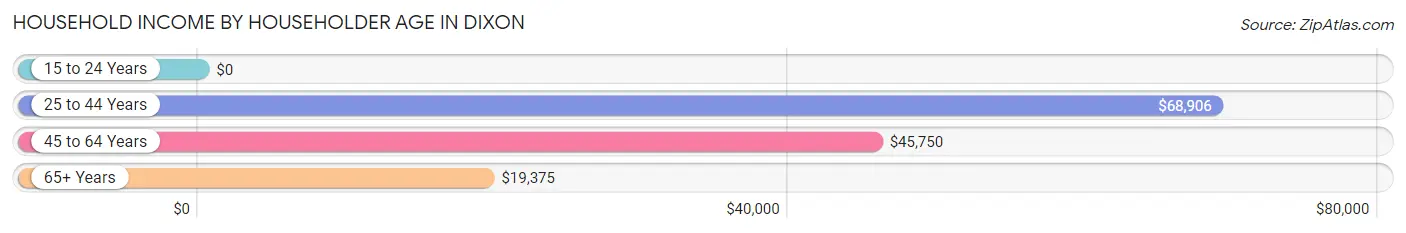
| Income Bracket | # Households | Median Income |
| 15 to 24 Years | 6 (8.6%) | $0 |
| 25 to 44 Years | 36 (51.4%) | $68,906 |
| 45 to 64 Years | 17 (24.3%) | $45,750 |
| 65+ Years | 11 (15.7%) | $19,375 |
| Total | 70 (100.0%) | $66,500 |
Poverty in Dixon
Income Below Poverty by Sex and Age in Dixon
With 41.5% poverty level for males and 44.4% for females among the residents of Dixon, 6 to 11 year old males and 65 to 74 year old females are the most vulnerable to poverty, with 83 males (100.0%) and 6 females (100.0%) in their respective age groups living below the poverty level.
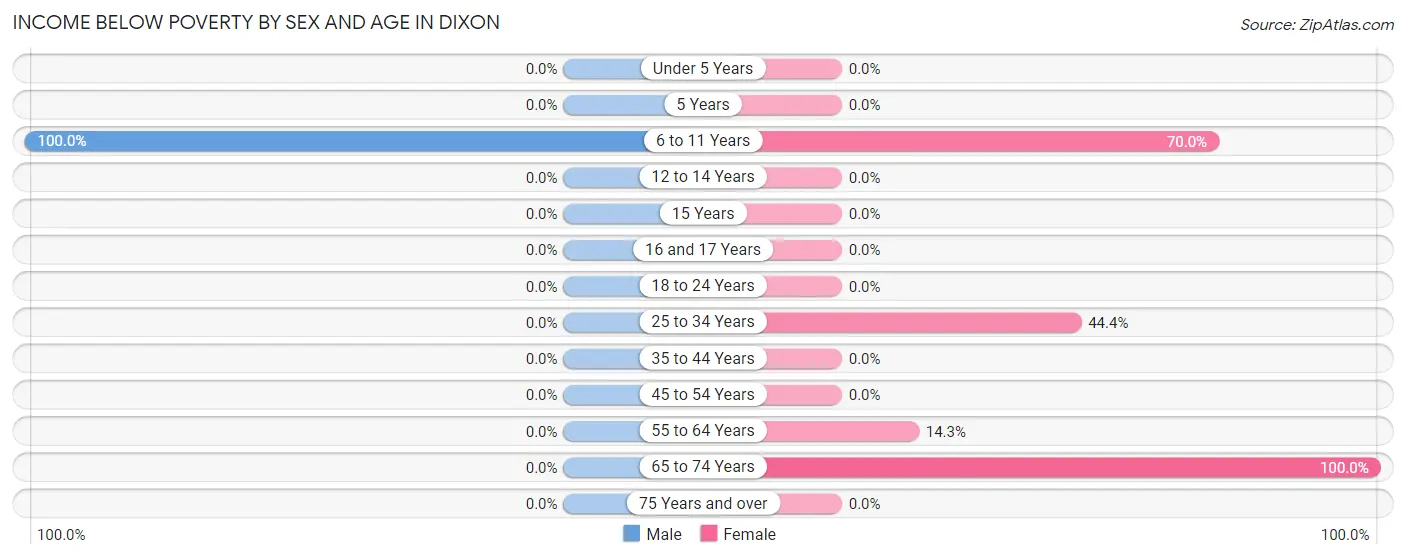
| Age Bracket | Male | Female |
| Under 5 Years | 0 (0.0%) | 0 (0.0%) |
| 5 Years | 0 (0.0%) | 0 (0.0%) |
| 6 to 11 Years | 83 (100.0%) | 21 (70.0%) |
| 12 to 14 Years | 0 (0.0%) | 0 (0.0%) |
| 15 Years | 0 (0.0%) | 0 (0.0%) |
| 16 and 17 Years | 0 (0.0%) | 0 (0.0%) |
| 18 to 24 Years | 0 (0.0%) | 0 (0.0%) |
| 25 to 34 Years | 0 (0.0%) | 16 (44.4%) |
| 35 to 44 Years | 0 (0.0%) | 0 (0.0%) |
| 45 to 54 Years | 0 (0.0%) | 0 (0.0%) |
| 55 to 64 Years | 0 (0.0%) | 1 (14.3%) |
| 65 to 74 Years | 0 (0.0%) | 6 (100.0%) |
| 75 Years and over | 0 (0.0%) | 0 (0.0%) |
| Total | 83 (41.5%) | 44 (44.4%) |
Income Above Poverty by Sex and Age in Dixon
According to the poverty statistics in Dixon, males aged under 5 years and females aged under 5 years are the age groups that are most secure financially, with 100.0% of males and 100.0% of females in these age groups living above the poverty line.
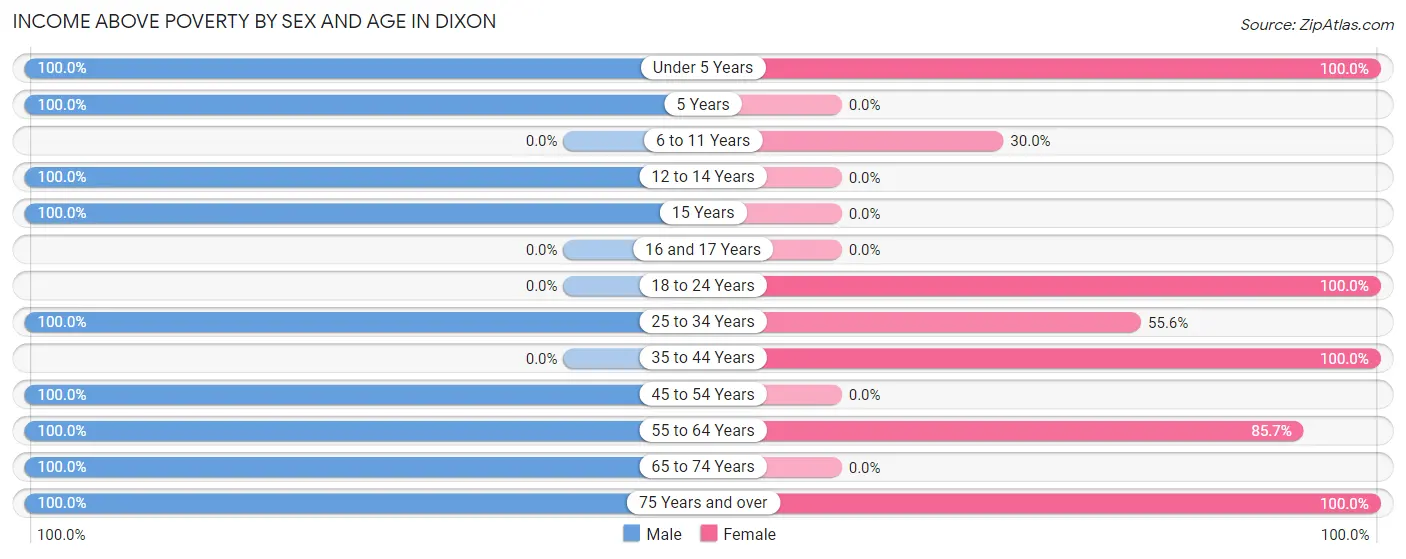
| Age Bracket | Male | Female |
| Under 5 Years | 20 (100.0%) | 2 (100.0%) |
| 5 Years | 3 (100.0%) | 0 (0.0%) |
| 6 to 11 Years | 0 (0.0%) | 9 (30.0%) |
| 12 to 14 Years | 10 (100.0%) | 0 (0.0%) |
| 15 Years | 2 (100.0%) | 0 (0.0%) |
| 16 and 17 Years | 0 (0.0%) | 0 (0.0%) |
| 18 to 24 Years | 0 (0.0%) | 6 (100.0%) |
| 25 to 34 Years | 61 (100.0%) | 20 (55.6%) |
| 35 to 44 Years | 0 (0.0%) | 6 (100.0%) |
| 45 to 54 Years | 10 (100.0%) | 0 (0.0%) |
| 55 to 64 Years | 1 (100.0%) | 6 (85.7%) |
| 65 to 74 Years | 6 (100.0%) | 0 (0.0%) |
| 75 Years and over | 4 (100.0%) | 6 (100.0%) |
| Total | 117 (58.5%) | 55 (55.6%) |
Income Below Poverty Among Married-Couple Families in Dixon
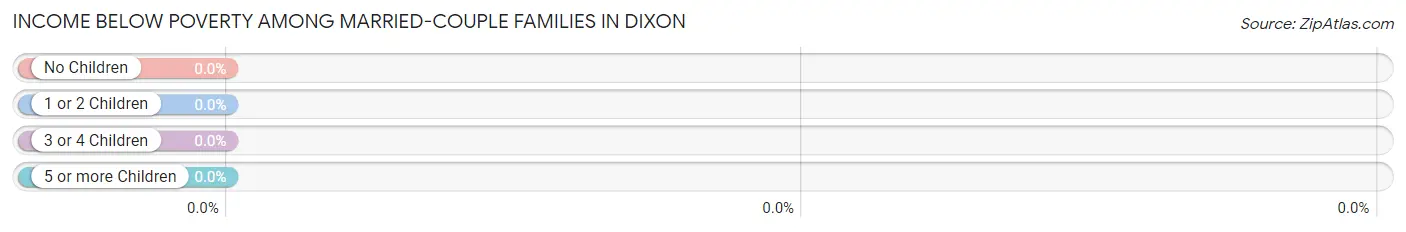
| Children | Above Poverty | Below Poverty |
| No Children | 6 (100.0%) | 0 (0.0%) |
| 1 or 2 Children | 22 (100.0%) | 0 (0.0%) |
| 3 or 4 Children | 0 (0.0%) | 0 (0.0%) |
| 5 or more Children | 0 (0.0%) | 0 (0.0%) |
| Total | 28 (100.0%) | 0 (0.0%) |
Income Below Poverty Among Single-Parent Households in Dixon
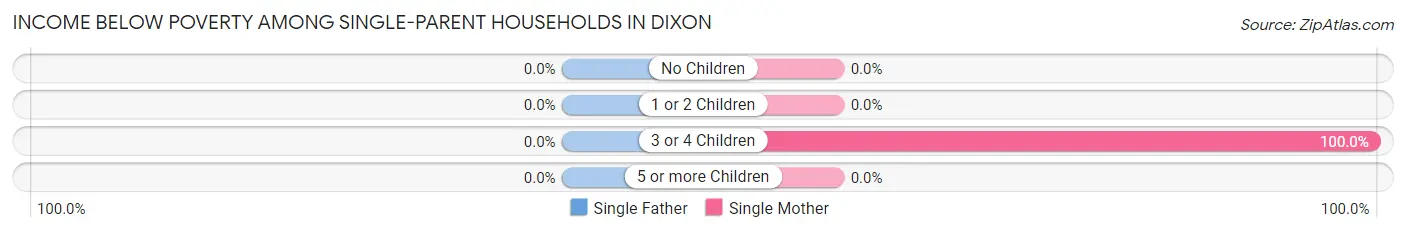
| Children | Single Father | Single Mother |
| No Children | 0 (0.0%) | 0 (0.0%) |
| 1 or 2 Children | 0 (0.0%) | 0 (0.0%) |
| 3 or 4 Children | 0 (0.0%) | 16 (100.0%) |
| 5 or more Children | 0 (0.0%) | 0 (0.0%) |
| Total | 0 (0.0%) | 16 (88.9%) |
Income Below Poverty Among Married-Couple vs Single-Parent Households in Dixon
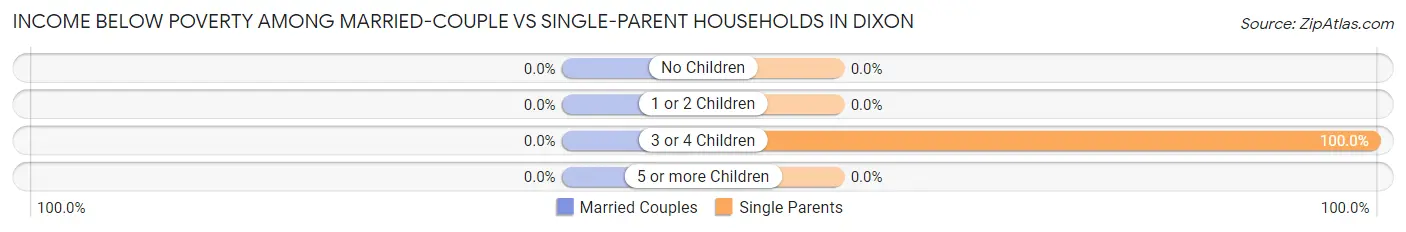
| Children | Married-Couple Families | Single-Parent Households |
| No Children | 0 (0.0%) | 0 (0.0%) |
| 1 or 2 Children | 0 (0.0%) | 0 (0.0%) |
| 3 or 4 Children | 0 (0.0%) | 16 (100.0%) |
| 5 or more Children | 0 (0.0%) | 0 (0.0%) |
| Total | 0 (0.0%) | 16 (88.9%) |
Race in Dixon
The most populous races in Dixon are Hispanic or Latino (163 | 52.6%), Some other Race (158 | 51.0%), and White / Caucasian (147 | 47.4%).
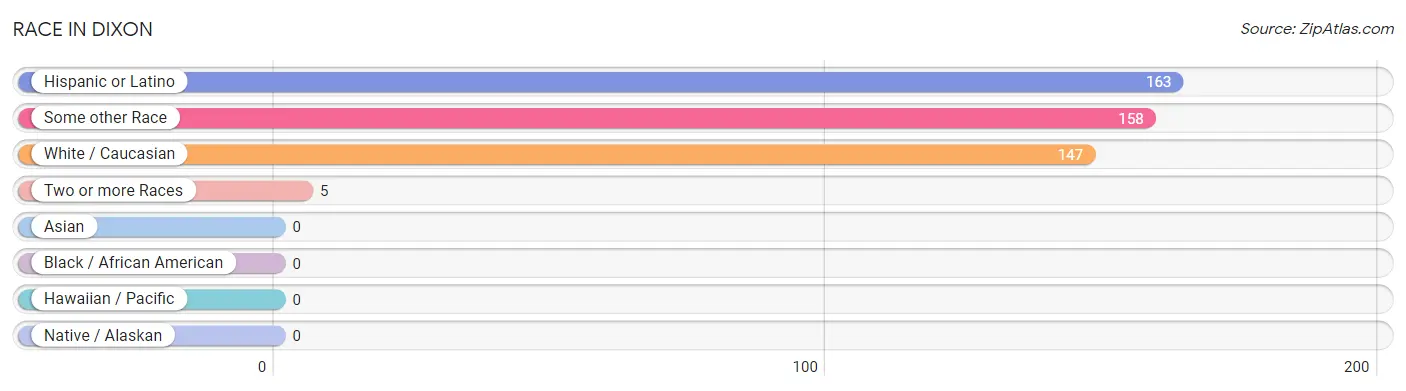
| Race | # Population | % Population |
| Asian | 0 | 0.0% |
| Black / African American | 0 | 0.0% |
| Hawaiian / Pacific | 0 | 0.0% |
| Hispanic or Latino | 163 | 52.6% |
| Native / Alaskan | 0 | 0.0% |
| White / Caucasian | 147 | 47.4% |
| Two or more Races | 5 | 1.6% |
| Some other Race | 158 | 51.0% |
| Total | 310 | 100.0% |
Ancestry in Dixon
The most populous ancestries reported in Dixon are Mexican (163 | 52.6%), German (65 | 21.0%), Italian (21 | 6.8%), Irish (19 | 6.1%), and English (16 | 5.2%), together accounting for 91.6% of all Dixon residents.
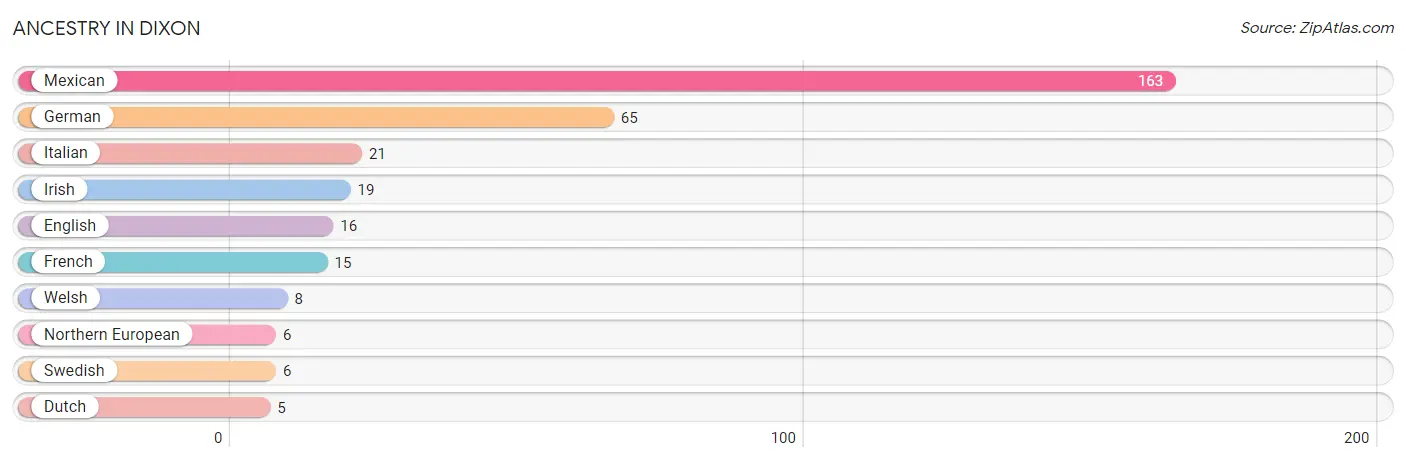
| Ancestry | # Population | % Population |
| Dutch | 5 | 1.6% |
| English | 16 | 5.2% |
| French | 15 | 4.8% |
| German | 65 | 21.0% |
| Irish | 19 | 6.1% |
| Italian | 21 | 6.8% |
| Mexican | 163 | 52.6% |
| Northern European | 6 | 1.9% |
| Swedish | 6 | 1.9% |
| Welsh | 8 | 2.6% | View All 10 Rows |
Immigrants in Dixon
The most numerous immigrant groups reported in Dixon came from Central America (54 | 17.4%), Latin America (54 | 17.4%), and Mexico (54 | 17.4%), together accounting for 52.3% of all Dixon residents.
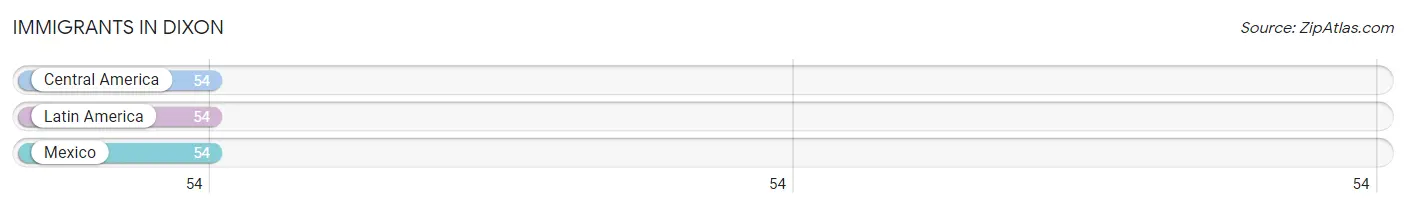
| Immigration Origin | # Population | % Population |
| Central America | 54 | 17.4% |
| Latin America | 54 | 17.4% |
| Mexico | 54 | 17.4% | View All 3 Rows |
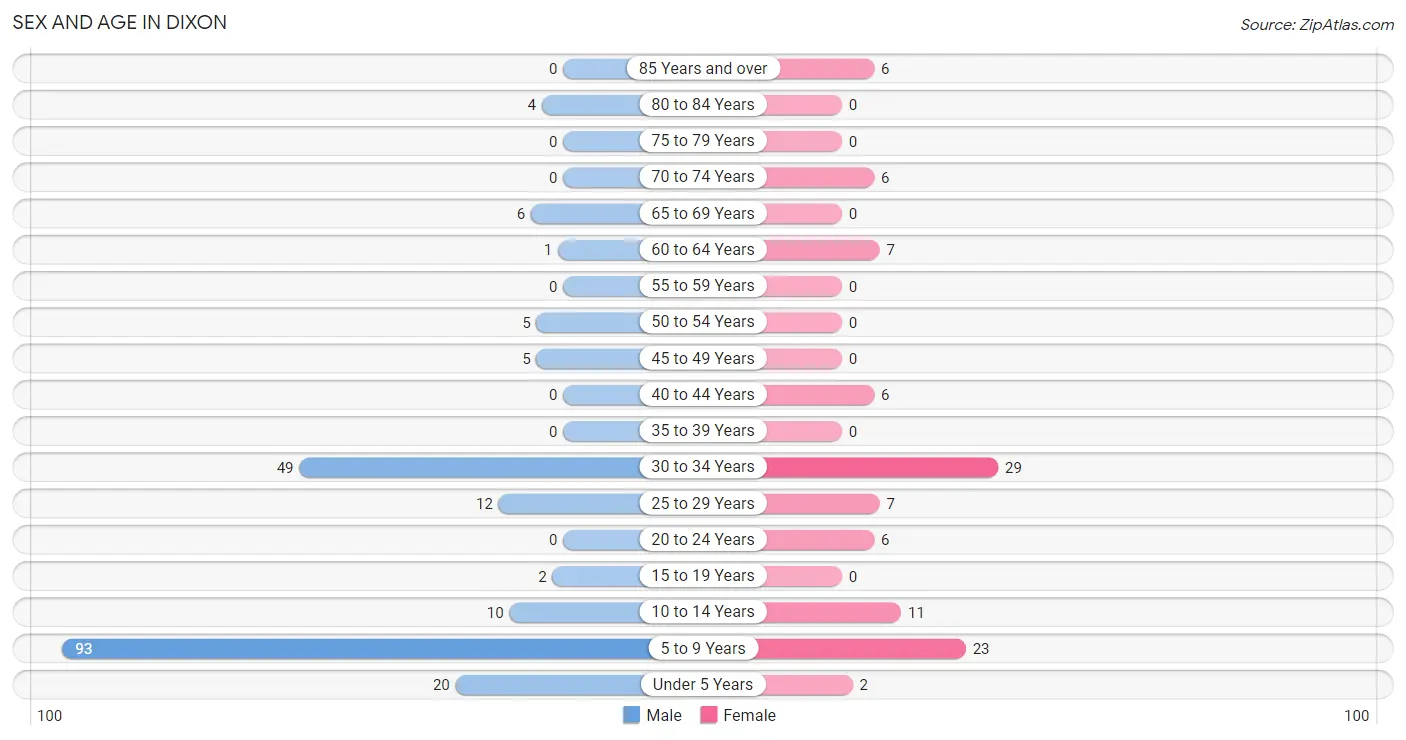
Sex and Age in Dixon
Sex and Age in Dixon
The most populous age groups in Dixon are 5 to 9 Years (93 | 44.9%) for men and 30 to 34 Years (29 | 28.2%) for women.
| Age Bracket | Male | Female |
| Under 5 Years | 20 (9.7%) | 2 (1.9%) |
| 5 to 9 Years | 93 (44.9%) | 23 (22.3%) |
| 10 to 14 Years | 10 (4.8%) | 11 (10.7%) |
| 15 to 19 Years | 2 (1.0%) | 0 (0.0%) |
| 20 to 24 Years | 0 (0.0%) | 6 (5.8%) |
| 25 to 29 Years | 12 (5.8%) | 7 (6.8%) |
| 30 to 34 Years | 49 (23.7%) | 29 (28.2%) |
| 35 to 39 Years | 0 (0.0%) | 0 (0.0%) |
| 40 to 44 Years | 0 (0.0%) | 6 (5.8%) |
| 45 to 49 Years | 5 (2.4%) | 0 (0.0%) |
| 50 to 54 Years | 5 (2.4%) | 0 (0.0%) |
| 55 to 59 Years | 0 (0.0%) | 0 (0.0%) |
| 60 to 64 Years | 1 (0.5%) | 7 (6.8%) |
| 65 to 69 Years | 6 (2.9%) | 0 (0.0%) |
| 70 to 74 Years | 0 (0.0%) | 6 (5.8%) |
| 75 to 79 Years | 0 (0.0%) | 0 (0.0%) |
| 80 to 84 Years | 4 (1.9%) | 0 (0.0%) |
| 85 Years and over | 0 (0.0%) | 6 (5.8%) |
| Total | 207 (100.0%) | 103 (100.0%) |
Families and Households in Dixon
Median Family Size in Dixon
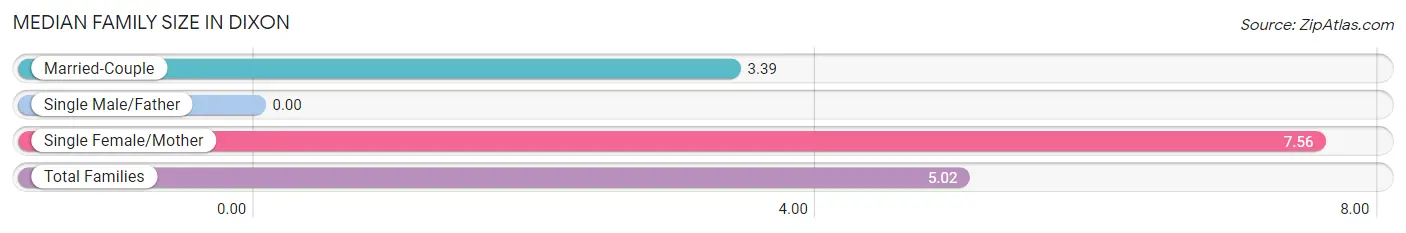
| Family Type | # Families | Family Size |
| Married-Couple | 28 (60.9%) | 3.39 |
| Single Male/Father | 0 (0.0%) | - |
| Single Female/Mother | 18 (39.1%) | 7.56 |
| Total Families | 46 (100.0%) | 5.02 |
Median Household Size in Dixon
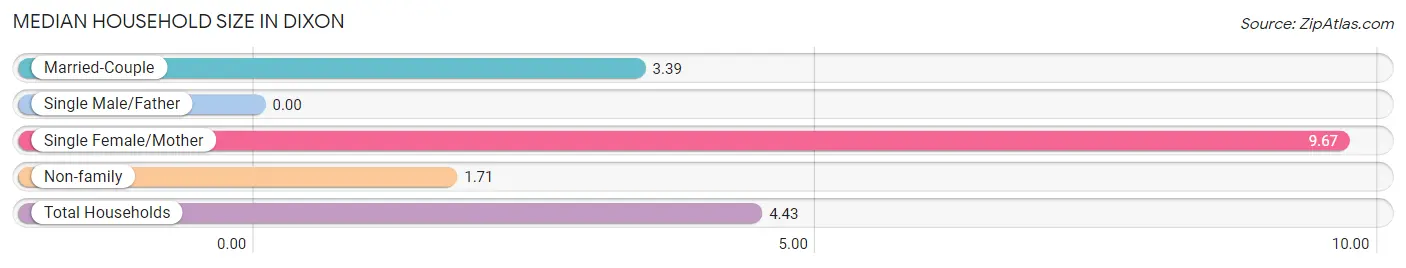
| Household Type | # Households | Household Size |
| Married-Couple | 28 (40.0%) | 3.39 |
| Single Male/Father | 0 (0.0%) | - |
| Single Female/Mother | 18 (25.7%) | 9.67 |
| Non-family | 24 (34.3%) | 1.71 |
| Total Households | 70 (100.0%) | 4.43 |
Household Size by Marriage Status in Dixon
Out of a total of 70 households in Dixon, 46 (65.7%) are family households, while 24 (34.3%) are nonfamily households. The most numerous type of family households are 5-person households, comprising 16, and the most common type of nonfamily households are 1-person households, comprising 11.
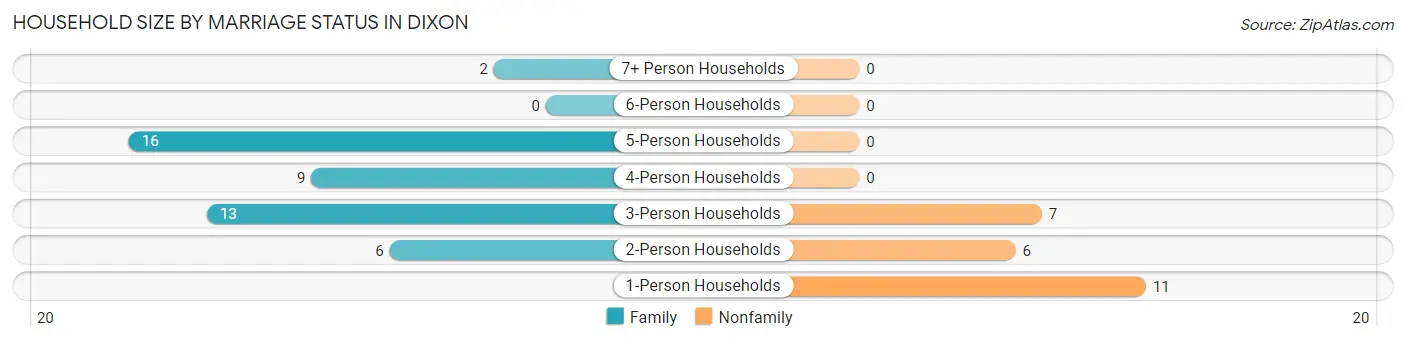
| Household Size | Family Households | Nonfamily Households |
| 1-Person Households | - | 11 (15.7%) |
| 2-Person Households | 6 (8.6%) | 6 (8.6%) |
| 3-Person Households | 13 (18.6%) | 7 (10.0%) |
| 4-Person Households | 9 (12.9%) | 0 (0.0%) |
| 5-Person Households | 16 (22.9%) | 0 (0.0%) |
| 6-Person Households | 0 (0.0%) | 0 (0.0%) |
| 7+ Person Households | 2 (2.9%) | 0 (0.0%) |
| Total | 46 (65.7%) | 24 (34.3%) |
Female Fertility in Dixon
Fertility by Age in Dixon
| Age Bracket | Women with Births | Births / 1,000 Women |
| 15 to 19 years | 0 (0.0%) | 0.0 |
| 20 to 34 years | 0 (0.0%) | 0.0 |
| 35 to 50 years | 0 (0.0%) | 0.0 |
| Total | 0 (0.0%) | 0.0 |
Fertility by Age by Marriage Status in Dixon
| Age Bracket | Married | Unmarried |
| 15 to 19 years | 0 (0.0%) | 0 (0.0%) |
| 20 to 34 years | 0 (0.0%) | 0 (0.0%) |
| 35 to 50 years | 0 (0.0%) | 0 (0.0%) |
| Total | 0 (0.0%) | 0 (0.0%) |
Fertility by Education in Dixon
| Educational Attainment | Women with Births | Births / 1,000 Women |
| Less than High School | 0 (0.0%) | 0.0 |
| High School Diploma | 0 (0.0%) | 0.0 |
| College or Associate's Degree | 0 (0.0%) | 0.0 |
| Bachelor's Degree | 0 (0.0%) | 0.0 |
| Graduate Degree | 0 (0.0%) | 0.0 |
| Total | 0 (0.0%) | 0.0 |
Fertility by Education by Marriage Status in Dixon
| Educational Attainment | Married | Unmarried |
| Less than High School | 0 (0.0%) | 0 (0.0%) |
| High School Diploma | 0 (0.0%) | 0 (0.0%) |
| College or Associate's Degree | 0 (0.0%) | 0 (0.0%) |
| Bachelor's Degree | 0 (0.0%) | 0 (0.0%) |
| Graduate Degree | 0 (0.0%) | 0 (0.0%) |
| Total | 0 (0.0%) | 0 (0.0%) |
Employment Characteristics in Dixon
Employment by Class of Employer in Dixon
Among the 110 employed individuals in Dixon, federal government employees (45 | 40.9%), local government employees (30 | 27.3%), and self-employed (not incorporated) (18 | 16.4%) make up the most common classes of employment.
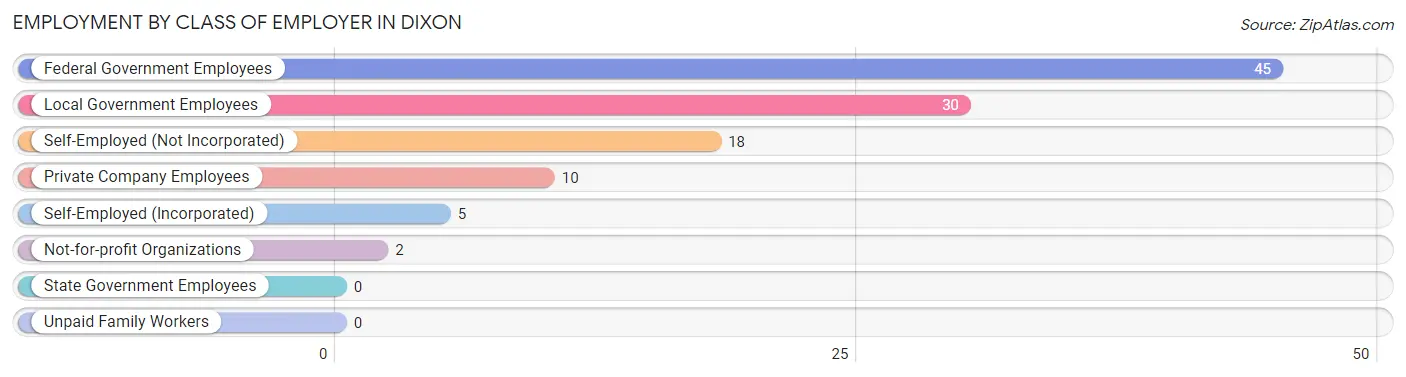
| Employer Class | # Employees | % Employees |
| Private Company Employees | 10 | 9.1% |
| Self-Employed (Incorporated) | 5 | 4.5% |
| Self-Employed (Not Incorporated) | 18 | 16.4% |
| Not-for-profit Organizations | 2 | 1.8% |
| Local Government Employees | 30 | 27.3% |
| State Government Employees | 0 | 0.0% |
| Federal Government Employees | 45 | 40.9% |
| Unpaid Family Workers | 0 | 0.0% |
| Total | 110 | 100.0% |
Employment Status by Age in Dixon
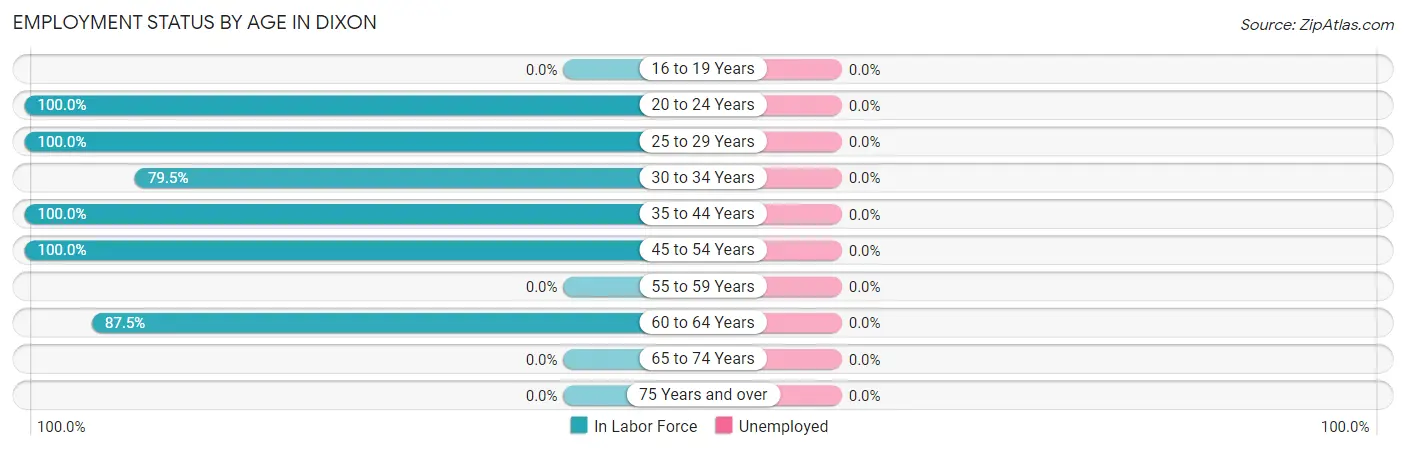
| Age Bracket | In Labor Force | Unemployed |
| 16 to 19 Years | 0 (0.0%) | 0 (0.0%) |
| 20 to 24 Years | 6 (100.0%) | 0 (0.0%) |
| 25 to 29 Years | 19 (100.0%) | 0 (0.0%) |
| 30 to 34 Years | 62 (79.5%) | 0 (0.0%) |
| 35 to 44 Years | 6 (100.0%) | 0 (0.0%) |
| 45 to 54 Years | 10 (100.0%) | 0 (0.0%) |
| 55 to 59 Years | 0 (0.0%) | 0 (0.0%) |
| 60 to 64 Years | 7 (87.5%) | 0 (0.0%) |
| 65 to 74 Years | 0 (0.0%) | 0 (0.0%) |
| 75 Years and over | 0 (0.0%) | 0 (0.0%) |
| Total | 110 (73.8%) | 0 (0.0%) |
Employment Status by Educational Attainment in Dixon
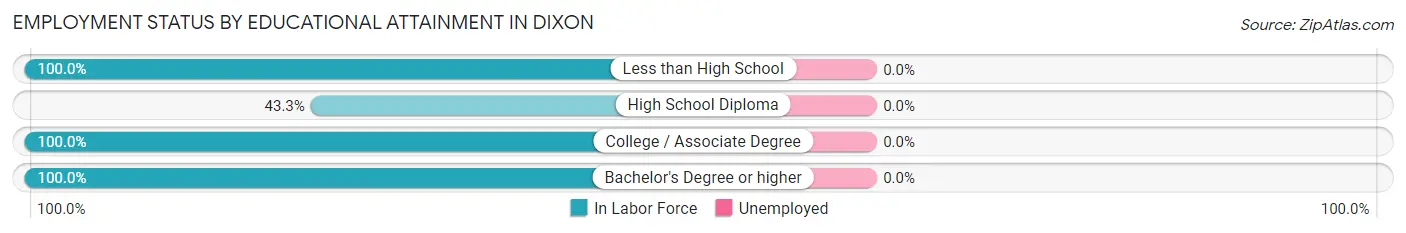
| Educational Attainment | In Labor Force | Unemployed |
| Less than High School | 38 (100.0%) | 0 (0.0%) |
| High School Diploma | 13 (43.3%) | 0 (0.0%) |
| College / Associate Degree | 23 (100.0%) | 0 (0.0%) |
| Bachelor's Degree or higher | 30 (100.0%) | 0 (0.0%) |
| Total | 104 (86.0%) | 0 (0.0%) |
Employment Occupations by Sex in Dixon
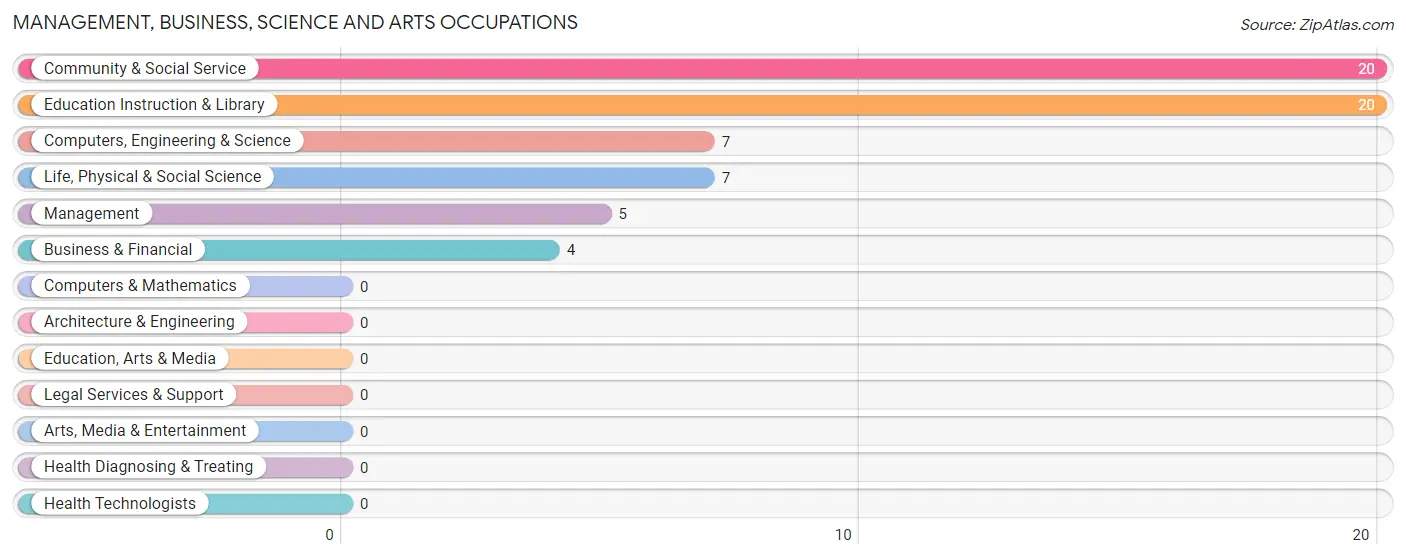
Management, Business, Science and Arts Occupations
The most common Management, Business, Science and Arts occupations in Dixon are Community & Social Service (20 | 18.2%), Education Instruction & Library (20 | 18.2%), Computers, Engineering & Science (7 | 6.4%), Life, Physical & Social Science (7 | 6.4%), and Management (5 | 4.5%).
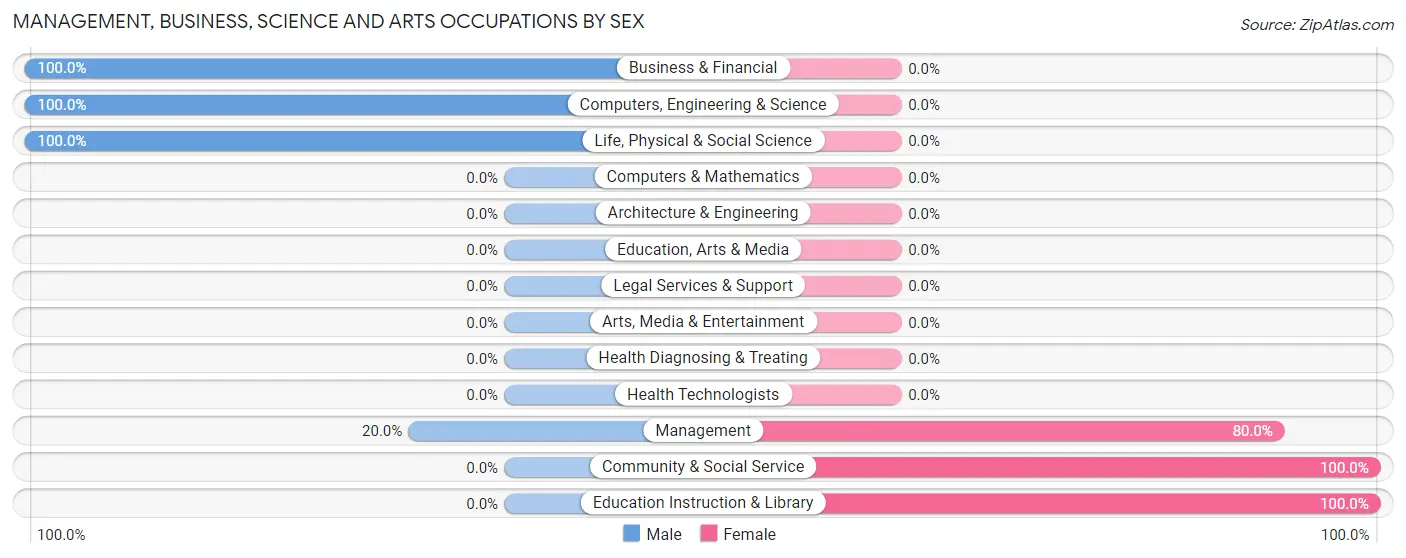
Management, Business, Science and Arts Occupations by Sex
Within the Management, Business, Science and Arts occupations in Dixon, the most male-oriented occupations are Business & Financial (100.0%), Computers, Engineering & Science (100.0%), and Life, Physical & Social Science (100.0%), while the most female-oriented occupations are Community & Social Service (100.0%), Education Instruction & Library (100.0%), and Management (80.0%).
| Occupation | Male | Female |
| Management | 1 (20.0%) | 4 (80.0%) |
| Business & Financial | 4 (100.0%) | 0 (0.0%) |
| Computers, Engineering & Science | 7 (100.0%) | 0 (0.0%) |
| Computers & Mathematics | 0 (0.0%) | 0 (0.0%) |
| Architecture & Engineering | 0 (0.0%) | 0 (0.0%) |
| Life, Physical & Social Science | 7 (100.0%) | 0 (0.0%) |
| Community & Social Service | 0 (0.0%) | 20 (100.0%) |
| Education, Arts & Media | 0 (0.0%) | 0 (0.0%) |
| Legal Services & Support | 0 (0.0%) | 0 (0.0%) |
| Education Instruction & Library | 0 (0.0%) | 20 (100.0%) |
| Arts, Media & Entertainment | 0 (0.0%) | 0 (0.0%) |
| Health Diagnosing & Treating | 0 (0.0%) | 0 (0.0%) |
| Health Technologists | 0 (0.0%) | 0 (0.0%) |
| Total (Category) | 12 (33.3%) | 24 (66.7%) |
| Total (Overall) | 72 (65.4%) | 38 (34.5%) |
Services Occupations
Services Occupations by Sex
| Occupation | Male | Female |
| Healthcare Support | 0 (0.0%) | 0 (0.0%) |
| Security & Protection | 0 (0.0%) | 0 (0.0%) |
| Firefighting & Prevention | 0 (0.0%) | 0 (0.0%) |
| Law Enforcement | 0 (0.0%) | 0 (0.0%) |
| Food Preparation & Serving | 0 (0.0%) | 0 (0.0%) |
| Cleaning & Maintenance | 0 (0.0%) | 0 (0.0%) |
| Personal Care & Service | 0 (0.0%) | 0 (0.0%) |
| Total (Category) | 0 (0.0%) | 0 (0.0%) |
| Total (Overall) | 72 (65.4%) | 38 (34.5%) |
Sales and Office Occupations
The most common Sales and Office occupations in Dixon are , and Office & Administration (14 | 12.7%).
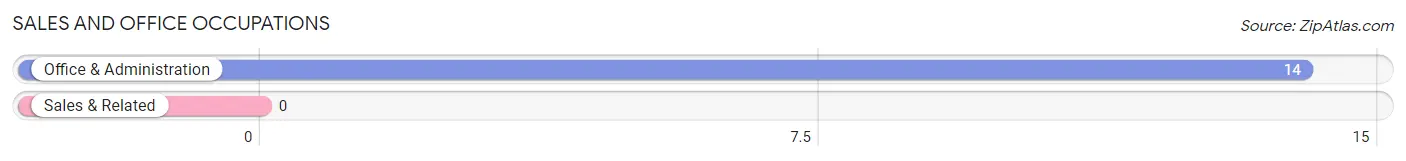
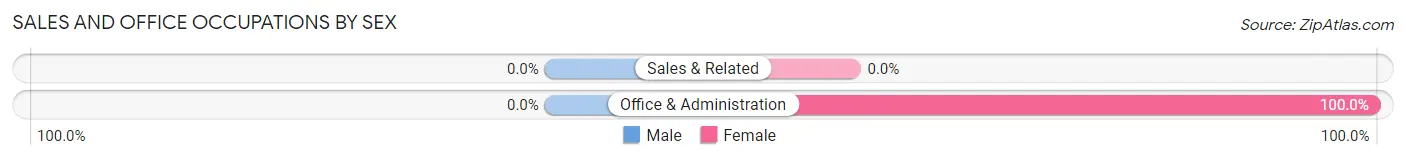
Sales and Office Occupations by Sex
| Occupation | Male | Female |
| Sales & Related | 0 (0.0%) | 0 (0.0%) |
| Office & Administration | 0 (0.0%) | 14 (100.0%) |
| Total (Category) | 0 (0.0%) | 14 (100.0%) |
| Total (Overall) | 72 (65.4%) | 38 (34.5%) |
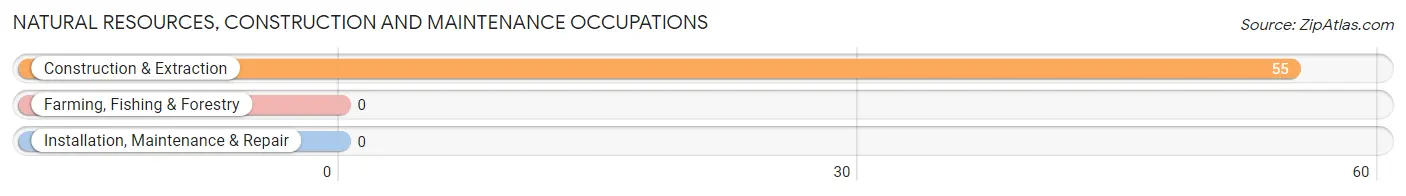
Natural Resources, Construction and Maintenance Occupations
The most common Natural Resources, Construction and Maintenance occupations in Dixon are , and Construction & Extraction (55 | 50.0%).
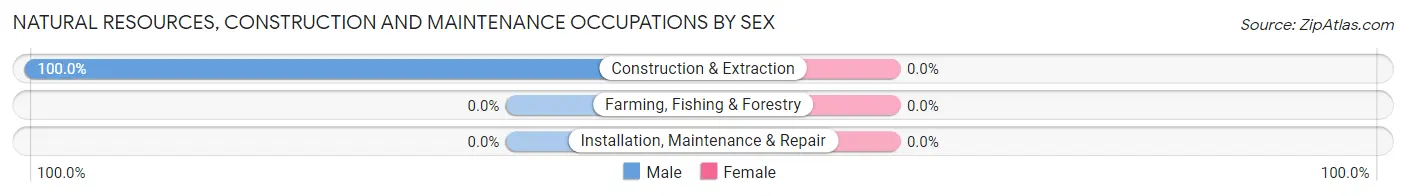
Natural Resources, Construction and Maintenance Occupations by Sex
| Occupation | Male | Female |
| Farming, Fishing & Forestry | 0 (0.0%) | 0 (0.0%) |
| Construction & Extraction | 55 (100.0%) | 0 (0.0%) |
| Installation, Maintenance & Repair | 0 (0.0%) | 0 (0.0%) |
| Total (Category) | 55 (100.0%) | 0 (0.0%) |
| Total (Overall) | 72 (65.4%) | 38 (34.5%) |
Production, Transportation and Moving Occupations
The most common Production, Transportation and Moving occupations in Dixon are , and Transportation (5 | 4.5%).
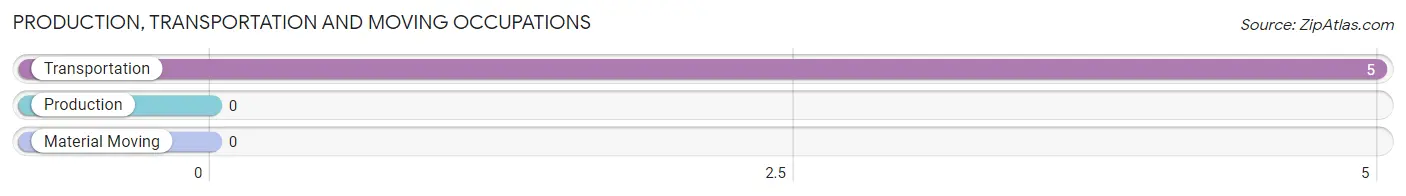
Production, Transportation and Moving Occupations by Sex
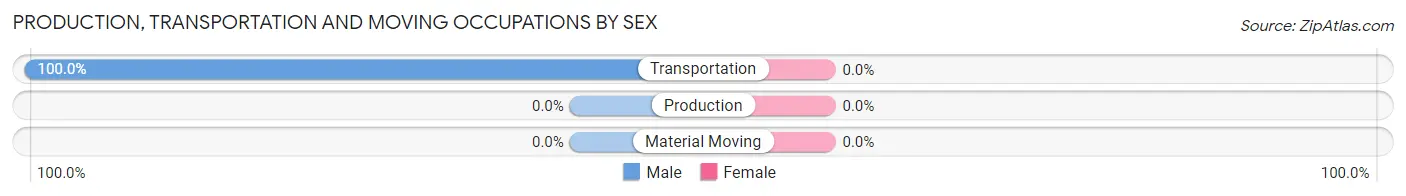
| Occupation | Male | Female |
| Production | 0 (0.0%) | 0 (0.0%) |
| Transportation | 5 (100.0%) | 0 (0.0%) |
| Material Moving | 0 (0.0%) | 0 (0.0%) |
| Total (Category) | 5 (100.0%) | 0 (0.0%) |
| Total (Overall) | 72 (65.4%) | 38 (34.5%) |
Employment Industries by Sex in Dixon
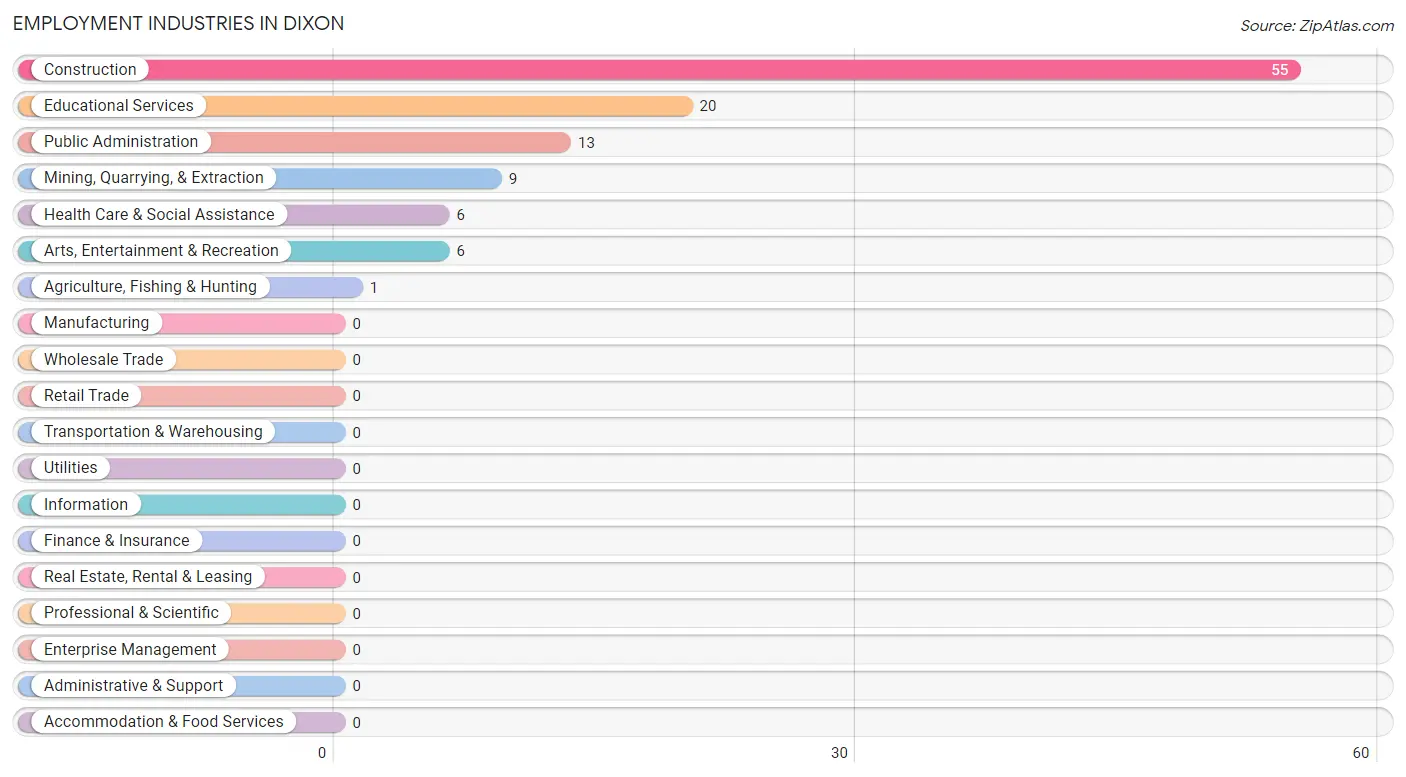
Employment Industries in Dixon
The major employment industries in Dixon include Construction (55 | 50.0%), Educational Services (20 | 18.2%), Public Administration (13 | 11.8%), Mining, Quarrying, & Extraction (9 | 8.2%), and Health Care & Social Assistance (6 | 5.4%).
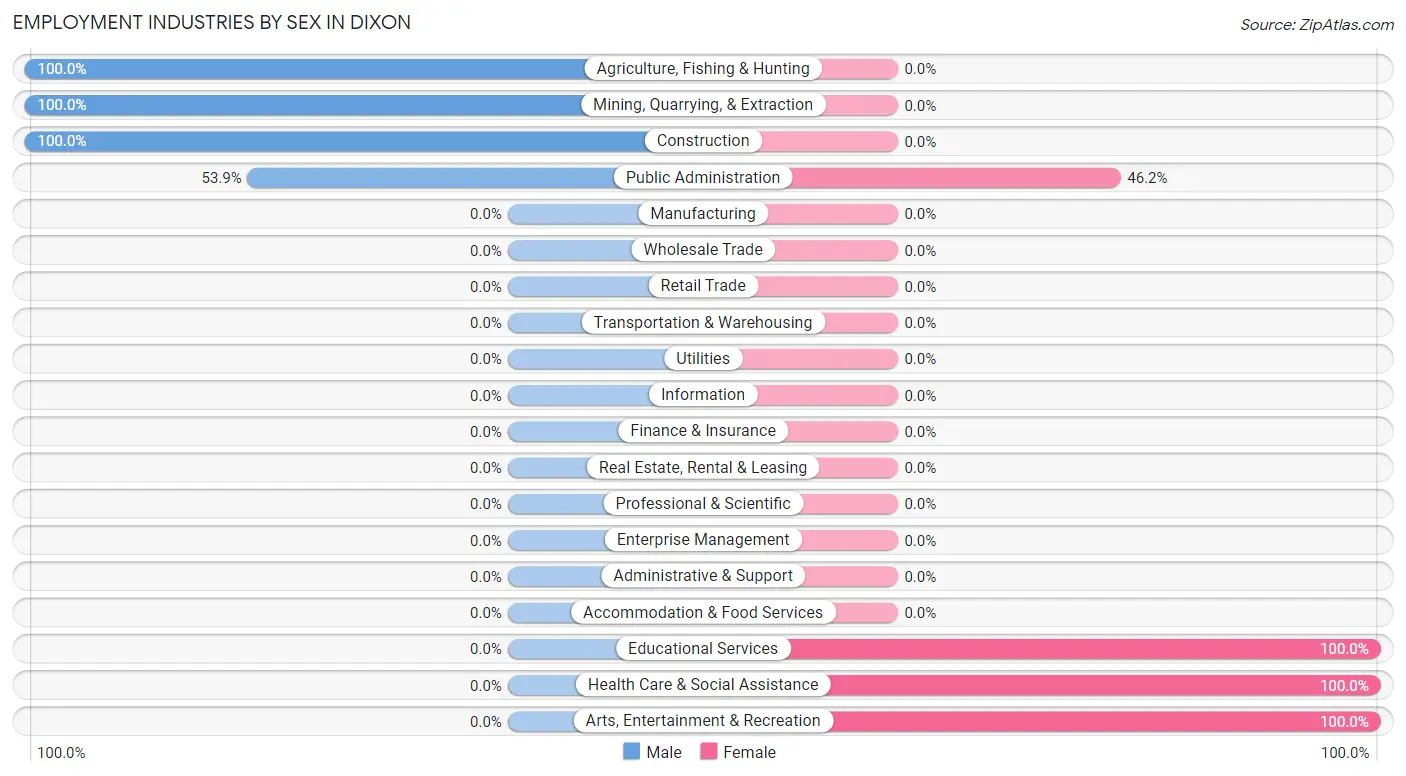
Employment Industries by Sex in Dixon
The Dixon industries that see more men than women are Agriculture, Fishing & Hunting (100.0%), Mining, Quarrying, & Extraction (100.0%), and Construction (100.0%), whereas the industries that tend to have a higher number of women are Educational Services (100.0%), Health Care & Social Assistance (100.0%), and Arts, Entertainment & Recreation (100.0%).
| Industry | Male | Female |
| Agriculture, Fishing & Hunting | 1 (100.0%) | 0 (0.0%) |
| Mining, Quarrying, & Extraction | 9 (100.0%) | 0 (0.0%) |
| Construction | 55 (100.0%) | 0 (0.0%) |
| Manufacturing | 0 (0.0%) | 0 (0.0%) |
| Wholesale Trade | 0 (0.0%) | 0 (0.0%) |
| Retail Trade | 0 (0.0%) | 0 (0.0%) |
| Transportation & Warehousing | 0 (0.0%) | 0 (0.0%) |
| Utilities | 0 (0.0%) | 0 (0.0%) |
| Information | 0 (0.0%) | 0 (0.0%) |
| Finance & Insurance | 0 (0.0%) | 0 (0.0%) |
| Real Estate, Rental & Leasing | 0 (0.0%) | 0 (0.0%) |
| Professional & Scientific | 0 (0.0%) | 0 (0.0%) |
| Enterprise Management | 0 (0.0%) | 0 (0.0%) |
| Administrative & Support | 0 (0.0%) | 0 (0.0%) |
| Educational Services | 0 (0.0%) | 20 (100.0%) |
| Health Care & Social Assistance | 0 (0.0%) | 6 (100.0%) |
| Arts, Entertainment & Recreation | 0 (0.0%) | 6 (100.0%) |
| Accommodation & Food Services | 0 (0.0%) | 0 (0.0%) |
| Public Administration | 7 (53.8%) | 6 (46.2%) |
| Total | 72 (65.4%) | 38 (34.5%) |
Education in Dixon
School Enrollment in Dixon
The most common levels of schooling among the 145 students in Dixon are elementary school (119 | 82.1%), middle school (15 | 10.3%), and college / undergraduate (6 | 4.1%).
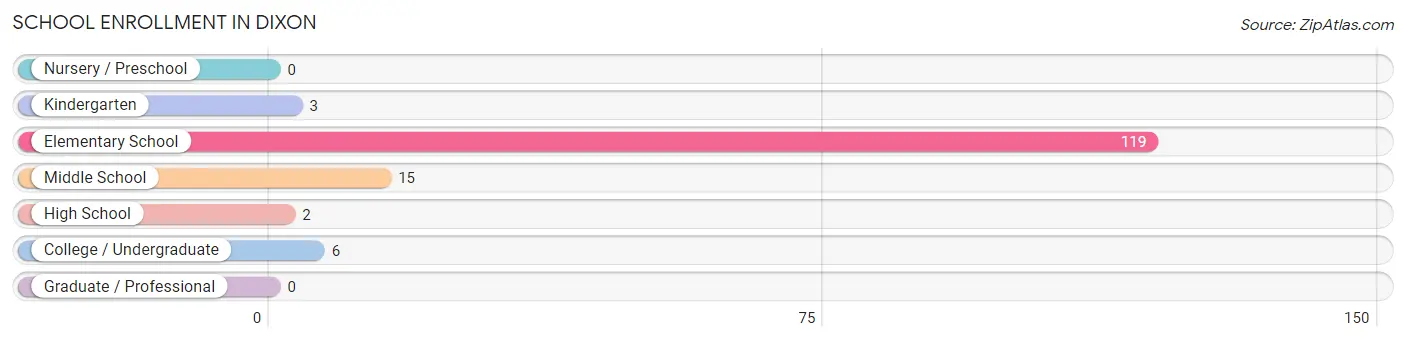
| School Level | # Students | % Students |
| Nursery / Preschool | 0 | 0.0% |
| Kindergarten | 3 | 2.1% |
| Elementary School | 119 | 82.1% |
| Middle School | 15 | 10.3% |
| High School | 2 | 1.4% |
| College / Undergraduate | 6 | 4.1% |
| Graduate / Professional | 0 | 0.0% |
| Total | 145 | 100.0% |
School Enrollment by Age by Funding Source in Dixon
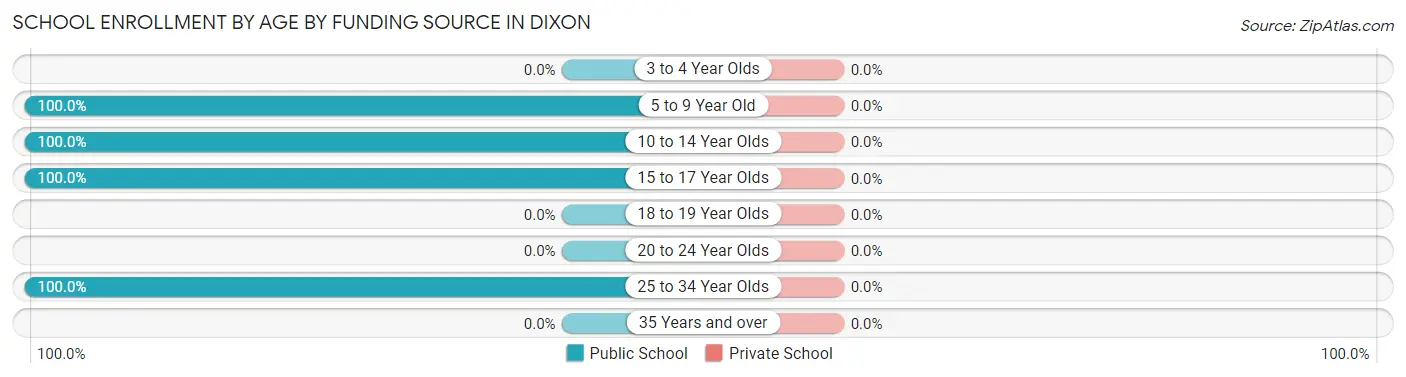
| Age Bracket | Public School | Private School |
| 3 to 4 Year Olds | 0 (0.0%) | 0 (0.0%) |
| 5 to 9 Year Old | 116 (100.0%) | 0 (0.0%) |
| 10 to 14 Year Olds | 21 (100.0%) | 0 (0.0%) |
| 15 to 17 Year Olds | 2 (100.0%) | 0 (0.0%) |
| 18 to 19 Year Olds | 0 (0.0%) | 0 (0.0%) |
| 20 to 24 Year Olds | 0 (0.0%) | 0 (0.0%) |
| 25 to 34 Year Olds | 6 (100.0%) | 0 (0.0%) |
| 35 Years and over | 0 (0.0%) | 0 (0.0%) |
| Total | 145 (100.0%) | 0 (0.0%) |
Educational Attainment by Field of Study in Dixon
Education (14 | 46.7%), bio, nature & agricultural (11 | 36.7%), and arts & humanities (5 | 16.7%) are the most common fields of study among 30 individuals in Dixon who have obtained a bachelor's degree or higher.
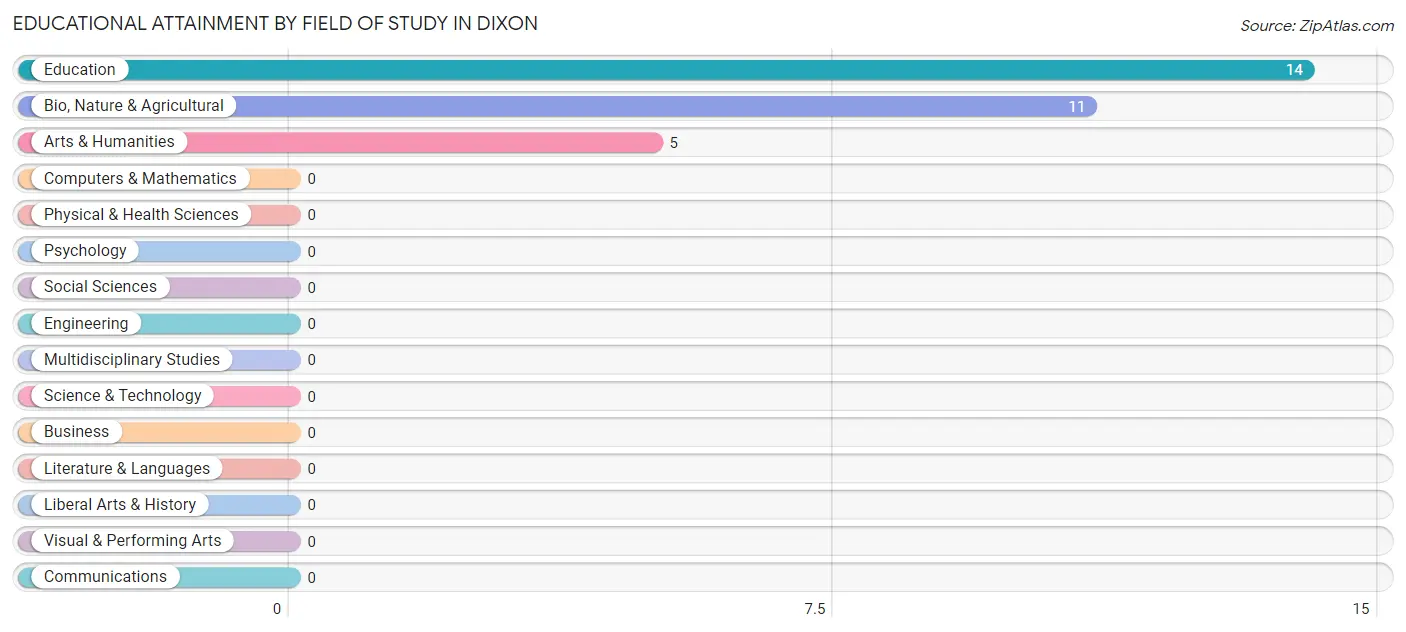
| Field of Study | # Graduates | % Graduates |
| Computers & Mathematics | 0 | 0.0% |
| Bio, Nature & Agricultural | 11 | 36.7% |
| Physical & Health Sciences | 0 | 0.0% |
| Psychology | 0 | 0.0% |
| Social Sciences | 0 | 0.0% |
| Engineering | 0 | 0.0% |
| Multidisciplinary Studies | 0 | 0.0% |
| Science & Technology | 0 | 0.0% |
| Business | 0 | 0.0% |
| Education | 14 | 46.7% |
| Literature & Languages | 0 | 0.0% |
| Liberal Arts & History | 0 | 0.0% |
| Visual & Performing Arts | 0 | 0.0% |
| Communications | 0 | 0.0% |
| Arts & Humanities | 5 | 16.7% |
| Total | 30 | 100.0% |
Transportation & Commute in Dixon
Vehicle Availability by Sex in Dixon
The most prevalent vehicle ownership categories in Dixon are males with 2 vehicles (50, accounting for 69.4%) and females with 2 vehicles (8, making up 131.6%).

| Vehicles Available | Male | Female |
| No Vehicle | 0 (0.0%) | 0 (0.0%) |
| 1 Vehicle | 0 (0.0%) | 7 (18.4%) |
| 2 Vehicles | 50 (69.4%) | 8 (21.0%) |
| 3 Vehicles | 12 (16.7%) | 11 (28.9%) |
| 4 Vehicles | 5 (6.9%) | 6 (15.8%) |
| 5 or more Vehicles | 5 (6.9%) | 6 (15.8%) |
| Total | 72 (100.0%) | 38 (100.0%) |
Commute Time in Dixon
The most frequently occuring commute durations in Dixon are 45 to 59 minutes (38 commuters, 36.5%), 10 to 14 minutes (27 commuters, 26.0%), and 15 to 19 minutes (15 commuters, 14.4%).
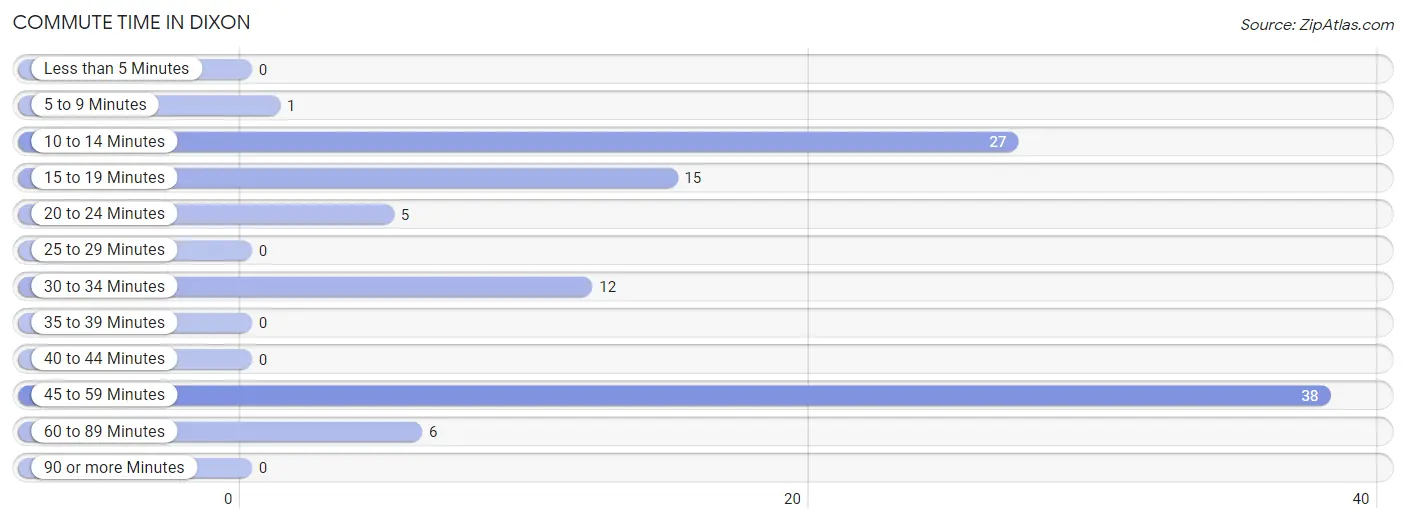
| Commute Time | # Commuters | % Commuters |
| Less than 5 Minutes | 0 | 0.0% |
| 5 to 9 Minutes | 1 | 1.0% |
| 10 to 14 Minutes | 27 | 26.0% |
| 15 to 19 Minutes | 15 | 14.4% |
| 20 to 24 Minutes | 5 | 4.8% |
| 25 to 29 Minutes | 0 | 0.0% |
| 30 to 34 Minutes | 12 | 11.5% |
| 35 to 39 Minutes | 0 | 0.0% |
| 40 to 44 Minutes | 0 | 0.0% |
| 45 to 59 Minutes | 38 | 36.5% |
| 60 to 89 Minutes | 6 | 5.8% |
| 90 or more Minutes | 0 | 0.0% |
Commute Time by Sex in Dixon
The most common commute times in Dixon are 45 to 59 minutes (38 commuters, 52.8%) for males and 10 to 14 minutes (20 commuters, 62.5%) for females.
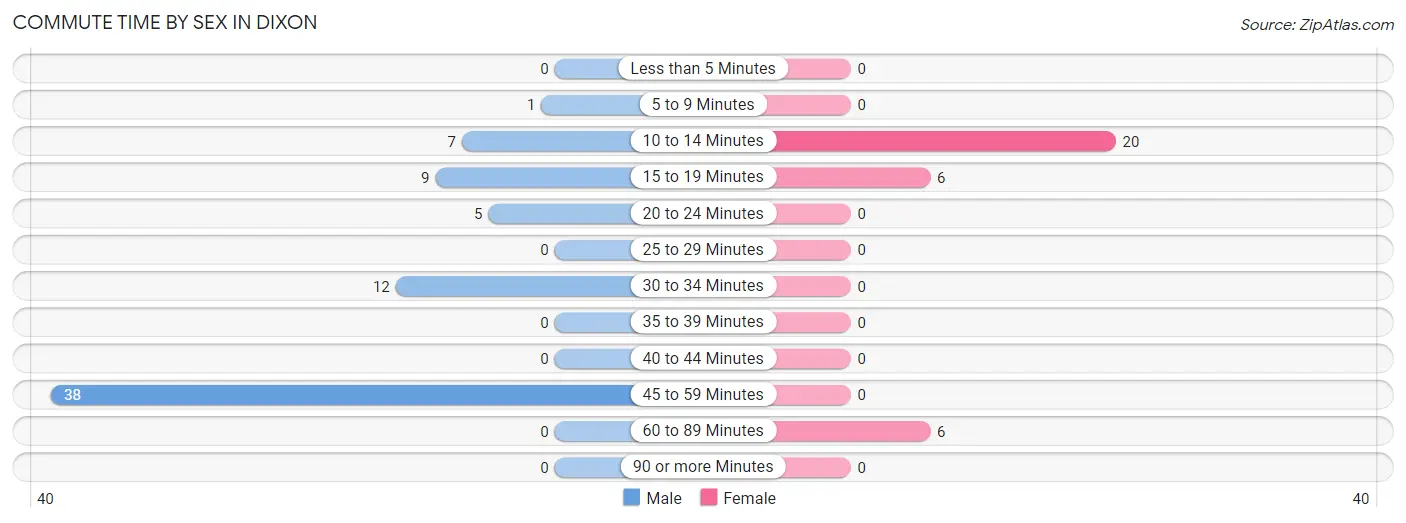
| Commute Time | Male | Female |
| Less than 5 Minutes | 0 (0.0%) | 0 (0.0%) |
| 5 to 9 Minutes | 1 (1.4%) | 0 (0.0%) |
| 10 to 14 Minutes | 7 (9.7%) | 20 (62.5%) |
| 15 to 19 Minutes | 9 (12.5%) | 6 (18.8%) |
| 20 to 24 Minutes | 5 (6.9%) | 0 (0.0%) |
| 25 to 29 Minutes | 0 (0.0%) | 0 (0.0%) |
| 30 to 34 Minutes | 12 (16.7%) | 0 (0.0%) |
| 35 to 39 Minutes | 0 (0.0%) | 0 (0.0%) |
| 40 to 44 Minutes | 0 (0.0%) | 0 (0.0%) |
| 45 to 59 Minutes | 38 (52.8%) | 0 (0.0%) |
| 60 to 89 Minutes | 0 (0.0%) | 6 (18.8%) |
| 90 or more Minutes | 0 (0.0%) | 0 (0.0%) |
Time of Departure to Work by Sex in Dixon
The most frequent times of departure to work in Dixon are 7:00 AM to 7:29 AM (45, 62.5%) for males and 7:00 AM to 7:29 AM (14, 43.8%) for females.
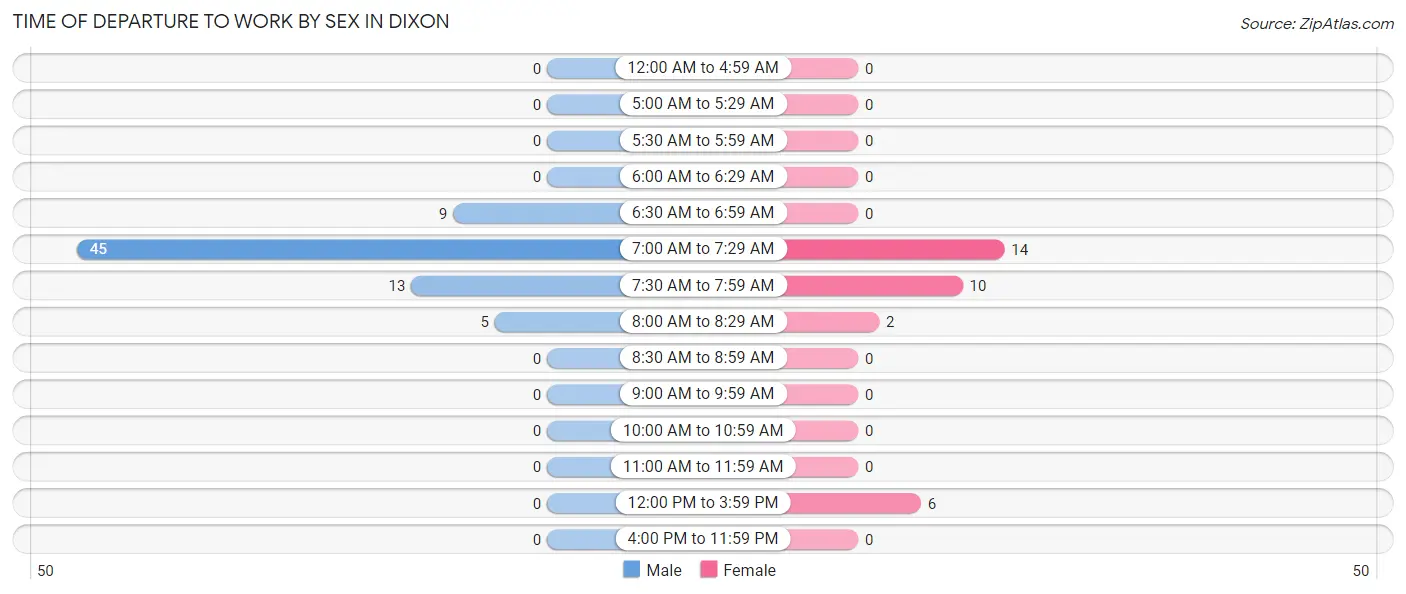
| Time of Departure | Male | Female |
| 12:00 AM to 4:59 AM | 0 (0.0%) | 0 (0.0%) |
| 5:00 AM to 5:29 AM | 0 (0.0%) | 0 (0.0%) |
| 5:30 AM to 5:59 AM | 0 (0.0%) | 0 (0.0%) |
| 6:00 AM to 6:29 AM | 0 (0.0%) | 0 (0.0%) |
| 6:30 AM to 6:59 AM | 9 (12.5%) | 0 (0.0%) |
| 7:00 AM to 7:29 AM | 45 (62.5%) | 14 (43.8%) |
| 7:30 AM to 7:59 AM | 13 (18.1%) | 10 (31.2%) |
| 8:00 AM to 8:29 AM | 5 (6.9%) | 2 (6.2%) |
| 8:30 AM to 8:59 AM | 0 (0.0%) | 0 (0.0%) |
| 9:00 AM to 9:59 AM | 0 (0.0%) | 0 (0.0%) |
| 10:00 AM to 10:59 AM | 0 (0.0%) | 0 (0.0%) |
| 11:00 AM to 11:59 AM | 0 (0.0%) | 0 (0.0%) |
| 12:00 PM to 3:59 PM | 0 (0.0%) | 6 (18.8%) |
| 4:00 PM to 11:59 PM | 0 (0.0%) | 0 (0.0%) |
| Total | 72 (100.0%) | 32 (100.0%) |
Housing Occupancy in Dixon
Occupancy by Ownership in Dixon
Of the total 70 dwellings in Dixon, owner-occupied units account for 62 (88.6%), while renter-occupied units make up 8 (11.4%).
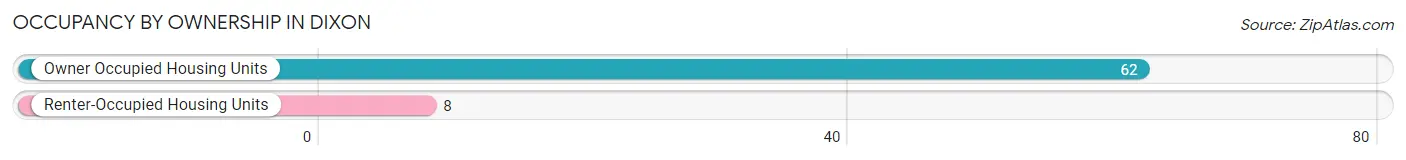
| Occupancy | # Housing Units | % Housing Units |
| Owner Occupied Housing Units | 62 | 88.6% |
| Renter-Occupied Housing Units | 8 | 11.4% |
| Total Occupied Housing Units | 70 | 100.0% |
Occupancy by Household Size in Dixon
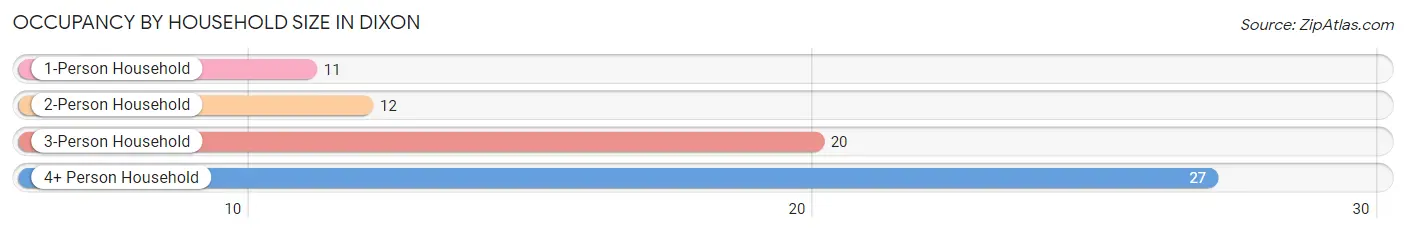
| Household Size | # Housing Units | % Housing Units |
| 1-Person Household | 11 | 15.7% |
| 2-Person Household | 12 | 17.1% |
| 3-Person Household | 20 | 28.6% |
| 4+ Person Household | 27 | 38.6% |
| Total Housing Units | 70 | 100.0% |
Occupancy by Ownership by Household Size in Dixon
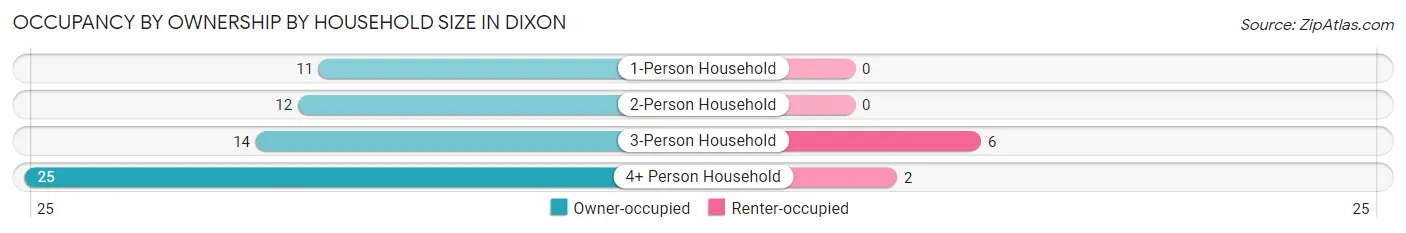
| Household Size | Owner-occupied | Renter-occupied |
| 1-Person Household | 11 (100.0%) | 0 (0.0%) |
| 2-Person Household | 12 (100.0%) | 0 (0.0%) |
| 3-Person Household | 14 (70.0%) | 6 (30.0%) |
| 4+ Person Household | 25 (92.6%) | 2 (7.4%) |
| Total Housing Units | 62 (88.6%) | 8 (11.4%) |
Occupancy by Educational Attainment in Dixon
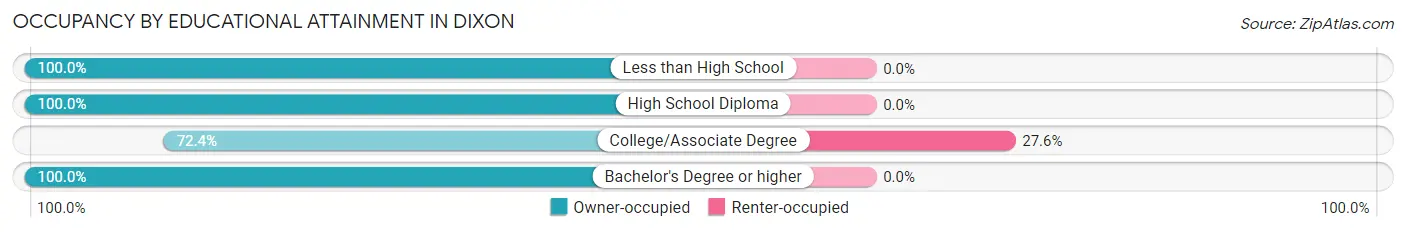
| Household Size | Owner-occupied | Renter-occupied |
| Less than High School | 1 (100.0%) | 0 (0.0%) |
| High School Diploma | 17 (100.0%) | 0 (0.0%) |
| College/Associate Degree | 21 (72.4%) | 8 (27.6%) |
| Bachelor's Degree or higher | 23 (100.0%) | 0 (0.0%) |
Occupancy by Age of Householder in Dixon
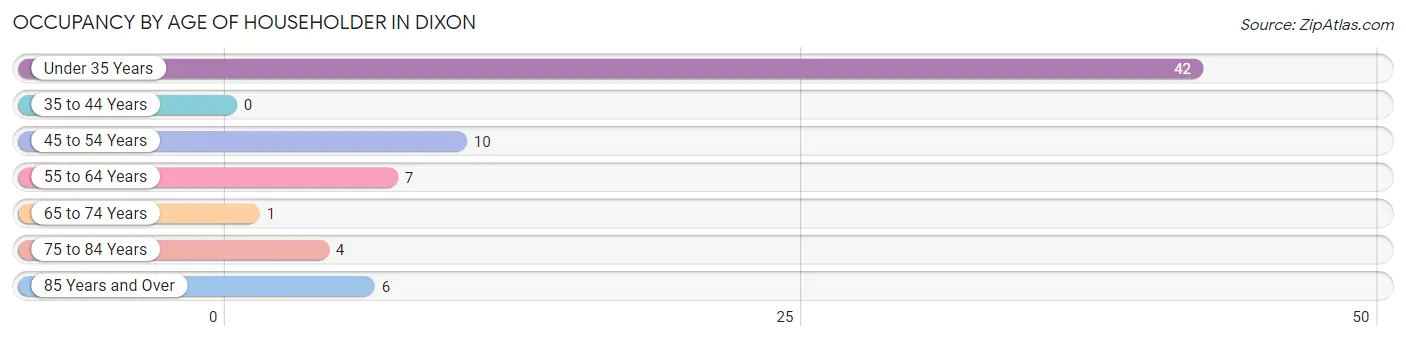
| Age Bracket | # Households | % Households |
| Under 35 Years | 42 | 60.0% |
| 35 to 44 Years | 0 | 0.0% |
| 45 to 54 Years | 10 | 14.3% |
| 55 to 64 Years | 7 | 10.0% |
| 65 to 74 Years | 1 | 1.4% |
| 75 to 84 Years | 4 | 5.7% |
| 85 Years and Over | 6 | 8.6% |
| Total | 70 | 100.0% |
Housing Finances in Dixon
Median Income by Occupancy in Dixon
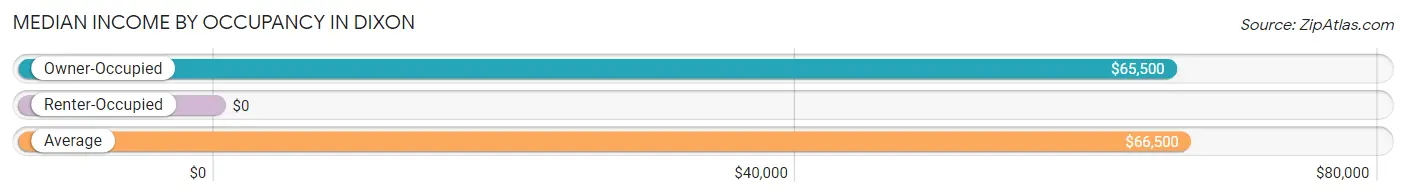
| Occupancy Type | # Households | Median Income |
| Owner-Occupied | 62 (88.6%) | $65,500 |
| Renter-Occupied | 8 (11.4%) | $0 |
| Average | 70 (100.0%) | $66,500 |
Occupancy by Householder Income Bracket in Dixon
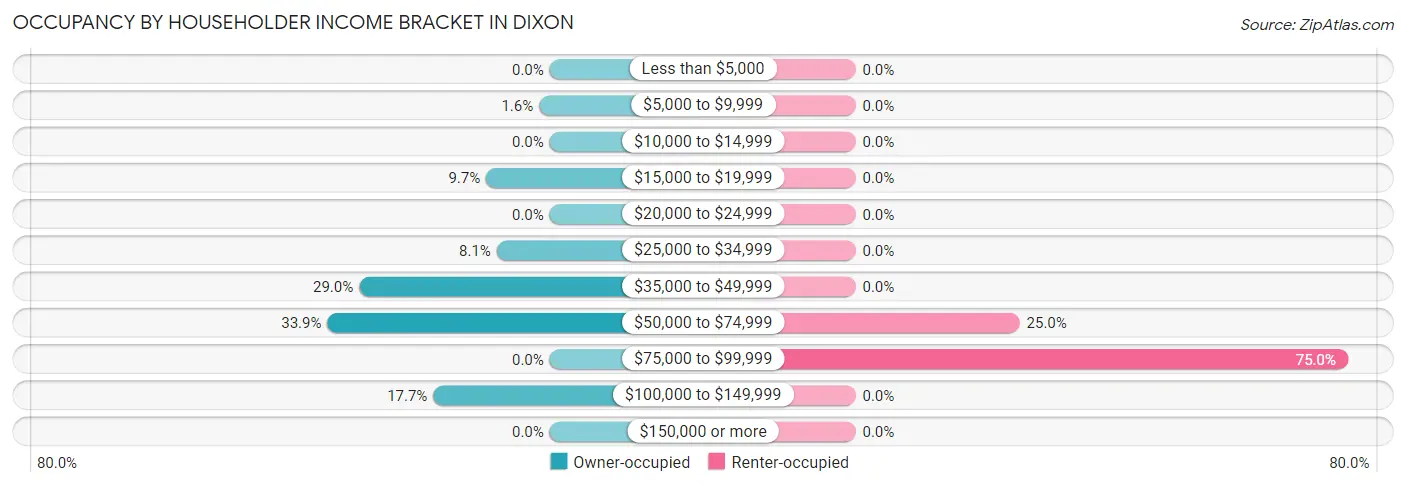
| Income Bracket | Owner-occupied | Renter-occupied |
| Less than $5,000 | 0 (0.0%) | 0 (0.0%) |
| $5,000 to $9,999 | 1 (1.6%) | 0 (0.0%) |
| $10,000 to $14,999 | 0 (0.0%) | 0 (0.0%) |
| $15,000 to $19,999 | 6 (9.7%) | 0 (0.0%) |
| $20,000 to $24,999 | 0 (0.0%) | 0 (0.0%) |
| $25,000 to $34,999 | 5 (8.1%) | 0 (0.0%) |
| $35,000 to $49,999 | 18 (29.0%) | 0 (0.0%) |
| $50,000 to $74,999 | 21 (33.9%) | 2 (25.0%) |
| $75,000 to $99,999 | 0 (0.0%) | 6 (75.0%) |
| $100,000 to $149,999 | 11 (17.7%) | 0 (0.0%) |
| $150,000 or more | 0 (0.0%) | 0 (0.0%) |
| Total | 62 (100.0%) | 8 (100.0%) |
Monthly Housing Cost Tiers in Dixon
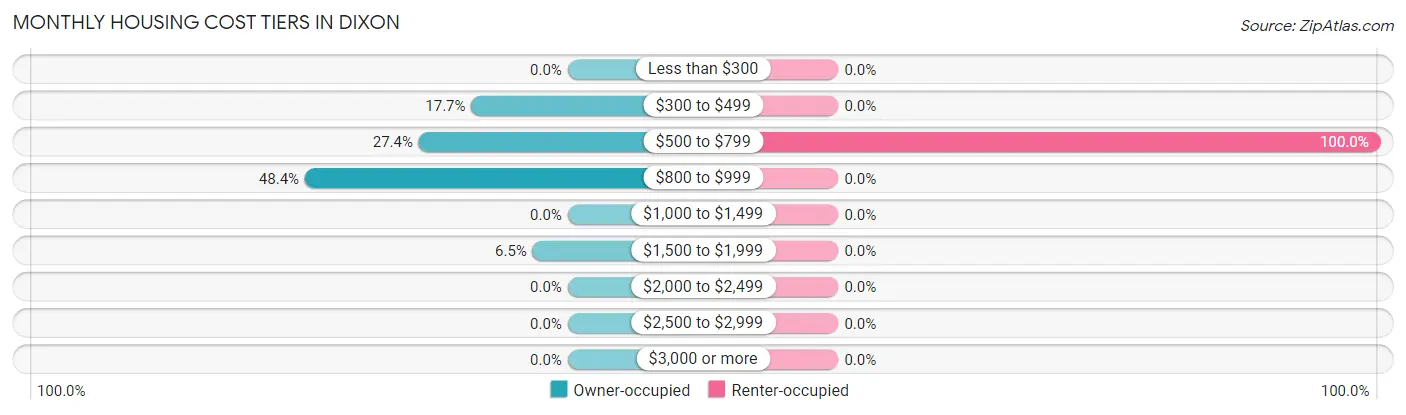
| Monthly Cost | Owner-occupied | Renter-occupied |
| Less than $300 | 0 (0.0%) | 0 (0.0%) |
| $300 to $499 | 11 (17.7%) | 0 (0.0%) |
| $500 to $799 | 17 (27.4%) | 8 (100.0%) |
| $800 to $999 | 30 (48.4%) | 0 (0.0%) |
| $1,000 to $1,499 | 0 (0.0%) | 0 (0.0%) |
| $1,500 to $1,999 | 4 (6.5%) | 0 (0.0%) |
| $2,000 to $2,499 | 0 (0.0%) | 0 (0.0%) |
| $2,500 to $2,999 | 0 (0.0%) | 0 (0.0%) |
| $3,000 or more | 0 (0.0%) | 0 (0.0%) |
| Total | 62 (100.0%) | 8 (100.0%) |
Physical Housing Characteristics in Dixon
Housing Structures in Dixon
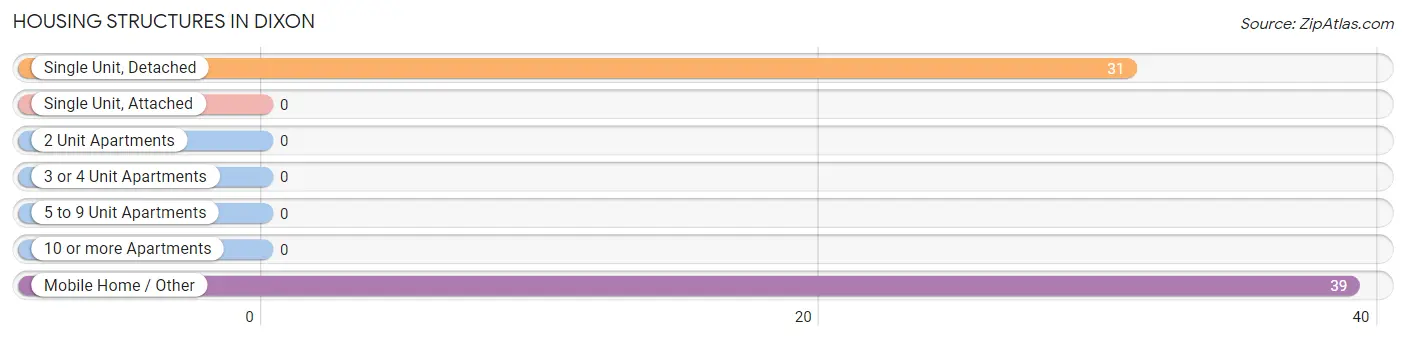
| Structure Type | # Housing Units | % Housing Units |
| Single Unit, Detached | 31 | 44.3% |
| Single Unit, Attached | 0 | 0.0% |
| 2 Unit Apartments | 0 | 0.0% |
| 3 or 4 Unit Apartments | 0 | 0.0% |
| 5 to 9 Unit Apartments | 0 | 0.0% |
| 10 or more Apartments | 0 | 0.0% |
| Mobile Home / Other | 39 | 55.7% |
| Total | 70 | 100.0% |
Housing Structures by Occupancy in Dixon
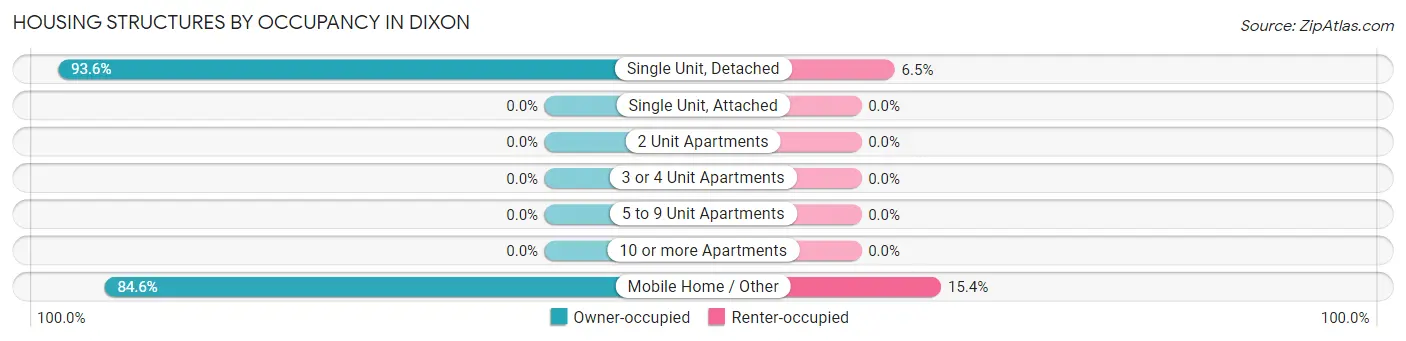
| Structure Type | Owner-occupied | Renter-occupied |
| Single Unit, Detached | 29 (93.5%) | 2 (6.5%) |
| Single Unit, Attached | 0 (0.0%) | 0 (0.0%) |
| 2 Unit Apartments | 0 (0.0%) | 0 (0.0%) |
| 3 or 4 Unit Apartments | 0 (0.0%) | 0 (0.0%) |
| 5 to 9 Unit Apartments | 0 (0.0%) | 0 (0.0%) |
| 10 or more Apartments | 0 (0.0%) | 0 (0.0%) |
| Mobile Home / Other | 33 (84.6%) | 6 (15.4%) |
| Total | 62 (88.6%) | 8 (11.4%) |
Housing Structures by Number of Rooms in Dixon
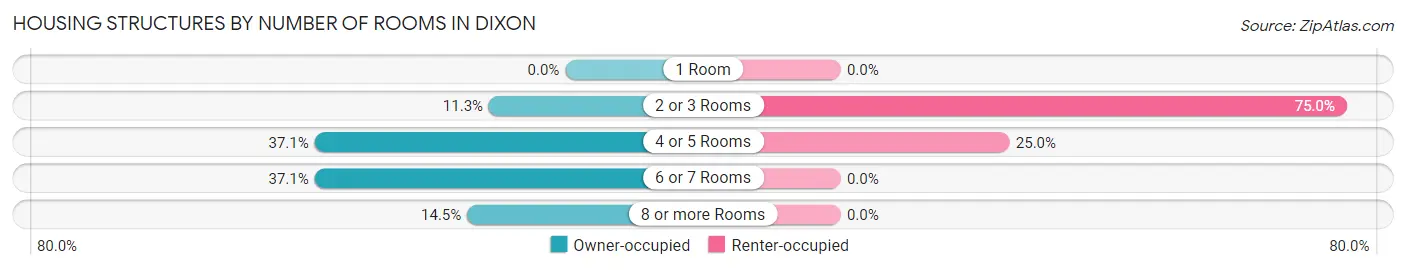
| Number of Rooms | Owner-occupied | Renter-occupied |
| 1 Room | 0 (0.0%) | 0 (0.0%) |
| 2 or 3 Rooms | 7 (11.3%) | 6 (75.0%) |
| 4 or 5 Rooms | 23 (37.1%) | 2 (25.0%) |
| 6 or 7 Rooms | 23 (37.1%) | 0 (0.0%) |
| 8 or more Rooms | 9 (14.5%) | 0 (0.0%) |
| Total | 62 (100.0%) | 8 (100.0%) |
Housing Structure by Heating Type in Dixon
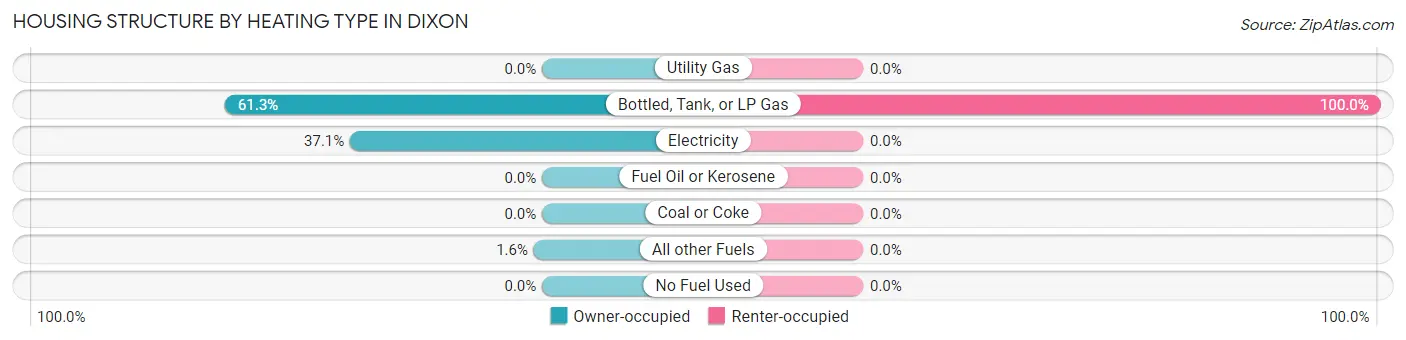
| Heating Type | Owner-occupied | Renter-occupied |
| Utility Gas | 0 (0.0%) | 0 (0.0%) |
| Bottled, Tank, or LP Gas | 38 (61.3%) | 8 (100.0%) |
| Electricity | 23 (37.1%) | 0 (0.0%) |
| Fuel Oil or Kerosene | 0 (0.0%) | 0 (0.0%) |
| Coal or Coke | 0 (0.0%) | 0 (0.0%) |
| All other Fuels | 1 (1.6%) | 0 (0.0%) |
| No Fuel Used | 0 (0.0%) | 0 (0.0%) |
| Total | 62 (100.0%) | 8 (100.0%) |
Household Vehicle Usage in Dixon
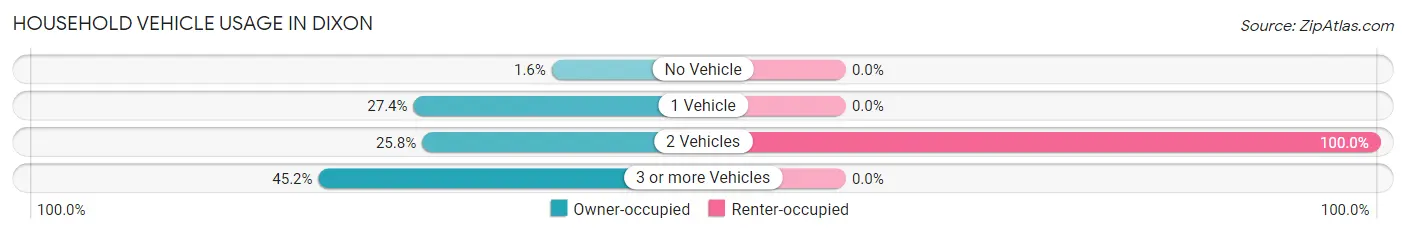
| Vehicles per Household | Owner-occupied | Renter-occupied |
| No Vehicle | 1 (1.6%) | 0 (0.0%) |
| 1 Vehicle | 17 (27.4%) | 0 (0.0%) |
| 2 Vehicles | 16 (25.8%) | 8 (100.0%) |
| 3 or more Vehicles | 28 (45.2%) | 0 (0.0%) |
| Total | 62 (100.0%) | 8 (100.0%) |
Real Estate & Mortgages in Dixon
Real Estate and Mortgage Overview in Dixon
| Characteristic | Without Mortgage | With Mortgage |
| Housing Units | 28 | 34 |
| Median Property Value | $160,000 | $114,200 |
| Median Household Income | $43,333 | $0 |
| Monthly Housing Costs | $550 | $0 |
| Real Estate Taxes | $764 | $0 |
Property Value by Mortgage Status in Dixon
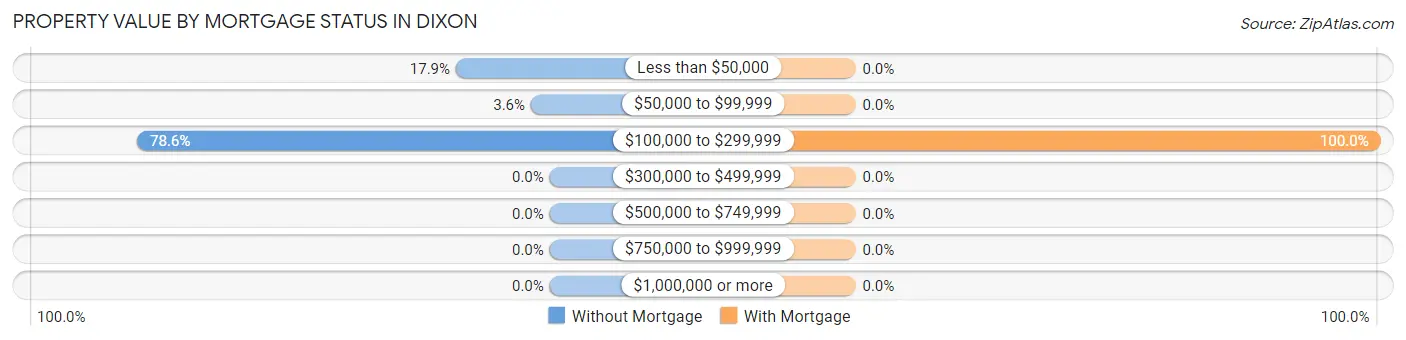
| Property Value | Without Mortgage | With Mortgage |
| Less than $50,000 | 5 (17.9%) | 0 (0.0%) |
| $50,000 to $99,999 | 1 (3.6%) | 0 (0.0%) |
| $100,000 to $299,999 | 22 (78.6%) | 34 (100.0%) |
| $300,000 to $499,999 | 0 (0.0%) | 0 (0.0%) |
| $500,000 to $749,999 | 0 (0.0%) | 0 (0.0%) |
| $750,000 to $999,999 | 0 (0.0%) | 0 (0.0%) |
| $1,000,000 or more | 0 (0.0%) | 0 (0.0%) |
| Total | 28 (100.0%) | 34 (100.0%) |
Household Income by Mortgage Status in Dixon
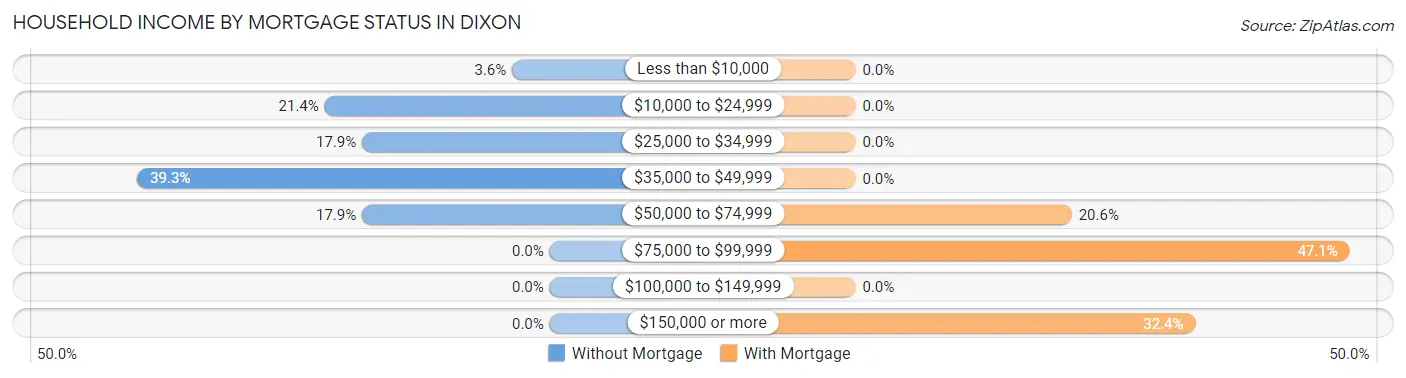
| Household Income | Without Mortgage | With Mortgage |
| Less than $10,000 | 1 (3.6%) | 0 (0.0%) |
| $10,000 to $24,999 | 6 (21.4%) | 0 (0.0%) |
| $25,000 to $34,999 | 5 (17.9%) | 0 (0.0%) |
| $35,000 to $49,999 | 11 (39.3%) | 0 (0.0%) |
| $50,000 to $74,999 | 5 (17.9%) | 7 (20.6%) |
| $75,000 to $99,999 | 0 (0.0%) | 16 (47.1%) |
| $100,000 to $149,999 | 0 (0.0%) | 0 (0.0%) |
| $150,000 or more | 0 (0.0%) | 11 (32.4%) |
| Total | 28 (100.0%) | 34 (100.0%) |
Property Value to Household Income Ratio in Dixon
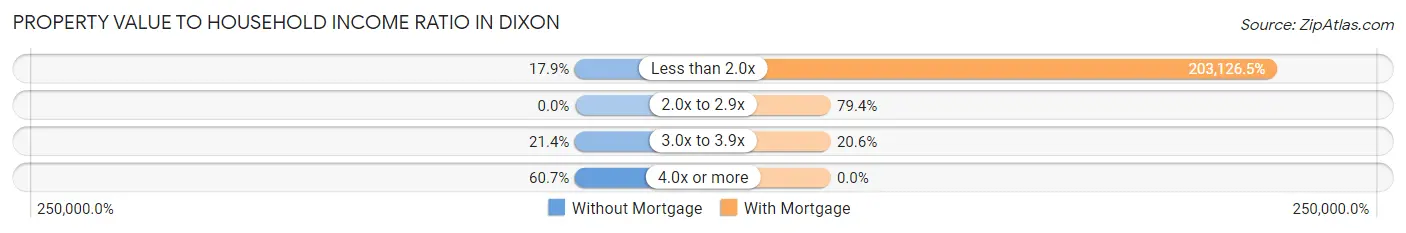
| Value-to-Income Ratio | Without Mortgage | With Mortgage |
| Less than 2.0x | 5 (17.9%) | 69,063 (203,126.5%) |
| 2.0x to 2.9x | 0 (0.0%) | 27 (79.4%) |
| 3.0x to 3.9x | 6 (21.4%) | 7 (20.6%) |
| 4.0x or more | 17 (60.7%) | 0 (0.0%) |
| Total | 28 (100.0%) | 34 (100.0%) |
Real Estate Taxes by Mortgage Status in Dixon
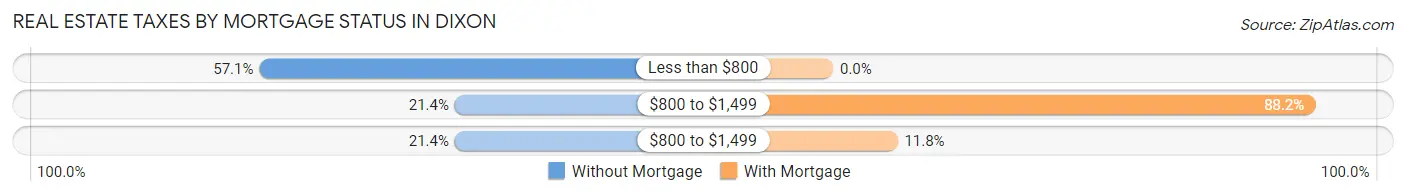
| Property Taxes | Without Mortgage | With Mortgage |
| Less than $800 | 16 (57.1%) | 0 (0.0%) |
| $800 to $1,499 | 6 (21.4%) | 30 (88.2%) |
| $800 to $1,499 | 6 (21.4%) | 4 (11.8%) |
| Total | 28 (100.0%) | 34 (100.0%) |
Health & Disability in Dixon
Health Insurance Coverage by Age in Dixon
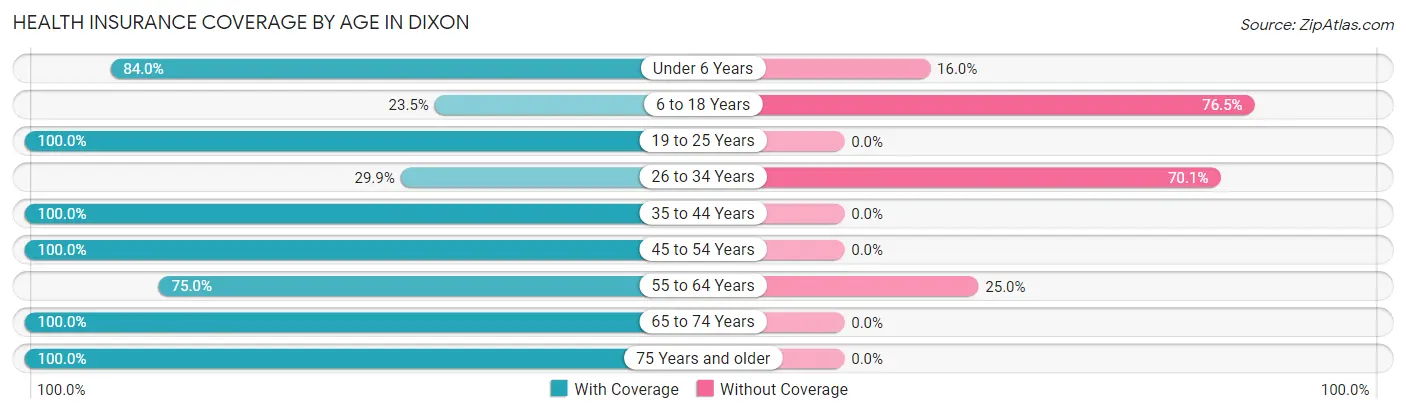
| Age Bracket | With Coverage | Without Coverage |
| Under 6 Years | 21 (84.0%) | 4 (16.0%) |
| 6 to 18 Years | 32 (23.5%) | 104 (76.5%) |
| 19 to 25 Years | 6 (100.0%) | 0 (0.0%) |
| 26 to 34 Years | 29 (29.9%) | 68 (70.1%) |
| 35 to 44 Years | 6 (100.0%) | 0 (0.0%) |
| 45 to 54 Years | 10 (100.0%) | 0 (0.0%) |
| 55 to 64 Years | 6 (75.0%) | 2 (25.0%) |
| 65 to 74 Years | 12 (100.0%) | 0 (0.0%) |
| 75 Years and older | 10 (100.0%) | 0 (0.0%) |
| Total | 132 (42.6%) | 178 (57.4%) |
Health Insurance Coverage by Citizenship Status in Dixon
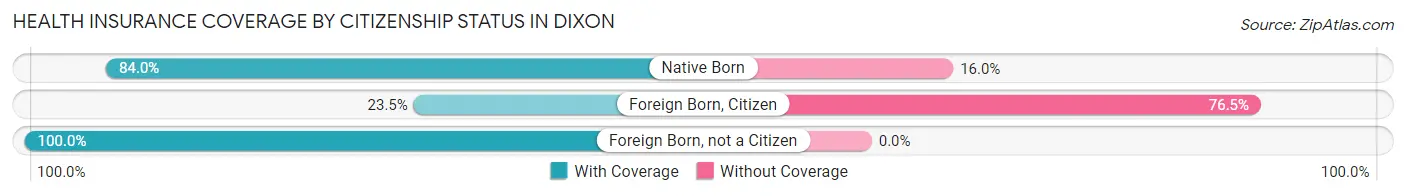
| Citizenship Status | With Coverage | Without Coverage |
| Native Born | 21 (84.0%) | 4 (16.0%) |
| Foreign Born, Citizen | 32 (23.5%) | 104 (76.5%) |
| Foreign Born, not a Citizen | 6 (100.0%) | 0 (0.0%) |
Health Insurance Coverage by Household Income in Dixon
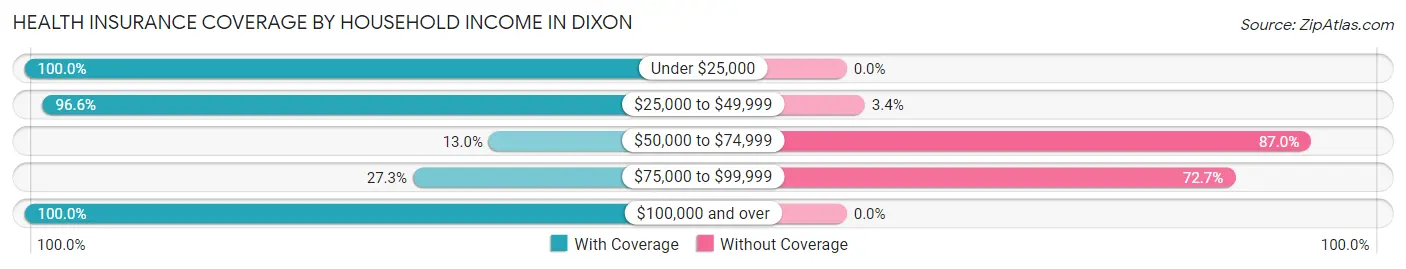
| Household Income | With Coverage | Without Coverage |
| Under $25,000 | 7 (100.0%) | 0 (0.0%) |
| $25,000 to $49,999 | 57 (96.6%) | 2 (3.4%) |
| $50,000 to $74,999 | 24 (13.0%) | 160 (87.0%) |
| $75,000 to $99,999 | 6 (27.3%) | 16 (72.7%) |
| $100,000 and over | 38 (100.0%) | 0 (0.0%) |
Public vs Private Health Insurance Coverage by Age in Dixon
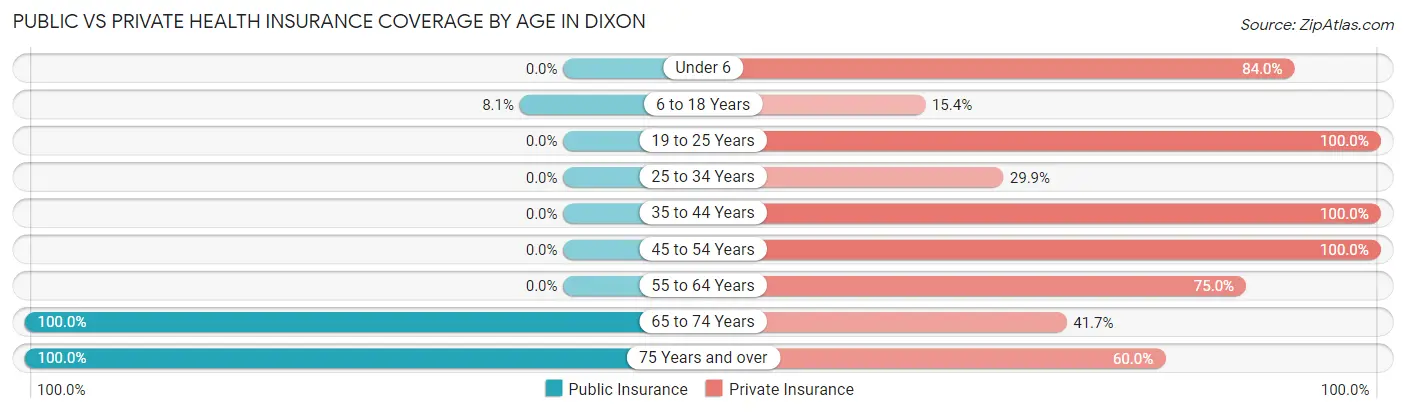
| Age Bracket | Public Insurance | Private Insurance |
| Under 6 | 0 (0.0%) | 21 (84.0%) |
| 6 to 18 Years | 11 (8.1%) | 21 (15.4%) |
| 19 to 25 Years | 0 (0.0%) | 6 (100.0%) |
| 25 to 34 Years | 0 (0.0%) | 29 (29.9%) |
| 35 to 44 Years | 0 (0.0%) | 6 (100.0%) |
| 45 to 54 Years | 0 (0.0%) | 10 (100.0%) |
| 55 to 64 Years | 0 (0.0%) | 6 (75.0%) |
| 65 to 74 Years | 12 (100.0%) | 5 (41.7%) |
| 75 Years and over | 10 (100.0%) | 6 (60.0%) |
| Total | 33 (10.6%) | 110 (35.5%) |
Disability Status by Sex by Age in Dixon
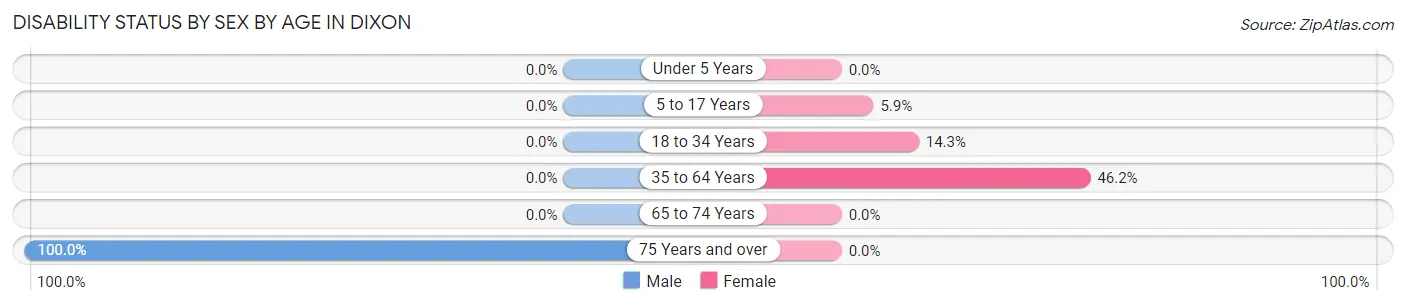
| Age Bracket | Male | Female |
| Under 5 Years | 0 (0.0%) | 0 (0.0%) |
| 5 to 17 Years | 0 (0.0%) | 2 (5.9%) |
| 18 to 34 Years | 0 (0.0%) | 6 (14.3%) |
| 35 to 64 Years | 0 (0.0%) | 6 (46.2%) |
| 65 to 74 Years | 0 (0.0%) | 0 (0.0%) |
| 75 Years and over | 4 (100.0%) | 0 (0.0%) |
Disability Class by Sex by Age in Dixon
Disability Class: Hearing Difficulty
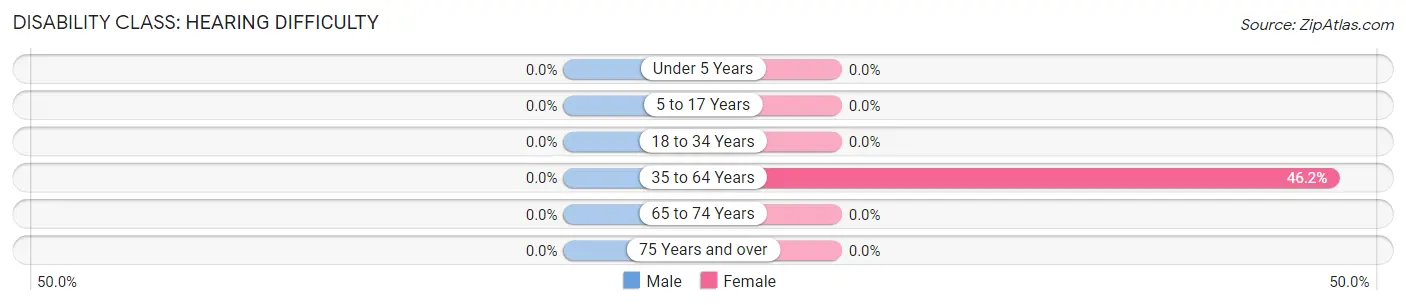
| Age Bracket | Male | Female |
| Under 5 Years | 0 (0.0%) | 0 (0.0%) |
| 5 to 17 Years | 0 (0.0%) | 0 (0.0%) |
| 18 to 34 Years | 0 (0.0%) | 0 (0.0%) |
| 35 to 64 Years | 0 (0.0%) | 6 (46.2%) |
| 65 to 74 Years | 0 (0.0%) | 0 (0.0%) |
| 75 Years and over | 0 (0.0%) | 0 (0.0%) |
Disability Class: Vision Difficulty
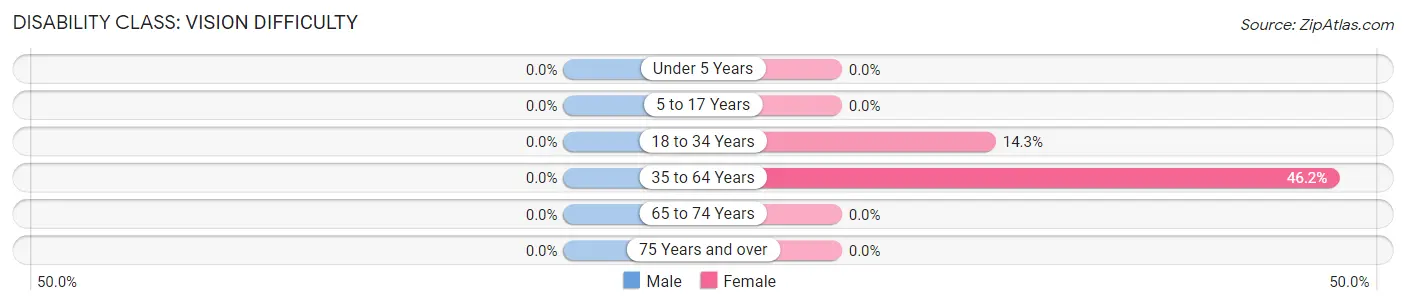
| Age Bracket | Male | Female |
| Under 5 Years | 0 (0.0%) | 0 (0.0%) |
| 5 to 17 Years | 0 (0.0%) | 0 (0.0%) |
| 18 to 34 Years | 0 (0.0%) | 6 (14.3%) |
| 35 to 64 Years | 0 (0.0%) | 6 (46.2%) |
| 65 to 74 Years | 0 (0.0%) | 0 (0.0%) |
| 75 Years and over | 0 (0.0%) | 0 (0.0%) |
Disability Class: Cognitive Difficulty
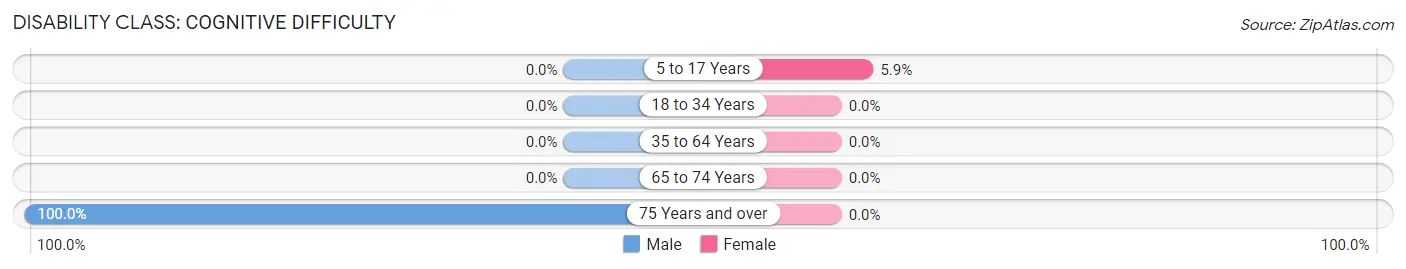
| Age Bracket | Male | Female |
| 5 to 17 Years | 0 (0.0%) | 2 (5.9%) |
| 18 to 34 Years | 0 (0.0%) | 0 (0.0%) |
| 35 to 64 Years | 0 (0.0%) | 0 (0.0%) |
| 65 to 74 Years | 0 (0.0%) | 0 (0.0%) |
| 75 Years and over | 4 (100.0%) | 0 (0.0%) |
Disability Class: Ambulatory Difficulty
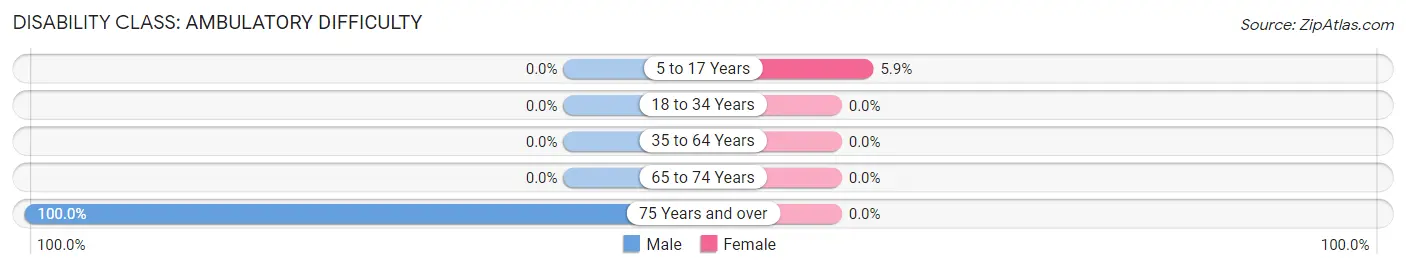
| Age Bracket | Male | Female |
| 5 to 17 Years | 0 (0.0%) | 2 (5.9%) |
| 18 to 34 Years | 0 (0.0%) | 0 (0.0%) |
| 35 to 64 Years | 0 (0.0%) | 0 (0.0%) |
| 65 to 74 Years | 0 (0.0%) | 0 (0.0%) |
| 75 Years and over | 4 (100.0%) | 0 (0.0%) |
Disability Class: Self-Care Difficulty
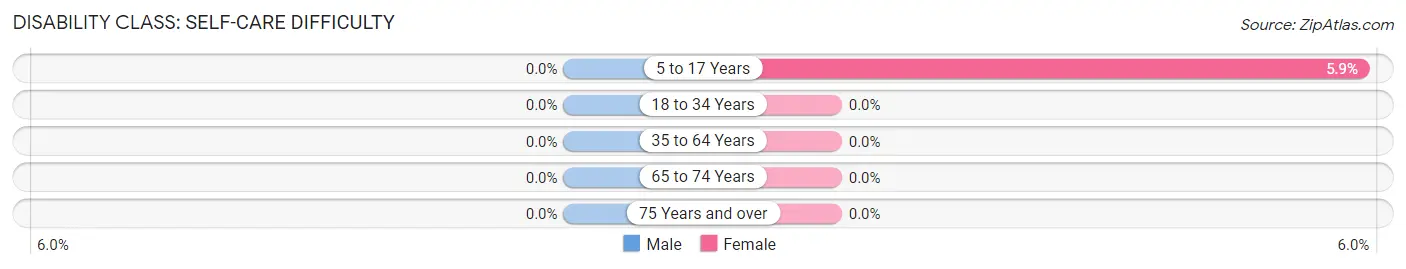
| Age Bracket | Male | Female |
| 5 to 17 Years | 0 (0.0%) | 2 (5.9%) |
| 18 to 34 Years | 0 (0.0%) | 0 (0.0%) |
| 35 to 64 Years | 0 (0.0%) | 0 (0.0%) |
| 65 to 74 Years | 0 (0.0%) | 0 (0.0%) |
| 75 Years and over | 0 (0.0%) | 0 (0.0%) |
Technology Access in Dixon
Computing Device Access in Dixon
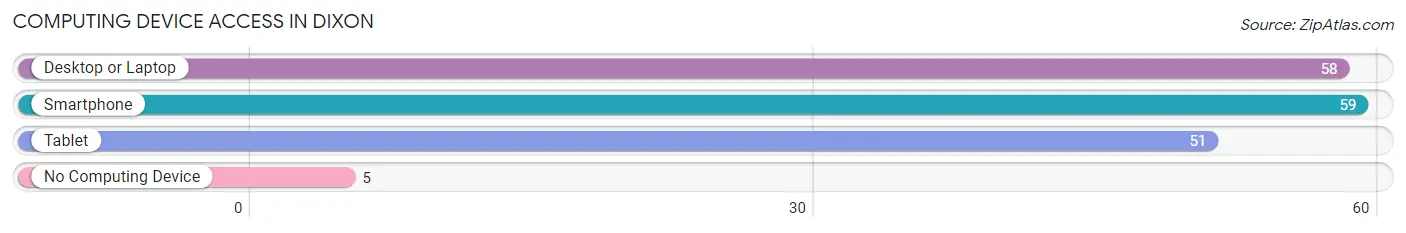
| Device Type | # Households | % Households |
| Desktop or Laptop | 58 | 82.9% |
| Smartphone | 59 | 84.3% |
| Tablet | 51 | 72.9% |
| No Computing Device | 5 | 7.1% |
| Total | 70 | 100.0% |
Internet Access in Dixon
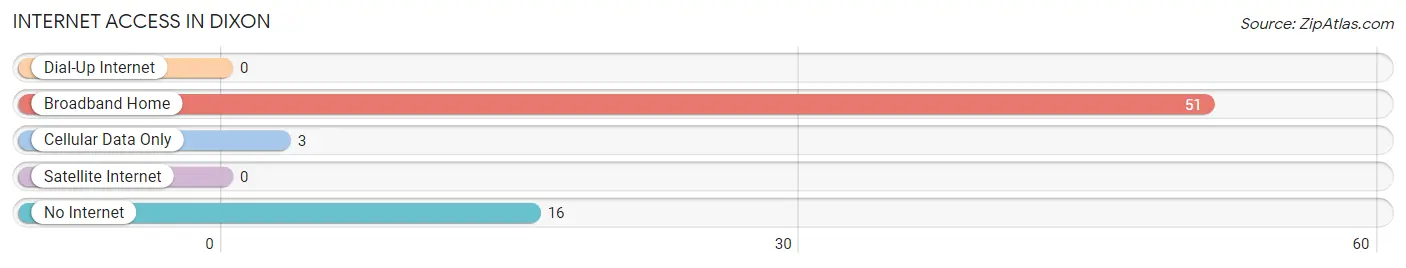
| Internet Type | # Households | % Households |
| Dial-Up Internet | 0 | 0.0% |
| Broadband Home | 51 | 72.9% |
| Cellular Data Only | 3 | 4.3% |
| Satellite Internet | 0 | 0.0% |
| No Internet | 16 | 22.9% |
| Total | 70 | 100.0% |
Dixon Summary
Dixon, Wyoming is a small town located in the southwestern corner of the state, near the border of Utah and Colorado. It is situated in the high desert of the Great Divide Basin, and is surrounded by the Red Desert to the north, the Green River Basin to the east, and the Wind River Range to the west. The town is located at an elevation of 6,000 feet, and has a population of approximately 200 people.
History
The area around Dixon was first settled in the late 1800s by ranchers and homesteaders. The town was officially founded in 1891, and was named after the Dixon family, who were among the first settlers in the area. The town was originally a small farming and ranching community, and the main industry was sheep and cattle ranching.
In the early 1900s, the town began to grow as the railroad came through, bringing with it new businesses and opportunities. The town was incorporated in 1909, and the first mayor was elected in 1910.
In the 1920s, the town began to experience a boom in population and economic activity. The town was home to several businesses, including a bank, a hotel, a general store, and a movie theater. The town also had a school, a post office, and a library.
In the 1950s, the town experienced a decline in population and economic activity. The railroad stopped running through the town, and many of the businesses closed. The town was also hit hard by the Dust Bowl, and many of the farms and ranches in the area were abandoned.
In the 1970s, the town began to experience a resurgence in population and economic activity. The town was home to several businesses, including a grocery store, a hardware store, and a gas station. The town also had a school, a post office, and a library.
Geography
Dixon is located in the high desert of the Great Divide Basin, and is surrounded by the Red Desert to the north, the Green River Basin to the east, and the Wind River Range to the west. The town is located at an elevation of 6,000 feet, and has a population of approximately 200 people.
The town is located in a semi-arid climate, with hot summers and cold winters. The average annual temperature is around 50 degrees Fahrenheit, and the average annual precipitation is around 10 inches.
Economy
The economy of Dixon is largely based on agriculture and ranching. The town is home to several farms and ranches, and the main crops grown in the area are hay, alfalfa, and wheat. The town is also home to several businesses, including a grocery store, a hardware store, and a gas station.
Demographics
As of the 2010 census, the population of Dixon was 200 people. The racial makeup of the town was 97.5% White, 0.5% Native American, 0.5% Asian, and 1.5% from two or more races. The median household income was $37,500, and the median family income was $41,250. The per capita income was $17,500.
Common Questions
What is Per Capita Income in Dixon?
Per Capita income in Dixon is $20,742.
What is the Median Household income in Dixon?
Median Household Income in Dixon is $66,500.
What is Income or Wage Gap in Dixon?
Income or Wage Gap in Dixon is 53.1%.
Women in Dixon earn 46.9 cents for every dollar earned by a man.
What is Inequality or Gini Index in Dixon?
Inequality or Gini Index in Dixon is 0.28.
What is the Total Population of Dixon?
Total Population of Dixon is 310.
What is the Total Male Population of Dixon?
Total Male Population of Dixon is 207.
What is the Total Female Population of Dixon?
Total Female Population of Dixon is 103.
What is the Ratio of Males per 100 Females in Dixon?
There are 200.97 Males per 100 Females in Dixon.
What is the Ratio of Females per 100 Males in Dixon?
There are 49.76 Females per 100 Males in Dixon.
What is the Median Population Age in Dixon?
Median Population Age in Dixon is 14.4 Years.
What is the Average Family Size in Dixon
Average Family Size in Dixon is 5.0 People.
What is the Average Household Size in Dixon
Average Household Size in Dixon is 4.4 People.
How Large is the Labor Force in Dixon?
There are 110 People in the Labor Forcein in Dixon.
What is the Percentage of People in the Labor Force in Dixon?
73.8% of People are in the Labor Force in Dixon.