Diamondville, WY Map & Demographics
Diamondville Map
Diamondville Overview
$37,327
PER CAPITA INCOME
$77,143
AVG FAMILY INCOME
$64,167
AVG HOUSEHOLD INCOME
54.1%
WAGE / INCOME GAP [ % ]
45.9¢/ $1
WAGE / INCOME GAP [ $ ]
0.37
INEQUALITY / GINI INDEX
700
TOTAL POPULATION
300
MALE POPULATION
400
FEMALE POPULATION
75.00
MALES / 100 FEMALES
133.33
FEMALES / 100 MALES
51.3
MEDIAN AGE
3.0
AVG FAMILY SIZE
2.2
AVG HOUSEHOLD SIZE
401
LABOR FORCE [ PEOPLE ]
64.2%
PERCENT IN LABOR FORCE
1.5%
UNEMPLOYMENT RATE
Diamondville Zip Codes
Diamondville Area Codes
Income in Diamondville
Income Overview in Diamondville
Per Capita Income in Diamondville is $37,327, while median incomes of families and households are $77,143 and $64,167 respectively.
| Characteristic | Number | Measure |
| Per Capita Income | 700 | $37,327 |
| Median Family Income | 176 | $77,143 |
| Mean Family Income | 176 | $90,177 |
| Median Household Income | 318 | $64,167 |
| Mean Household Income | 318 | $78,257 |
| Income Deficit | 176 | $0 |
| Wage / Income Gap (%) | 700 | 54.13% |
| Wage / Income Gap ($) | 700 | 45.87¢ per $1 |
| Gini / Inequality Index | 700 | 0.37 |
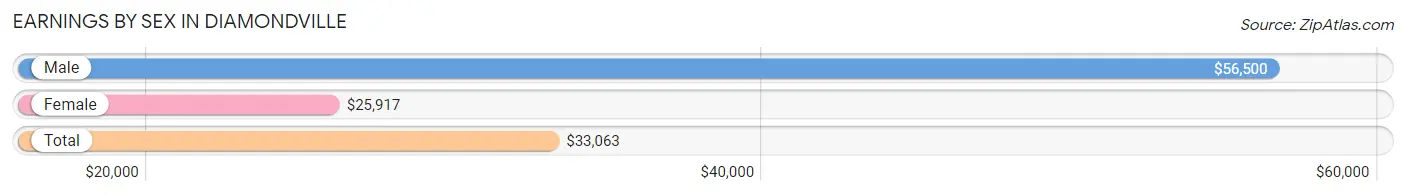
Earnings by Sex in Diamondville
Average Earnings in Diamondville are $33,063, $56,500 for men and $25,917 for women, a difference of 54.1%.
| Sex | Number | Average Earnings |
| Male | 172 (42.3%) | $56,500 |
| Female | 235 (57.7%) | $25,917 |
| Total | 407 (100.0%) | $33,063 |
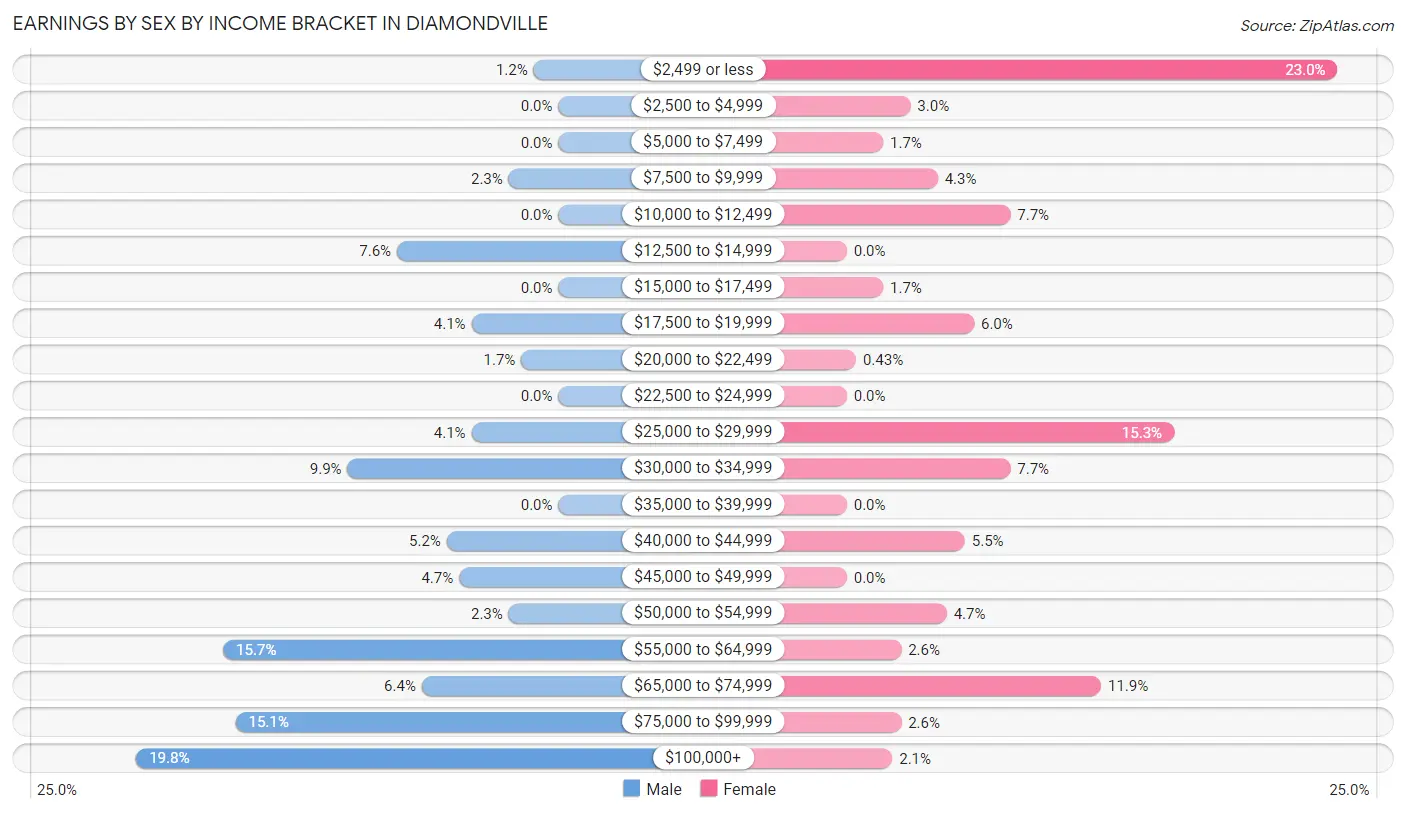
Earnings by Sex by Income Bracket in Diamondville
The most common earnings brackets in Diamondville are $100,000+ for men (34 | 19.8%) and $2,499 or less for women (54 | 23.0%).
| Income | Male | Female |
| $2,499 or less | 2 (1.2%) | 54 (23.0%) |
| $2,500 to $4,999 | 0 (0.0%) | 7 (3.0%) |
| $5,000 to $7,499 | 0 (0.0%) | 4 (1.7%) |
| $7,500 to $9,999 | 4 (2.3%) | 10 (4.3%) |
| $10,000 to $12,499 | 0 (0.0%) | 18 (7.7%) |
| $12,500 to $14,999 | 13 (7.6%) | 0 (0.0%) |
| $15,000 to $17,499 | 0 (0.0%) | 4 (1.7%) |
| $17,500 to $19,999 | 7 (4.1%) | 14 (6.0%) |
| $20,000 to $22,499 | 3 (1.7%) | 1 (0.4%) |
| $22,500 to $24,999 | 0 (0.0%) | 0 (0.0%) |
| $25,000 to $29,999 | 7 (4.1%) | 36 (15.3%) |
| $30,000 to $34,999 | 17 (9.9%) | 18 (7.7%) |
| $35,000 to $39,999 | 0 (0.0%) | 0 (0.0%) |
| $40,000 to $44,999 | 9 (5.2%) | 13 (5.5%) |
| $45,000 to $49,999 | 8 (4.6%) | 0 (0.0%) |
| $50,000 to $54,999 | 4 (2.3%) | 11 (4.7%) |
| $55,000 to $64,999 | 27 (15.7%) | 6 (2.5%) |
| $65,000 to $74,999 | 11 (6.4%) | 28 (11.9%) |
| $75,000 to $99,999 | 26 (15.1%) | 6 (2.5%) |
| $100,000+ | 34 (19.8%) | 5 (2.1%) |
| Total | 172 (100.0%) | 235 (100.0%) |
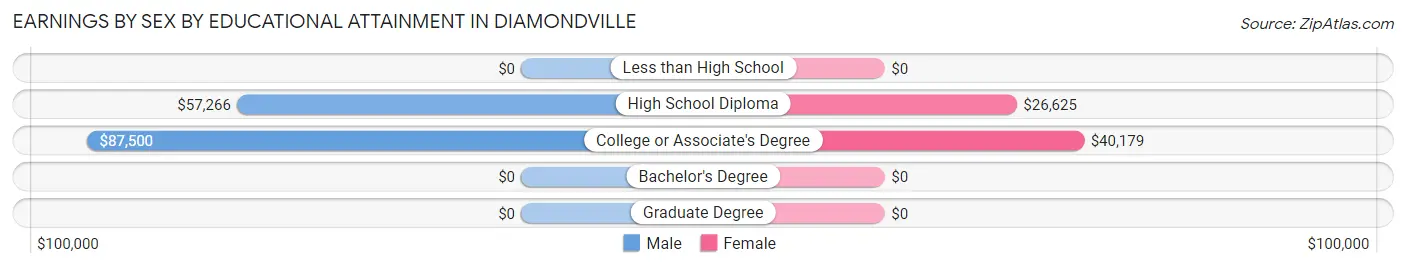
Earnings by Sex by Educational Attainment in Diamondville
Average earnings in Diamondville are $61,250 for men and $29,167 for women, a difference of 52.4%. Men with an educational attainment of college or associate's degree enjoy the highest average annual earnings of $87,500, while those with high school diploma education earn the least with $57,266. Women with an educational attainment of college or associate's degree earn the most with the average annual earnings of $40,179, while those with high school diploma education have the smallest earnings of $26,625.
| Educational Attainment | Male Income | Female Income |
| Less than High School | - | - |
| High School Diploma | $57,266 | $26,625 |
| College or Associate's Degree | $87,500 | $40,179 |
| Bachelor's Degree | - | - |
| Graduate Degree | - | - |
| Total | $61,250 | $29,167 |
Family Income in Diamondville
Family Income Brackets in Diamondville
According to the Diamondville family income data, there are 39 families falling into the $75,000 to $99,999 income range, which is the most common income bracket and makes up 22.2% of all families.
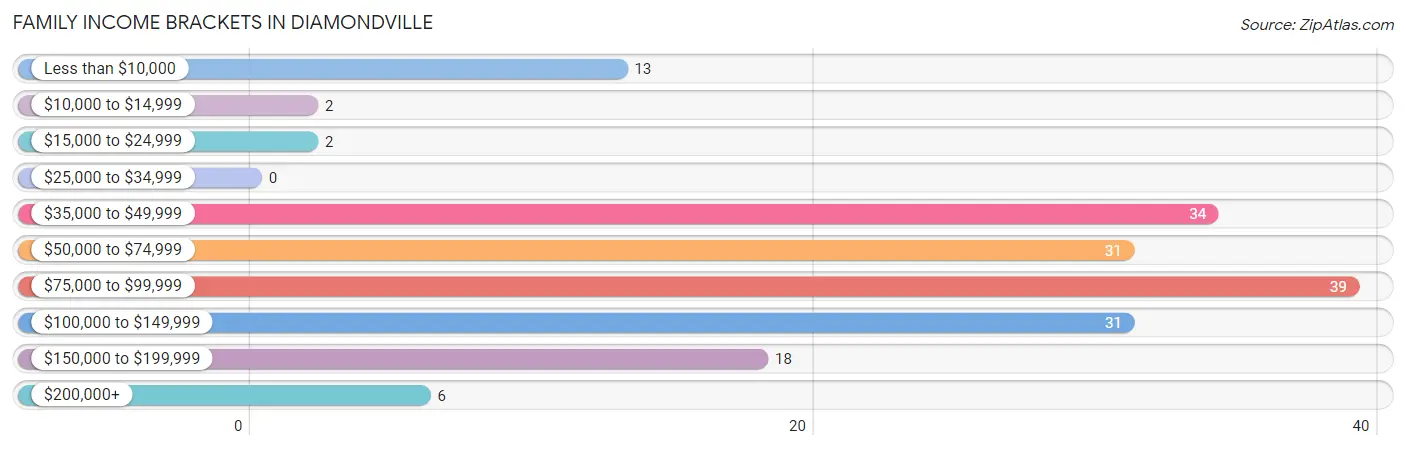
| Income Bracket | # Families | % Families |
| Less than $10,000 | 13 | 7.4% |
| $10,000 to $14,999 | 2 | 1.1% |
| $15,000 to $24,999 | 2 | 1.1% |
| $25,000 to $34,999 | 0 | 0.0% |
| $35,000 to $49,999 | 34 | 19.3% |
| $50,000 to $74,999 | 31 | 17.6% |
| $75,000 to $99,999 | 39 | 22.2% |
| $100,000 to $149,999 | 31 | 17.6% |
| $150,000 to $199,999 | 18 | 10.2% |
| $200,000+ | 6 | 3.4% |
Family Income by Famaliy Size in Diamondville
4-person families (16 | 9.1%) account for the highest median family income in Diamondville with $148,750 per family, while 4-person families (16 | 9.1%) have the highest median income of $37,188 per family member.
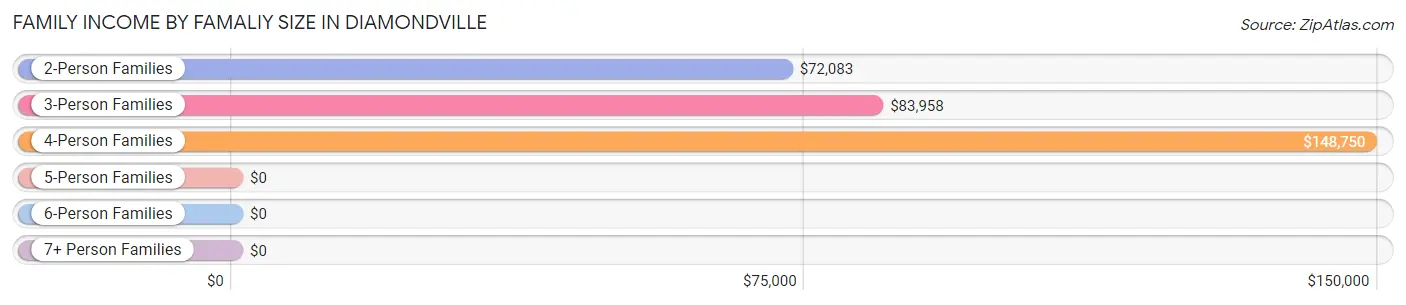
| Income Bracket | # Families | Median Income |
| 2-Person Families | 99 (56.2%) | $72,083 |
| 3-Person Families | 57 (32.4%) | $83,958 |
| 4-Person Families | 16 (9.1%) | $148,750 |
| 5-Person Families | 1 (0.6%) | $0 |
| 6-Person Families | 3 (1.7%) | $0 |
| 7+ Person Families | 0 (0.0%) | $0 |
| Total | 176 (100.0%) | $77,143 |
Family Income by Number of Earners in Diamondville
The median family income in Diamondville is $77,143, with families comprising 2 earners (60) having the highest median family income of $138,214, while families with 1 earner (44) have the lowest median family income of $53,750, accounting for 34.1% and 25.0% of families, respectively.
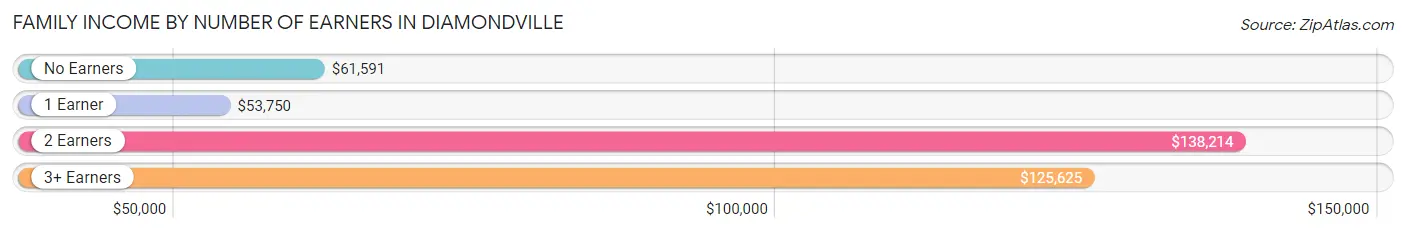
| Number of Earners | # Families | Median Income |
| No Earners | 54 (30.7%) | $61,591 |
| 1 Earner | 44 (25.0%) | $53,750 |
| 2 Earners | 60 (34.1%) | $138,214 |
| 3+ Earners | 18 (10.2%) | $125,625 |
| Total | 176 (100.0%) | $77,143 |
Household Income in Diamondville
Household Income Brackets in Diamondville
With 81 households falling in the category, the $75,000 to $99,999 income range is the most frequent in Diamondville, accounting for 25.5% of all households. In contrast, only 6 households (1.9%) fall into the $10,000 to $14,999 income bracket, making it the least populous group.
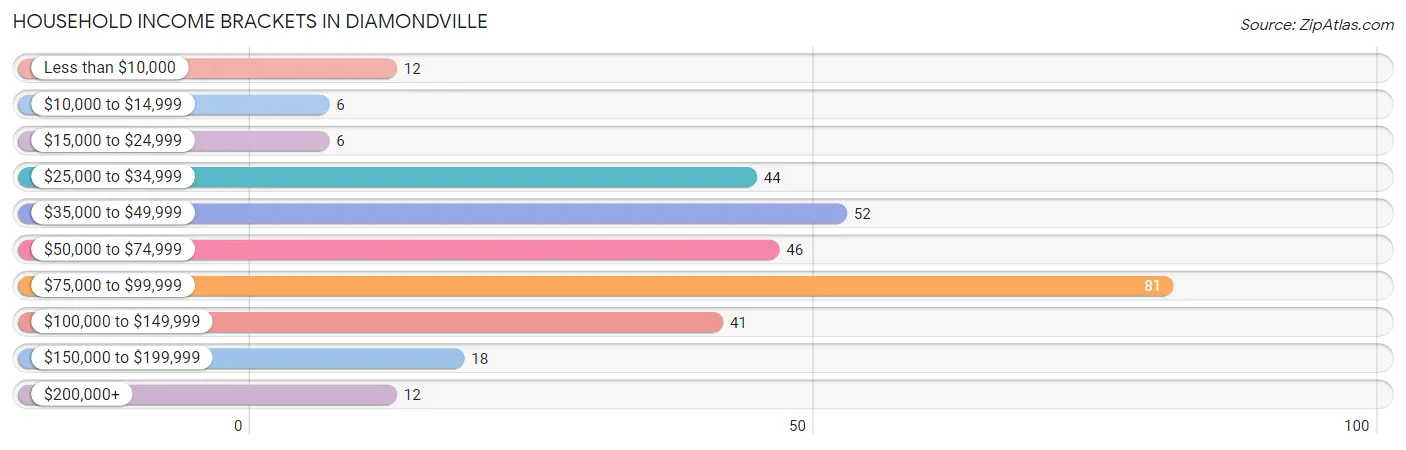
| Income Bracket | # Households | % Households |
| Less than $10,000 | 12 | 3.8% |
| $10,000 to $14,999 | 6 | 1.9% |
| $15,000 to $24,999 | 6 | 1.9% |
| $25,000 to $34,999 | 44 | 13.8% |
| $35,000 to $49,999 | 52 | 16.4% |
| $50,000 to $74,999 | 46 | 14.5% |
| $75,000 to $99,999 | 81 | 25.5% |
| $100,000 to $149,999 | 41 | 12.9% |
| $150,000 to $199,999 | 18 | 5.7% |
| $200,000+ | 12 | 3.8% |
Household Income by Householder Age in Diamondville
The median household income in Diamondville is $64,167, with the highest median household income of $77,188 found in the 45 to 64 years age bracket for the primary householder. A total of 151 households (47.5%) fall into this category.
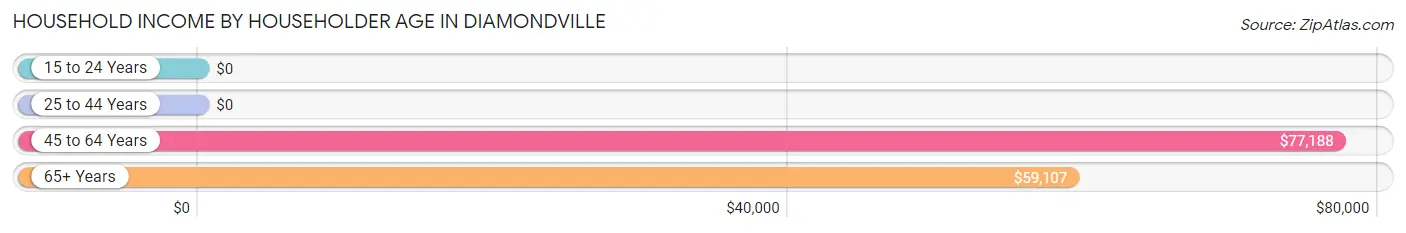
| Income Bracket | # Households | Median Income |
| 15 to 24 Years | 0 (0.0%) | $0 |
| 25 to 44 Years | 54 (17.0%) | $0 |
| 45 to 64 Years | 151 (47.5%) | $77,188 |
| 65+ Years | 113 (35.5%) | $59,107 |
| Total | 318 (100.0%) | $64,167 |
Poverty in Diamondville
Income Below Poverty by Sex and Age in Diamondville
With 5.0% poverty level for males and 9.0% for females among the residents of Diamondville, 55 to 64 year old males and 12 to 14 year old females are the most vulnerable to poverty, with 12 males (15.2%) and 4 females (25.0%) in their respective age groups living below the poverty level.
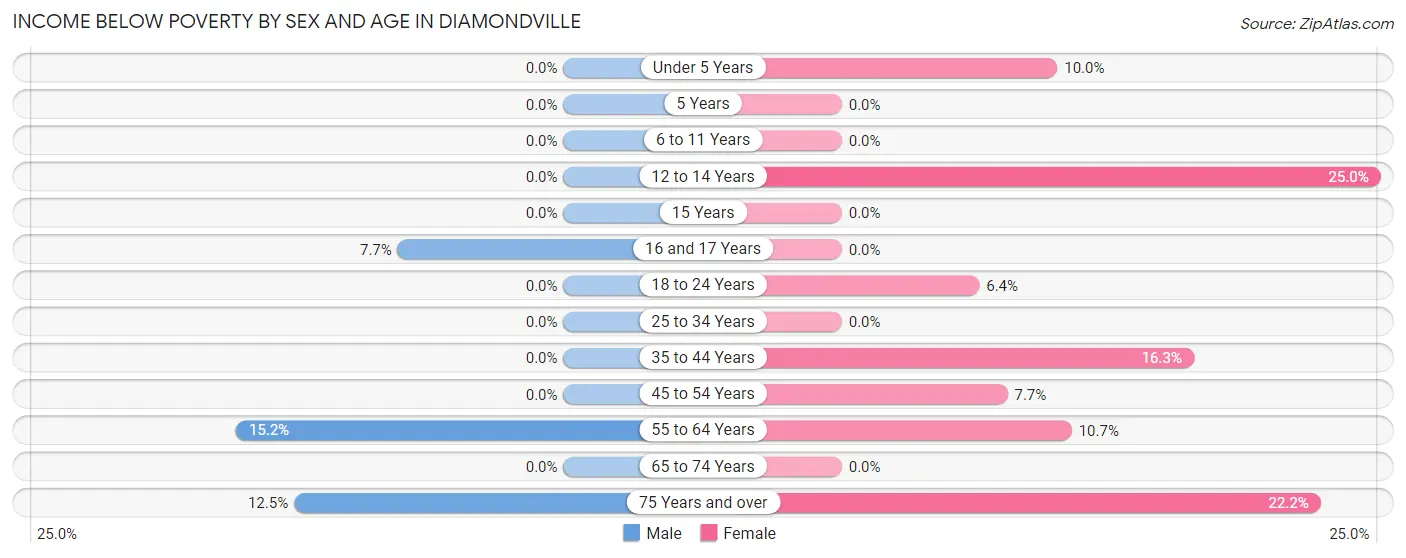
| Age Bracket | Male | Female |
| Under 5 Years | 0 (0.0%) | 2 (10.0%) |
| 5 Years | 0 (0.0%) | 0 (0.0%) |
| 6 to 11 Years | 0 (0.0%) | 0 (0.0%) |
| 12 to 14 Years | 0 (0.0%) | 4 (25.0%) |
| 15 Years | 0 (0.0%) | 0 (0.0%) |
| 16 and 17 Years | 1 (7.7%) | 0 (0.0%) |
| 18 to 24 Years | 0 (0.0%) | 3 (6.4%) |
| 25 to 34 Years | 0 (0.0%) | 0 (0.0%) |
| 35 to 44 Years | 0 (0.0%) | 8 (16.3%) |
| 45 to 54 Years | 0 (0.0%) | 5 (7.7%) |
| 55 to 64 Years | 12 (15.2%) | 8 (10.7%) |
| 65 to 74 Years | 0 (0.0%) | 0 (0.0%) |
| 75 Years and over | 2 (12.5%) | 6 (22.2%) |
| Total | 15 (5.0%) | 36 (9.0%) |
Income Above Poverty by Sex and Age in Diamondville
According to the poverty statistics in Diamondville, males aged under 5 years and females aged 6 to 11 years are the age groups that are most secure financially, with 100.0% of males and 100.0% of females in these age groups living above the poverty line.
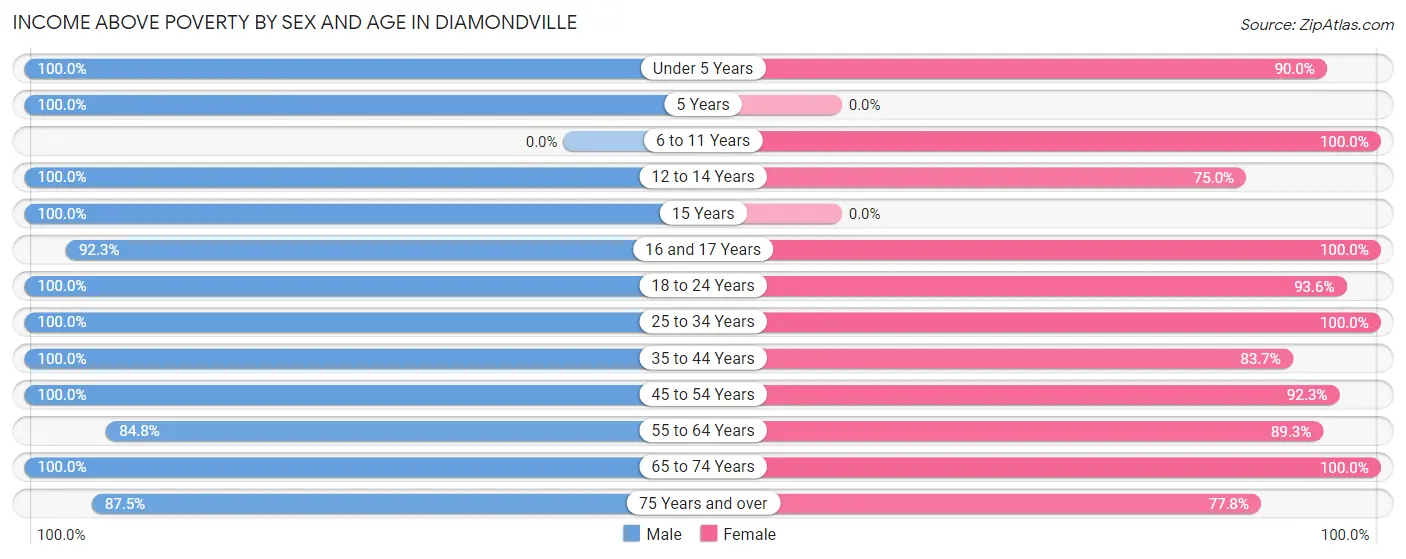
| Age Bracket | Male | Female |
| Under 5 Years | 16 (100.0%) | 18 (90.0%) |
| 5 Years | 2 (100.0%) | 0 (0.0%) |
| 6 to 11 Years | 0 (0.0%) | 9 (100.0%) |
| 12 to 14 Years | 9 (100.0%) | 12 (75.0%) |
| 15 Years | 3 (100.0%) | 0 (0.0%) |
| 16 and 17 Years | 12 (92.3%) | 9 (100.0%) |
| 18 to 24 Years | 17 (100.0%) | 44 (93.6%) |
| 25 to 34 Years | 15 (100.0%) | 23 (100.0%) |
| 35 to 44 Years | 30 (100.0%) | 41 (83.7%) |
| 45 to 54 Years | 40 (100.0%) | 60 (92.3%) |
| 55 to 64 Years | 67 (84.8%) | 67 (89.3%) |
| 65 to 74 Years | 60 (100.0%) | 60 (100.0%) |
| 75 Years and over | 14 (87.5%) | 21 (77.8%) |
| Total | 285 (95.0%) | 364 (91.0%) |
Income Below Poverty Among Married-Couple Families in Diamondville
The poverty statistics for married-couple families in Diamondville show that 4.2% or 6 of the total 142 families live below the poverty line. Families with no children have the highest poverty rate of 5.8%, comprising of 6 families. On the other hand, families with 1 or 2 children have the lowest poverty rate of 0.0%, which includes 0 families.
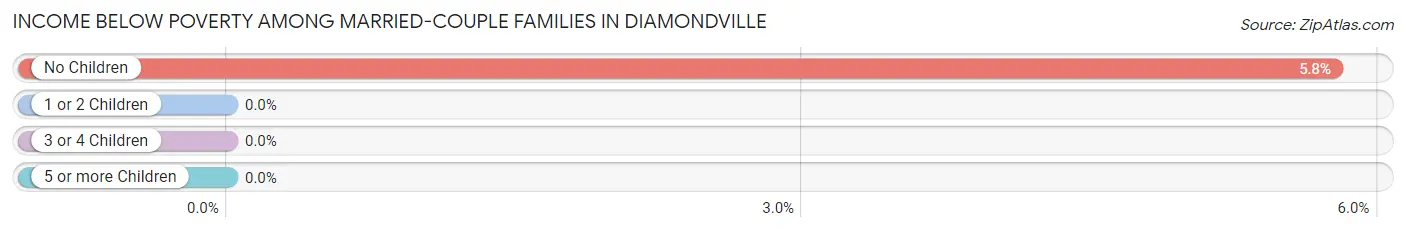
| Children | Above Poverty | Below Poverty |
| No Children | 98 (94.2%) | 6 (5.8%) |
| 1 or 2 Children | 34 (100.0%) | 0 (0.0%) |
| 3 or 4 Children | 4 (100.0%) | 0 (0.0%) |
| 5 or more Children | 0 (0.0%) | 0 (0.0%) |
| Total | 136 (95.8%) | 6 (4.2%) |
Income Below Poverty Among Single-Parent Households in Diamondville
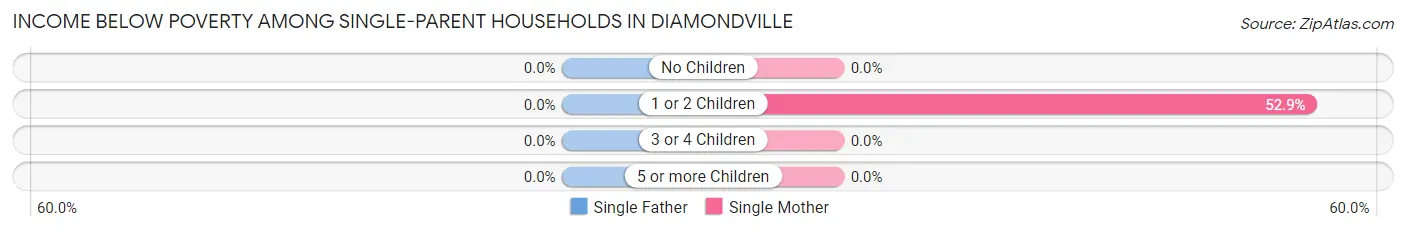
| Children | Single Father | Single Mother |
| No Children | 0 (0.0%) | 0 (0.0%) |
| 1 or 2 Children | 0 (0.0%) | 9 (52.9%) |
| 3 or 4 Children | 0 (0.0%) | 0 (0.0%) |
| 5 or more Children | 0 (0.0%) | 0 (0.0%) |
| Total | 0 (0.0%) | 9 (30.0%) |
Income Below Poverty Among Married-Couple vs Single-Parent Households in Diamondville
The poverty data for Diamondville shows that 6 of the married-couple family households (4.2%) and 9 of the single-parent households (26.5%) are living below the poverty level. Within the married-couple family households, those with no children have the highest poverty rate, with 6 households (5.8%) falling below the poverty line. Among the single-parent households, those with 1 or 2 children have the highest poverty rate, with 9 household (42.9%) living below poverty.
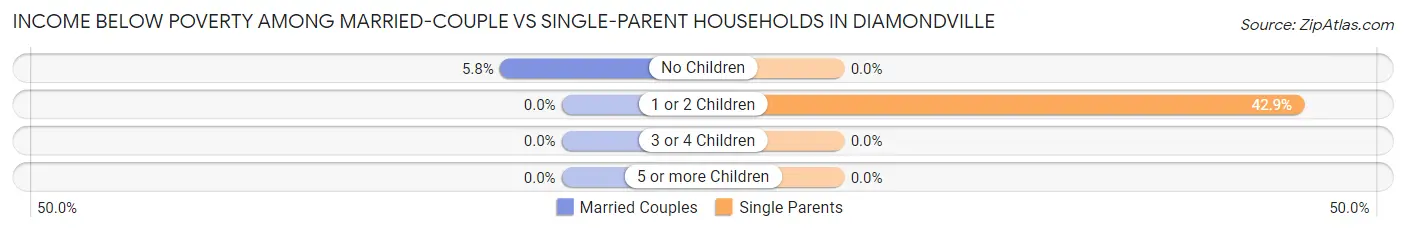
| Children | Married-Couple Families | Single-Parent Households |
| No Children | 6 (5.8%) | 0 (0.0%) |
| 1 or 2 Children | 0 (0.0%) | 9 (42.9%) |
| 3 or 4 Children | 0 (0.0%) | 0 (0.0%) |
| 5 or more Children | 0 (0.0%) | 0 (0.0%) |
| Total | 6 (4.2%) | 9 (26.5%) |
Race in Diamondville
The most populous races in Diamondville are White / Caucasian (635 | 90.7%), Hispanic or Latino (66 | 9.4%), and Two or more Races (46 | 6.6%).
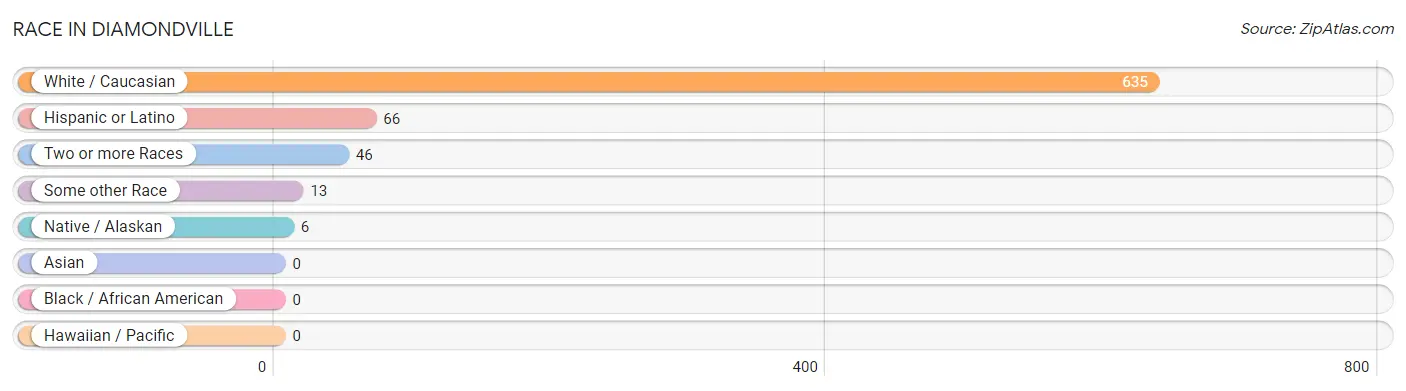
| Race | # Population | % Population |
| Asian | 0 | 0.0% |
| Black / African American | 0 | 0.0% |
| Hawaiian / Pacific | 0 | 0.0% |
| Hispanic or Latino | 66 | 9.4% |
| Native / Alaskan | 6 | 0.9% |
| White / Caucasian | 635 | 90.7% |
| Two or more Races | 46 | 6.6% |
| Some other Race | 13 | 1.9% |
| Total | 700 | 100.0% |
Ancestry in Diamondville
The most populous ancestries reported in Diamondville are English (251 | 35.9%), German (187 | 26.7%), Irish (120 | 17.1%), Italian (110 | 15.7%), and Mexican (66 | 9.4%), together accounting for 104.8% of all Diamondville residents.
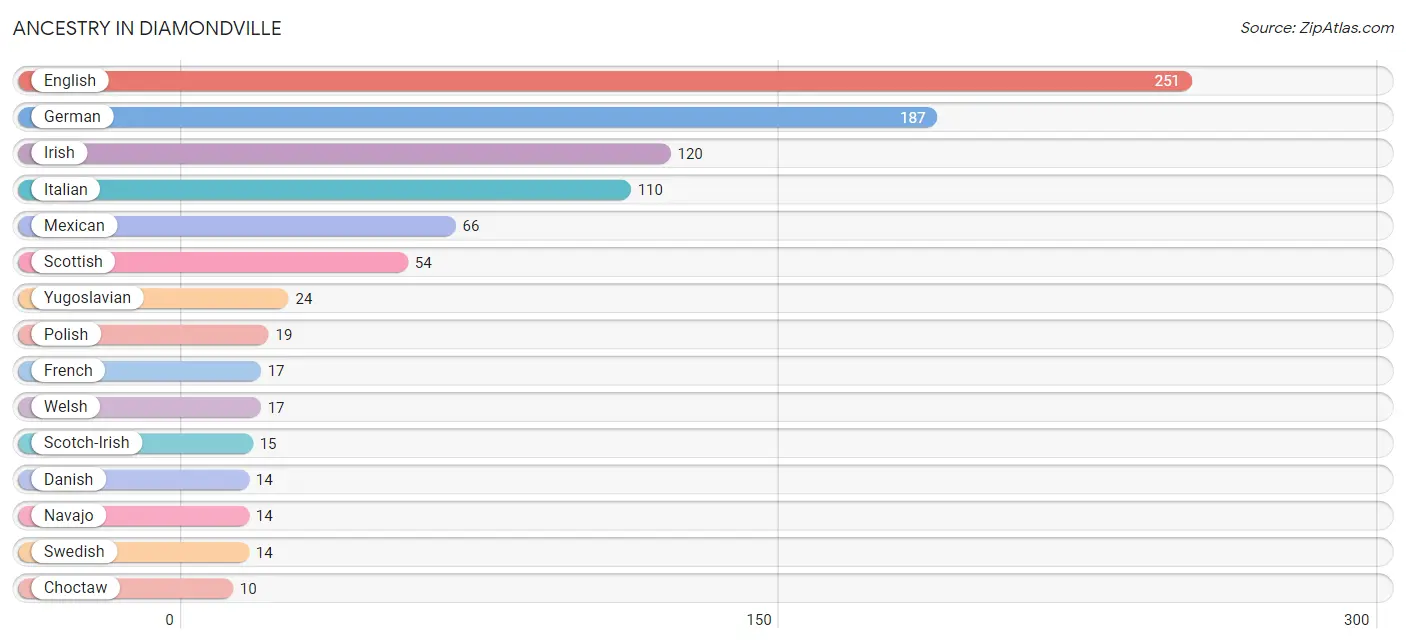
| Ancestry | # Population | % Population |
| Alaskan Athabascan | 5 | 0.7% |
| American | 4 | 0.6% |
| Arab | 4 | 0.6% |
| Austrian | 5 | 0.7% |
| Belgian | 6 | 0.9% |
| Bhutanese | 7 | 1.0% |
| Canadian | 4 | 0.6% |
| Cherokee | 3 | 0.4% |
| Choctaw | 10 | 1.4% |
| Danish | 14 | 2.0% |
| Dutch | 9 | 1.3% |
| English | 251 | 35.9% |
| European | 3 | 0.4% |
| Finnish | 9 | 1.3% |
| French | 17 | 2.4% |
| French Canadian | 4 | 0.6% |
| German | 187 | 26.7% |
| Greek | 1 | 0.1% |
| Irish | 120 | 17.1% |
| Italian | 110 | 15.7% |
| Lebanese | 4 | 0.6% |
| Mexican | 66 | 9.4% |
| Mexican American Indian | 10 | 1.4% |
| Navajo | 14 | 2.0% |
| Polish | 19 | 2.7% |
| Portuguese | 6 | 0.9% |
| Scandinavian | 7 | 1.0% |
| Scotch-Irish | 15 | 2.1% |
| Scottish | 54 | 7.7% |
| Sioux | 3 | 0.4% |
| Slovak | 7 | 1.0% |
| Swedish | 14 | 2.0% |
| Welsh | 17 | 2.4% |
| Yugoslavian | 24 | 3.4% | View All 34 Rows |
Immigrants in Diamondville
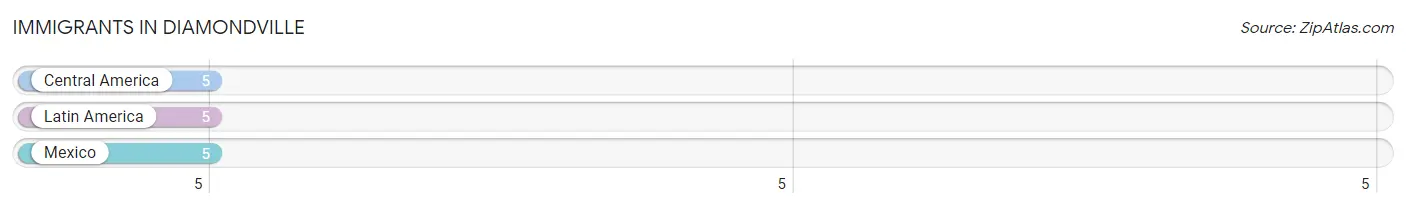
The most numerous immigrant groups reported in Diamondville came from Central America (5 | 0.7%), Latin America (5 | 0.7%), and Mexico (5 | 0.7%), together accounting for 2.1% of all Diamondville residents.
| Immigration Origin | # Population | % Population |
| Central America | 5 | 0.7% |
| Latin America | 5 | 0.7% |
| Mexico | 5 | 0.7% | View All 3 Rows |
Sex and Age in Diamondville
Sex and Age in Diamondville
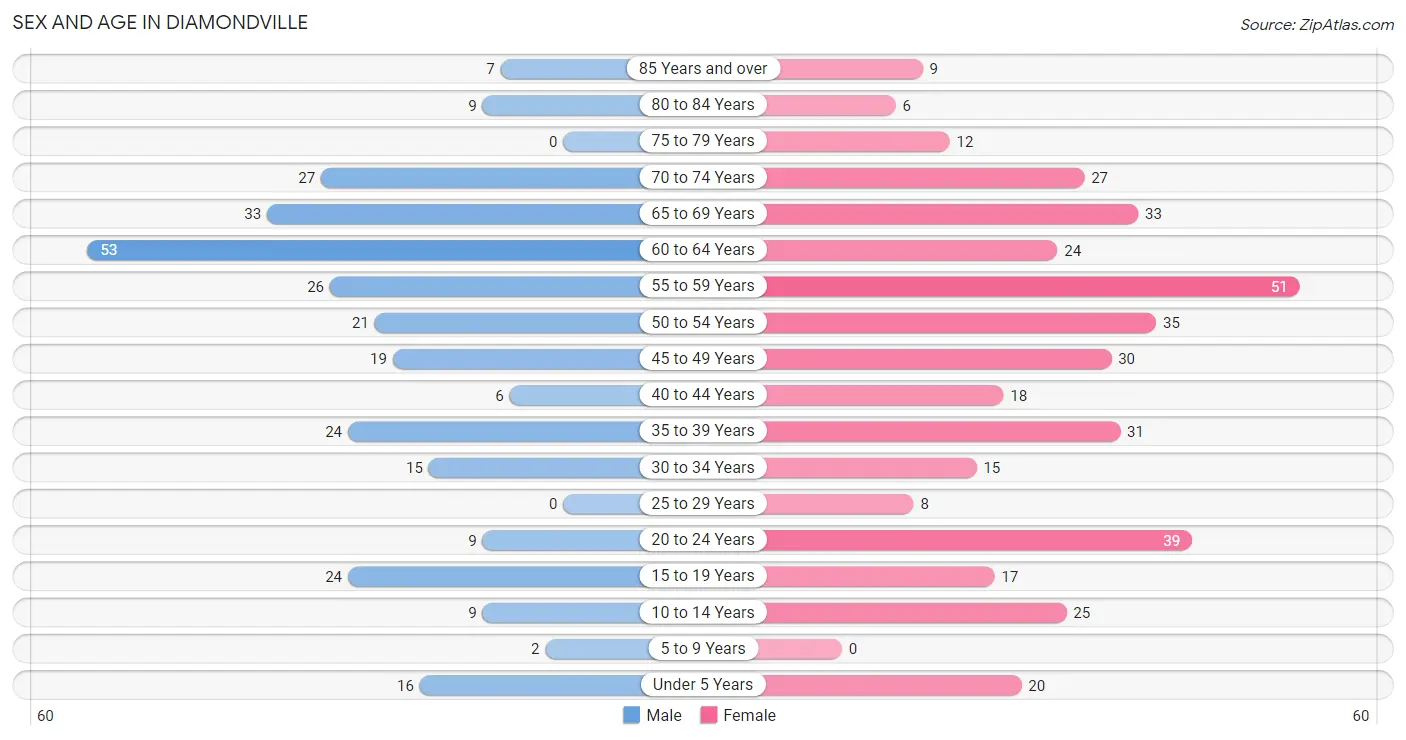
The most populous age groups in Diamondville are 60 to 64 Years (53 | 17.7%) for men and 55 to 59 Years (51 | 12.8%) for women.
| Age Bracket | Male | Female |
| Under 5 Years | 16 (5.3%) | 20 (5.0%) |
| 5 to 9 Years | 2 (0.7%) | 0 (0.0%) |
| 10 to 14 Years | 9 (3.0%) | 25 (6.2%) |
| 15 to 19 Years | 24 (8.0%) | 17 (4.3%) |
| 20 to 24 Years | 9 (3.0%) | 39 (9.8%) |
| 25 to 29 Years | 0 (0.0%) | 8 (2.0%) |
| 30 to 34 Years | 15 (5.0%) | 15 (3.7%) |
| 35 to 39 Years | 24 (8.0%) | 31 (7.7%) |
| 40 to 44 Years | 6 (2.0%) | 18 (4.5%) |
| 45 to 49 Years | 19 (6.3%) | 30 (7.5%) |
| 50 to 54 Years | 21 (7.0%) | 35 (8.7%) |
| 55 to 59 Years | 26 (8.7%) | 51 (12.8%) |
| 60 to 64 Years | 53 (17.7%) | 24 (6.0%) |
| 65 to 69 Years | 33 (11.0%) | 33 (8.3%) |
| 70 to 74 Years | 27 (9.0%) | 27 (6.8%) |
| 75 to 79 Years | 0 (0.0%) | 12 (3.0%) |
| 80 to 84 Years | 9 (3.0%) | 6 (1.5%) |
| 85 Years and over | 7 (2.3%) | 9 (2.2%) |
| Total | 300 (100.0%) | 400 (100.0%) |
Families and Households in Diamondville
Median Family Size in Diamondville
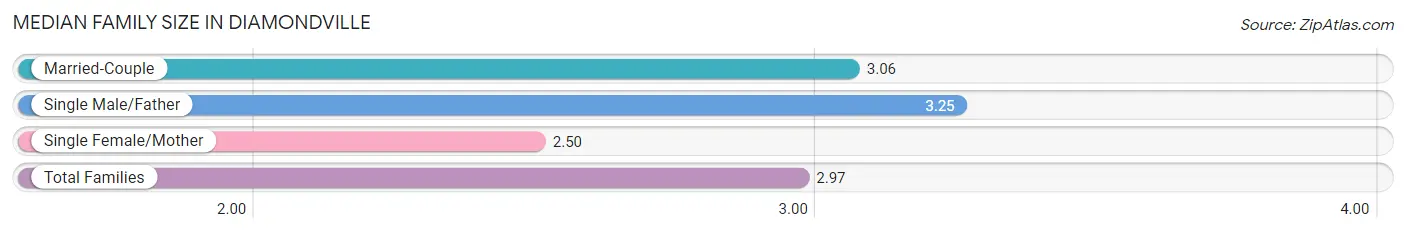
The median family size in Diamondville is 2.97 persons per family, with single male/father families (4 | 2.3%) accounting for the largest median family size of 3.25 persons per family. On the other hand, single female/mother families (30 | 17.1%) represent the smallest median family size with 2.50 persons per family.
| Family Type | # Families | Family Size |
| Married-Couple | 142 (80.7%) | 3.06 |
| Single Male/Father | 4 (2.3%) | 3.25 |
| Single Female/Mother | 30 (17.1%) | 2.50 |
| Total Families | 176 (100.0%) | 2.97 |
Median Household Size in Diamondville
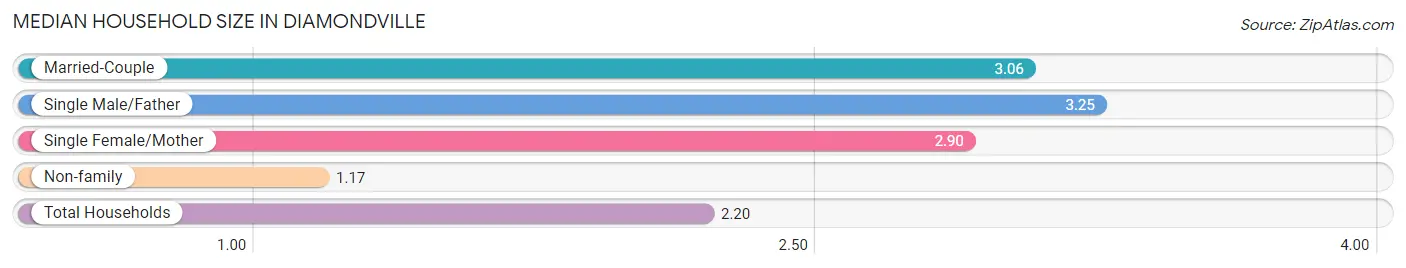
The median household size in Diamondville is 2.20 persons per household, with single male/father households (4 | 1.3%) accounting for the largest median household size of 3.25 persons per household. non-family households (142 | 44.7%) represent the smallest median household size with 1.17 persons per household.
| Household Type | # Households | Household Size |
| Married-Couple | 142 (44.7%) | 3.06 |
| Single Male/Father | 4 (1.3%) | 3.25 |
| Single Female/Mother | 30 (9.4%) | 2.90 |
| Non-family | 142 (44.7%) | 1.17 |
| Total Households | 318 (100.0%) | 2.20 |
Household Size by Marriage Status in Diamondville
Out of a total of 318 households in Diamondville, 176 (55.3%) are family households, while 142 (44.7%) are nonfamily households. The most numerous type of family households are 2-person households, comprising 99, and the most common type of nonfamily households are 1-person households, comprising 118.
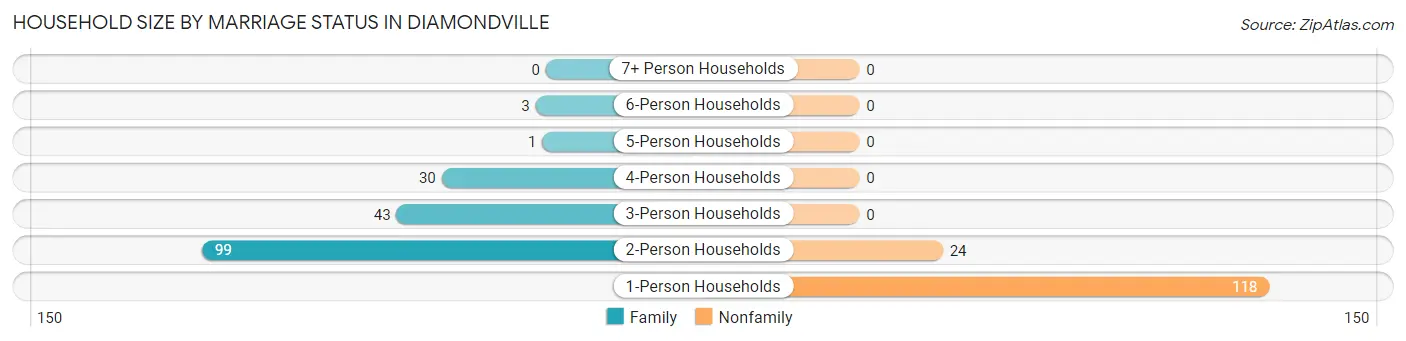
| Household Size | Family Households | Nonfamily Households |
| 1-Person Households | - | 118 (37.1%) |
| 2-Person Households | 99 (31.1%) | 24 (7.5%) |
| 3-Person Households | 43 (13.5%) | 0 (0.0%) |
| 4-Person Households | 30 (9.4%) | 0 (0.0%) |
| 5-Person Households | 1 (0.3%) | 0 (0.0%) |
| 6-Person Households | 3 (0.9%) | 0 (0.0%) |
| 7+ Person Households | 0 (0.0%) | 0 (0.0%) |
| Total | 176 (55.3%) | 142 (44.7%) |
Female Fertility in Diamondville
Fertility by Age in Diamondville
| Age Bracket | Women with Births | Births / 1,000 Women |
| 15 to 19 years | 0 (0.0%) | 0.0 |
| 20 to 34 years | 0 (0.0%) | 0.0 |
| 35 to 50 years | 0 (0.0%) | 0.0 |
| Total | 0 (0.0%) | 0.0 |
Fertility by Age by Marriage Status in Diamondville
| Age Bracket | Married | Unmarried |
| 15 to 19 years | 0 (0.0%) | 0 (0.0%) |
| 20 to 34 years | 0 (0.0%) | 0 (0.0%) |
| 35 to 50 years | 0 (0.0%) | 0 (0.0%) |
| Total | 0 (0.0%) | 0 (0.0%) |
Fertility by Education in Diamondville
| Educational Attainment | Women with Births | Births / 1,000 Women |
| Less than High School | 0 (0.0%) | 0.0 |
| High School Diploma | 0 (0.0%) | 0.0 |
| College or Associate's Degree | 0 (0.0%) | 0.0 |
| Bachelor's Degree | 0 (0.0%) | 0.0 |
| Graduate Degree | 0 (0.0%) | 0.0 |
| Total | 0 (0.0%) | 0.0 |
Fertility by Education by Marriage Status in Diamondville
| Educational Attainment | Married | Unmarried |
| Less than High School | 0 (0.0%) | 0 (0.0%) |
| High School Diploma | 0 (0.0%) | 0 (0.0%) |
| College or Associate's Degree | 0 (0.0%) | 0 (0.0%) |
| Bachelor's Degree | 0 (0.0%) | 0 (0.0%) |
| Graduate Degree | 0 (0.0%) | 0 (0.0%) |
| Total | 0 (0.0%) | 0 (0.0%) |
Employment Characteristics in Diamondville
Employment by Class of Employer in Diamondville
Among the 364 employed individuals in Diamondville, private company employees (219 | 60.2%), not-for-profit organizations (56 | 15.4%), and local government employees (39 | 10.7%) make up the most common classes of employment.
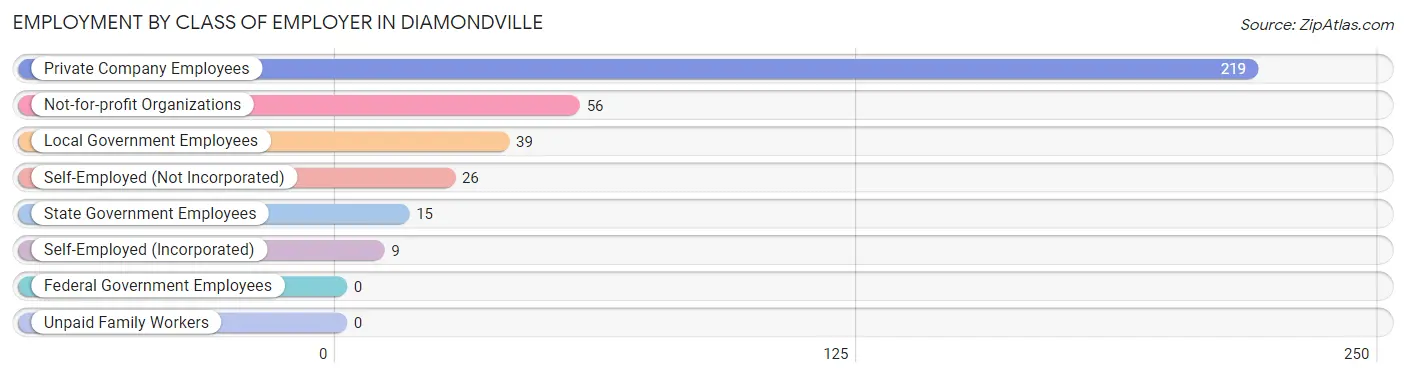
| Employer Class | # Employees | % Employees |
| Private Company Employees | 219 | 60.2% |
| Self-Employed (Incorporated) | 9 | 2.5% |
| Self-Employed (Not Incorporated) | 26 | 7.1% |
| Not-for-profit Organizations | 56 | 15.4% |
| Local Government Employees | 39 | 10.7% |
| State Government Employees | 15 | 4.1% |
| Federal Government Employees | 0 | 0.0% |
| Unpaid Family Workers | 0 | 0.0% |
| Total | 364 | 100.0% |
Employment Status by Age in Diamondville
According to the labor force statistics for Diamondville, out of the total population over 16 years of age (625), 64.2% or 401 individuals are in the labor force, with 1.5% or 6 of them unemployed. The age group with the highest labor force participation rate is 20 to 24 years, with 100.0% or 48 individuals in the labor force. Within the labor force, the 35 to 44 years age range has the highest percentage of unemployed individuals, with 7.7% or 6 of them being unemployed.
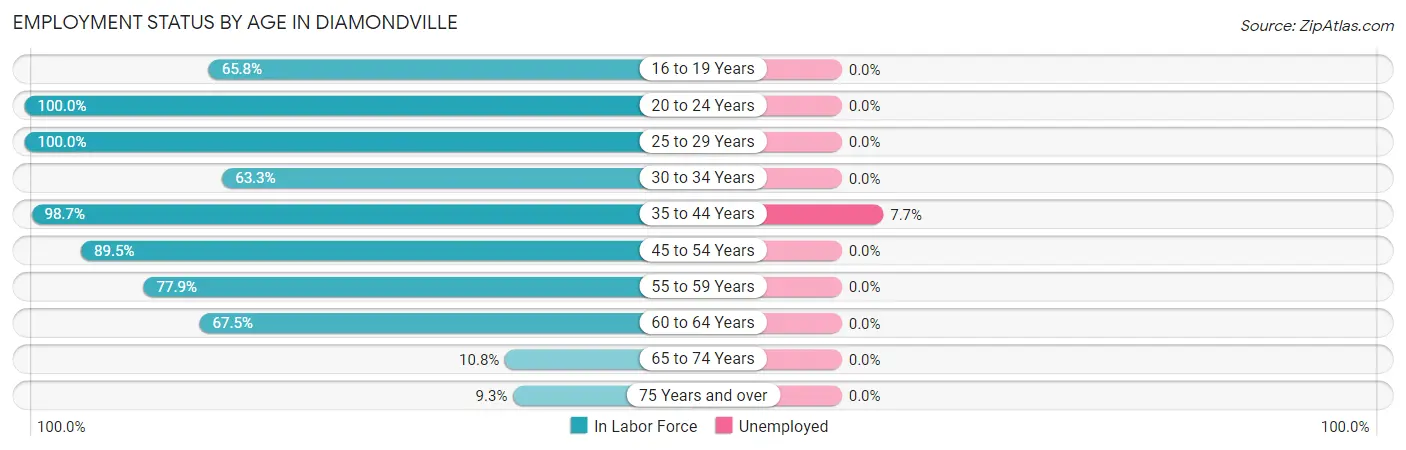
| Age Bracket | In Labor Force | Unemployed |
| 16 to 19 Years | 25 (65.8%) | 0 (0.0%) |
| 20 to 24 Years | 48 (100.0%) | 0 (0.0%) |
| 25 to 29 Years | 8 (100.0%) | 0 (0.0%) |
| 30 to 34 Years | 19 (63.3%) | 0 (0.0%) |
| 35 to 44 Years | 78 (98.7%) | 6 (7.7%) |
| 45 to 54 Years | 94 (89.5%) | 0 (0.0%) |
| 55 to 59 Years | 60 (77.9%) | 0 (0.0%) |
| 60 to 64 Years | 52 (67.5%) | 0 (0.0%) |
| 65 to 74 Years | 13 (10.8%) | 0 (0.0%) |
| 75 Years and over | 4 (9.3%) | 0 (0.0%) |
| Total | 401 (64.2%) | 6 (1.5%) |
Employment Status by Educational Attainment in Diamondville
According to labor force statistics for Diamondville, 82.7% of individuals (311) out of the total population between 25 and 64 years of age (376) are in the labor force, with 1.9% or 6 of them being unemployed. The group with the highest labor force participation rate are those with the educational attainment of high school diploma, with 86.5% or 160 individuals in the labor force. Within the labor force, individuals with high school diploma education have the highest percentage of unemployment, with 3.8% or 6 of them being unemployed.
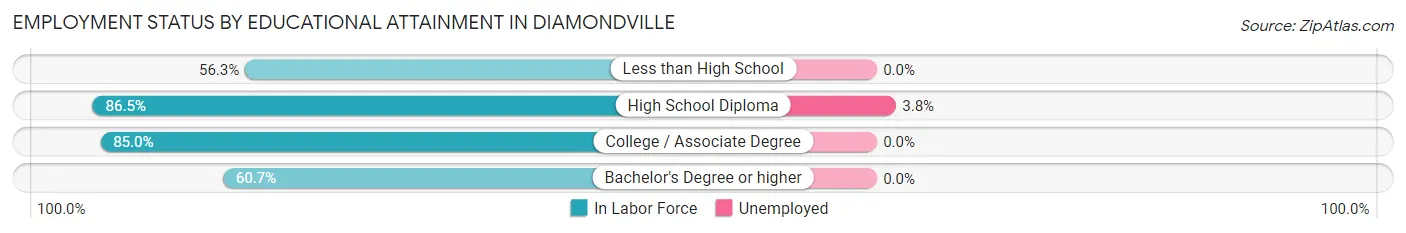
| Educational Attainment | In Labor Force | Unemployed |
| Less than High School | 9 (56.3%) | 0 (0.0%) |
| High School Diploma | 160 (86.5%) | 7 (3.8%) |
| College / Associate Degree | 125 (85.0%) | 0 (0.0%) |
| Bachelor's Degree or higher | 17 (60.7%) | 0 (0.0%) |
| Total | 311 (82.7%) | 7 (1.9%) |
Employment Occupations by Sex in Diamondville
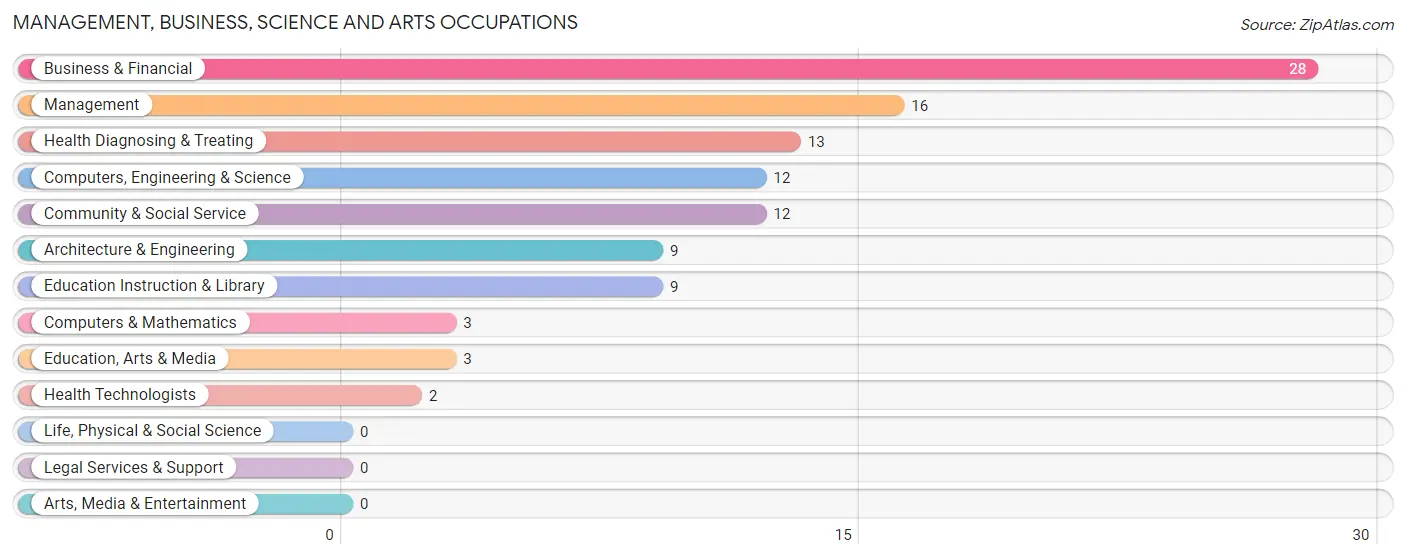
Management, Business, Science and Arts Occupations
The most common Management, Business, Science and Arts occupations in Diamondville are Business & Financial (28 | 7.1%), Management (16 | 4.1%), Health Diagnosing & Treating (13 | 3.3%), Computers, Engineering & Science (12 | 3.0%), and Community & Social Service (12 | 3.0%).
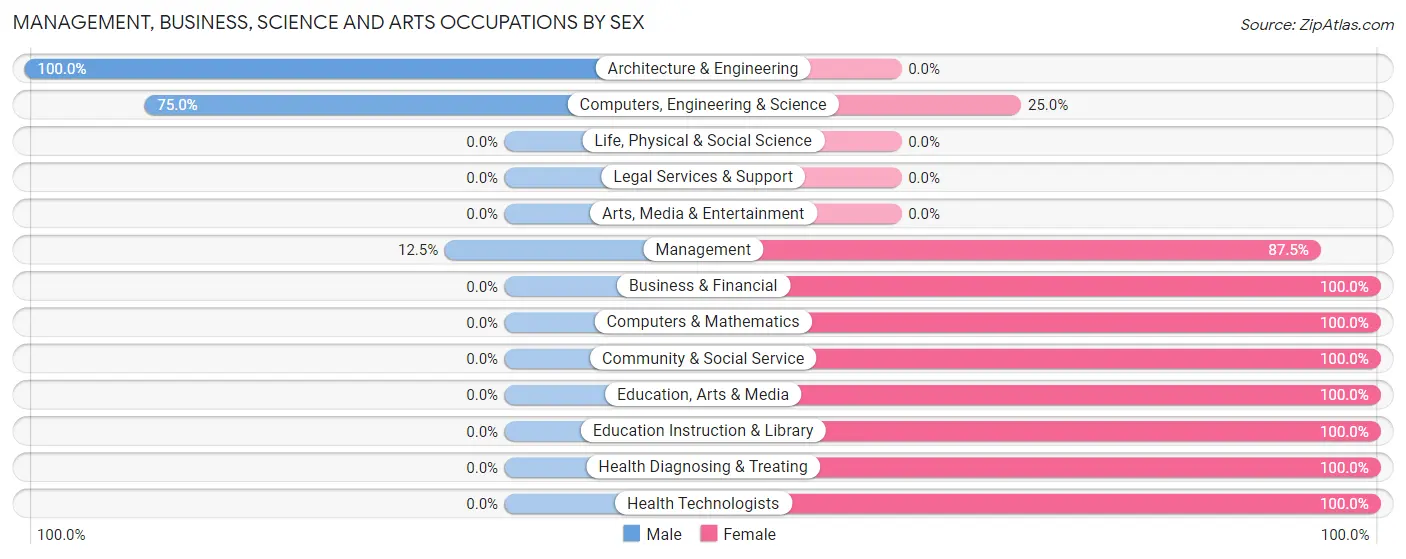
Management, Business, Science and Arts Occupations by Sex
Within the Management, Business, Science and Arts occupations in Diamondville, the most male-oriented occupations are Architecture & Engineering (100.0%), Computers, Engineering & Science (75.0%), and Management (12.5%), while the most female-oriented occupations are Business & Financial (100.0%), Computers & Mathematics (100.0%), and Community & Social Service (100.0%).
| Occupation | Male | Female |
| Management | 2 (12.5%) | 14 (87.5%) |
| Business & Financial | 0 (0.0%) | 28 (100.0%) |
| Computers, Engineering & Science | 9 (75.0%) | 3 (25.0%) |
| Computers & Mathematics | 0 (0.0%) | 3 (100.0%) |
| Architecture & Engineering | 9 (100.0%) | 0 (0.0%) |
| Life, Physical & Social Science | 0 (0.0%) | 0 (0.0%) |
| Community & Social Service | 0 (0.0%) | 12 (100.0%) |
| Education, Arts & Media | 0 (0.0%) | 3 (100.0%) |
| Legal Services & Support | 0 (0.0%) | 0 (0.0%) |
| Education Instruction & Library | 0 (0.0%) | 9 (100.0%) |
| Arts, Media & Entertainment | 0 (0.0%) | 0 (0.0%) |
| Health Diagnosing & Treating | 0 (0.0%) | 13 (100.0%) |
| Health Technologists | 0 (0.0%) | 2 (100.0%) |
| Total (Category) | 11 (13.6%) | 70 (86.4%) |
| Total (Overall) | 163 (41.3%) | 232 (58.7%) |
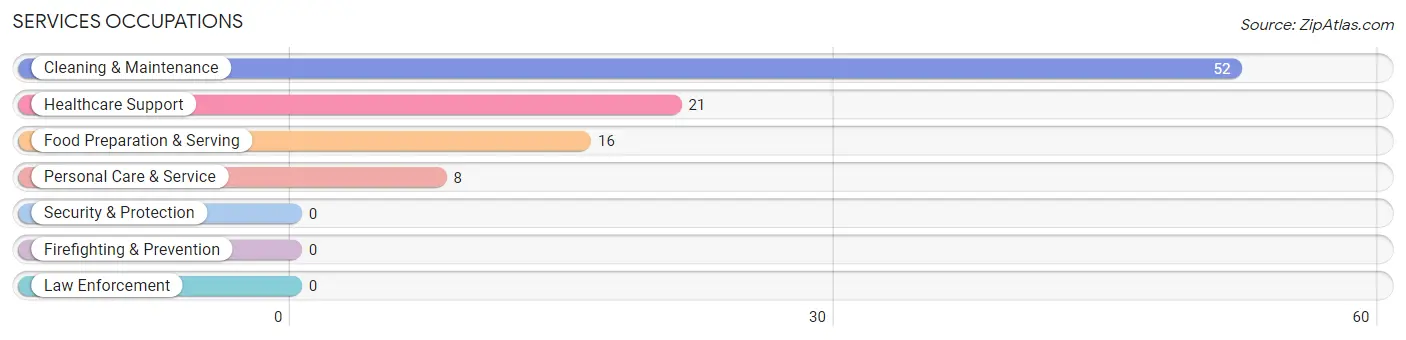
Services Occupations
The most common Services occupations in Diamondville are Cleaning & Maintenance (52 | 13.2%), Healthcare Support (21 | 5.3%), Food Preparation & Serving (16 | 4.1%), and Personal Care & Service (8 | 2.0%).
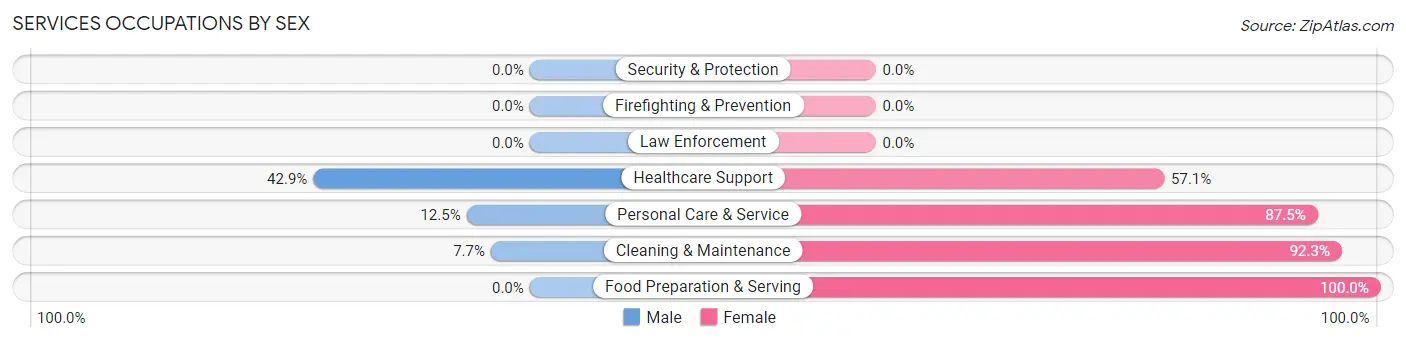
Services Occupations by Sex
Within the Services occupations in Diamondville, the most male-oriented occupations are Healthcare Support (42.9%), Personal Care & Service (12.5%), and Cleaning & Maintenance (7.7%), while the most female-oriented occupations are Food Preparation & Serving (100.0%), Cleaning & Maintenance (92.3%), and Personal Care & Service (87.5%).
| Occupation | Male | Female |
| Healthcare Support | 9 (42.9%) | 12 (57.1%) |
| Security & Protection | 0 (0.0%) | 0 (0.0%) |
| Firefighting & Prevention | 0 (0.0%) | 0 (0.0%) |
| Law Enforcement | 0 (0.0%) | 0 (0.0%) |
| Food Preparation & Serving | 0 (0.0%) | 16 (100.0%) |
| Cleaning & Maintenance | 4 (7.7%) | 48 (92.3%) |
| Personal Care & Service | 1 (12.5%) | 7 (87.5%) |
| Total (Category) | 14 (14.4%) | 83 (85.6%) |
| Total (Overall) | 163 (41.3%) | 232 (58.7%) |
Sales and Office Occupations
The most common Sales and Office occupations in Diamondville are Office & Administration (37 | 9.4%), and Sales & Related (18 | 4.6%).
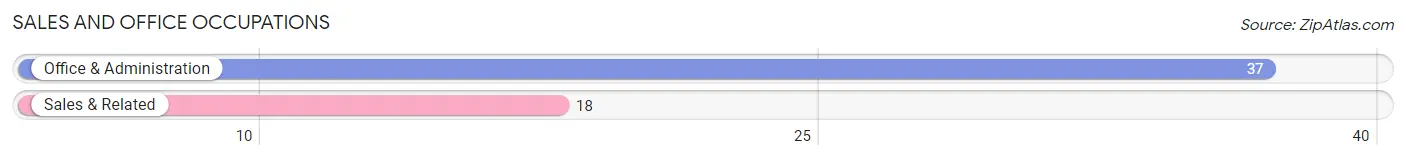
Sales and Office Occupations by Sex
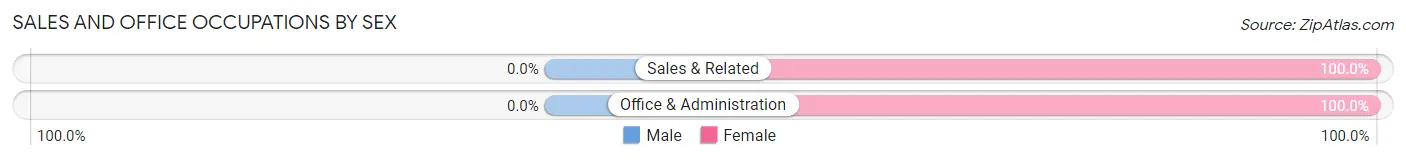
| Occupation | Male | Female |
| Sales & Related | 0 (0.0%) | 18 (100.0%) |
| Office & Administration | 0 (0.0%) | 37 (100.0%) |
| Total (Category) | 0 (0.0%) | 55 (100.0%) |
| Total (Overall) | 163 (41.3%) | 232 (58.7%) |
Natural Resources, Construction and Maintenance Occupations
The most common Natural Resources, Construction and Maintenance occupations in Diamondville are Construction & Extraction (61 | 15.4%), Installation, Maintenance & Repair (21 | 5.3%), and Farming, Fishing & Forestry (20 | 5.1%).
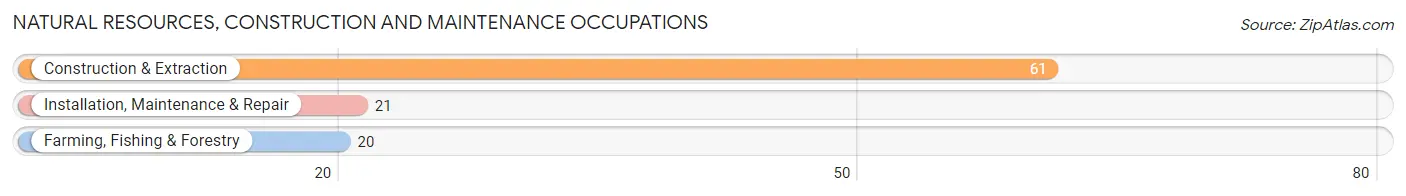
Natural Resources, Construction and Maintenance Occupations by Sex
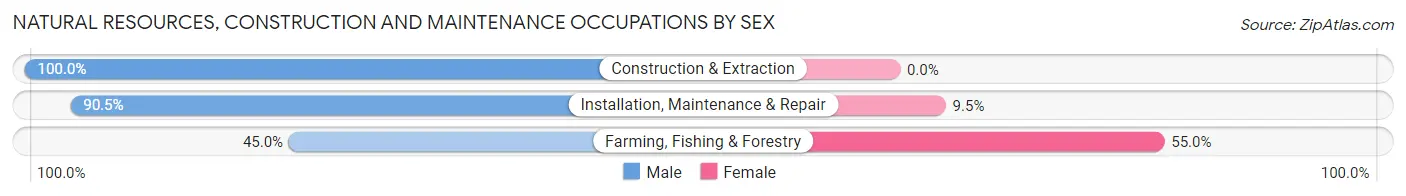
| Occupation | Male | Female |
| Farming, Fishing & Forestry | 9 (45.0%) | 11 (55.0%) |
| Construction & Extraction | 61 (100.0%) | 0 (0.0%) |
| Installation, Maintenance & Repair | 19 (90.5%) | 2 (9.5%) |
| Total (Category) | 89 (87.3%) | 13 (12.8%) |
| Total (Overall) | 163 (41.3%) | 232 (58.7%) |
Production, Transportation and Moving Occupations
The most common Production, Transportation and Moving occupations in Diamondville are Production (28 | 7.1%), Transportation (20 | 5.1%), and Material Moving (12 | 3.0%).
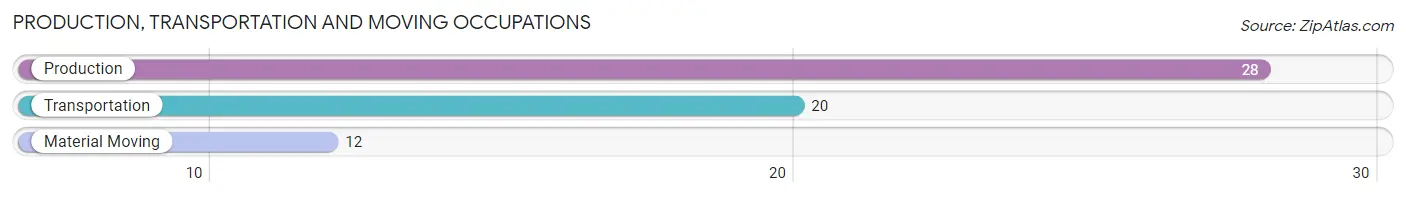
Production, Transportation and Moving Occupations by Sex
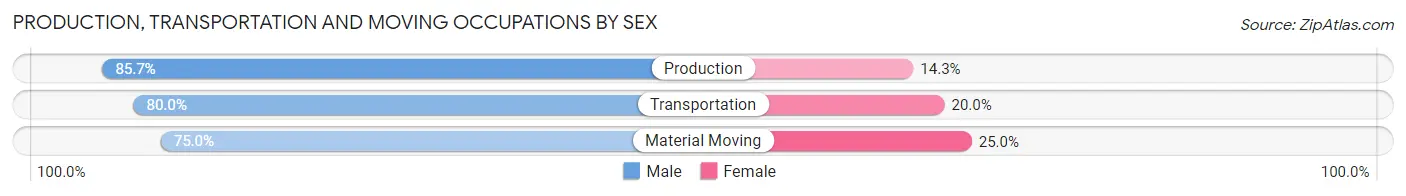
| Occupation | Male | Female |
| Production | 24 (85.7%) | 4 (14.3%) |
| Transportation | 16 (80.0%) | 4 (20.0%) |
| Material Moving | 9 (75.0%) | 3 (25.0%) |
| Total (Category) | 49 (81.7%) | 11 (18.3%) |
| Total (Overall) | 163 (41.3%) | 232 (58.7%) |
Employment Industries by Sex in Diamondville
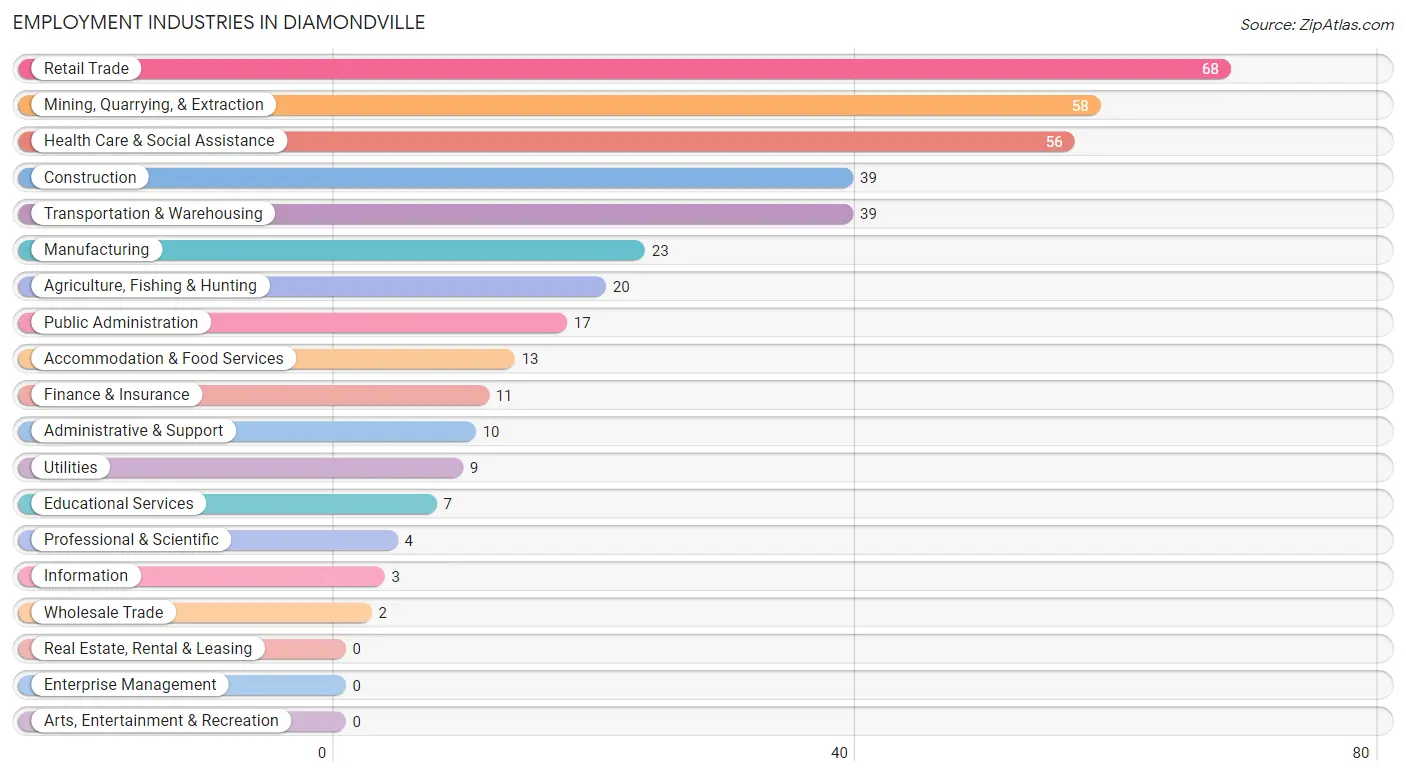
Employment Industries in Diamondville
The major employment industries in Diamondville include Retail Trade (68 | 17.2%), Mining, Quarrying, & Extraction (58 | 14.7%), Health Care & Social Assistance (56 | 14.2%), Construction (39 | 9.9%), and Transportation & Warehousing (39 | 9.9%).
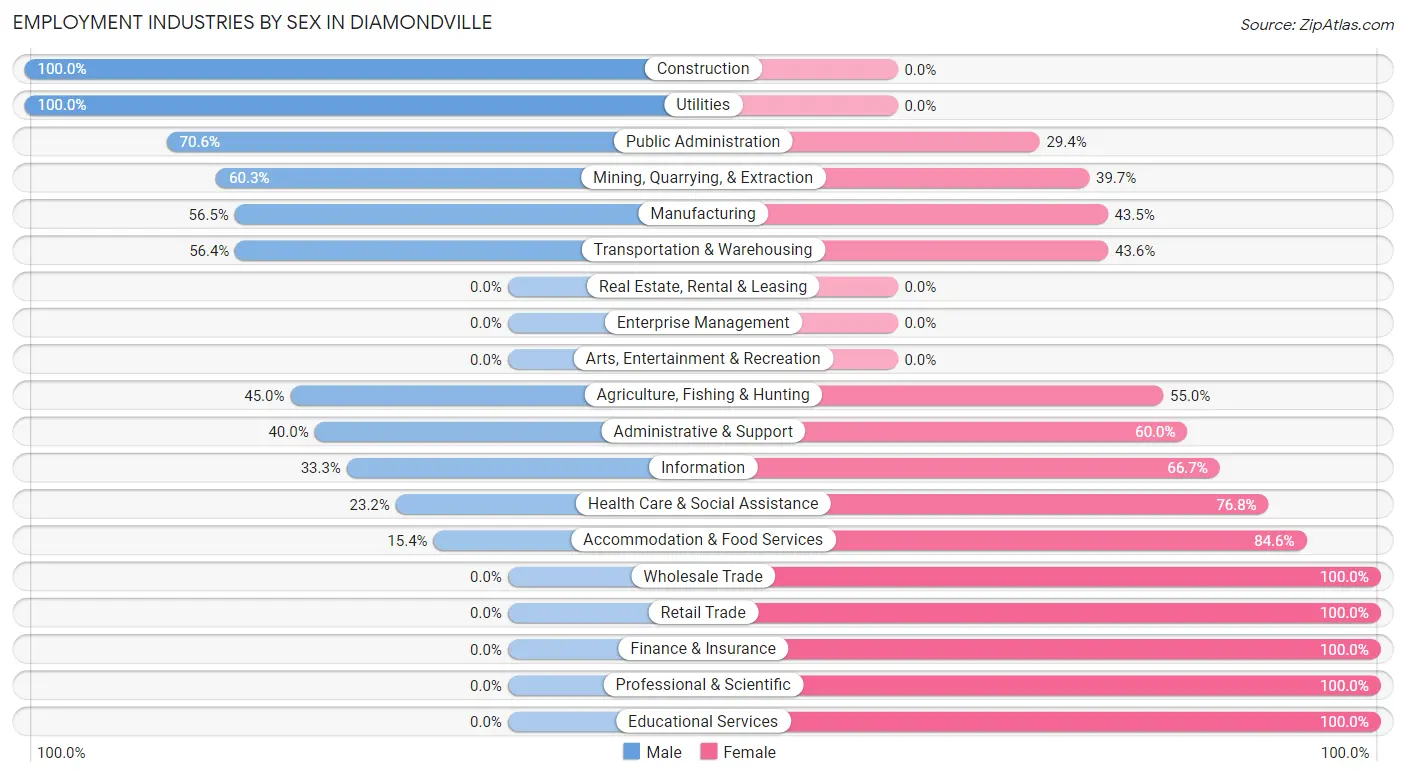
Employment Industries by Sex in Diamondville
The Diamondville industries that see more men than women are Construction (100.0%), Utilities (100.0%), and Public Administration (70.6%), whereas the industries that tend to have a higher number of women are Wholesale Trade (100.0%), Retail Trade (100.0%), and Finance & Insurance (100.0%).
| Industry | Male | Female |
| Agriculture, Fishing & Hunting | 9 (45.0%) | 11 (55.0%) |
| Mining, Quarrying, & Extraction | 35 (60.3%) | 23 (39.7%) |
| Construction | 39 (100.0%) | 0 (0.0%) |
| Manufacturing | 13 (56.5%) | 10 (43.5%) |
| Wholesale Trade | 0 (0.0%) | 2 (100.0%) |
| Retail Trade | 0 (0.0%) | 68 (100.0%) |
| Transportation & Warehousing | 22 (56.4%) | 17 (43.6%) |
| Utilities | 9 (100.0%) | 0 (0.0%) |
| Information | 1 (33.3%) | 2 (66.7%) |
| Finance & Insurance | 0 (0.0%) | 11 (100.0%) |
| Real Estate, Rental & Leasing | 0 (0.0%) | 0 (0.0%) |
| Professional & Scientific | 0 (0.0%) | 4 (100.0%) |
| Enterprise Management | 0 (0.0%) | 0 (0.0%) |
| Administrative & Support | 4 (40.0%) | 6 (60.0%) |
| Educational Services | 0 (0.0%) | 7 (100.0%) |
| Health Care & Social Assistance | 13 (23.2%) | 43 (76.8%) |
| Arts, Entertainment & Recreation | 0 (0.0%) | 0 (0.0%) |
| Accommodation & Food Services | 2 (15.4%) | 11 (84.6%) |
| Public Administration | 12 (70.6%) | 5 (29.4%) |
| Total | 163 (41.3%) | 232 (58.7%) |
Education in Diamondville
School Enrollment in Diamondville
The most common levels of schooling among the 85 students in Diamondville are high school (36 | 42.3%), middle school (27 | 31.8%), and nursery / preschool (13 | 15.3%).
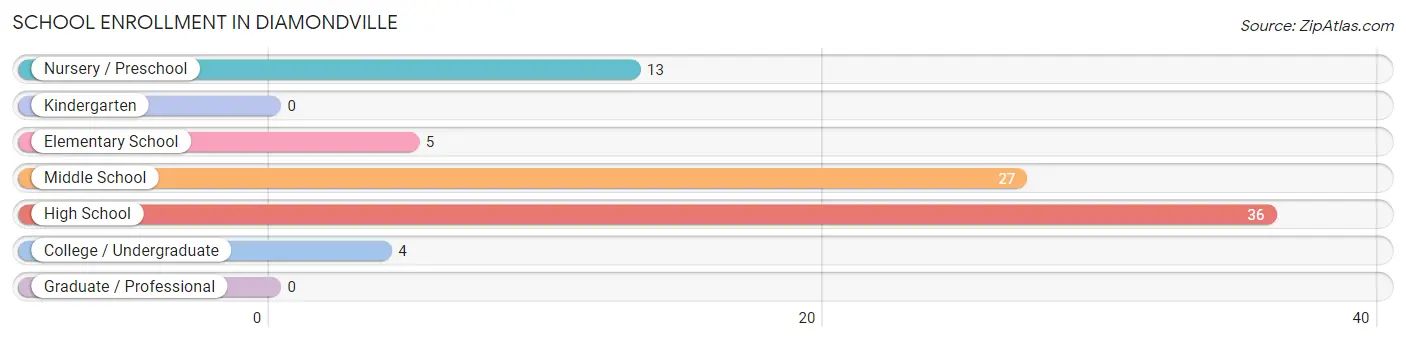
| School Level | # Students | % Students |
| Nursery / Preschool | 13 | 15.3% |
| Kindergarten | 0 | 0.0% |
| Elementary School | 5 | 5.9% |
| Middle School | 27 | 31.8% |
| High School | 36 | 42.3% |
| College / Undergraduate | 4 | 4.7% |
| Graduate / Professional | 0 | 0.0% |
| Total | 85 | 100.0% |
School Enrollment by Age by Funding Source in Diamondville
Out of a total of 85 students who are enrolled in schools in Diamondville, 11 (12.9%) attend a private institution, while the remaining 74 (87.1%) are enrolled in public schools. The age group of 5 to 9 year old has the highest likelihood of being enrolled in private schools, with 2 (100.0% in the age bracket) enrolled. Conversely, the age group of 15 to 17 year olds has the lowest likelihood of being enrolled in a private school, with 25 (100.0% in the age bracket) attending a public institution.
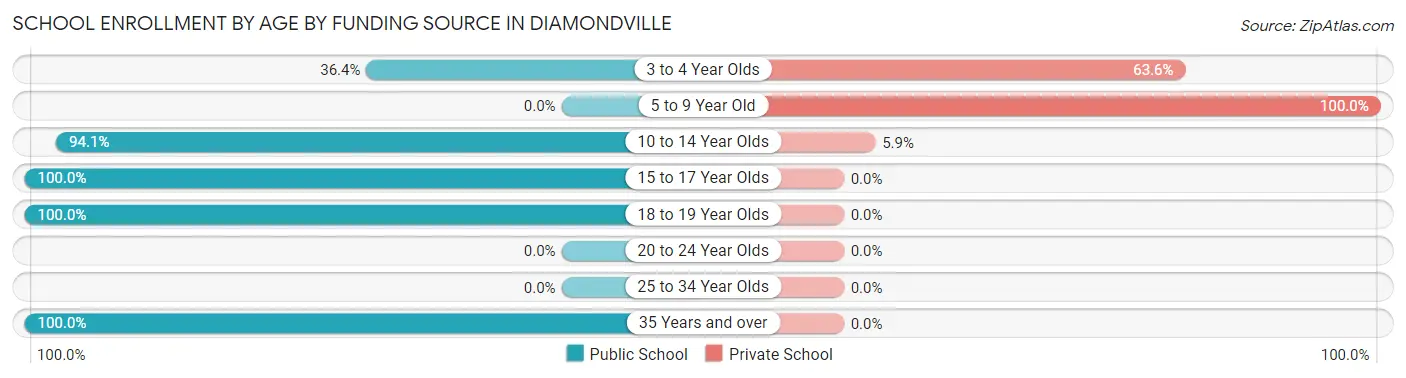
| Age Bracket | Public School | Private School |
| 3 to 4 Year Olds | 4 (36.4%) | 7 (63.6%) |
| 5 to 9 Year Old | 0 (0.0%) | 2 (100.0%) |
| 10 to 14 Year Olds | 32 (94.1%) | 2 (5.9%) |
| 15 to 17 Year Olds | 25 (100.0%) | 0 (0.0%) |
| 18 to 19 Year Olds | 9 (100.0%) | 0 (0.0%) |
| 20 to 24 Year Olds | 0 (0.0%) | 0 (0.0%) |
| 25 to 34 Year Olds | 0 (0.0%) | 0 (0.0%) |
| 35 Years and over | 4 (100.0%) | 0 (0.0%) |
| Total | 74 (87.1%) | 11 (12.9%) |
Educational Attainment by Field of Study in Diamondville
Education (18 | 41.9%), science & technology (8 | 18.6%), engineering (4 | 9.3%), business (3 | 7.0%), and visual & performing arts (3 | 7.0%) are the most common fields of study among 43 individuals in Diamondville who have obtained a bachelor's degree or higher.
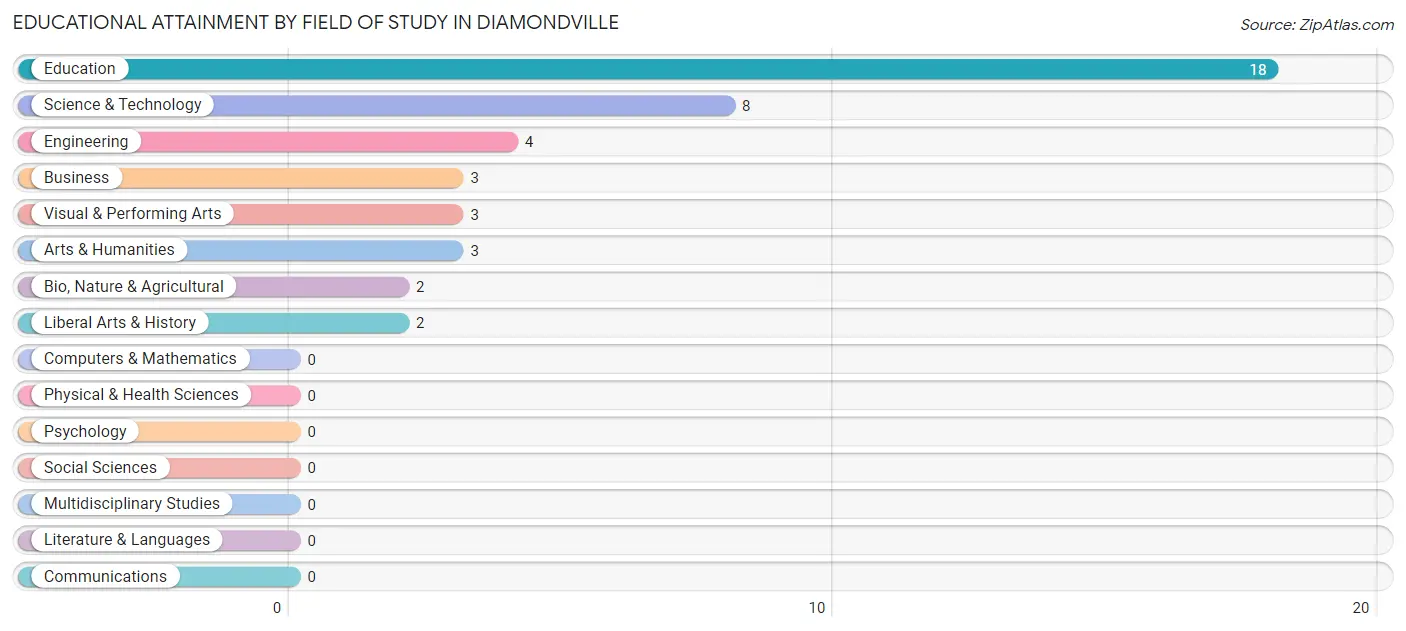
| Field of Study | # Graduates | % Graduates |
| Computers & Mathematics | 0 | 0.0% |
| Bio, Nature & Agricultural | 2 | 4.6% |
| Physical & Health Sciences | 0 | 0.0% |
| Psychology | 0 | 0.0% |
| Social Sciences | 0 | 0.0% |
| Engineering | 4 | 9.3% |
| Multidisciplinary Studies | 0 | 0.0% |
| Science & Technology | 8 | 18.6% |
| Business | 3 | 7.0% |
| Education | 18 | 41.9% |
| Literature & Languages | 0 | 0.0% |
| Liberal Arts & History | 2 | 4.6% |
| Visual & Performing Arts | 3 | 7.0% |
| Communications | 0 | 0.0% |
| Arts & Humanities | 3 | 7.0% |
| Total | 43 | 100.0% |
Transportation & Commute in Diamondville
Vehicle Availability by Sex in Diamondville
The most prevalent vehicle ownership categories in Diamondville are males with 3 vehicles (42, accounting for 28.0%) and females with 3 vehicles (42, making up 19.6%).
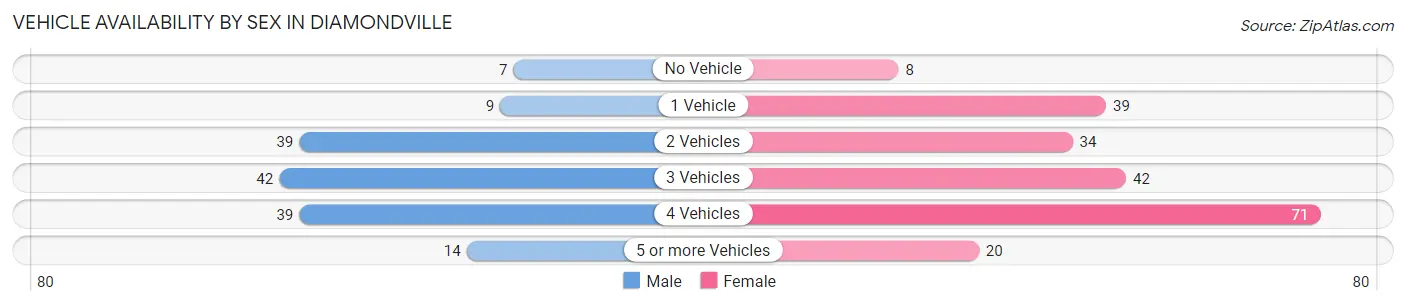
| Vehicles Available | Male | Female |
| No Vehicle | 7 (4.7%) | 8 (3.7%) |
| 1 Vehicle | 9 (6.0%) | 39 (18.2%) |
| 2 Vehicles | 39 (26.0%) | 34 (15.9%) |
| 3 Vehicles | 42 (28.0%) | 42 (19.6%) |
| 4 Vehicles | 39 (26.0%) | 71 (33.2%) |
| 5 or more Vehicles | 14 (9.3%) | 20 (9.3%) |
| Total | 150 (100.0%) | 214 (100.0%) |
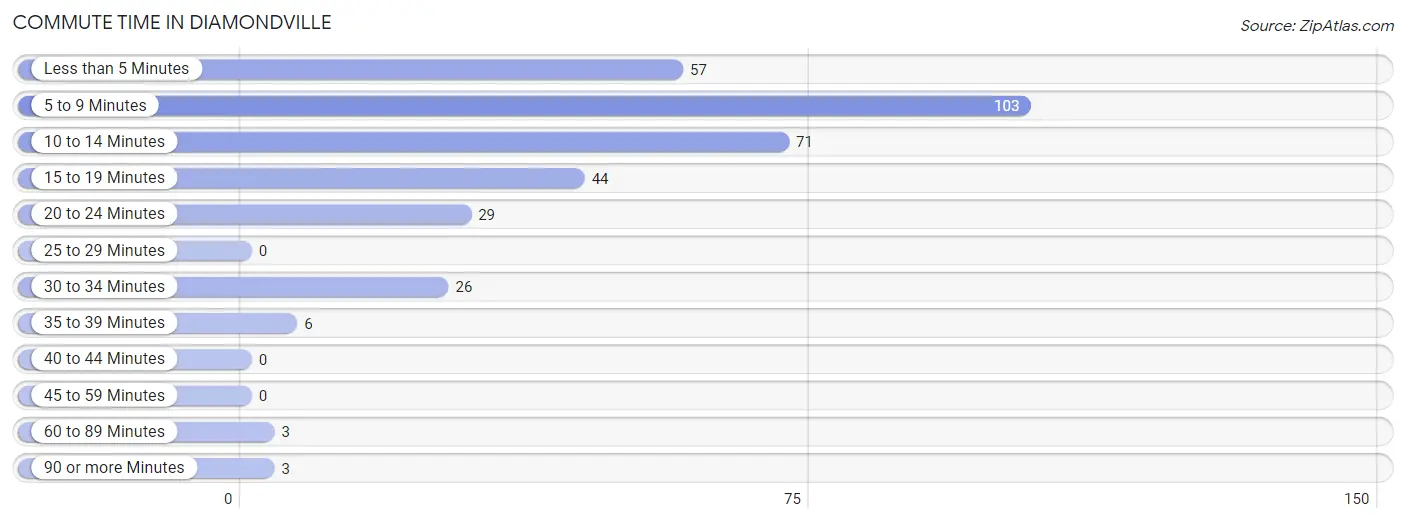
Commute Time in Diamondville
The most frequently occuring commute durations in Diamondville are 5 to 9 minutes (103 commuters, 30.1%), 10 to 14 minutes (71 commuters, 20.8%), and less than 5 minutes (57 commuters, 16.7%).
| Commute Time | # Commuters | % Commuters |
| Less than 5 Minutes | 57 | 16.7% |
| 5 to 9 Minutes | 103 | 30.1% |
| 10 to 14 Minutes | 71 | 20.8% |
| 15 to 19 Minutes | 44 | 12.9% |
| 20 to 24 Minutes | 29 | 8.5% |
| 25 to 29 Minutes | 0 | 0.0% |
| 30 to 34 Minutes | 26 | 7.6% |
| 35 to 39 Minutes | 6 | 1.8% |
| 40 to 44 Minutes | 0 | 0.0% |
| 45 to 59 Minutes | 0 | 0.0% |
| 60 to 89 Minutes | 3 | 0.9% |
| 90 or more Minutes | 3 | 0.9% |
Commute Time by Sex in Diamondville
The most common commute times in Diamondville are 10 to 14 minutes (30 commuters, 20.0%) for males and 5 to 9 minutes (91 commuters, 47.4%) for females.

| Commute Time | Male | Female |
| Less than 5 Minutes | 26 (17.3%) | 31 (16.2%) |
| 5 to 9 Minutes | 12 (8.0%) | 91 (47.4%) |
| 10 to 14 Minutes | 30 (20.0%) | 41 (21.3%) |
| 15 to 19 Minutes | 27 (18.0%) | 17 (8.8%) |
| 20 to 24 Minutes | 23 (15.3%) | 6 (3.1%) |
| 25 to 29 Minutes | 0 (0.0%) | 0 (0.0%) |
| 30 to 34 Minutes | 23 (15.3%) | 3 (1.6%) |
| 35 to 39 Minutes | 6 (4.0%) | 0 (0.0%) |
| 40 to 44 Minutes | 0 (0.0%) | 0 (0.0%) |
| 45 to 59 Minutes | 0 (0.0%) | 0 (0.0%) |
| 60 to 89 Minutes | 3 (2.0%) | 0 (0.0%) |
| 90 or more Minutes | 0 (0.0%) | 3 (1.6%) |
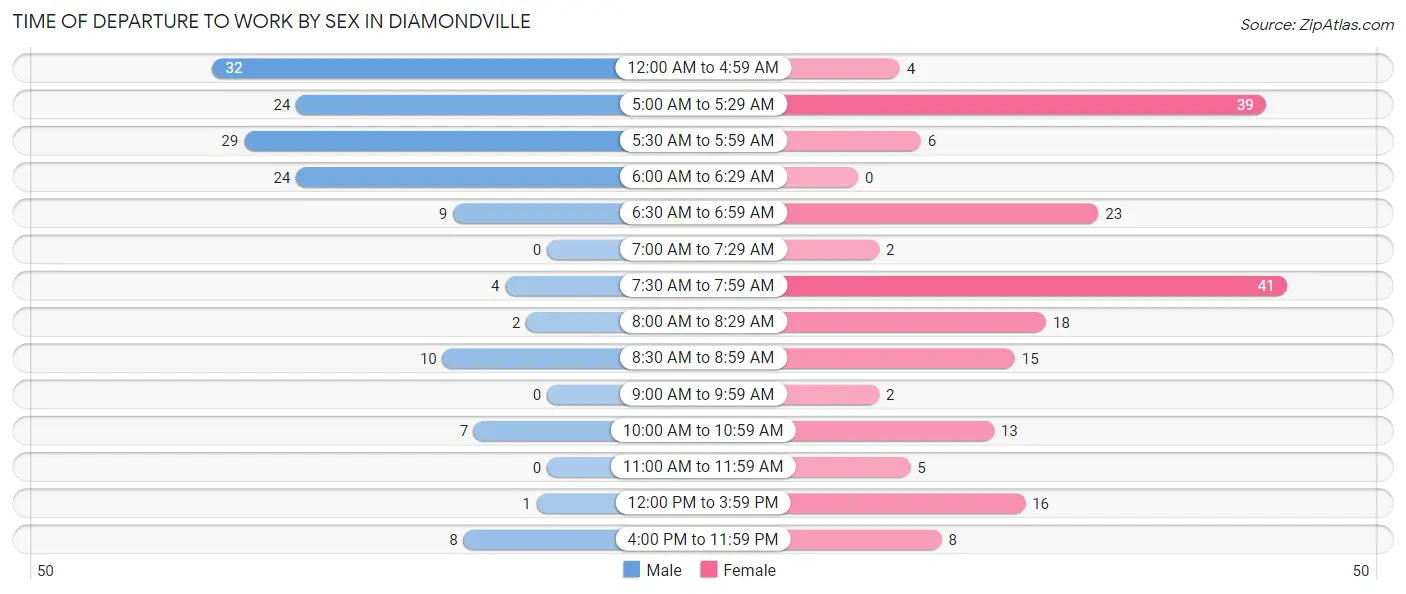
Time of Departure to Work by Sex in Diamondville
The most frequent times of departure to work in Diamondville are 12:00 AM to 4:59 AM (32, 21.3%) for males and 7:30 AM to 7:59 AM (41, 21.3%) for females.
| Time of Departure | Male | Female |
| 12:00 AM to 4:59 AM | 32 (21.3%) | 4 (2.1%) |
| 5:00 AM to 5:29 AM | 24 (16.0%) | 39 (20.3%) |
| 5:30 AM to 5:59 AM | 29 (19.3%) | 6 (3.1%) |
| 6:00 AM to 6:29 AM | 24 (16.0%) | 0 (0.0%) |
| 6:30 AM to 6:59 AM | 9 (6.0%) | 23 (12.0%) |
| 7:00 AM to 7:29 AM | 0 (0.0%) | 2 (1.0%) |
| 7:30 AM to 7:59 AM | 4 (2.7%) | 41 (21.3%) |
| 8:00 AM to 8:29 AM | 2 (1.3%) | 18 (9.4%) |
| 8:30 AM to 8:59 AM | 10 (6.7%) | 15 (7.8%) |
| 9:00 AM to 9:59 AM | 0 (0.0%) | 2 (1.0%) |
| 10:00 AM to 10:59 AM | 7 (4.7%) | 13 (6.8%) |
| 11:00 AM to 11:59 AM | 0 (0.0%) | 5 (2.6%) |
| 12:00 PM to 3:59 PM | 1 (0.7%) | 16 (8.3%) |
| 4:00 PM to 11:59 PM | 8 (5.3%) | 8 (4.2%) |
| Total | 150 (100.0%) | 192 (100.0%) |
Housing Occupancy in Diamondville
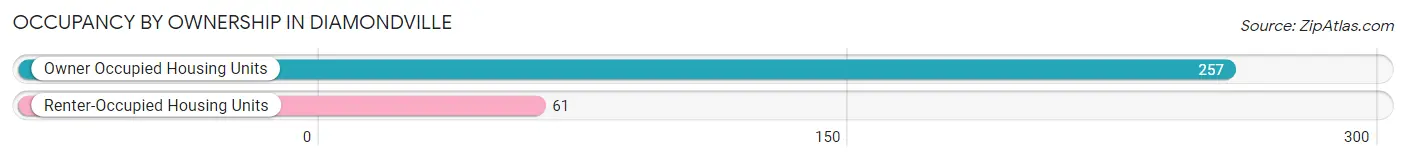
Occupancy by Ownership in Diamondville
Of the total 318 dwellings in Diamondville, owner-occupied units account for 257 (80.8%), while renter-occupied units make up 61 (19.2%).
| Occupancy | # Housing Units | % Housing Units |
| Owner Occupied Housing Units | 257 | 80.8% |
| Renter-Occupied Housing Units | 61 | 19.2% |
| Total Occupied Housing Units | 318 | 100.0% |
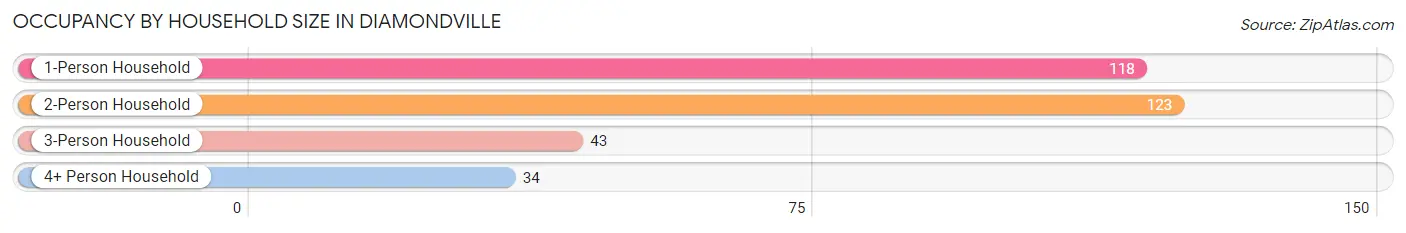
Occupancy by Household Size in Diamondville
| Household Size | # Housing Units | % Housing Units |
| 1-Person Household | 118 | 37.1% |
| 2-Person Household | 123 | 38.7% |
| 3-Person Household | 43 | 13.5% |
| 4+ Person Household | 34 | 10.7% |
| Total Housing Units | 318 | 100.0% |
Occupancy by Ownership by Household Size in Diamondville
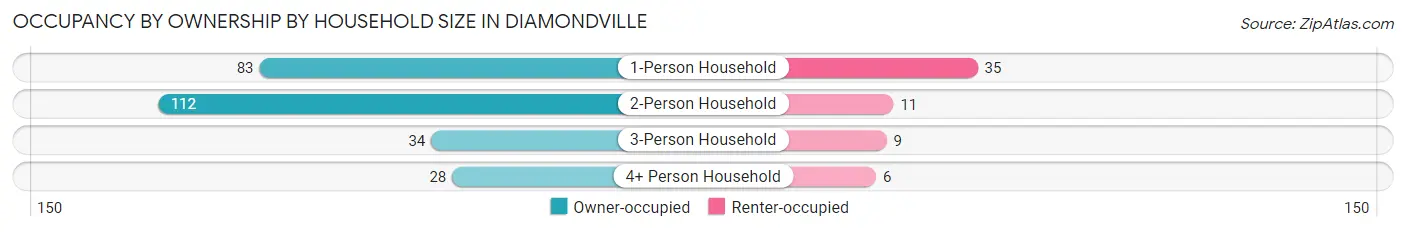
| Household Size | Owner-occupied | Renter-occupied |
| 1-Person Household | 83 (70.3%) | 35 (29.7%) |
| 2-Person Household | 112 (91.1%) | 11 (8.9%) |
| 3-Person Household | 34 (79.1%) | 9 (20.9%) |
| 4+ Person Household | 28 (82.4%) | 6 (17.6%) |
| Total Housing Units | 257 (80.8%) | 61 (19.2%) |
Occupancy by Educational Attainment in Diamondville
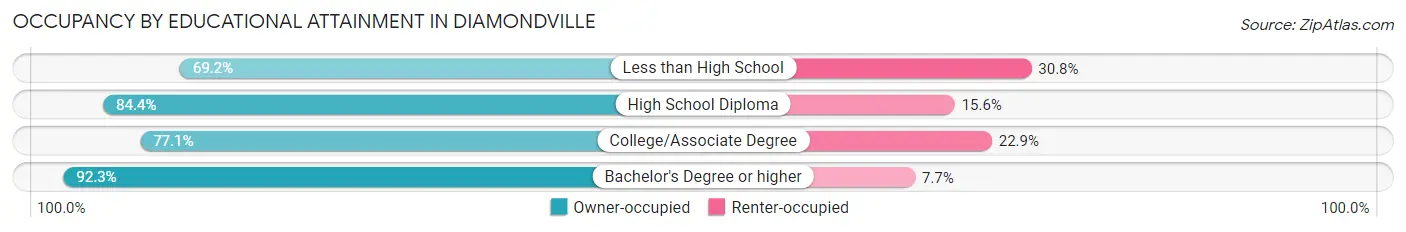
| Household Size | Owner-occupied | Renter-occupied |
| Less than High School | 9 (69.2%) | 4 (30.8%) |
| High School Diploma | 103 (84.4%) | 19 (15.6%) |
| College/Associate Degree | 121 (77.1%) | 36 (22.9%) |
| Bachelor's Degree or higher | 24 (92.3%) | 2 (7.7%) |
Occupancy by Age of Householder in Diamondville
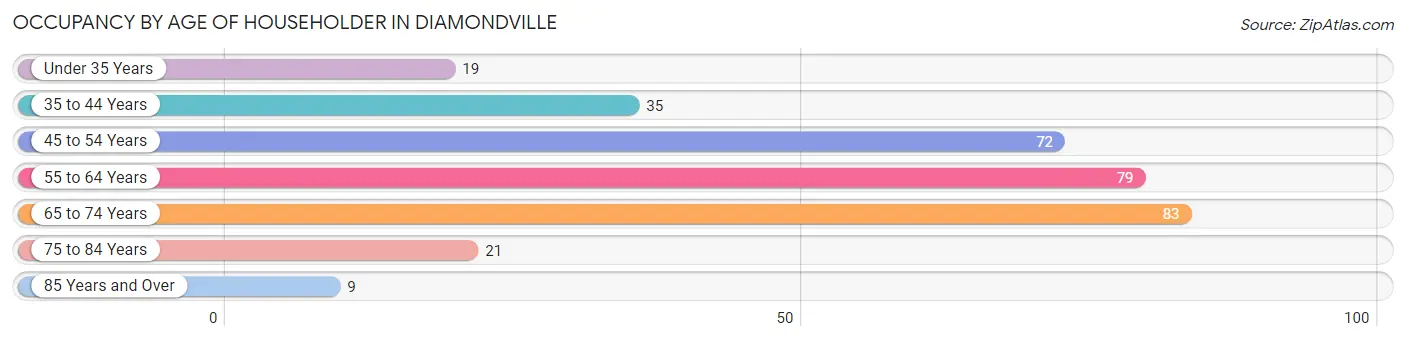
| Age Bracket | # Households | % Households |
| Under 35 Years | 19 | 6.0% |
| 35 to 44 Years | 35 | 11.0% |
| 45 to 54 Years | 72 | 22.6% |
| 55 to 64 Years | 79 | 24.8% |
| 65 to 74 Years | 83 | 26.1% |
| 75 to 84 Years | 21 | 6.6% |
| 85 Years and Over | 9 | 2.8% |
| Total | 318 | 100.0% |
Housing Finances in Diamondville
Median Income by Occupancy in Diamondville
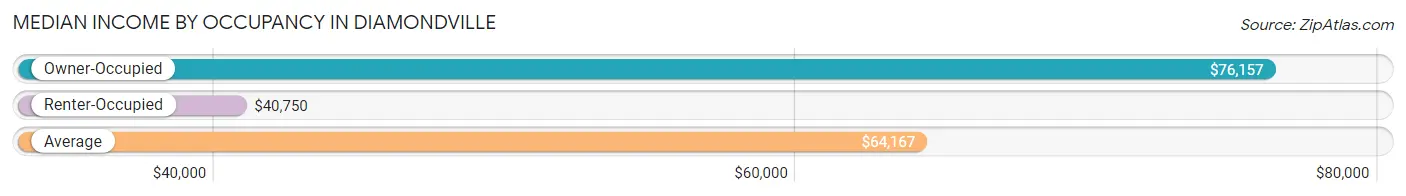
| Occupancy Type | # Households | Median Income |
| Owner-Occupied | 257 (80.8%) | $76,157 |
| Renter-Occupied | 61 (19.2%) | $40,750 |
| Average | 318 (100.0%) | $64,167 |
Occupancy by Householder Income Bracket in Diamondville
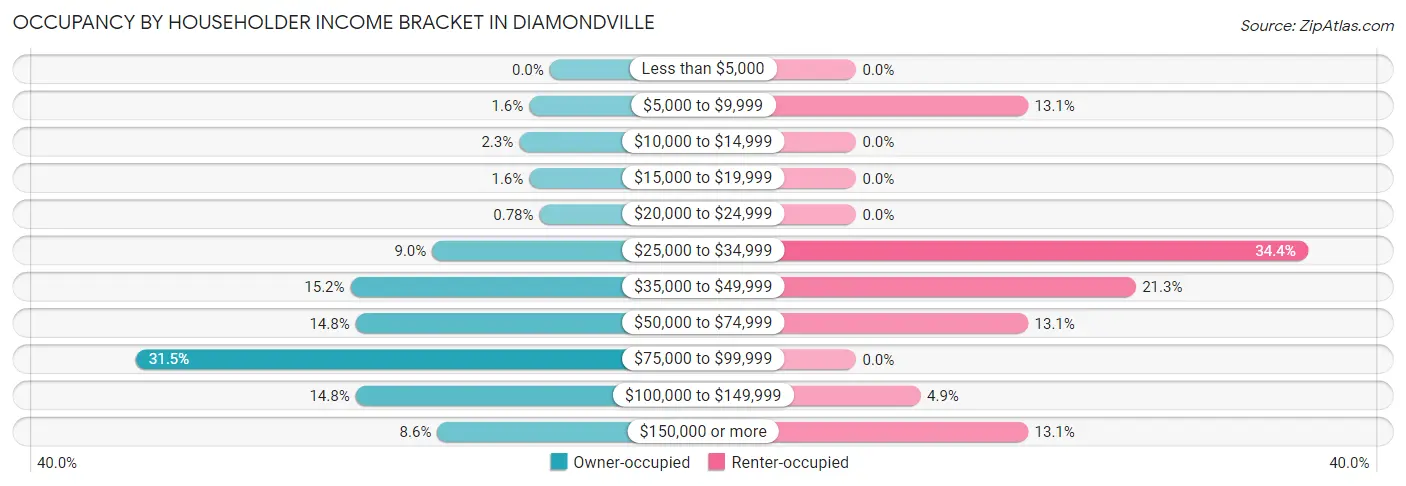
| Income Bracket | Owner-occupied | Renter-occupied |
| Less than $5,000 | 0 (0.0%) | 0 (0.0%) |
| $5,000 to $9,999 | 4 (1.6%) | 8 (13.1%) |
| $10,000 to $14,999 | 6 (2.3%) | 0 (0.0%) |
| $15,000 to $19,999 | 4 (1.6%) | 0 (0.0%) |
| $20,000 to $24,999 | 2 (0.8%) | 0 (0.0%) |
| $25,000 to $34,999 | 23 (8.9%) | 21 (34.4%) |
| $35,000 to $49,999 | 39 (15.2%) | 13 (21.3%) |
| $50,000 to $74,999 | 38 (14.8%) | 8 (13.1%) |
| $75,000 to $99,999 | 81 (31.5%) | 0 (0.0%) |
| $100,000 to $149,999 | 38 (14.8%) | 3 (4.9%) |
| $150,000 or more | 22 (8.6%) | 8 (13.1%) |
| Total | 257 (100.0%) | 61 (100.0%) |
Monthly Housing Cost Tiers in Diamondville
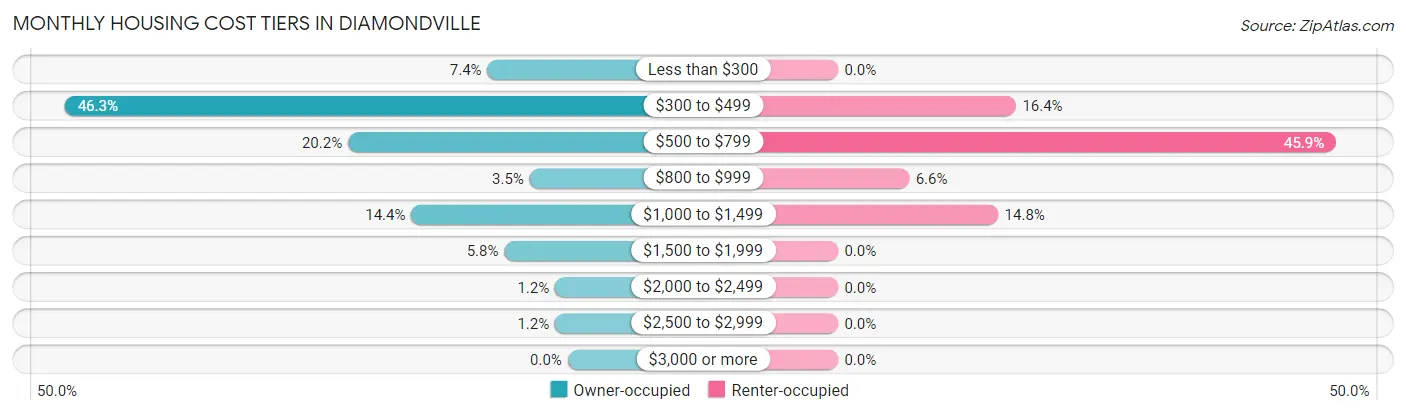
| Monthly Cost | Owner-occupied | Renter-occupied |
| Less than $300 | 19 (7.4%) | 0 (0.0%) |
| $300 to $499 | 119 (46.3%) | 10 (16.4%) |
| $500 to $799 | 52 (20.2%) | 28 (45.9%) |
| $800 to $999 | 9 (3.5%) | 4 (6.6%) |
| $1,000 to $1,499 | 37 (14.4%) | 9 (14.7%) |
| $1,500 to $1,999 | 15 (5.8%) | 0 (0.0%) |
| $2,000 to $2,499 | 3 (1.2%) | 0 (0.0%) |
| $2,500 to $2,999 | 3 (1.2%) | 0 (0.0%) |
| $3,000 or more | 0 (0.0%) | 0 (0.0%) |
| Total | 257 (100.0%) | 61 (100.0%) |
Physical Housing Characteristics in Diamondville
Housing Structures in Diamondville
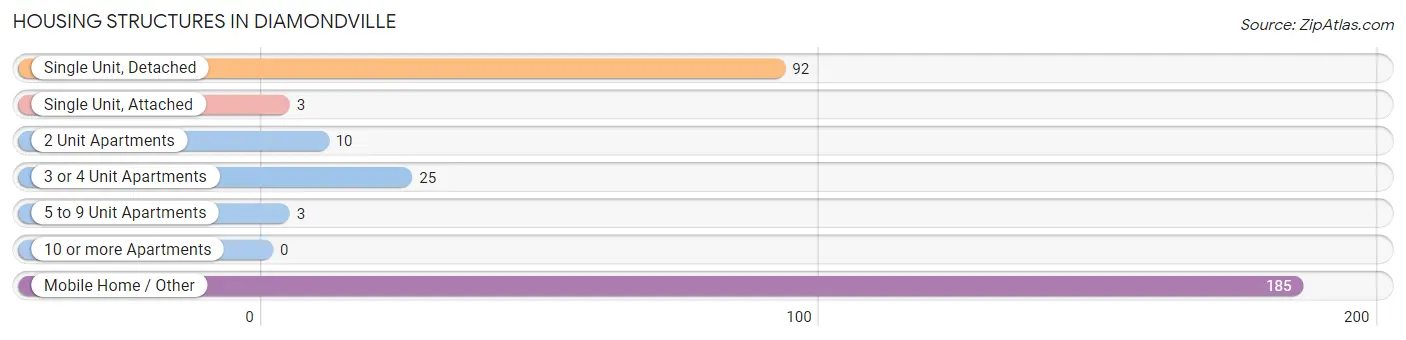
| Structure Type | # Housing Units | % Housing Units |
| Single Unit, Detached | 92 | 28.9% |
| Single Unit, Attached | 3 | 0.9% |
| 2 Unit Apartments | 10 | 3.1% |
| 3 or 4 Unit Apartments | 25 | 7.9% |
| 5 to 9 Unit Apartments | 3 | 0.9% |
| 10 or more Apartments | 0 | 0.0% |
| Mobile Home / Other | 185 | 58.2% |
| Total | 318 | 100.0% |
Housing Structures by Occupancy in Diamondville
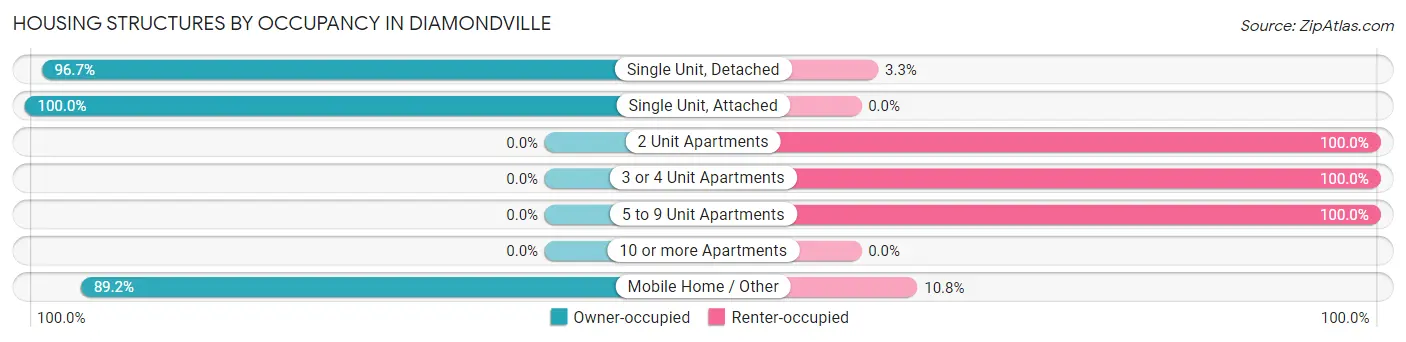
| Structure Type | Owner-occupied | Renter-occupied |
| Single Unit, Detached | 89 (96.7%) | 3 (3.3%) |
| Single Unit, Attached | 3 (100.0%) | 0 (0.0%) |
| 2 Unit Apartments | 0 (0.0%) | 10 (100.0%) |
| 3 or 4 Unit Apartments | 0 (0.0%) | 25 (100.0%) |
| 5 to 9 Unit Apartments | 0 (0.0%) | 3 (100.0%) |
| 10 or more Apartments | 0 (0.0%) | 0 (0.0%) |
| Mobile Home / Other | 165 (89.2%) | 20 (10.8%) |
| Total | 257 (80.8%) | 61 (19.2%) |
Housing Structures by Number of Rooms in Diamondville
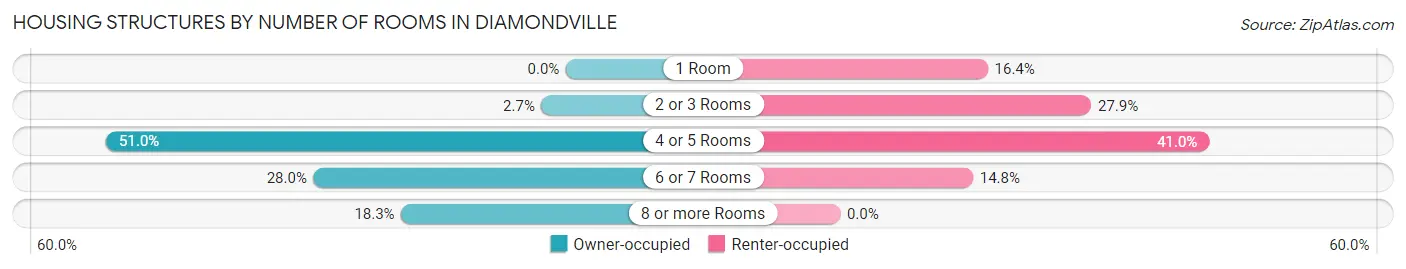
| Number of Rooms | Owner-occupied | Renter-occupied |
| 1 Room | 0 (0.0%) | 10 (16.4%) |
| 2 or 3 Rooms | 7 (2.7%) | 17 (27.9%) |
| 4 or 5 Rooms | 131 (51.0%) | 25 (41.0%) |
| 6 or 7 Rooms | 72 (28.0%) | 9 (14.7%) |
| 8 or more Rooms | 47 (18.3%) | 0 (0.0%) |
| Total | 257 (100.0%) | 61 (100.0%) |
Housing Structure by Heating Type in Diamondville
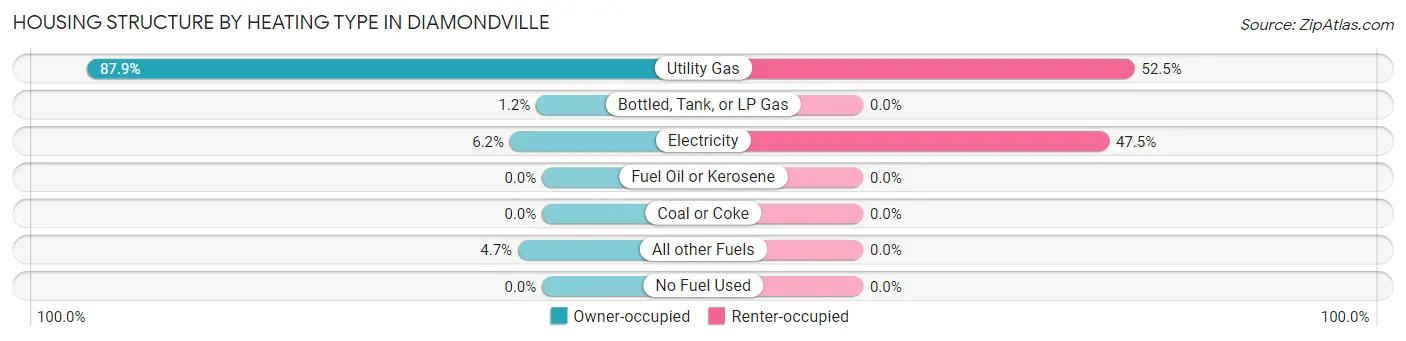
| Heating Type | Owner-occupied | Renter-occupied |
| Utility Gas | 226 (87.9%) | 32 (52.5%) |
| Bottled, Tank, or LP Gas | 3 (1.2%) | 0 (0.0%) |
| Electricity | 16 (6.2%) | 29 (47.5%) |
| Fuel Oil or Kerosene | 0 (0.0%) | 0 (0.0%) |
| Coal or Coke | 0 (0.0%) | 0 (0.0%) |
| All other Fuels | 12 (4.7%) | 0 (0.0%) |
| No Fuel Used | 0 (0.0%) | 0 (0.0%) |
| Total | 257 (100.0%) | 61 (100.0%) |
Household Vehicle Usage in Diamondville
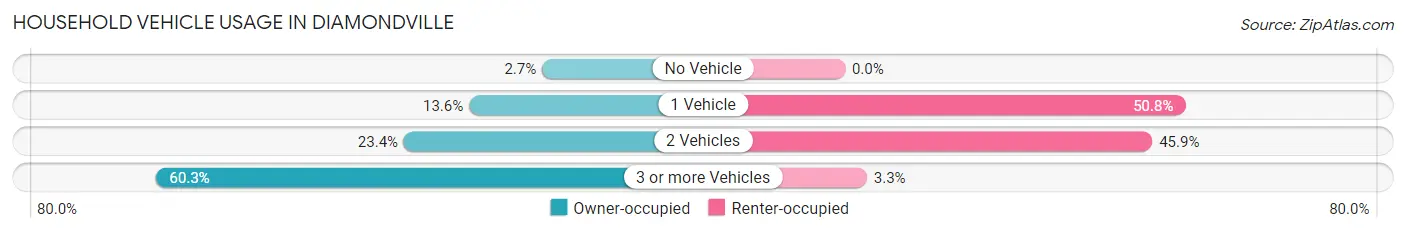
| Vehicles per Household | Owner-occupied | Renter-occupied |
| No Vehicle | 7 (2.7%) | 0 (0.0%) |
| 1 Vehicle | 35 (13.6%) | 31 (50.8%) |
| 2 Vehicles | 60 (23.4%) | 28 (45.9%) |
| 3 or more Vehicles | 155 (60.3%) | 2 (3.3%) |
| Total | 257 (100.0%) | 61 (100.0%) |
Real Estate & Mortgages in Diamondville
Real Estate and Mortgage Overview in Diamondville
| Characteristic | Without Mortgage | With Mortgage |
| Housing Units | 175 | 82 |
| Median Property Value | $90,400 | $149,000 |
| Median Household Income | $61,181 | $21 |
| Monthly Housing Costs | $385 | $0 |
| Real Estate Taxes | $439 | $0 |
Property Value by Mortgage Status in Diamondville
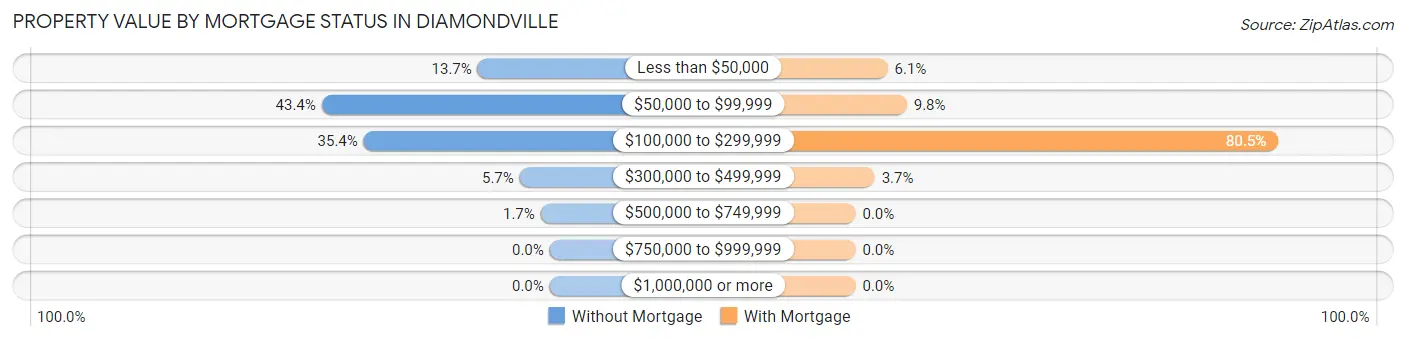
| Property Value | Without Mortgage | With Mortgage |
| Less than $50,000 | 24 (13.7%) | 5 (6.1%) |
| $50,000 to $99,999 | 76 (43.4%) | 8 (9.8%) |
| $100,000 to $299,999 | 62 (35.4%) | 66 (80.5%) |
| $300,000 to $499,999 | 10 (5.7%) | 3 (3.7%) |
| $500,000 to $749,999 | 3 (1.7%) | 0 (0.0%) |
| $750,000 to $999,999 | 0 (0.0%) | 0 (0.0%) |
| $1,000,000 or more | 0 (0.0%) | 0 (0.0%) |
| Total | 175 (100.0%) | 82 (100.0%) |
Household Income by Mortgage Status in Diamondville
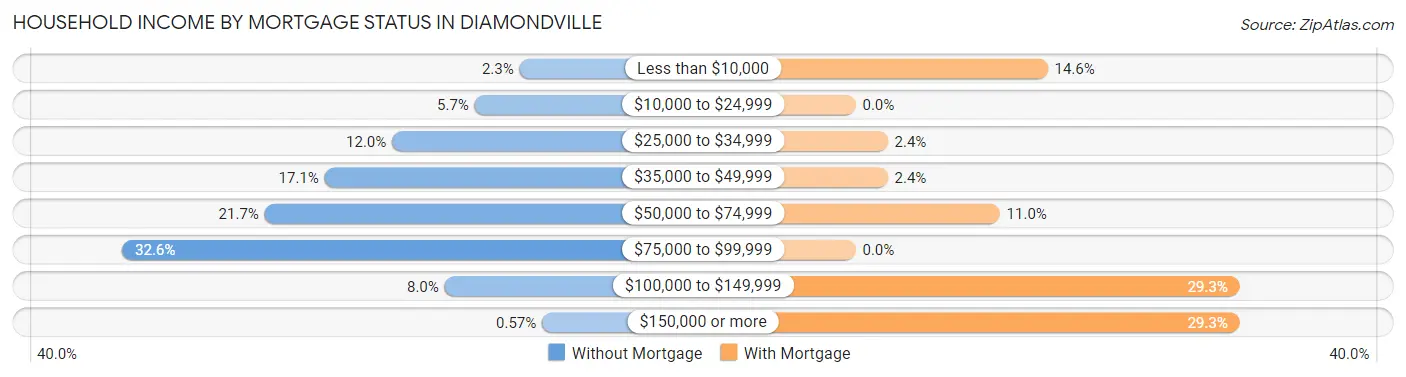
| Household Income | Without Mortgage | With Mortgage |
| Less than $10,000 | 4 (2.3%) | 12 (14.6%) |
| $10,000 to $24,999 | 10 (5.7%) | 0 (0.0%) |
| $25,000 to $34,999 | 21 (12.0%) | 2 (2.4%) |
| $35,000 to $49,999 | 30 (17.1%) | 2 (2.4%) |
| $50,000 to $74,999 | 38 (21.7%) | 9 (11.0%) |
| $75,000 to $99,999 | 57 (32.6%) | 0 (0.0%) |
| $100,000 to $149,999 | 14 (8.0%) | 24 (29.3%) |
| $150,000 or more | 1 (0.6%) | 24 (29.3%) |
| Total | 175 (100.0%) | 82 (100.0%) |
Property Value to Household Income Ratio in Diamondville
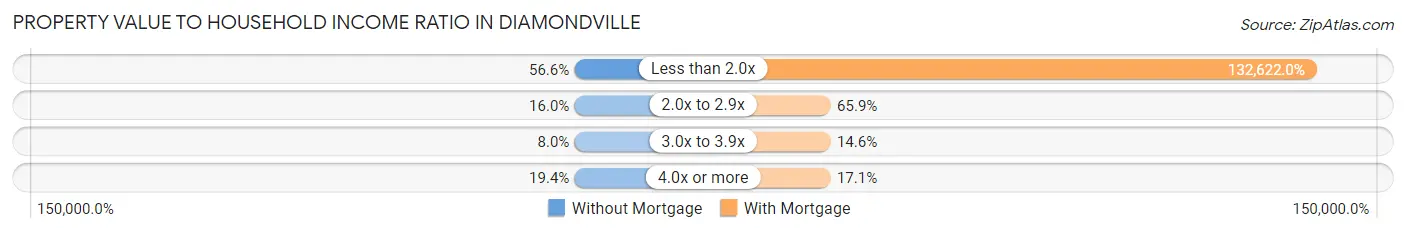
| Value-to-Income Ratio | Without Mortgage | With Mortgage |
| Less than 2.0x | 99 (56.6%) | 108,750 (132,621.9%) |
| 2.0x to 2.9x | 28 (16.0%) | 54 (65.8%) |
| 3.0x to 3.9x | 14 (8.0%) | 12 (14.6%) |
| 4.0x or more | 34 (19.4%) | 14 (17.1%) |
| Total | 175 (100.0%) | 82 (100.0%) |
Real Estate Taxes by Mortgage Status in Diamondville
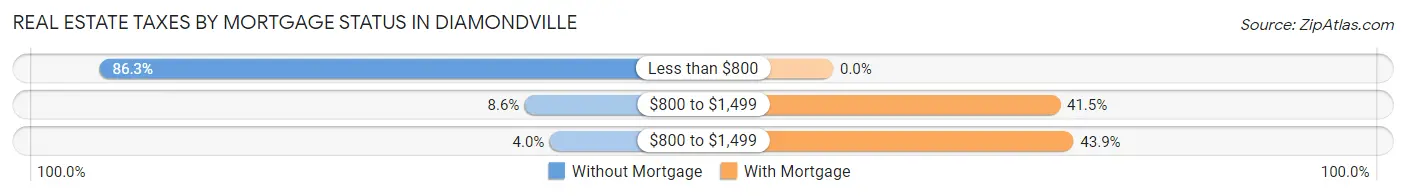
| Property Taxes | Without Mortgage | With Mortgage |
| Less than $800 | 151 (86.3%) | 0 (0.0%) |
| $800 to $1,499 | 15 (8.6%) | 34 (41.5%) |
| $800 to $1,499 | 7 (4.0%) | 36 (43.9%) |
| Total | 175 (100.0%) | 82 (100.0%) |
Health & Disability in Diamondville
Health Insurance Coverage by Age in Diamondville
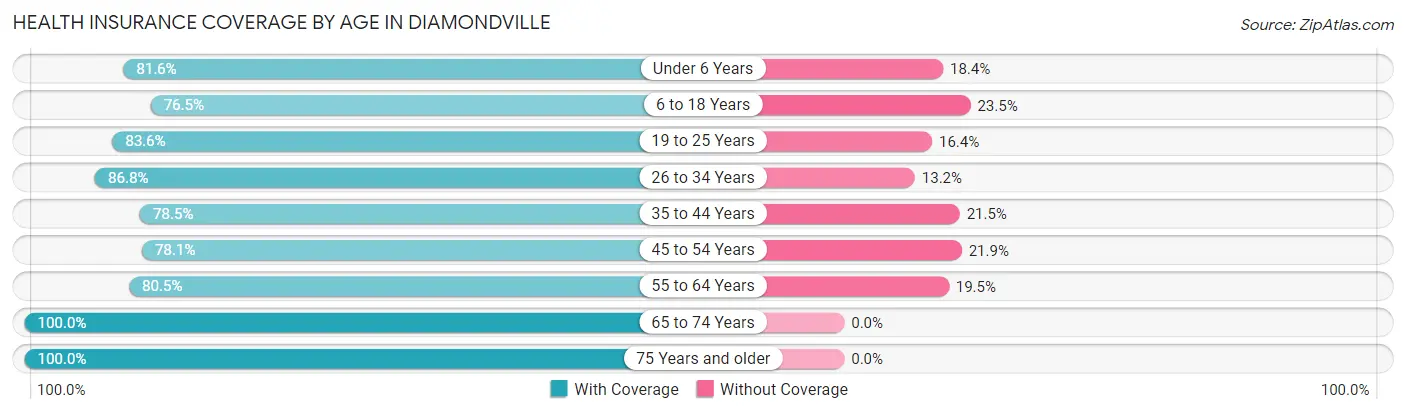
| Age Bracket | With Coverage | Without Coverage |
| Under 6 Years | 31 (81.6%) | 7 (18.4%) |
| 6 to 18 Years | 52 (76.5%) | 16 (23.5%) |
| 19 to 25 Years | 46 (83.6%) | 9 (16.4%) |
| 26 to 34 Years | 33 (86.8%) | 5 (13.2%) |
| 35 to 44 Years | 62 (78.5%) | 17 (21.5%) |
| 45 to 54 Years | 82 (78.1%) | 23 (21.9%) |
| 55 to 64 Years | 124 (80.5%) | 30 (19.5%) |
| 65 to 74 Years | 120 (100.0%) | 0 (0.0%) |
| 75 Years and older | 43 (100.0%) | 0 (0.0%) |
| Total | 593 (84.7%) | 107 (15.3%) |
Health Insurance Coverage by Citizenship Status in Diamondville
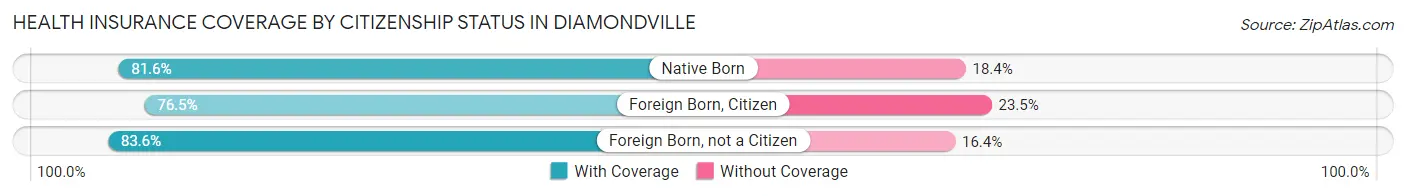
| Citizenship Status | With Coverage | Without Coverage |
| Native Born | 31 (81.6%) | 7 (18.4%) |
| Foreign Born, Citizen | 52 (76.5%) | 16 (23.5%) |
| Foreign Born, not a Citizen | 46 (83.6%) | 9 (16.4%) |
Health Insurance Coverage by Household Income in Diamondville
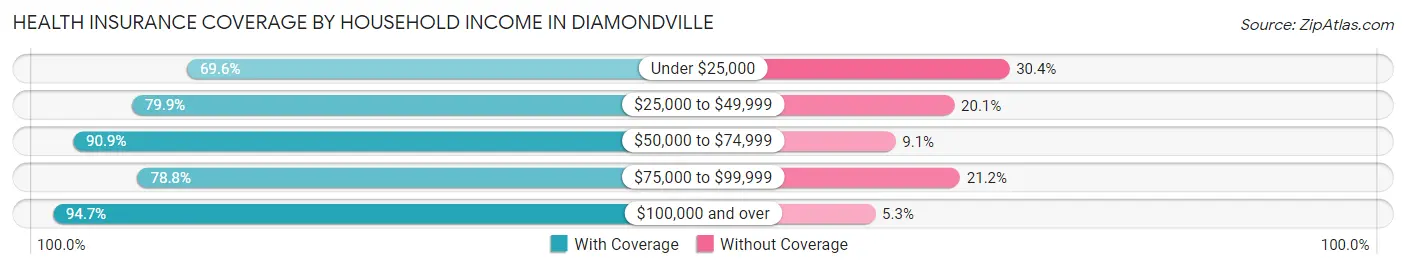
| Household Income | With Coverage | Without Coverage |
| Under $25,000 | 32 (69.6%) | 14 (30.4%) |
| $25,000 to $49,999 | 151 (79.9%) | 38 (20.1%) |
| $50,000 to $74,999 | 80 (90.9%) | 8 (9.1%) |
| $75,000 to $99,999 | 134 (78.8%) | 36 (21.2%) |
| $100,000 and over | 196 (94.7%) | 11 (5.3%) |
Public vs Private Health Insurance Coverage by Age in Diamondville
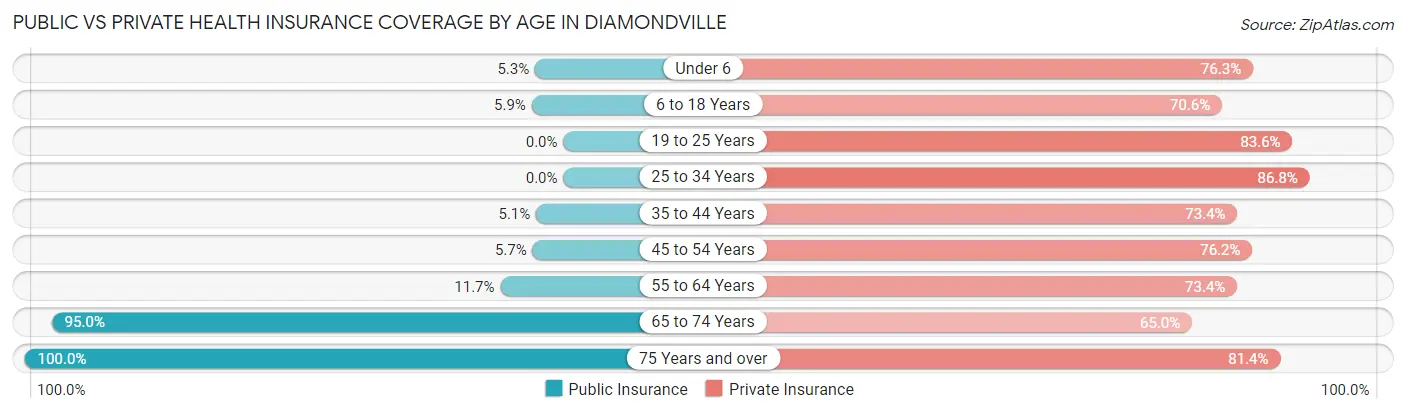
| Age Bracket | Public Insurance | Private Insurance |
| Under 6 | 2 (5.3%) | 29 (76.3%) |
| 6 to 18 Years | 4 (5.9%) | 48 (70.6%) |
| 19 to 25 Years | 0 (0.0%) | 46 (83.6%) |
| 25 to 34 Years | 0 (0.0%) | 33 (86.8%) |
| 35 to 44 Years | 4 (5.1%) | 58 (73.4%) |
| 45 to 54 Years | 6 (5.7%) | 80 (76.2%) |
| 55 to 64 Years | 18 (11.7%) | 113 (73.4%) |
| 65 to 74 Years | 114 (95.0%) | 78 (65.0%) |
| 75 Years and over | 43 (100.0%) | 35 (81.4%) |
| Total | 191 (27.3%) | 520 (74.3%) |
Disability Status by Sex by Age in Diamondville
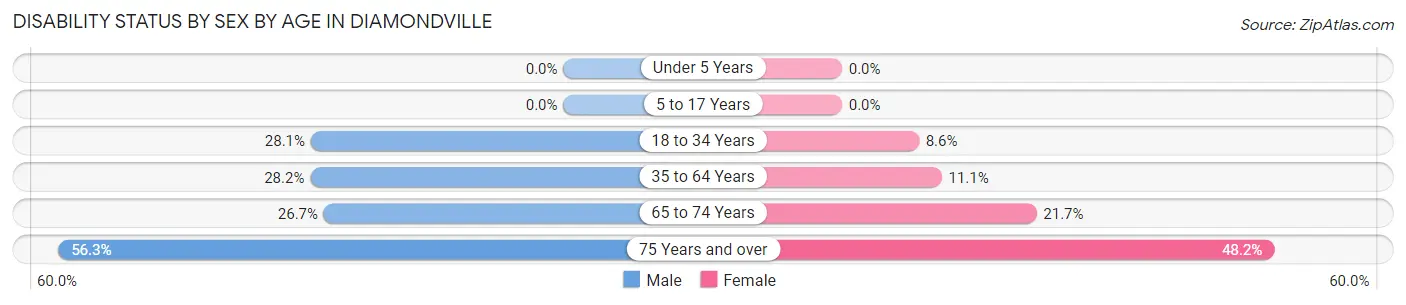
| Age Bracket | Male | Female |
| Under 5 Years | 0 (0.0%) | 0 (0.0%) |
| 5 to 17 Years | 0 (0.0%) | 0 (0.0%) |
| 18 to 34 Years | 9 (28.1%) | 6 (8.6%) |
| 35 to 64 Years | 42 (28.2%) | 21 (11.1%) |
| 65 to 74 Years | 16 (26.7%) | 13 (21.7%) |
| 75 Years and over | 9 (56.2%) | 13 (48.1%) |
Disability Class by Sex by Age in Diamondville
Disability Class: Hearing Difficulty
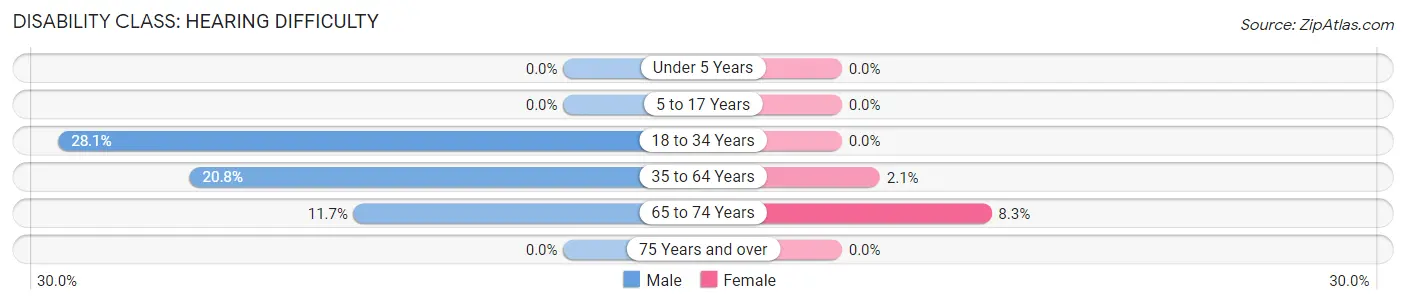
| Age Bracket | Male | Female |
| Under 5 Years | 0 (0.0%) | 0 (0.0%) |
| 5 to 17 Years | 0 (0.0%) | 0 (0.0%) |
| 18 to 34 Years | 9 (28.1%) | 0 (0.0%) |
| 35 to 64 Years | 31 (20.8%) | 4 (2.1%) |
| 65 to 74 Years | 7 (11.7%) | 5 (8.3%) |
| 75 Years and over | 0 (0.0%) | 0 (0.0%) |
Disability Class: Vision Difficulty
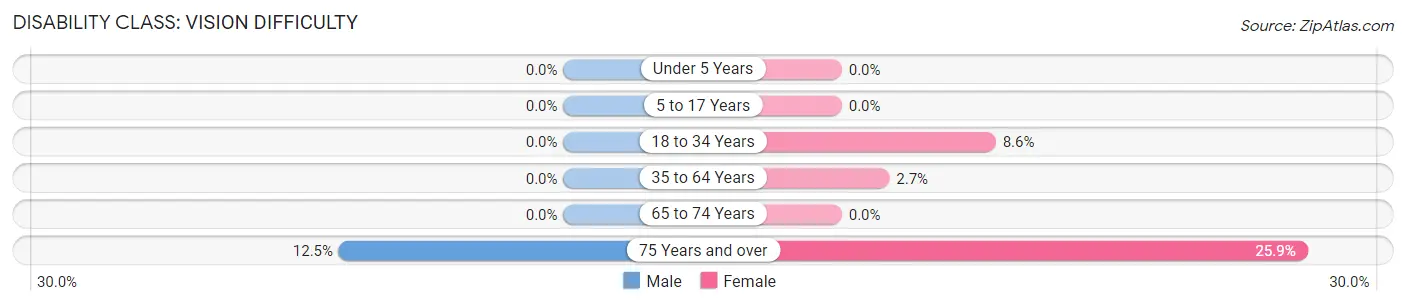
| Age Bracket | Male | Female |
| Under 5 Years | 0 (0.0%) | 0 (0.0%) |
| 5 to 17 Years | 0 (0.0%) | 0 (0.0%) |
| 18 to 34 Years | 0 (0.0%) | 6 (8.6%) |
| 35 to 64 Years | 0 (0.0%) | 5 (2.6%) |
| 65 to 74 Years | 0 (0.0%) | 0 (0.0%) |
| 75 Years and over | 2 (12.5%) | 7 (25.9%) |
Disability Class: Cognitive Difficulty
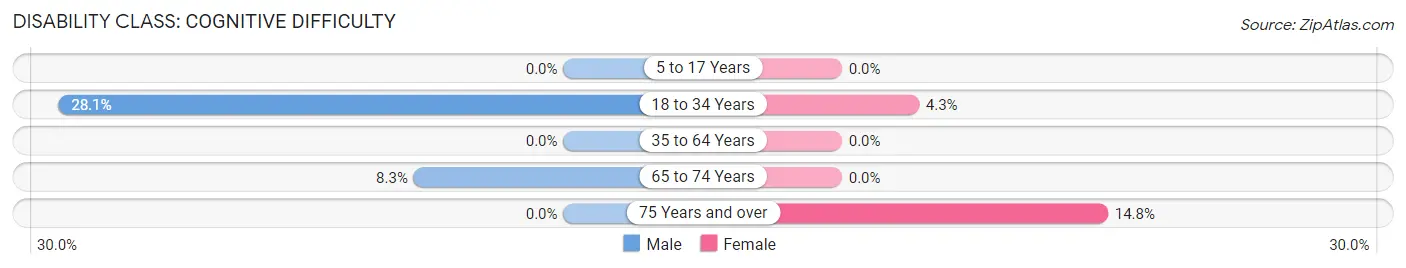
| Age Bracket | Male | Female |
| 5 to 17 Years | 0 (0.0%) | 0 (0.0%) |
| 18 to 34 Years | 9 (28.1%) | 3 (4.3%) |
| 35 to 64 Years | 0 (0.0%) | 0 (0.0%) |
| 65 to 74 Years | 5 (8.3%) | 0 (0.0%) |
| 75 Years and over | 0 (0.0%) | 4 (14.8%) |
Disability Class: Ambulatory Difficulty
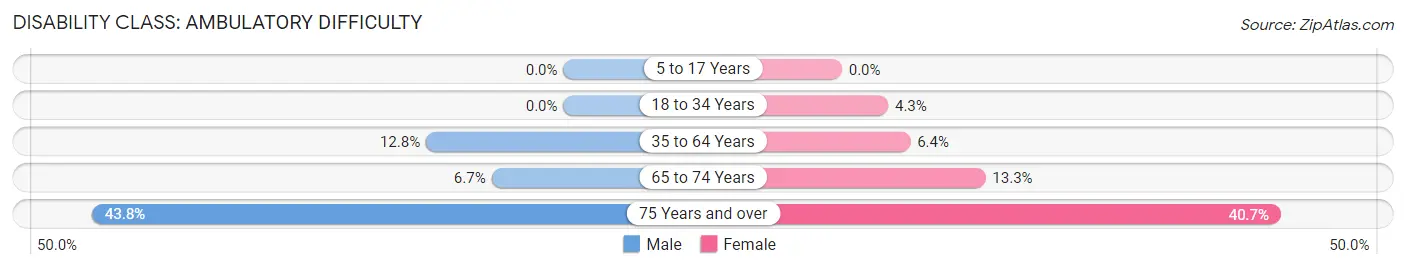
| Age Bracket | Male | Female |
| 5 to 17 Years | 0 (0.0%) | 0 (0.0%) |
| 18 to 34 Years | 0 (0.0%) | 3 (4.3%) |
| 35 to 64 Years | 19 (12.8%) | 12 (6.4%) |
| 65 to 74 Years | 4 (6.7%) | 8 (13.3%) |
| 75 Years and over | 7 (43.8%) | 11 (40.7%) |
Disability Class: Self-Care Difficulty
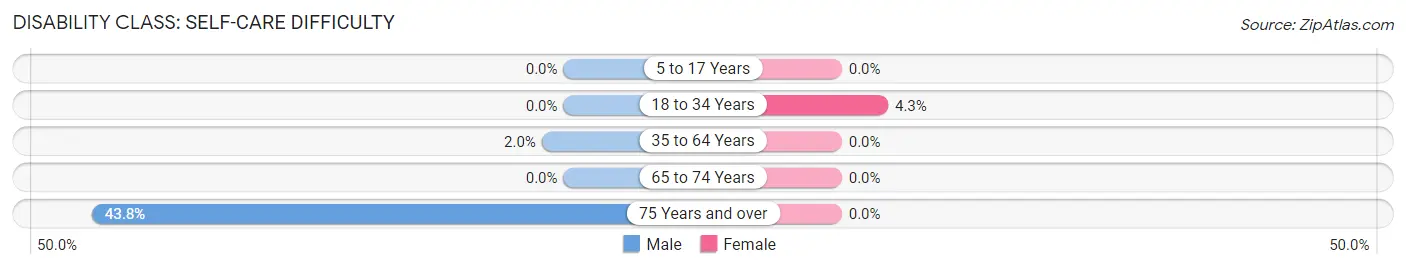
| Age Bracket | Male | Female |
| 5 to 17 Years | 0 (0.0%) | 0 (0.0%) |
| 18 to 34 Years | 0 (0.0%) | 3 (4.3%) |
| 35 to 64 Years | 3 (2.0%) | 0 (0.0%) |
| 65 to 74 Years | 0 (0.0%) | 0 (0.0%) |
| 75 Years and over | 7 (43.8%) | 0 (0.0%) |
Technology Access in Diamondville
Computing Device Access in Diamondville
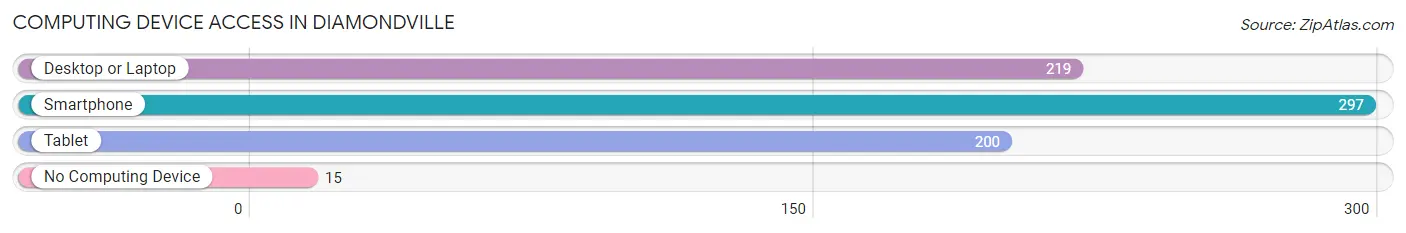
| Device Type | # Households | % Households |
| Desktop or Laptop | 219 | 68.9% |
| Smartphone | 297 | 93.4% |
| Tablet | 200 | 62.9% |
| No Computing Device | 15 | 4.7% |
| Total | 318 | 100.0% |
Internet Access in Diamondville
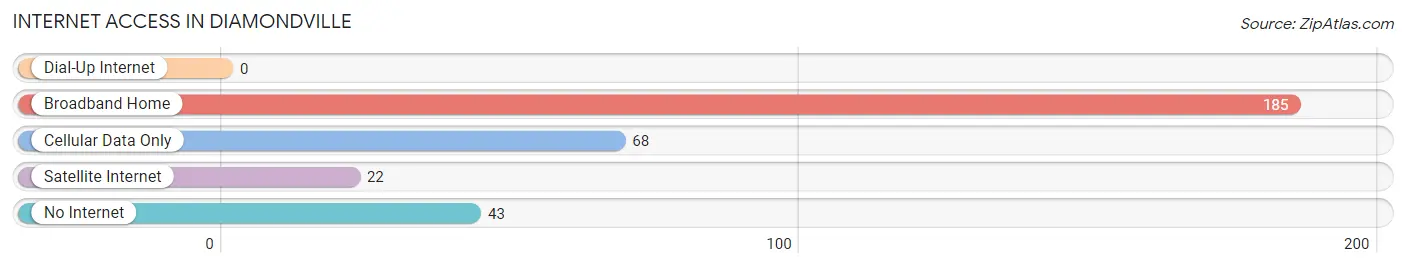
| Internet Type | # Households | % Households |
| Dial-Up Internet | 0 | 0.0% |
| Broadband Home | 185 | 58.2% |
| Cellular Data Only | 68 | 21.4% |
| Satellite Internet | 22 | 6.9% |
| No Internet | 43 | 13.5% |
| Total | 318 | 100.0% |
Diamondville Summary
History
Diamondville is a small town located in Lincoln County, Wyoming. It was founded in 1868 by a group of prospectors who were searching for coal. The town was named after the diamond-shaped coal deposits that were found in the area. The town quickly grew and by the early 1900s, it had become a major coal mining center. The coal industry was the main source of employment for the town and it was the largest employer in the area.
The town was also home to a number of other businesses, including a hotel, a general store, a bank, and a post office. The town was also home to a number of churches, including the First Baptist Church, the Methodist Episcopal Church, and the Catholic Church.
In the early 1900s, the town was home to a number of saloons and gambling halls. This led to a number of problems, including violence and crime. In response, the town passed a number of laws to try and curb the problem.
In the 1920s, the coal industry began to decline and the town began to suffer economically. This led to a number of businesses closing and the population began to decline. The town was able to survive, however, due to the fact that it was located on the main highway between Salt Lake City and Yellowstone National Park. This allowed the town to become a popular stop for tourists.
In the 1950s, the town began to experience a resurgence due to the discovery of oil and natural gas in the area. This led to a number of new businesses opening up and the population began to increase.
Today, Diamondville is a small town with a population of just over 500 people. The town is still home to a number of businesses, including a hotel, a general store, a bank, and a post office. The town is also home to a number of churches, including the First Baptist Church, the Methodist Episcopal Church, and the Catholic Church.
Geography
Diamondville is located in the southwestern part of Wyoming, in Lincoln County. The town is situated in the foothills of the Rocky Mountains, at an elevation of 6,000 feet. The town is located on the main highway between Salt Lake City and Yellowstone National Park.
The town is surrounded by a number of small towns and communities, including Cokeville, Kemmerer, and Opal. The town is also located near the Wyoming-Idaho border.
The climate in Diamondville is semi-arid, with hot summers and cold winters. The average temperature in the summer is around 80 degrees Fahrenheit, while the average temperature in the winter is around 20 degrees Fahrenheit.
Economy
The economy of Diamondville is largely based on tourism and agriculture. The town is located on the main highway between Salt Lake City and Yellowstone National Park, which makes it a popular stop for tourists. The town is also home to a number of small businesses, including a hotel, a general store, a bank, and a post office.
The town is also home to a number of agricultural businesses, including cattle ranches and farms. The town is also home to a number of oil and natural gas wells, which provide jobs for the local population.
Demographics
As of the 2010 census, the population of Diamondville was 514. The racial makeup of the town was 95.3% White, 0.4% African American, 0.4% Native American, 0.4% Asian, 0.2% Pacific Islander, and 3.3% from other races. The median household income in the town was $37,500. The per capita income in the town was $17,845.
Common Questions
What is Per Capita Income in Diamondville?
Per Capita income in Diamondville is $37,327.
What is the Median Family Income in Diamondville?
Median Family Income in Diamondville is $77,143.
What is the Median Household income in Diamondville?
Median Household Income in Diamondville is $64,167.
What is Income or Wage Gap in Diamondville?
Income or Wage Gap in Diamondville is 54.1%.
Women in Diamondville earn 45.9 cents for every dollar earned by a man.
What is Inequality or Gini Index in Diamondville?
Inequality or Gini Index in Diamondville is 0.37.
What is the Total Population of Diamondville?
Total Population of Diamondville is 700.
What is the Total Male Population of Diamondville?
Total Male Population of Diamondville is 300.
What is the Total Female Population of Diamondville?
Total Female Population of Diamondville is 400.
What is the Ratio of Males per 100 Females in Diamondville?
There are 75.00 Males per 100 Females in Diamondville.
What is the Ratio of Females per 100 Males in Diamondville?
There are 133.33 Females per 100 Males in Diamondville.
What is the Median Population Age in Diamondville?
Median Population Age in Diamondville is 51.3 Years.
What is the Average Family Size in Diamondville
Average Family Size in Diamondville is 3.0 People.
What is the Average Household Size in Diamondville
Average Household Size in Diamondville is 2.2 People.
How Large is the Labor Force in Diamondville?
There are 401 People in the Labor Forcein in Diamondville.
What is the Percentage of People in the Labor Force in Diamondville?
64.2% of People are in the Labor Force in Diamondville.
What is the Unemployment Rate in Diamondville?
Unemployment Rate in Diamondville is 1.5%.