Cowley, WY Map & Demographics
Cowley Map
Cowley Overview
$27,403
PER CAPITA INCOME
$74,911
AVG FAMILY INCOME
$73,214
AVG HOUSEHOLD INCOME
71.7%
WAGE / INCOME GAP [ % ]
28.3¢/ $1
WAGE / INCOME GAP [ $ ]
0.36
INEQUALITY / GINI INDEX
668
TOTAL POPULATION
289
MALE POPULATION
379
FEMALE POPULATION
76.25
MALES / 100 FEMALES
131.14
FEMALES / 100 MALES
31.0
MEDIAN AGE
3.8
AVG FAMILY SIZE
3.5
AVG HOUSEHOLD SIZE
282
LABOR FORCE [ PEOPLE ]
61.4%
PERCENT IN LABOR FORCE
3.2%
UNEMPLOYMENT RATE
Cowley Zip Codes
Cowley Area Codes
Income in Cowley
Income Overview in Cowley
Per Capita Income in Cowley is $27,403, while median incomes of families and households are $74,911 and $73,214 respectively.
| Characteristic | Number | Measure |
| Per Capita Income | 668 | $27,403 |
| Median Family Income | 165 | $74,911 |
| Mean Family Income | 165 | $92,329 |
| Median Household Income | 192 | $73,214 |
| Mean Household Income | 192 | $85,212 |
| Income Deficit | 165 | $0 |
| Wage / Income Gap (%) | 668 | 71.69% |
| Wage / Income Gap ($) | 668 | 28.31¢ per $1 |
| Gini / Inequality Index | 668 | 0.36 |
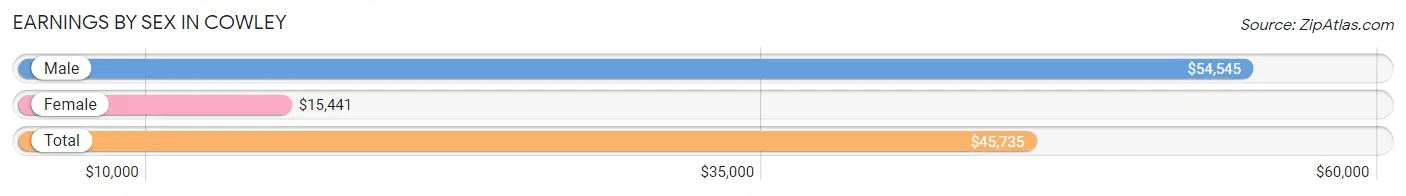
Earnings by Sex in Cowley
Average Earnings in Cowley are $45,735, $54,545 for men and $15,441 for women, a difference of 71.7%.
| Sex | Number | Average Earnings |
| Male | 170 (57.4%) | $54,545 |
| Female | 126 (42.6%) | $15,441 |
| Total | 296 (100.0%) | $45,735 |
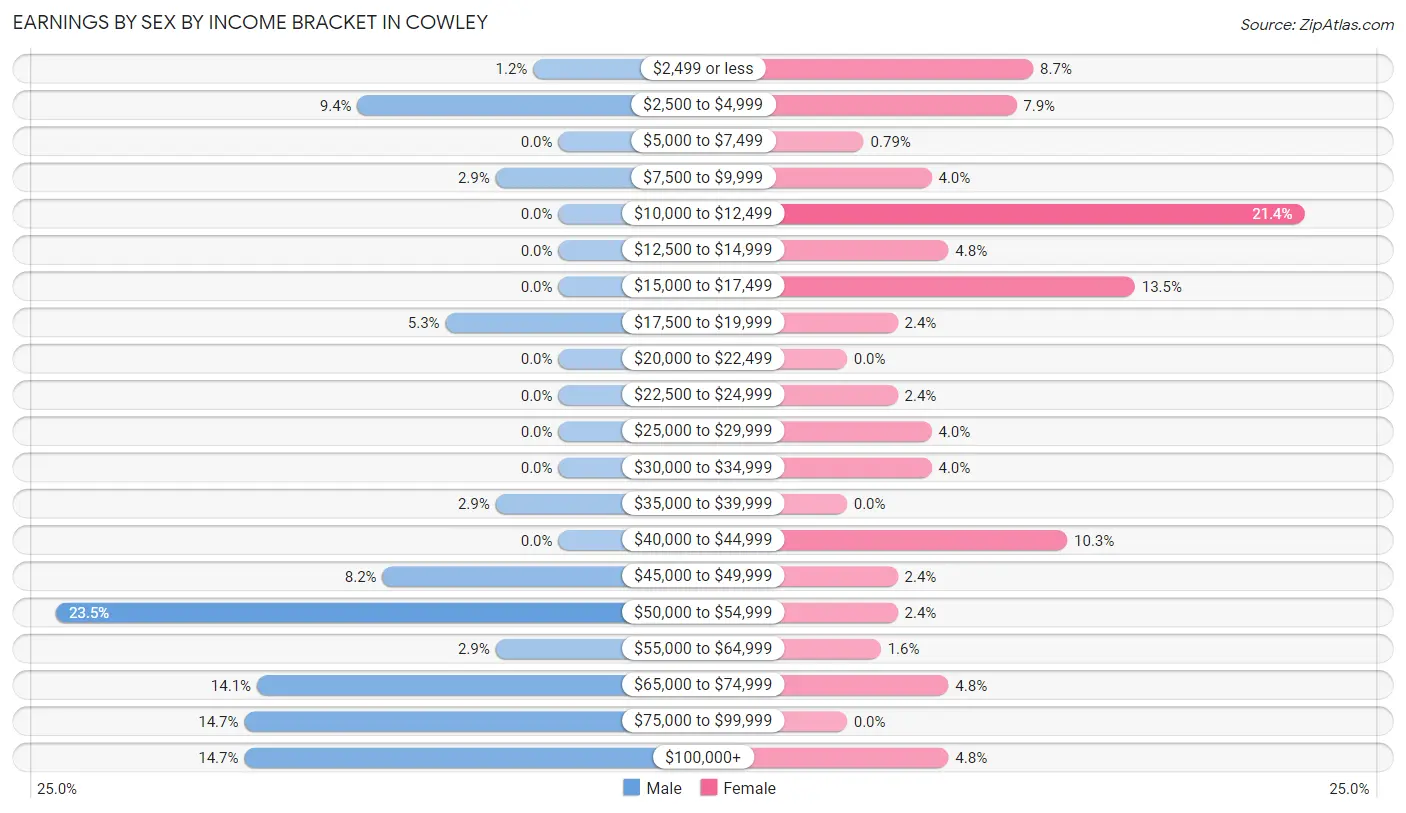
Earnings by Sex by Income Bracket in Cowley
The most common earnings brackets in Cowley are $50,000 to $54,999 for men (40 | 23.5%) and $10,000 to $12,499 for women (27 | 21.4%).
| Income | Male | Female |
| $2,499 or less | 2 (1.2%) | 11 (8.7%) |
| $2,500 to $4,999 | 16 (9.4%) | 10 (7.9%) |
| $5,000 to $7,499 | 0 (0.0%) | 1 (0.8%) |
| $7,500 to $9,999 | 5 (2.9%) | 5 (4.0%) |
| $10,000 to $12,499 | 0 (0.0%) | 27 (21.4%) |
| $12,500 to $14,999 | 0 (0.0%) | 6 (4.8%) |
| $15,000 to $17,499 | 0 (0.0%) | 17 (13.5%) |
| $17,500 to $19,999 | 9 (5.3%) | 3 (2.4%) |
| $20,000 to $22,499 | 0 (0.0%) | 0 (0.0%) |
| $22,500 to $24,999 | 0 (0.0%) | 3 (2.4%) |
| $25,000 to $29,999 | 0 (0.0%) | 5 (4.0%) |
| $30,000 to $34,999 | 0 (0.0%) | 5 (4.0%) |
| $35,000 to $39,999 | 5 (2.9%) | 0 (0.0%) |
| $40,000 to $44,999 | 0 (0.0%) | 13 (10.3%) |
| $45,000 to $49,999 | 14 (8.2%) | 3 (2.4%) |
| $50,000 to $54,999 | 40 (23.5%) | 3 (2.4%) |
| $55,000 to $64,999 | 5 (2.9%) | 2 (1.6%) |
| $65,000 to $74,999 | 24 (14.1%) | 6 (4.8%) |
| $75,000 to $99,999 | 25 (14.7%) | 0 (0.0%) |
| $100,000+ | 25 (14.7%) | 6 (4.8%) |
| Total | 170 (100.0%) | 126 (100.0%) |
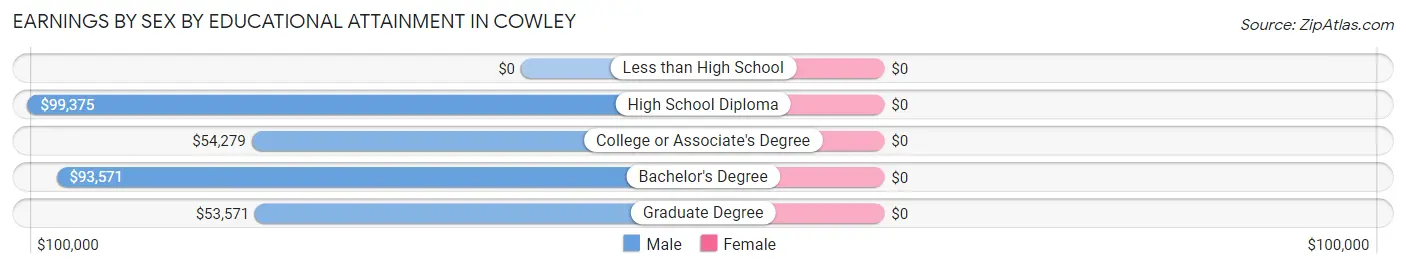
Earnings by Sex by Educational Attainment in Cowley
| Educational Attainment | Male Income | Female Income |
| Less than High School | - | - |
| High School Diploma | $99,375 | $0 |
| College or Associate's Degree | $54,279 | $0 |
| Bachelor's Degree | $93,571 | $0 |
| Graduate Degree | $53,571 | $0 |
| Total | $65,441 | $15,662 |
Family Income in Cowley
Family Income Brackets in Cowley
According to the Cowley family income data, there are 66 families falling into the $50,000 to $74,999 income range, which is the most common income bracket and makes up 40.0% of all families.
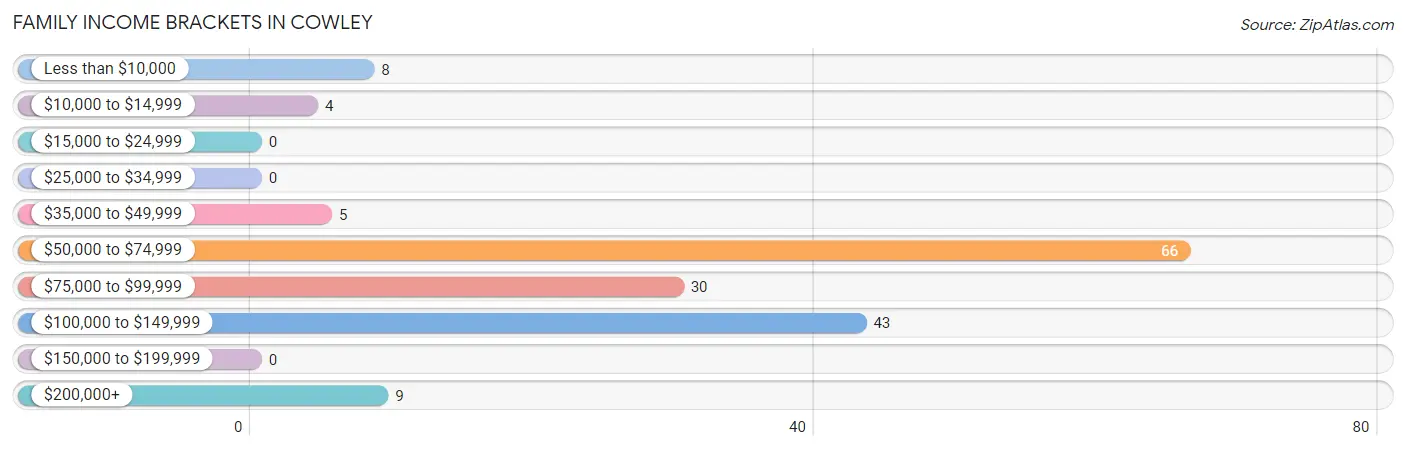
| Income Bracket | # Families | % Families |
| Less than $10,000 | 8 | 4.8% |
| $10,000 to $14,999 | 4 | 2.4% |
| $15,000 to $24,999 | 0 | 0.0% |
| $25,000 to $34,999 | 0 | 0.0% |
| $35,000 to $49,999 | 5 | 3.0% |
| $50,000 to $74,999 | 66 | 40.0% |
| $75,000 to $99,999 | 30 | 18.2% |
| $100,000 to $149,999 | 43 | 26.1% |
| $150,000 to $199,999 | 0 | 0.0% |
| $200,000+ | 9 | 5.5% |
Family Income by Famaliy Size in Cowley
5-person families (14 | 8.5%) account for the highest median family income in Cowley with $101,250 per family, while 2-person families (83 | 50.3%) have the highest median income of $38,606 per family member.
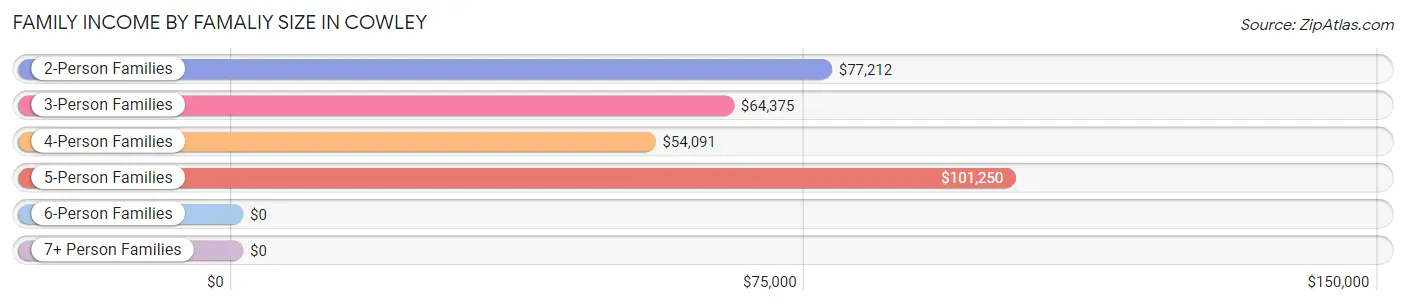
| Income Bracket | # Families | Median Income |
| 2-Person Families | 83 (50.3%) | $77,212 |
| 3-Person Families | 17 (10.3%) | $64,375 |
| 4-Person Families | 42 (25.5%) | $54,091 |
| 5-Person Families | 14 (8.5%) | $101,250 |
| 6-Person Families | 0 (0.0%) | $0 |
| 7+ Person Families | 9 (5.4%) | $0 |
| Total | 165 (100.0%) | $74,911 |
Family Income by Number of Earners in Cowley
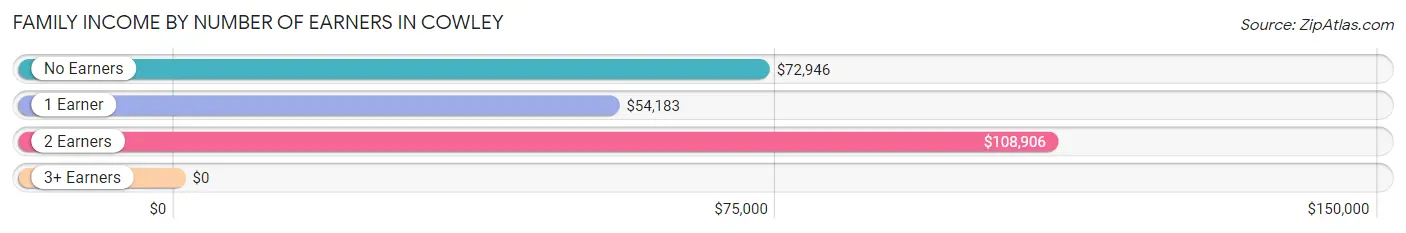
| Number of Earners | # Families | Median Income |
| No Earners | 23 (13.9%) | $72,946 |
| 1 Earner | 57 (34.5%) | $54,183 |
| 2 Earners | 83 (50.3%) | $108,906 |
| 3+ Earners | 2 (1.2%) | $0 |
| Total | 165 (100.0%) | $74,911 |
Household Income in Cowley
Household Income Brackets in Cowley
With 70 households falling in the category, the $50,000 to $74,999 income range is the most frequent in Cowley, accounting for 36.5% of all households.
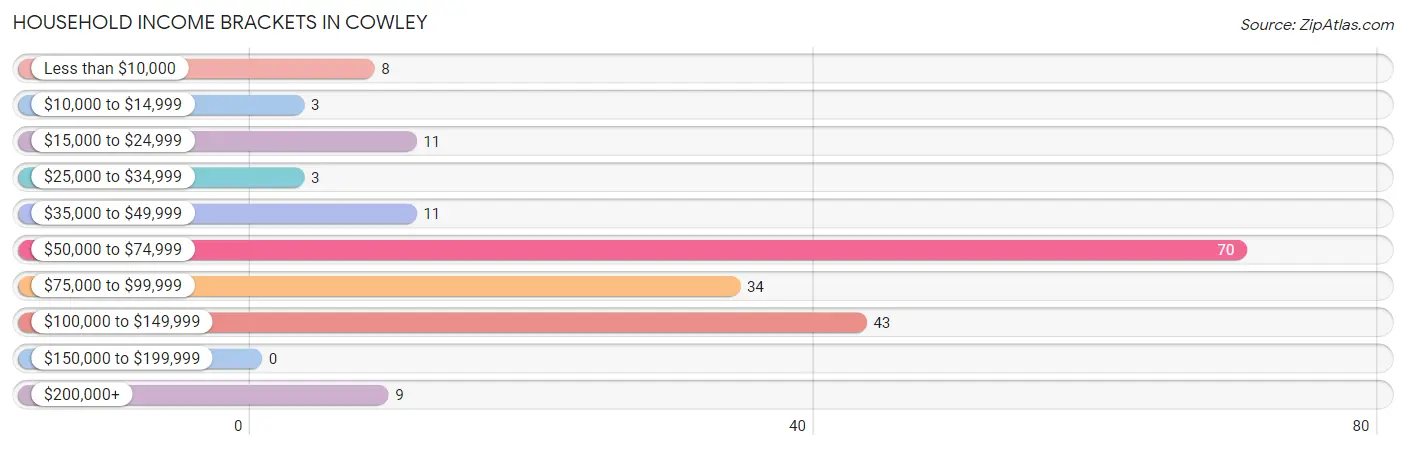
| Income Bracket | # Households | % Households |
| Less than $10,000 | 8 | 4.2% |
| $10,000 to $14,999 | 3 | 1.6% |
| $15,000 to $24,999 | 11 | 5.7% |
| $25,000 to $34,999 | 3 | 1.6% |
| $35,000 to $49,999 | 11 | 5.7% |
| $50,000 to $74,999 | 70 | 36.5% |
| $75,000 to $99,999 | 34 | 17.7% |
| $100,000 to $149,999 | 43 | 22.4% |
| $150,000 to $199,999 | 0 | 0.0% |
| $200,000+ | 9 | 4.7% |
Household Income by Householder Age in Cowley
The median household income in Cowley is $73,214, with the highest median household income of $85,833 found in the 45 to 64 years age bracket for the primary householder. A total of 48 households (25.0%) fall into this category. Meanwhile, the 15 to 24 years age bracket for the primary householder has the lowest median household income of $0, with 5 households (2.6%) in this group.
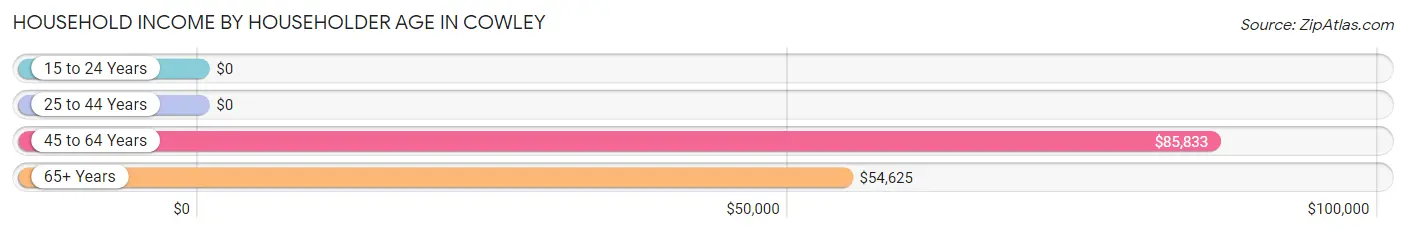
| Income Bracket | # Households | Median Income |
| 15 to 24 Years | 5 (2.6%) | $0 |
| 25 to 44 Years | 78 (40.6%) | $0 |
| 45 to 64 Years | 48 (25.0%) | $85,833 |
| 65+ Years | 61 (31.8%) | $54,625 |
| Total | 192 (100.0%) | $73,214 |
Poverty in Cowley
Income Below Poverty by Sex and Age in Cowley
With 3.9% poverty level for males and 25.3% for females among the residents of Cowley, 35 to 44 year old males and 35 to 44 year old females are the most vulnerable to poverty, with 9 males (28.1%) and 21 females (65.6%) in their respective age groups living below the poverty level.
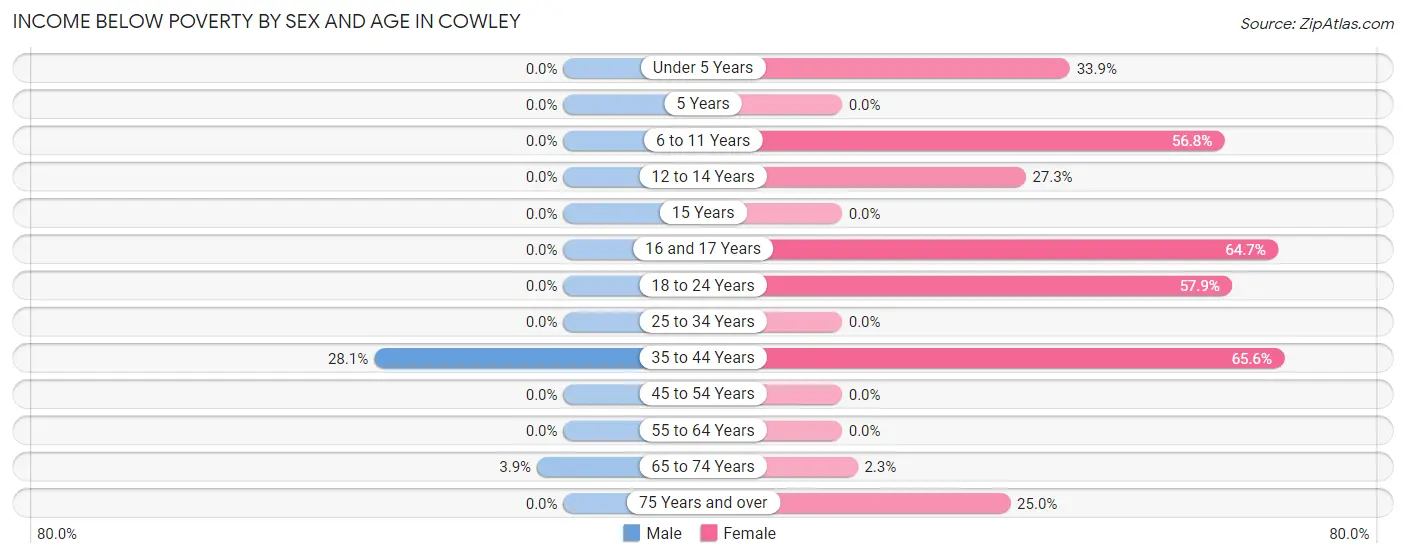
| Age Bracket | Male | Female |
| Under 5 Years | 0 (0.0%) | 22 (33.9%) |
| 5 Years | 0 (0.0%) | 0 (0.0%) |
| 6 to 11 Years | 0 (0.0%) | 21 (56.8%) |
| 12 to 14 Years | 0 (0.0%) | 6 (27.3%) |
| 15 Years | 0 (0.0%) | 0 (0.0%) |
| 16 and 17 Years | 0 (0.0%) | 11 (64.7%) |
| 18 to 24 Years | 0 (0.0%) | 11 (57.9%) |
| 25 to 34 Years | 0 (0.0%) | 0 (0.0%) |
| 35 to 44 Years | 9 (28.1%) | 21 (65.6%) |
| 45 to 54 Years | 0 (0.0%) | 0 (0.0%) |
| 55 to 64 Years | 0 (0.0%) | 0 (0.0%) |
| 65 to 74 Years | 2 (3.9%) | 1 (2.3%) |
| 75 Years and over | 0 (0.0%) | 3 (25.0%) |
| Total | 11 (3.9%) | 96 (25.3%) |
Income Above Poverty by Sex and Age in Cowley
According to the poverty statistics in Cowley, males aged under 5 years and females aged 15 years are the age groups that are most secure financially, with 100.0% of males and 100.0% of females in these age groups living above the poverty line.
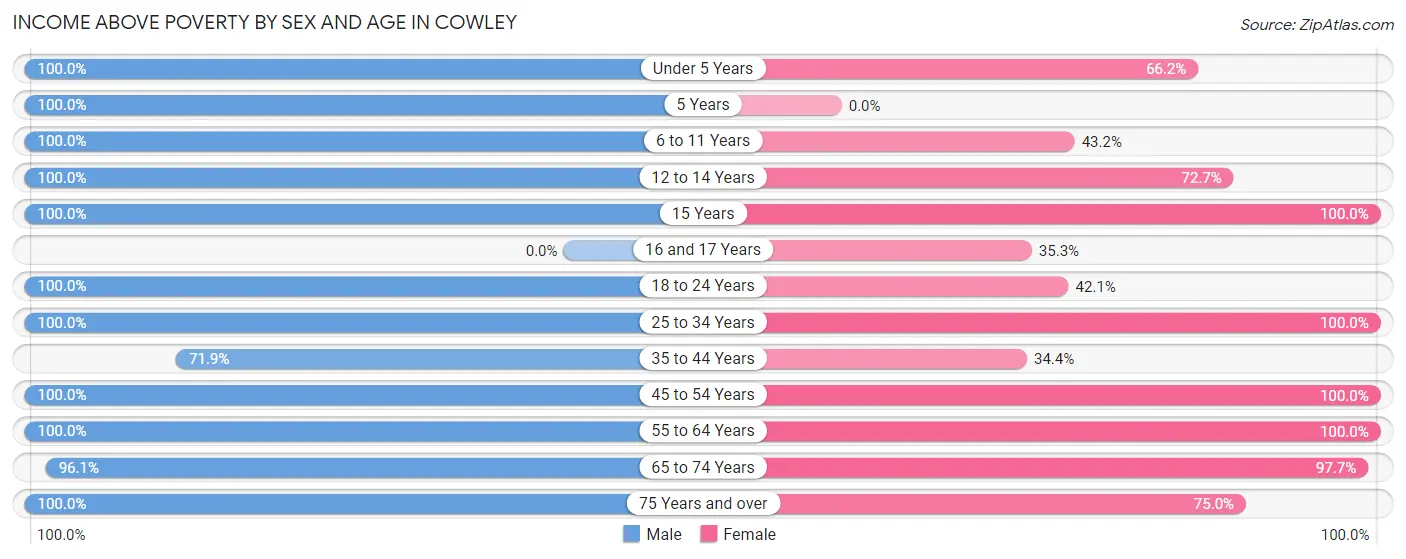
| Age Bracket | Male | Female |
| Under 5 Years | 5 (100.0%) | 43 (66.1%) |
| 5 Years | 44 (100.0%) | 0 (0.0%) |
| 6 to 11 Years | 9 (100.0%) | 16 (43.2%) |
| 12 to 14 Years | 8 (100.0%) | 16 (72.7%) |
| 15 Years | 2 (100.0%) | 12 (100.0%) |
| 16 and 17 Years | 0 (0.0%) | 6 (35.3%) |
| 18 to 24 Years | 28 (100.0%) | 8 (42.1%) |
| 25 to 34 Years | 50 (100.0%) | 73 (100.0%) |
| 35 to 44 Years | 23 (71.9%) | 11 (34.4%) |
| 45 to 54 Years | 24 (100.0%) | 12 (100.0%) |
| 55 to 64 Years | 26 (100.0%) | 35 (100.0%) |
| 65 to 74 Years | 49 (96.1%) | 42 (97.7%) |
| 75 Years and over | 5 (100.0%) | 9 (75.0%) |
| Total | 273 (96.1%) | 283 (74.7%) |
Income Below Poverty Among Married-Couple Families in Cowley
The poverty statistics for married-couple families in Cowley show that 5.1% or 8 of the total 158 families live below the poverty line. Families with 5 or more children have the highest poverty rate of 77.8%, comprising of 7 families. On the other hand, families with 1 or 2 children have the lowest poverty rate of 0.0%, which includes 0 families.
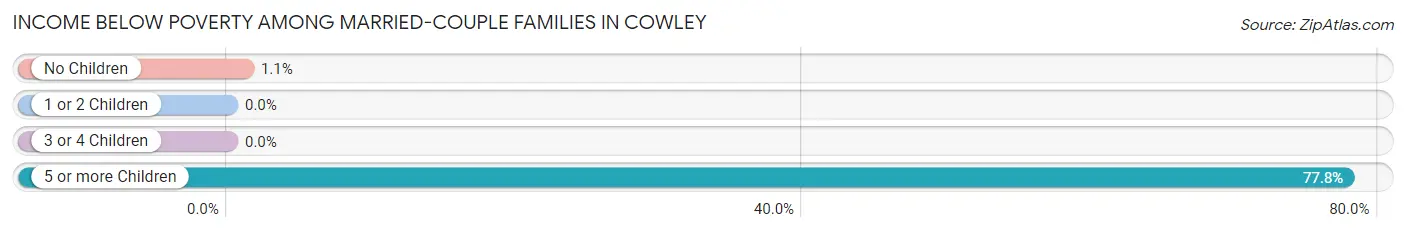
| Children | Above Poverty | Below Poverty |
| No Children | 89 (98.9%) | 1 (1.1%) |
| 1 or 2 Children | 45 (100.0%) | 0 (0.0%) |
| 3 or 4 Children | 14 (100.0%) | 0 (0.0%) |
| 5 or more Children | 2 (22.2%) | 7 (77.8%) |
| Total | 150 (94.9%) | 8 (5.1%) |
Income Below Poverty Among Single-Parent Households in Cowley
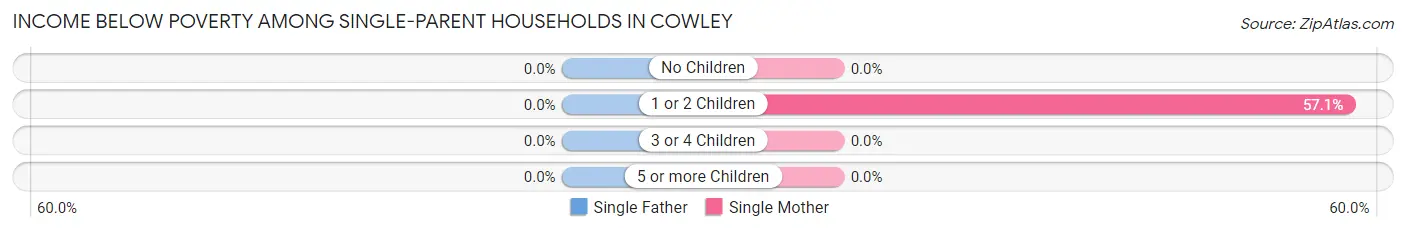
| Children | Single Father | Single Mother |
| No Children | 0 (0.0%) | 0 (0.0%) |
| 1 or 2 Children | 0 (0.0%) | 4 (57.1%) |
| 3 or 4 Children | 0 (0.0%) | 0 (0.0%) |
| 5 or more Children | 0 (0.0%) | 0 (0.0%) |
| Total | 0 (0.0%) | 4 (57.1%) |
Income Below Poverty Among Married-Couple vs Single-Parent Households in Cowley
The poverty data for Cowley shows that 8 of the married-couple family households (5.1%) and 4 of the single-parent households (57.1%) are living below the poverty level. Within the married-couple family households, those with 5 or more children have the highest poverty rate, with 7 households (77.8%) falling below the poverty line. Among the single-parent households, those with 1 or 2 children have the highest poverty rate, with 4 household (57.1%) living below poverty.
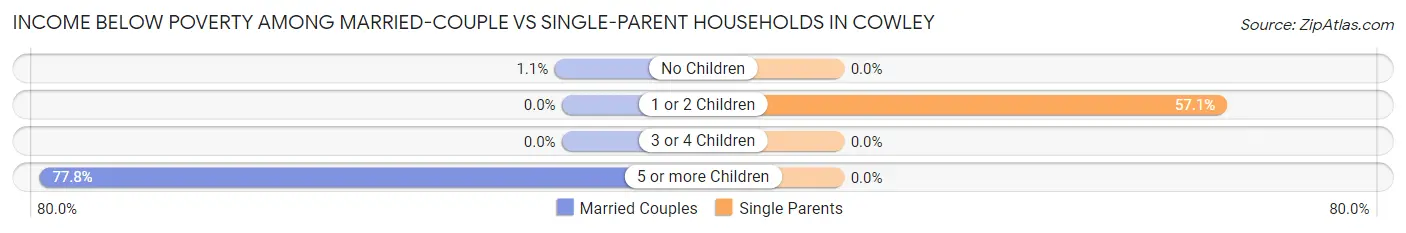
| Children | Married-Couple Families | Single-Parent Households |
| No Children | 1 (1.1%) | 0 (0.0%) |
| 1 or 2 Children | 0 (0.0%) | 4 (57.1%) |
| 3 or 4 Children | 0 (0.0%) | 0 (0.0%) |
| 5 or more Children | 7 (77.8%) | 0 (0.0%) |
| Total | 8 (5.1%) | 4 (57.1%) |
Race in Cowley
The most populous races in Cowley are White / Caucasian (557 | 83.4%), Black / African American (38 | 5.7%), and Two or more Races (36 | 5.4%).
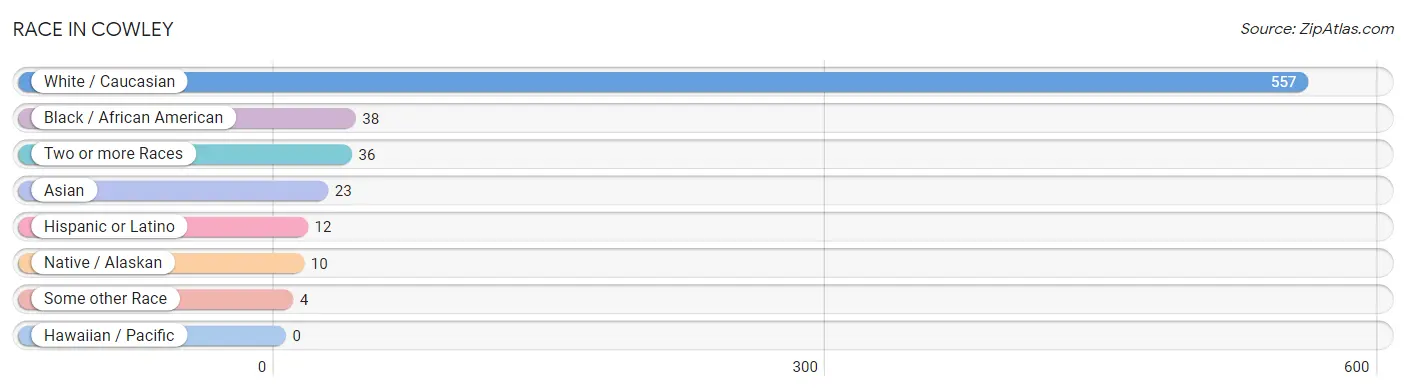
| Race | # Population | % Population |
| Asian | 23 | 3.4% |
| Black / African American | 38 | 5.7% |
| Hawaiian / Pacific | 0 | 0.0% |
| Hispanic or Latino | 12 | 1.8% |
| Native / Alaskan | 10 | 1.5% |
| White / Caucasian | 557 | 83.4% |
| Two or more Races | 36 | 5.4% |
| Some other Race | 4 | 0.6% |
| Total | 668 | 100.0% |
Ancestry in Cowley
The most populous ancestries reported in Cowley are German (194 | 29.0%), English (132 | 19.8%), French (59 | 8.8%), Irish (55 | 8.2%), and Scottish (51 | 7.6%), together accounting for 73.5% of all Cowley residents.
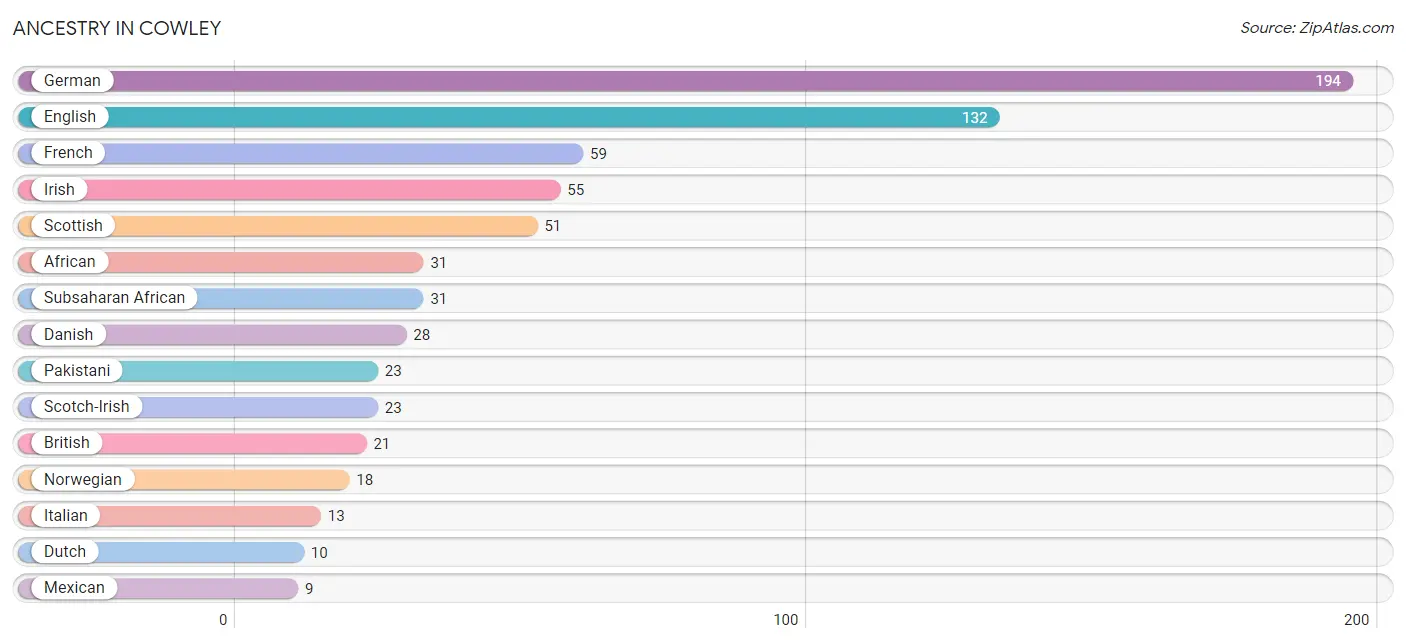
| Ancestry | # Population | % Population |
| African | 31 | 4.6% |
| Argentinean | 3 | 0.4% |
| British | 21 | 3.1% |
| Cheyenne | 5 | 0.7% |
| Danish | 28 | 4.2% |
| Dutch | 10 | 1.5% |
| English | 132 | 19.8% |
| French | 59 | 8.8% |
| German | 194 | 29.0% |
| Inupiat | 1 | 0.2% |
| Irish | 55 | 8.2% |
| Italian | 13 | 1.9% |
| Mexican | 9 | 1.3% |
| Norwegian | 18 | 2.7% |
| Pakistani | 23 | 3.4% |
| Polish | 6 | 0.9% |
| Pueblo | 4 | 0.6% |
| Russian | 1 | 0.2% |
| Scotch-Irish | 23 | 3.4% |
| Scottish | 51 | 7.6% |
| South American | 3 | 0.4% |
| Subsaharan African | 31 | 4.6% |
| Welsh | 7 | 1.1% | View All 23 Rows |
Immigrants in Cowley
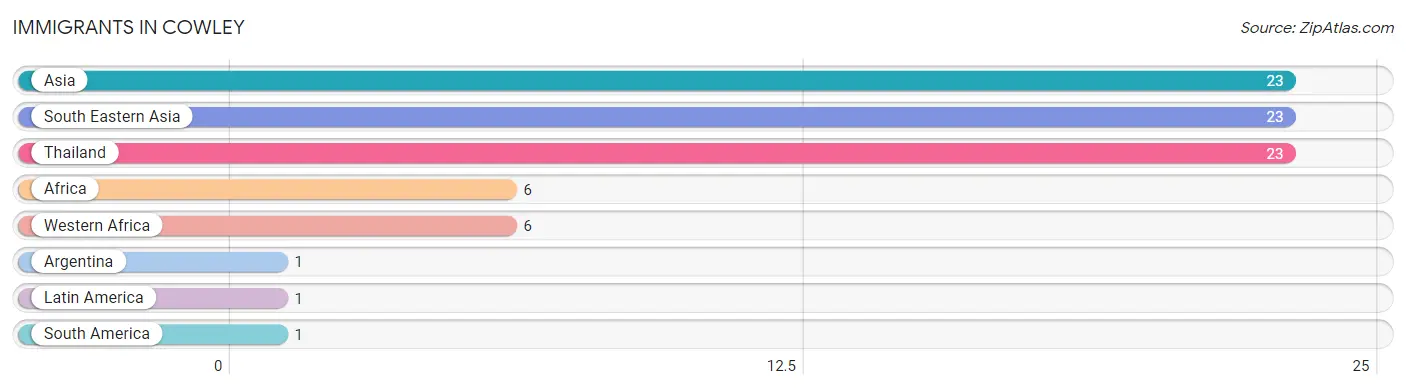
The most numerous immigrant groups reported in Cowley came from Asia (23 | 3.4%), South Eastern Asia (23 | 3.4%), Thailand (23 | 3.4%), Africa (6 | 0.9%), and Western Africa (6 | 0.9%), together accounting for 12.1% of all Cowley residents.
| Immigration Origin | # Population | % Population |
| Africa | 6 | 0.9% |
| Argentina | 1 | 0.2% |
| Asia | 23 | 3.4% |
| Latin America | 1 | 0.2% |
| South America | 1 | 0.2% |
| South Eastern Asia | 23 | 3.4% |
| Thailand | 23 | 3.4% |
| Western Africa | 6 | 0.9% | View All 8 Rows |
Sex and Age in Cowley
Sex and Age in Cowley
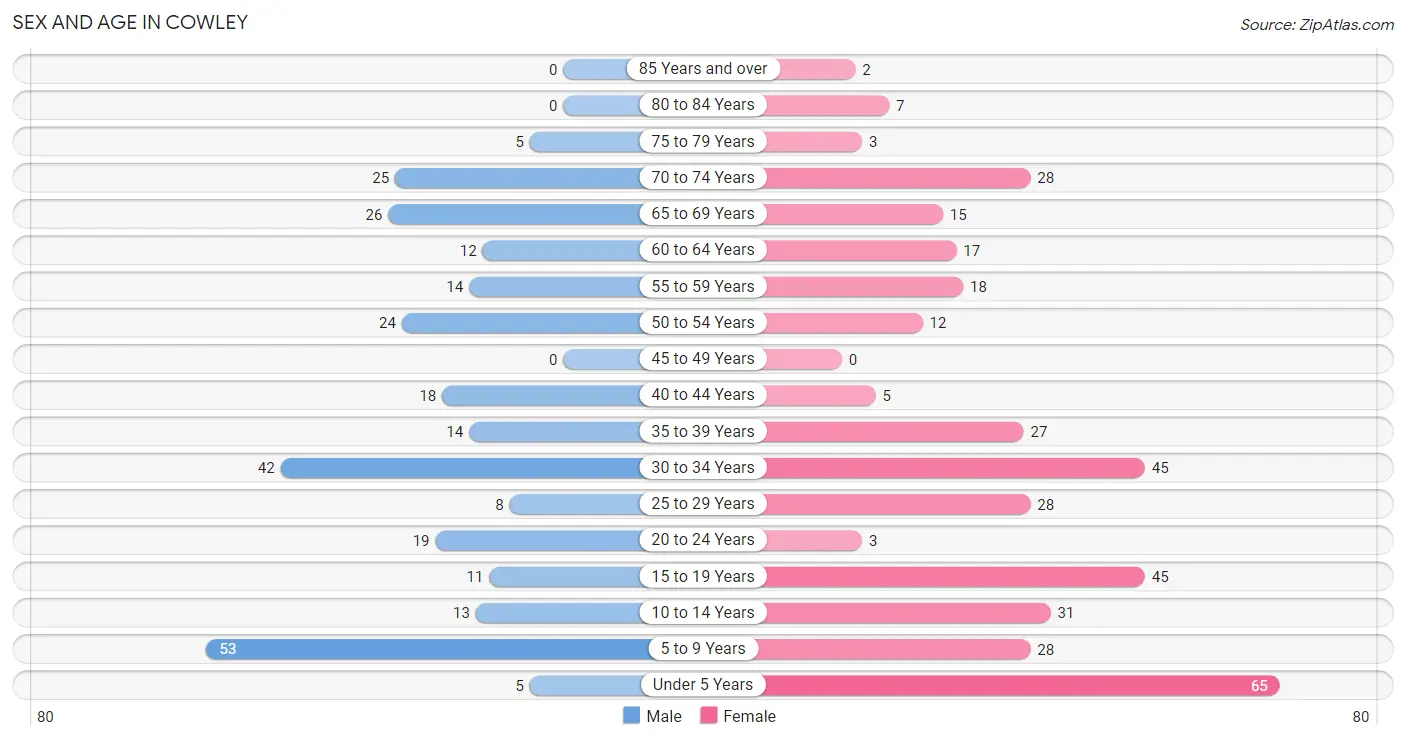
The most populous age groups in Cowley are 5 to 9 Years (53 | 18.3%) for men and Under 5 Years (65 | 17.2%) for women.
| Age Bracket | Male | Female |
| Under 5 Years | 5 (1.7%) | 65 (17.2%) |
| 5 to 9 Years | 53 (18.3%) | 28 (7.4%) |
| 10 to 14 Years | 13 (4.5%) | 31 (8.2%) |
| 15 to 19 Years | 11 (3.8%) | 45 (11.9%) |
| 20 to 24 Years | 19 (6.6%) | 3 (0.8%) |
| 25 to 29 Years | 8 (2.8%) | 28 (7.4%) |
| 30 to 34 Years | 42 (14.5%) | 45 (11.9%) |
| 35 to 39 Years | 14 (4.8%) | 27 (7.1%) |
| 40 to 44 Years | 18 (6.2%) | 5 (1.3%) |
| 45 to 49 Years | 0 (0.0%) | 0 (0.0%) |
| 50 to 54 Years | 24 (8.3%) | 12 (3.2%) |
| 55 to 59 Years | 14 (4.8%) | 18 (4.8%) |
| 60 to 64 Years | 12 (4.2%) | 17 (4.5%) |
| 65 to 69 Years | 26 (9.0%) | 15 (4.0%) |
| 70 to 74 Years | 25 (8.6%) | 28 (7.4%) |
| 75 to 79 Years | 5 (1.7%) | 3 (0.8%) |
| 80 to 84 Years | 0 (0.0%) | 7 (1.8%) |
| 85 Years and over | 0 (0.0%) | 2 (0.5%) |
| Total | 289 (100.0%) | 379 (100.0%) |
Families and Households in Cowley
Median Family Size in Cowley
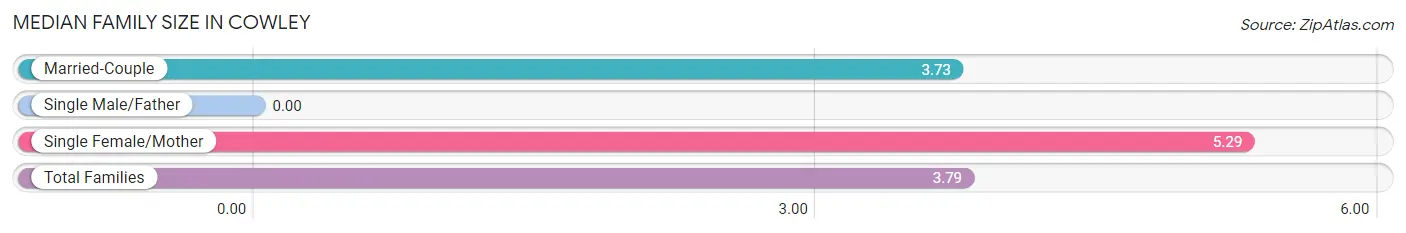
| Family Type | # Families | Family Size |
| Married-Couple | 158 (95.8%) | 3.73 |
| Single Male/Father | 0 (0.0%) | - |
| Single Female/Mother | 7 (4.2%) | 5.29 |
| Total Families | 165 (100.0%) | 3.79 |
Median Household Size in Cowley
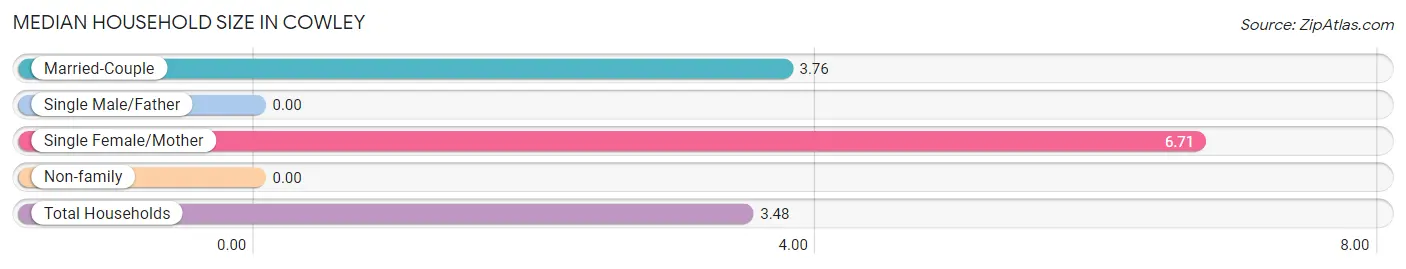
| Household Type | # Households | Household Size |
| Married-Couple | 158 (82.3%) | 3.76 |
| Single Male/Father | 0 (0.0%) | - |
| Single Female/Mother | 7 (3.6%) | 6.71 |
| Non-family | 27 (14.1%) | - |
| Total Households | 192 (100.0%) | 3.48 |
Household Size by Marriage Status in Cowley
Out of a total of 192 households in Cowley, 165 (85.9%) are family households, while 27 (14.1%) are nonfamily households. The most numerous type of family households are 2-person households, comprising 79, and the most common type of nonfamily households are 1-person households, comprising 27.
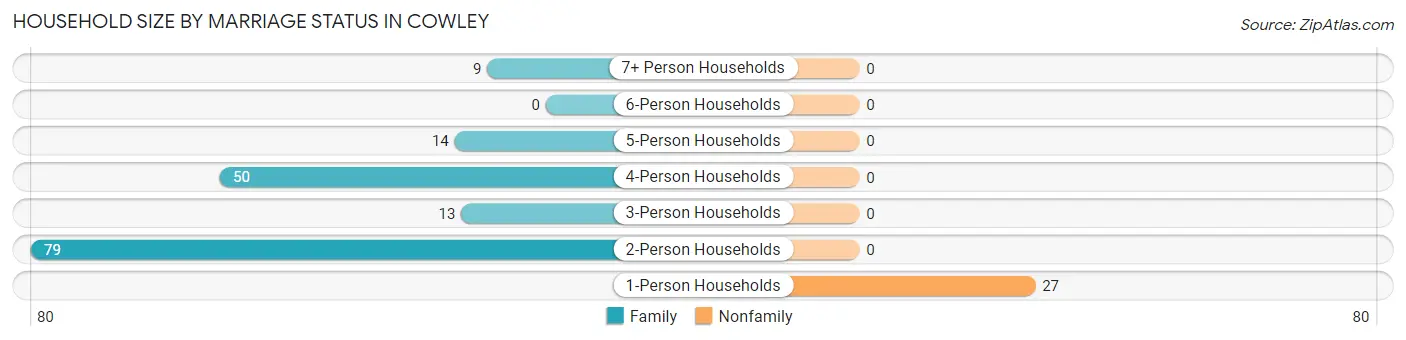
| Household Size | Family Households | Nonfamily Households |
| 1-Person Households | - | 27 (14.1%) |
| 2-Person Households | 79 (41.1%) | 0 (0.0%) |
| 3-Person Households | 13 (6.8%) | 0 (0.0%) |
| 4-Person Households | 50 (26.0%) | 0 (0.0%) |
| 5-Person Households | 14 (7.3%) | 0 (0.0%) |
| 6-Person Households | 0 (0.0%) | 0 (0.0%) |
| 7+ Person Households | 9 (4.7%) | 0 (0.0%) |
| Total | 165 (85.9%) | 27 (14.1%) |
Female Fertility in Cowley
Fertility by Age in Cowley
Average fertility rate in Cowley is 31.0 births per 1,000 women. Women in the age bracket of 20 to 34 years have the highest fertility rate with 66.0 births per 1,000 women. Women in the age bracket of 20 to 34 years acount for 100.0% of all women with births.
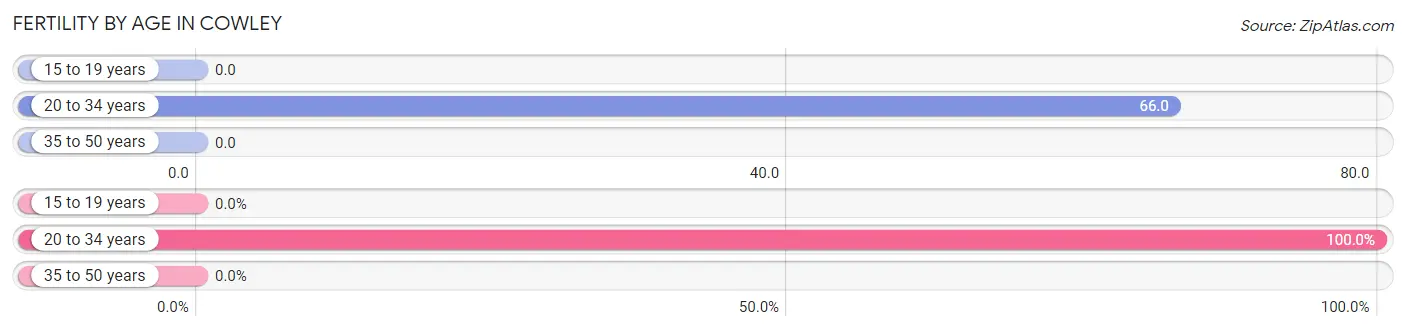
| Age Bracket | Women with Births | Births / 1,000 Women |
| 15 to 19 years | 0 (0.0%) | 0.0 |
| 20 to 34 years | 5 (100.0%) | 66.0 |
| 35 to 50 years | 0 (0.0%) | 0.0 |
| Total | 5 (100.0%) | 31.0 |
Fertility by Age by Marriage Status in Cowley
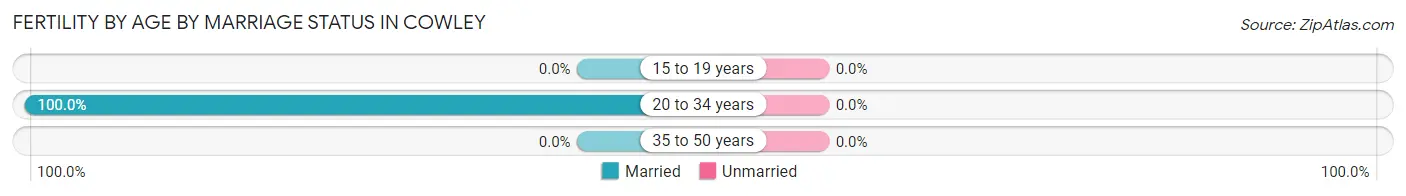
| Age Bracket | Married | Unmarried |
| 15 to 19 years | 0 (0.0%) | 0 (0.0%) |
| 20 to 34 years | 5 (100.0%) | 0 (0.0%) |
| 35 to 50 years | 0 (0.0%) | 0 (0.0%) |
| Total | 5 (100.0%) | 0 (0.0%) |
Fertility by Education in Cowley
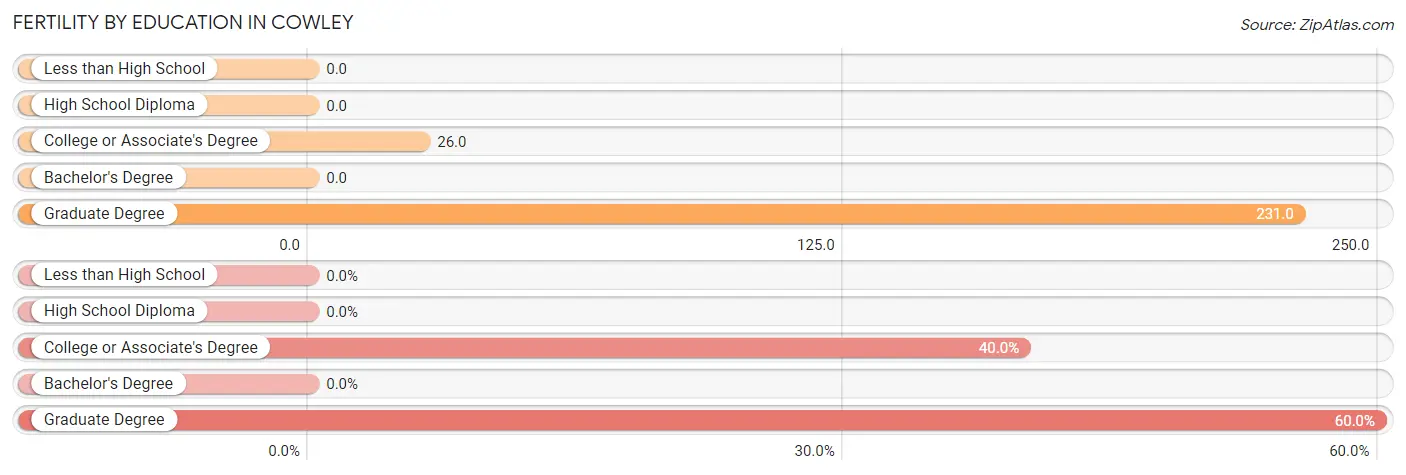
| Educational Attainment | Women with Births | Births / 1,000 Women |
| Less than High School | 0 (0.0%) | 0.0 |
| High School Diploma | 0 (0.0%) | 0.0 |
| College or Associate's Degree | 2 (40.0%) | 26.0 |
| Bachelor's Degree | 0 (0.0%) | 0.0 |
| Graduate Degree | 3 (60.0%) | 231.0 |
| Total | 5 (100.0%) | 31.0 |
Fertility by Education by Marriage Status in Cowley
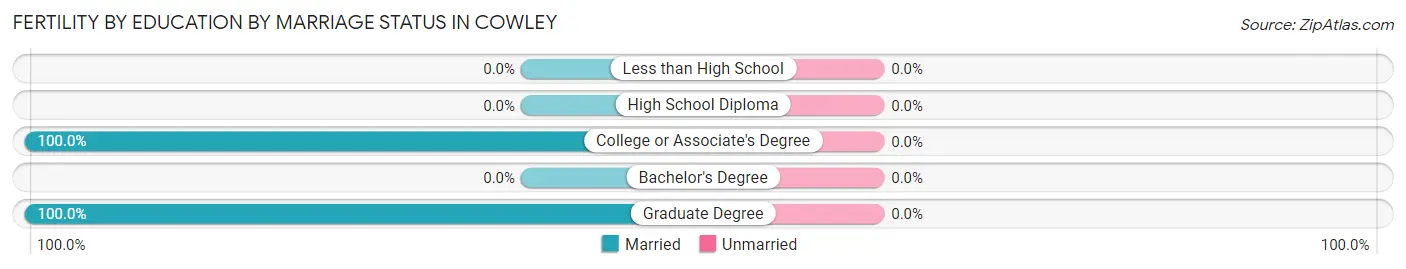
| Educational Attainment | Married | Unmarried |
| Less than High School | 0 (0.0%) | 0 (0.0%) |
| High School Diploma | 0 (0.0%) | 0 (0.0%) |
| College or Associate's Degree | 2 (100.0%) | 0 (0.0%) |
| Bachelor's Degree | 0 (0.0%) | 0 (0.0%) |
| Graduate Degree | 3 (100.0%) | 0 (0.0%) |
| Total | 5 (100.0%) | 0 (0.0%) |
Employment Characteristics in Cowley
Employment by Class of Employer in Cowley
Among the 263 employed individuals in Cowley, private company employees (175 | 66.5%), local government employees (36 | 13.7%), and self-employed (not incorporated) (23 | 8.7%) make up the most common classes of employment.
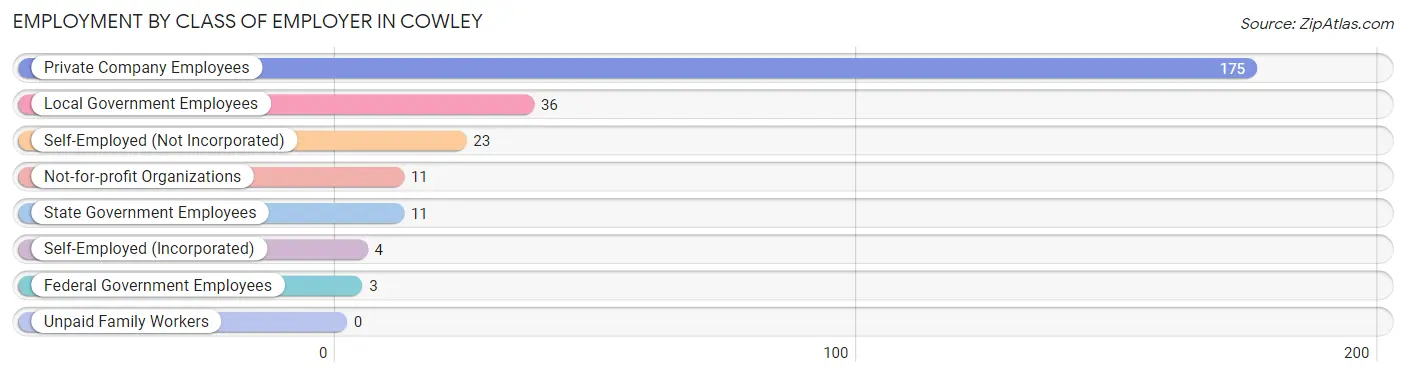
| Employer Class | # Employees | % Employees |
| Private Company Employees | 175 | 66.5% |
| Self-Employed (Incorporated) | 4 | 1.5% |
| Self-Employed (Not Incorporated) | 23 | 8.7% |
| Not-for-profit Organizations | 11 | 4.2% |
| Local Government Employees | 36 | 13.7% |
| State Government Employees | 11 | 4.2% |
| Federal Government Employees | 3 | 1.1% |
| Unpaid Family Workers | 0 | 0.0% |
| Total | 263 | 100.0% |
Employment Status by Age in Cowley
According to the labor force statistics for Cowley, out of the total population over 16 years of age (459), 61.4% or 282 individuals are in the labor force, with 3.2% or 9 of them unemployed. The age group with the highest labor force participation rate is 20 to 24 years, with 100.0% or 22 individuals in the labor force. Within the labor force, the 35 to 44 years age range has the highest percentage of unemployed individuals, with 16.4% or 9 of them being unemployed.
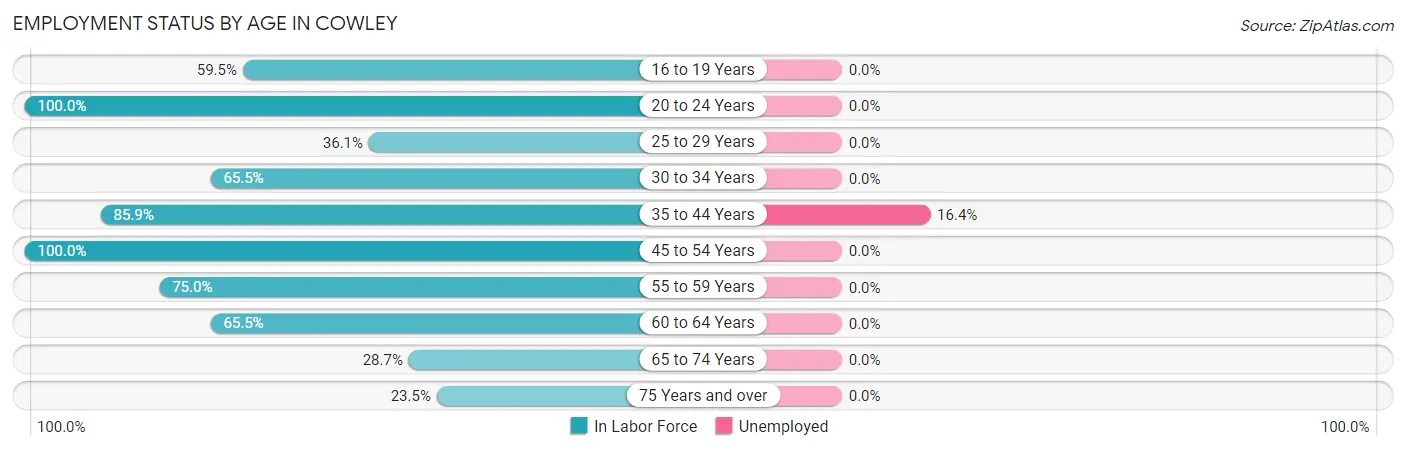
| Age Bracket | In Labor Force | Unemployed |
| 16 to 19 Years | 25 (59.5%) | 0 (0.0%) |
| 20 to 24 Years | 22 (100.0%) | 0 (0.0%) |
| 25 to 29 Years | 13 (36.1%) | 0 (0.0%) |
| 30 to 34 Years | 57 (65.5%) | 0 (0.0%) |
| 35 to 44 Years | 55 (85.9%) | 9 (16.4%) |
| 45 to 54 Years | 36 (100.0%) | 0 (0.0%) |
| 55 to 59 Years | 24 (75.0%) | 0 (0.0%) |
| 60 to 64 Years | 19 (65.5%) | 0 (0.0%) |
| 65 to 74 Years | 27 (28.7%) | 0 (0.0%) |
| 75 Years and over | 4 (23.5%) | 0 (0.0%) |
| Total | 282 (61.4%) | 9 (3.2%) |
Employment Status by Educational Attainment in Cowley
According to labor force statistics for Cowley, 71.8% of individuals (204) out of the total population between 25 and 64 years of age (284) are in the labor force, with 4.4% or 9 of them being unemployed. The group with the highest labor force participation rate are those with the educational attainment of high school diploma, with 91.2% or 31 individuals in the labor force. Within the labor force, individuals with high school diploma education have the highest percentage of unemployment, with 29.0% or 9 of them being unemployed.
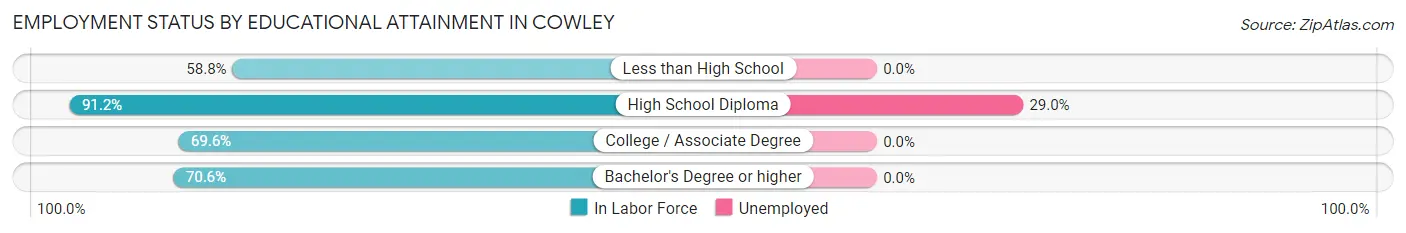
| Educational Attainment | In Labor Force | Unemployed |
| Less than High School | 10 (58.8%) | 0 (0.0%) |
| High School Diploma | 31 (91.2%) | 10 (29.0%) |
| College / Associate Degree | 103 (69.6%) | 0 (0.0%) |
| Bachelor's Degree or higher | 60 (70.6%) | 0 (0.0%) |
| Total | 204 (71.8%) | 12 (4.4%) |
Employment Occupations by Sex in Cowley
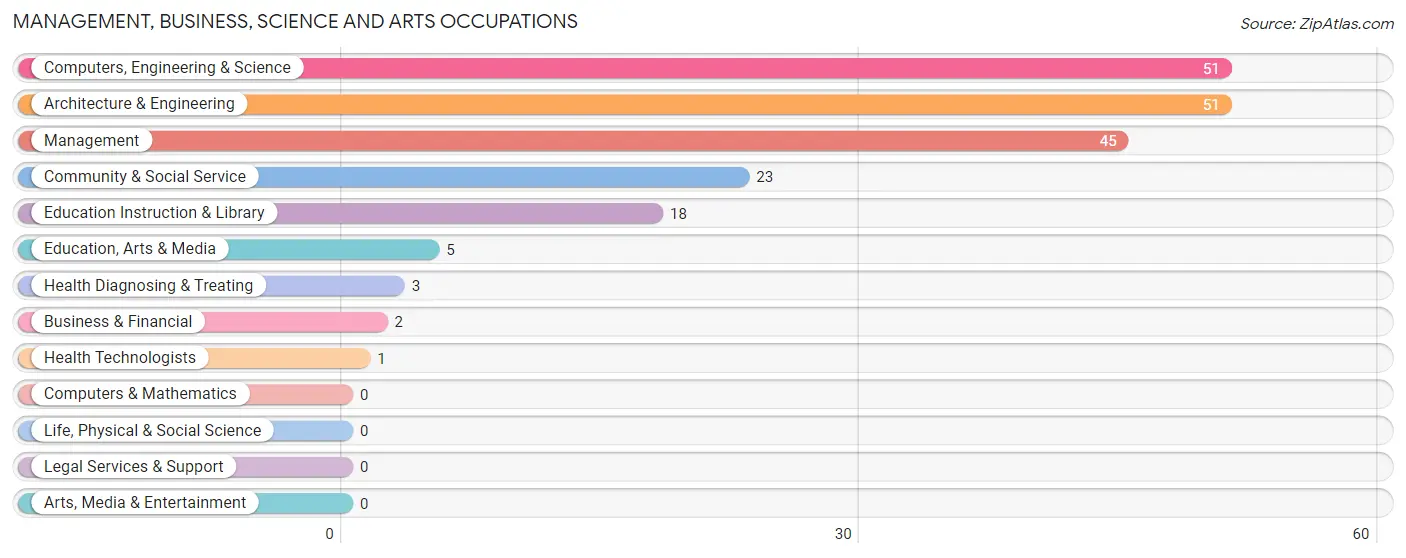
Management, Business, Science and Arts Occupations
The most common Management, Business, Science and Arts occupations in Cowley are Computers, Engineering & Science (51 | 18.7%), Architecture & Engineering (51 | 18.7%), Management (45 | 16.5%), Community & Social Service (23 | 8.4%), and Education Instruction & Library (18 | 6.6%).
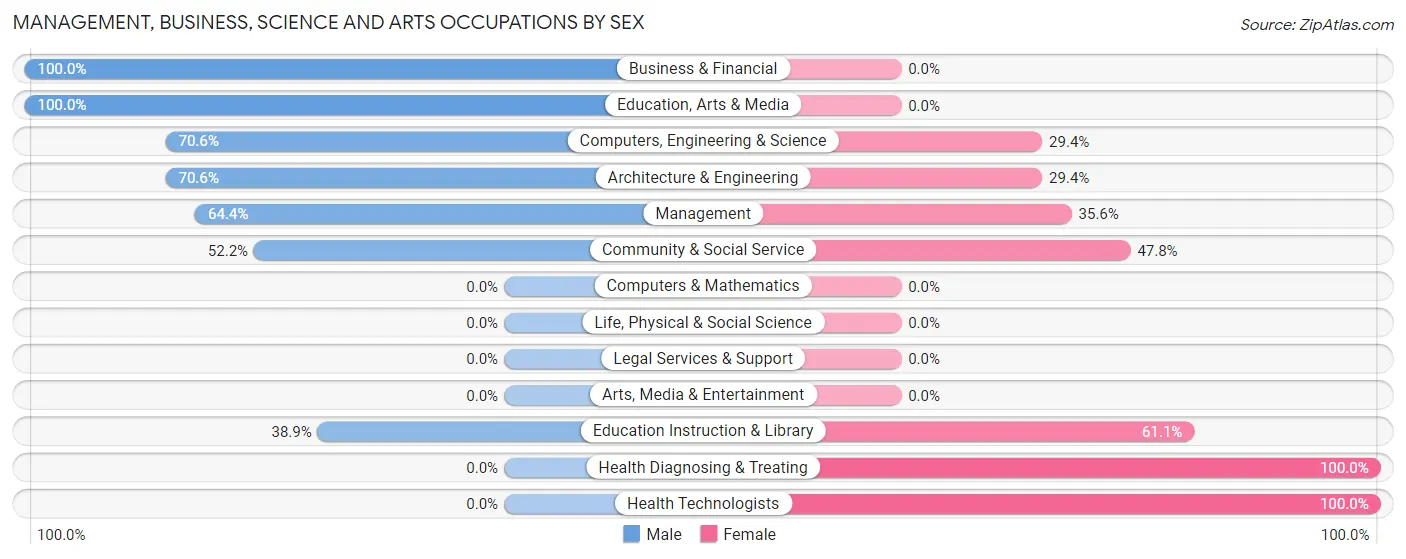
Management, Business, Science and Arts Occupations by Sex
Within the Management, Business, Science and Arts occupations in Cowley, the most male-oriented occupations are Business & Financial (100.0%), Education, Arts & Media (100.0%), and Computers, Engineering & Science (70.6%), while the most female-oriented occupations are Health Diagnosing & Treating (100.0%), Health Technologists (100.0%), and Education Instruction & Library (61.1%).
| Occupation | Male | Female |
| Management | 29 (64.4%) | 16 (35.6%) |
| Business & Financial | 2 (100.0%) | 0 (0.0%) |
| Computers, Engineering & Science | 36 (70.6%) | 15 (29.4%) |
| Computers & Mathematics | 0 (0.0%) | 0 (0.0%) |
| Architecture & Engineering | 36 (70.6%) | 15 (29.4%) |
| Life, Physical & Social Science | 0 (0.0%) | 0 (0.0%) |
| Community & Social Service | 12 (52.2%) | 11 (47.8%) |
| Education, Arts & Media | 5 (100.0%) | 0 (0.0%) |
| Legal Services & Support | 0 (0.0%) | 0 (0.0%) |
| Education Instruction & Library | 7 (38.9%) | 11 (61.1%) |
| Arts, Media & Entertainment | 0 (0.0%) | 0 (0.0%) |
| Health Diagnosing & Treating | 0 (0.0%) | 3 (100.0%) |
| Health Technologists | 0 (0.0%) | 1 (100.0%) |
| Total (Category) | 79 (63.7%) | 45 (36.3%) |
| Total (Overall) | 170 (62.3%) | 103 (37.7%) |
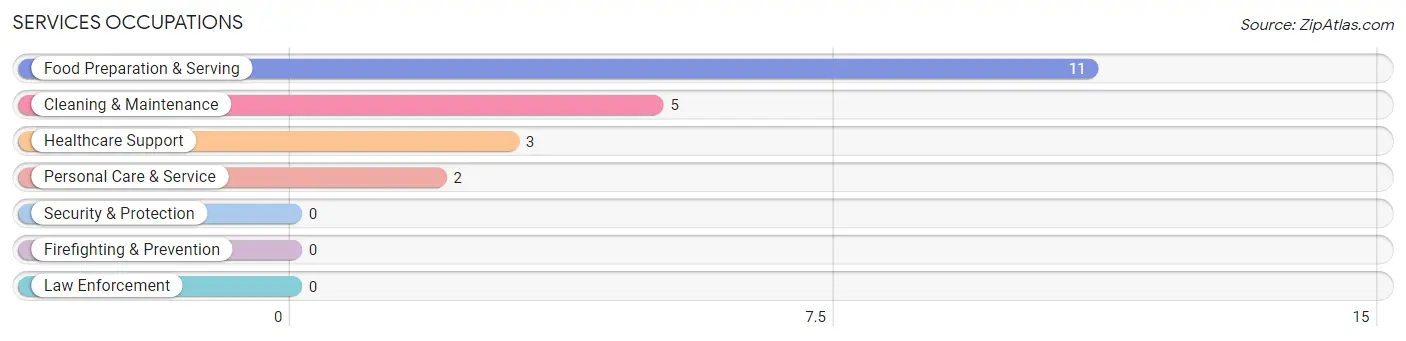
Services Occupations
The most common Services occupations in Cowley are Food Preparation & Serving (11 | 4.0%), Cleaning & Maintenance (5 | 1.8%), Healthcare Support (3 | 1.1%), and Personal Care & Service (2 | 0.7%).
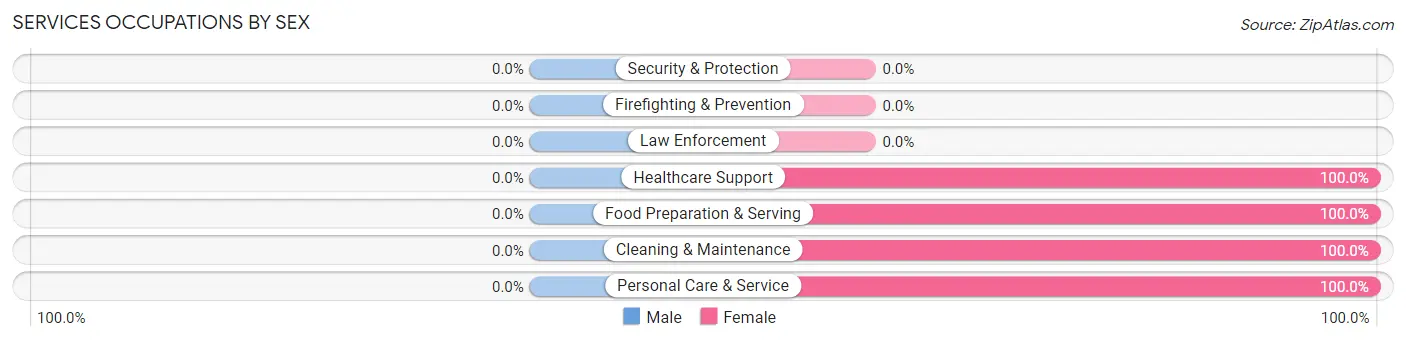
Services Occupations by Sex
| Occupation | Male | Female |
| Healthcare Support | 0 (0.0%) | 3 (100.0%) |
| Security & Protection | 0 (0.0%) | 0 (0.0%) |
| Firefighting & Prevention | 0 (0.0%) | 0 (0.0%) |
| Law Enforcement | 0 (0.0%) | 0 (0.0%) |
| Food Preparation & Serving | 0 (0.0%) | 11 (100.0%) |
| Cleaning & Maintenance | 0 (0.0%) | 5 (100.0%) |
| Personal Care & Service | 0 (0.0%) | 2 (100.0%) |
| Total (Category) | 0 (0.0%) | 21 (100.0%) |
| Total (Overall) | 170 (62.3%) | 103 (37.7%) |
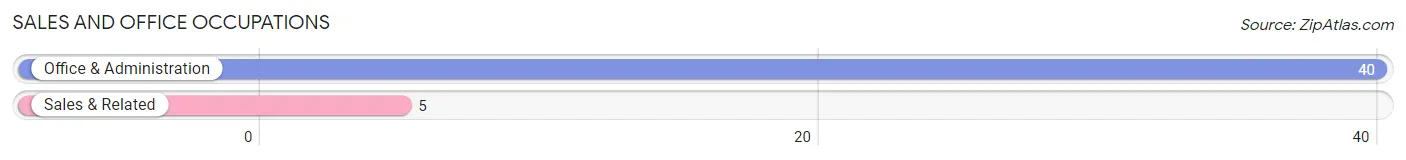
Sales and Office Occupations
The most common Sales and Office occupations in Cowley are Office & Administration (40 | 14.6%), and Sales & Related (5 | 1.8%).
Sales and Office Occupations by Sex
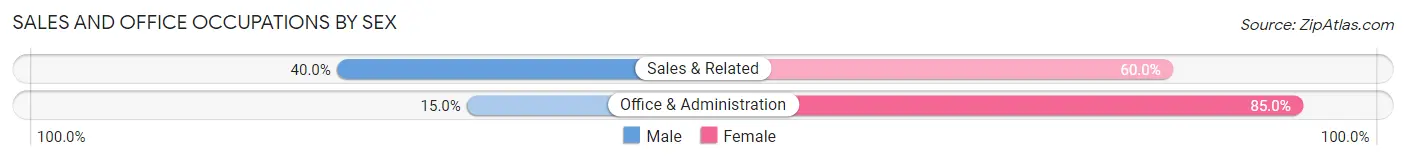
| Occupation | Male | Female |
| Sales & Related | 2 (40.0%) | 3 (60.0%) |
| Office & Administration | 6 (15.0%) | 34 (85.0%) |
| Total (Category) | 8 (17.8%) | 37 (82.2%) |
| Total (Overall) | 170 (62.3%) | 103 (37.7%) |
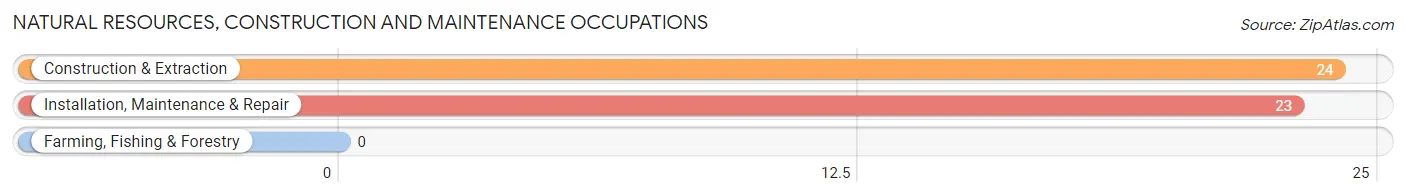
Natural Resources, Construction and Maintenance Occupations
The most common Natural Resources, Construction and Maintenance occupations in Cowley are Construction & Extraction (24 | 8.8%), and Installation, Maintenance & Repair (23 | 8.4%).
Natural Resources, Construction and Maintenance Occupations by Sex
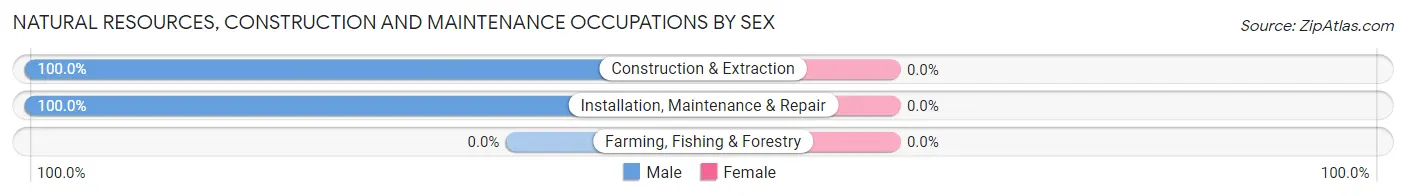
| Occupation | Male | Female |
| Farming, Fishing & Forestry | 0 (0.0%) | 0 (0.0%) |
| Construction & Extraction | 24 (100.0%) | 0 (0.0%) |
| Installation, Maintenance & Repair | 23 (100.0%) | 0 (0.0%) |
| Total (Category) | 47 (100.0%) | 0 (0.0%) |
| Total (Overall) | 170 (62.3%) | 103 (37.7%) |
Production, Transportation and Moving Occupations
The most common Production, Transportation and Moving occupations in Cowley are Transportation (16 | 5.9%), Production (11 | 4.0%), and Material Moving (9 | 3.3%).
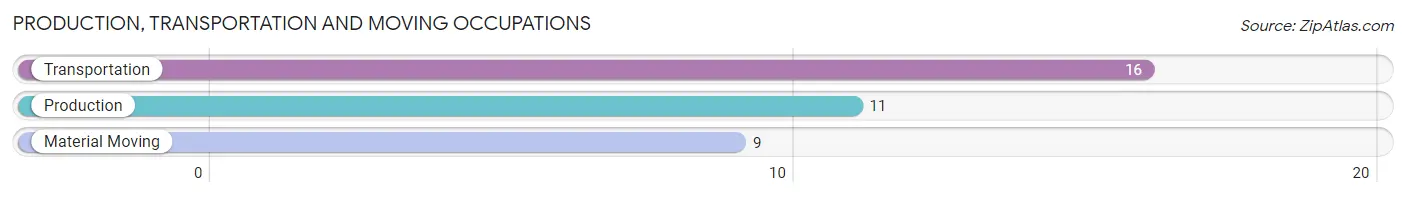
Production, Transportation and Moving Occupations by Sex
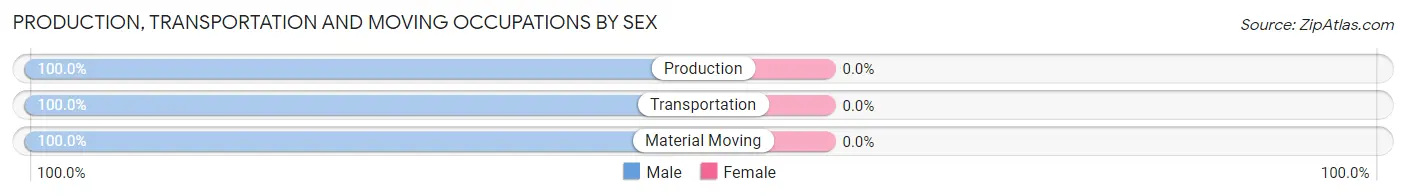
| Occupation | Male | Female |
| Production | 11 (100.0%) | 0 (0.0%) |
| Transportation | 16 (100.0%) | 0 (0.0%) |
| Material Moving | 9 (100.0%) | 0 (0.0%) |
| Total (Category) | 36 (100.0%) | 0 (0.0%) |
| Total (Overall) | 170 (62.3%) | 103 (37.7%) |
Employment Industries by Sex in Cowley
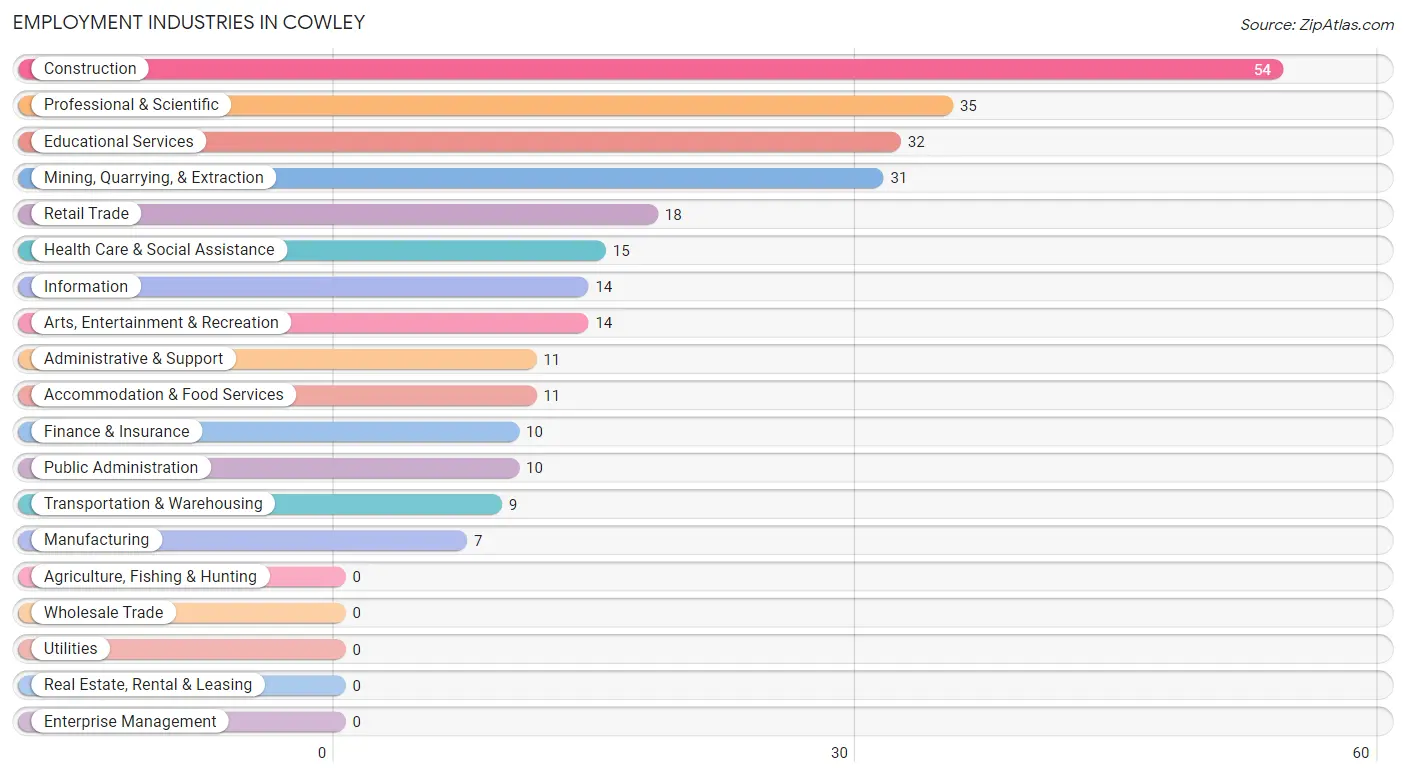
Employment Industries in Cowley
The major employment industries in Cowley include Construction (54 | 19.8%), Professional & Scientific (35 | 12.8%), Educational Services (32 | 11.7%), Mining, Quarrying, & Extraction (31 | 11.4%), and Retail Trade (18 | 6.6%).
Employment Industries by Sex in Cowley
The Cowley industries that see more men than women are Manufacturing (100.0%), Transportation & Warehousing (100.0%), and Professional & Scientific (100.0%), whereas the industries that tend to have a higher number of women are Arts, Entertainment & Recreation (100.0%), Accommodation & Food Services (100.0%), and Health Care & Social Assistance (80.0%).
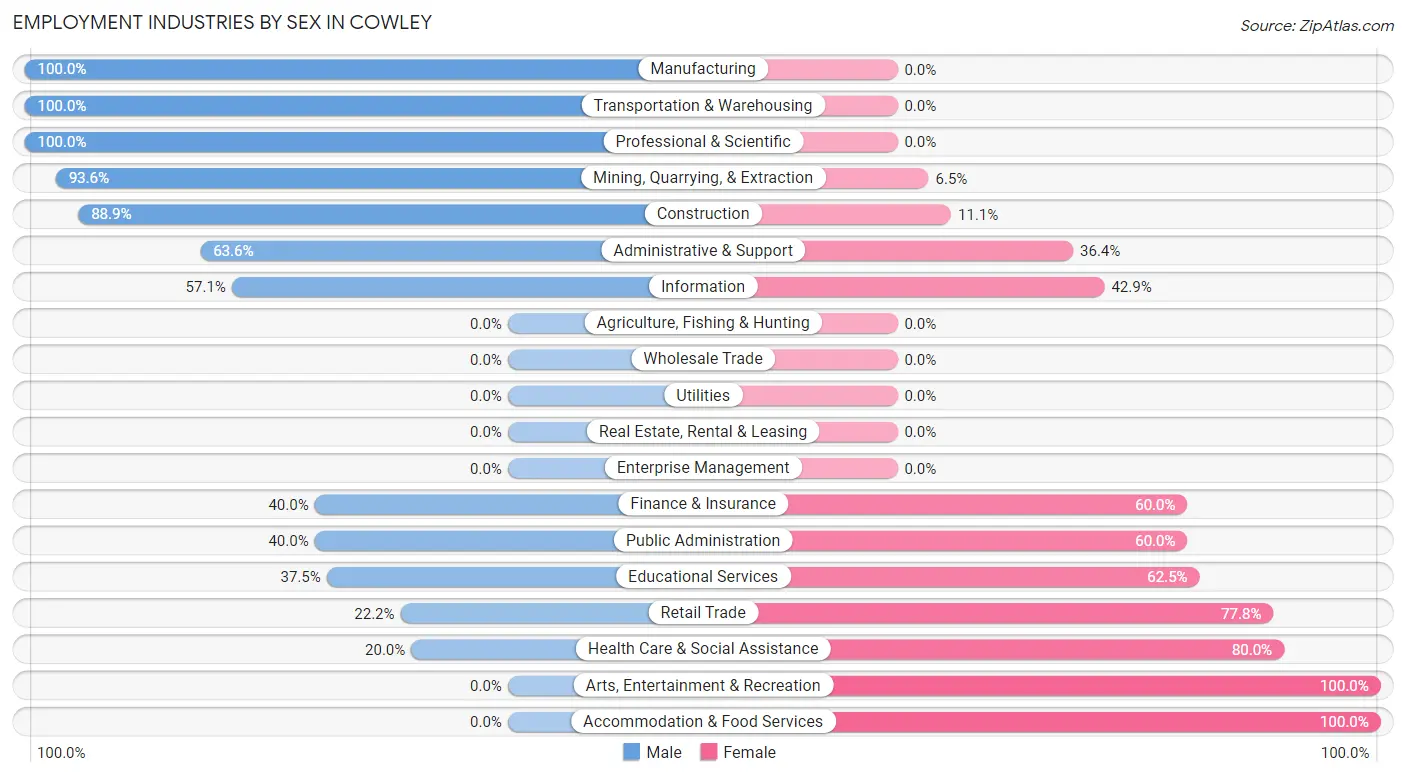
| Industry | Male | Female |
| Agriculture, Fishing & Hunting | 0 (0.0%) | 0 (0.0%) |
| Mining, Quarrying, & Extraction | 29 (93.5%) | 2 (6.5%) |
| Construction | 48 (88.9%) | 6 (11.1%) |
| Manufacturing | 7 (100.0%) | 0 (0.0%) |
| Wholesale Trade | 0 (0.0%) | 0 (0.0%) |
| Retail Trade | 4 (22.2%) | 14 (77.8%) |
| Transportation & Warehousing | 9 (100.0%) | 0 (0.0%) |
| Utilities | 0 (0.0%) | 0 (0.0%) |
| Information | 8 (57.1%) | 6 (42.9%) |
| Finance & Insurance | 4 (40.0%) | 6 (60.0%) |
| Real Estate, Rental & Leasing | 0 (0.0%) | 0 (0.0%) |
| Professional & Scientific | 35 (100.0%) | 0 (0.0%) |
| Enterprise Management | 0 (0.0%) | 0 (0.0%) |
| Administrative & Support | 7 (63.6%) | 4 (36.4%) |
| Educational Services | 12 (37.5%) | 20 (62.5%) |
| Health Care & Social Assistance | 3 (20.0%) | 12 (80.0%) |
| Arts, Entertainment & Recreation | 0 (0.0%) | 14 (100.0%) |
| Accommodation & Food Services | 0 (0.0%) | 11 (100.0%) |
| Public Administration | 4 (40.0%) | 6 (60.0%) |
| Total | 170 (62.3%) | 103 (37.7%) |
Education in Cowley
School Enrollment in Cowley
The most common levels of schooling among the 225 students in Cowley are college / undergraduate (61 | 27.1%), nursery / preschool (46 | 20.4%), and middle school (42 | 18.7%).
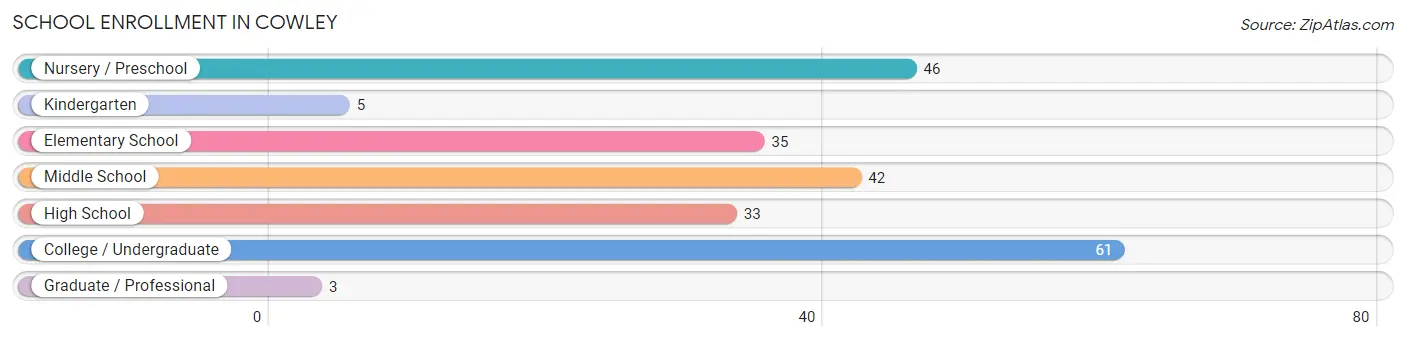
| School Level | # Students | % Students |
| Nursery / Preschool | 46 | 20.4% |
| Kindergarten | 5 | 2.2% |
| Elementary School | 35 | 15.6% |
| Middle School | 42 | 18.7% |
| High School | 33 | 14.7% |
| College / Undergraduate | 61 | 27.1% |
| Graduate / Professional | 3 | 1.3% |
| Total | 225 | 100.0% |
School Enrollment by Age by Funding Source in Cowley
Out of a total of 225 students who are enrolled in schools in Cowley, 2 (0.9%) attend a private institution, while the remaining 223 (99.1%) are enrolled in public schools. The age group of 5 to 9 year old has the highest likelihood of being enrolled in private schools, with 2 (2.5% in the age bracket) enrolled. Conversely, the age group of 3 to 4 year olds has the lowest likelihood of being enrolled in a private school, with 5 (100.0% in the age bracket) attending a public institution.
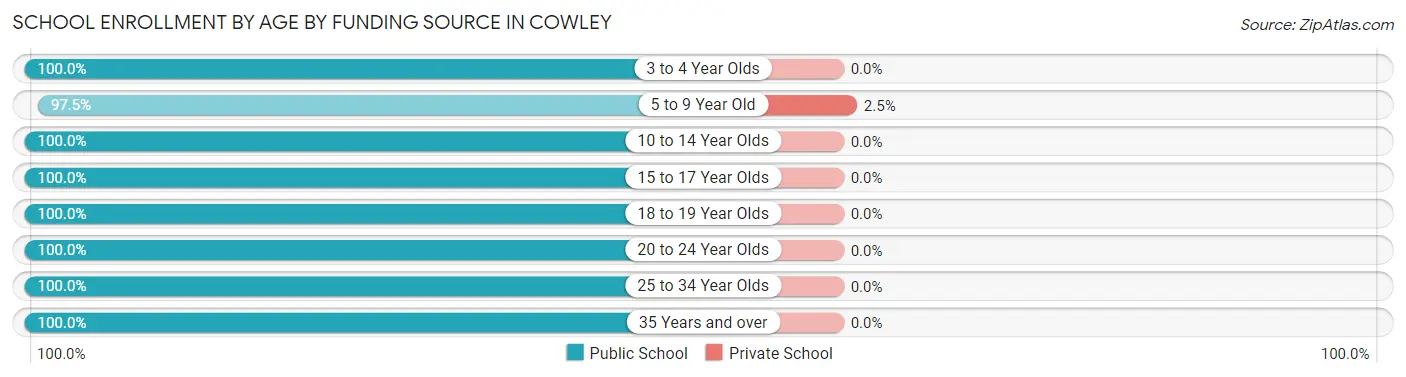
| Age Bracket | Public School | Private School |
| 3 to 4 Year Olds | 5 (100.0%) | 0 (0.0%) |
| 5 to 9 Year Old | 79 (97.5%) | 2 (2.5%) |
| 10 to 14 Year Olds | 44 (100.0%) | 0 (0.0%) |
| 15 to 17 Year Olds | 31 (100.0%) | 0 (0.0%) |
| 18 to 19 Year Olds | 11 (100.0%) | 0 (0.0%) |
| 20 to 24 Year Olds | 8 (100.0%) | 0 (0.0%) |
| 25 to 34 Year Olds | 35 (100.0%) | 0 (0.0%) |
| 35 Years and over | 10 (100.0%) | 0 (0.0%) |
| Total | 223 (99.1%) | 2 (0.9%) |
Educational Attainment by Field of Study in Cowley
Education (33 | 26.0%), communications (23 | 18.1%), engineering (17 | 13.4%), literature & languages (16 | 12.6%), and bio, nature & agricultural (12 | 9.5%) are the most common fields of study among 127 individuals in Cowley who have obtained a bachelor's degree or higher.
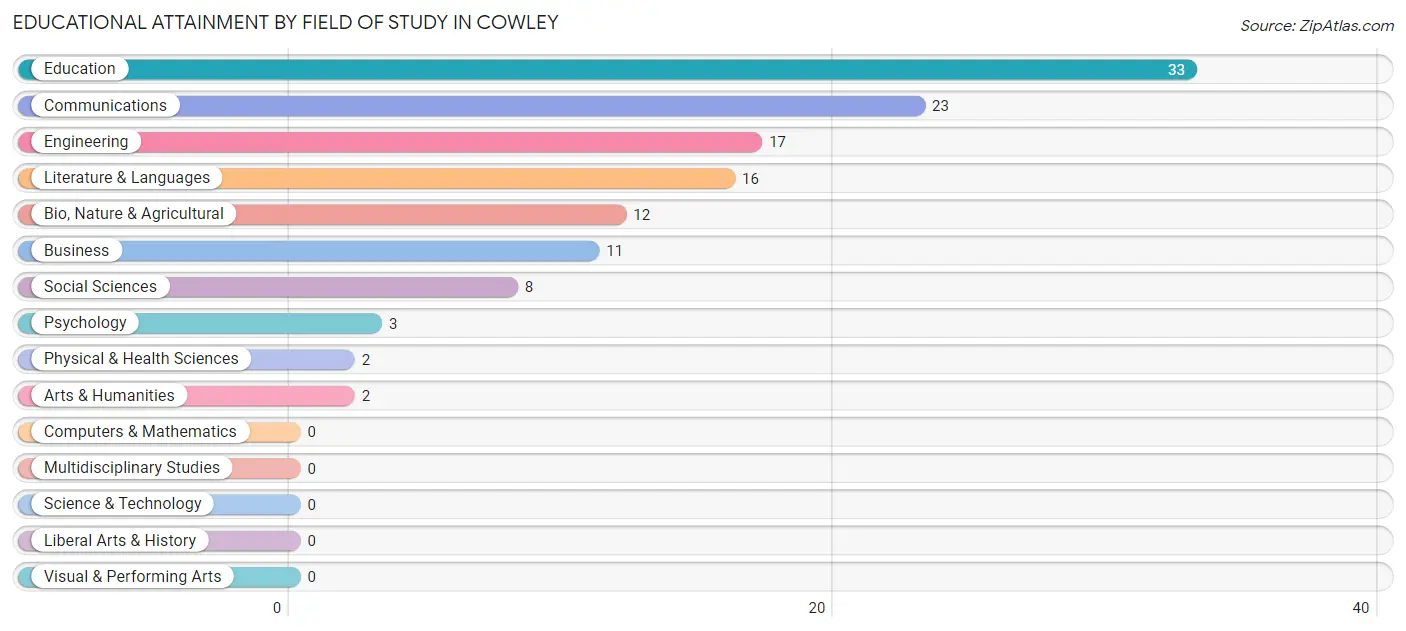
| Field of Study | # Graduates | % Graduates |
| Computers & Mathematics | 0 | 0.0% |
| Bio, Nature & Agricultural | 12 | 9.5% |
| Physical & Health Sciences | 2 | 1.6% |
| Psychology | 3 | 2.4% |
| Social Sciences | 8 | 6.3% |
| Engineering | 17 | 13.4% |
| Multidisciplinary Studies | 0 | 0.0% |
| Science & Technology | 0 | 0.0% |
| Business | 11 | 8.7% |
| Education | 33 | 26.0% |
| Literature & Languages | 16 | 12.6% |
| Liberal Arts & History | 0 | 0.0% |
| Visual & Performing Arts | 0 | 0.0% |
| Communications | 23 | 18.1% |
| Arts & Humanities | 2 | 1.6% |
| Total | 127 | 100.0% |
Transportation & Commute in Cowley
Vehicle Availability by Sex in Cowley
The most prevalent vehicle ownership categories in Cowley are males with 2 vehicles (70, accounting for 43.8%) and females with 2 vehicles (35, making up 68.0%).
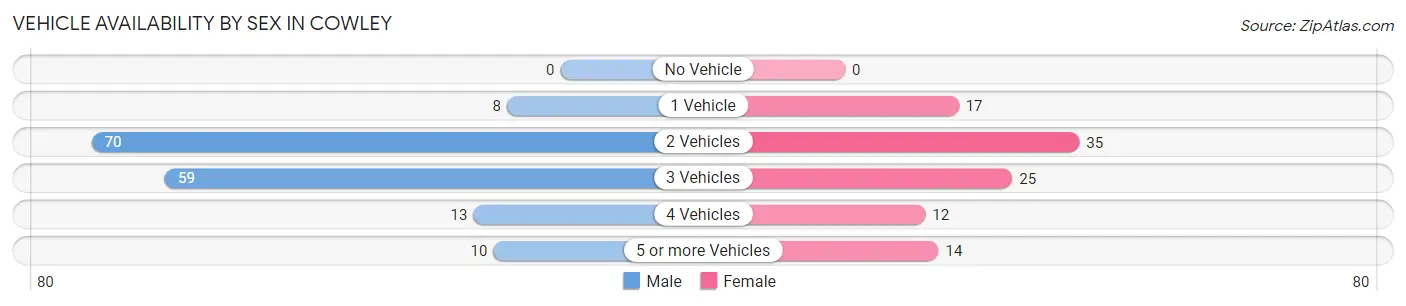
| Vehicles Available | Male | Female |
| No Vehicle | 0 (0.0%) | 0 (0.0%) |
| 1 Vehicle | 8 (5.0%) | 17 (16.5%) |
| 2 Vehicles | 70 (43.8%) | 35 (34.0%) |
| 3 Vehicles | 59 (36.9%) | 25 (24.3%) |
| 4 Vehicles | 13 (8.1%) | 12 (11.7%) |
| 5 or more Vehicles | 10 (6.2%) | 14 (13.6%) |
| Total | 160 (100.0%) | 103 (100.0%) |
Commute Time in Cowley
The most frequently occuring commute durations in Cowley are 5 to 9 minutes (84 commuters, 32.7%), 15 to 19 minutes (47 commuters, 18.3%), and 10 to 14 minutes (31 commuters, 12.1%).
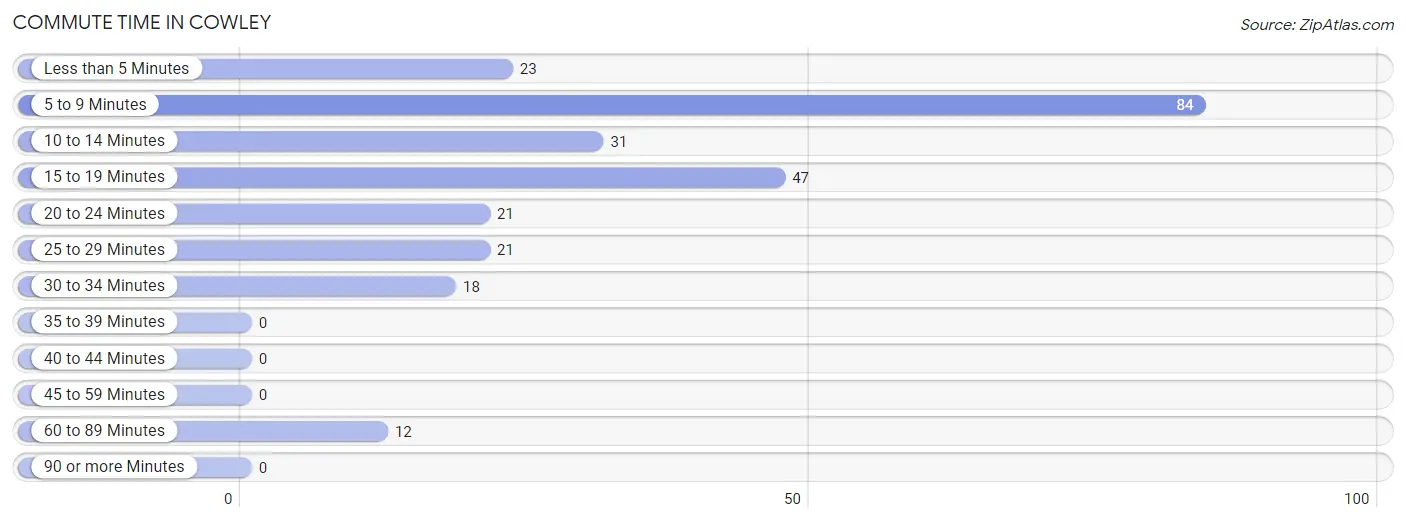
| Commute Time | # Commuters | % Commuters |
| Less than 5 Minutes | 23 | 8.9% |
| 5 to 9 Minutes | 84 | 32.7% |
| 10 to 14 Minutes | 31 | 12.1% |
| 15 to 19 Minutes | 47 | 18.3% |
| 20 to 24 Minutes | 21 | 8.2% |
| 25 to 29 Minutes | 21 | 8.2% |
| 30 to 34 Minutes | 18 | 7.0% |
| 35 to 39 Minutes | 0 | 0.0% |
| 40 to 44 Minutes | 0 | 0.0% |
| 45 to 59 Minutes | 0 | 0.0% |
| 60 to 89 Minutes | 12 | 4.7% |
| 90 or more Minutes | 0 | 0.0% |
Commute Time by Sex in Cowley
The most common commute times in Cowley are 5 to 9 minutes (71 commuters, 45.5%) for males and 15 to 19 minutes (21 commuters, 20.8%) for females.
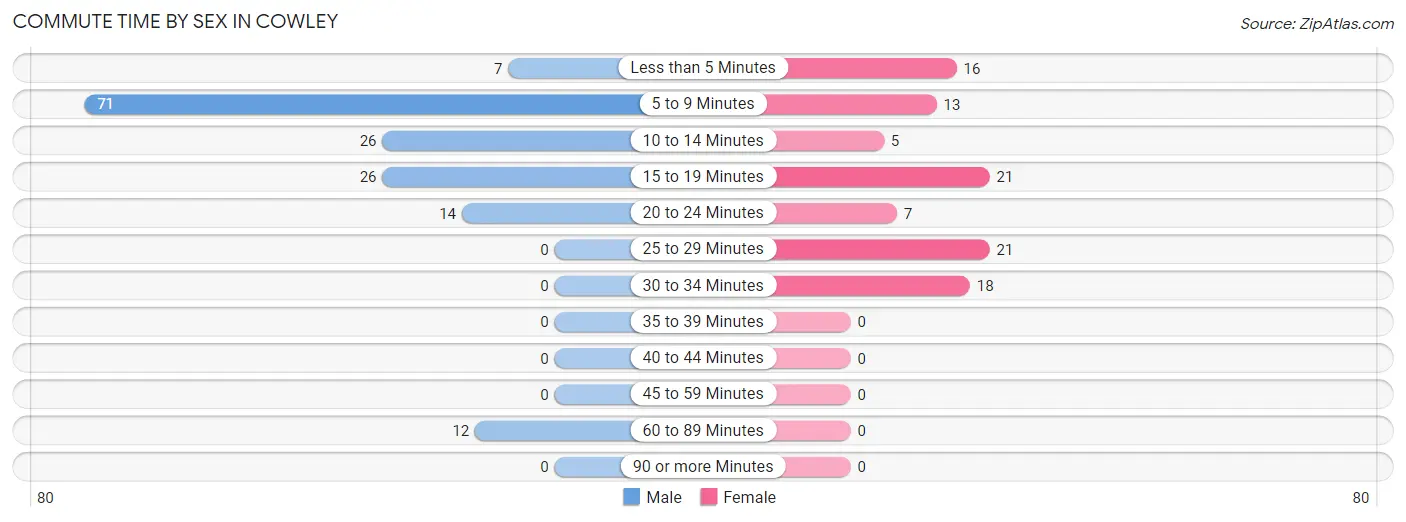
| Commute Time | Male | Female |
| Less than 5 Minutes | 7 (4.5%) | 16 (15.8%) |
| 5 to 9 Minutes | 71 (45.5%) | 13 (12.9%) |
| 10 to 14 Minutes | 26 (16.7%) | 5 (5.0%) |
| 15 to 19 Minutes | 26 (16.7%) | 21 (20.8%) |
| 20 to 24 Minutes | 14 (9.0%) | 7 (6.9%) |
| 25 to 29 Minutes | 0 (0.0%) | 21 (20.8%) |
| 30 to 34 Minutes | 0 (0.0%) | 18 (17.8%) |
| 35 to 39 Minutes | 0 (0.0%) | 0 (0.0%) |
| 40 to 44 Minutes | 0 (0.0%) | 0 (0.0%) |
| 45 to 59 Minutes | 0 (0.0%) | 0 (0.0%) |
| 60 to 89 Minutes | 12 (7.7%) | 0 (0.0%) |
| 90 or more Minutes | 0 (0.0%) | 0 (0.0%) |
Time of Departure to Work by Sex in Cowley
The most frequent times of departure to work in Cowley are 7:30 AM to 7:59 AM (46, 29.5%) for males and 7:30 AM to 7:59 AM (25, 24.7%) for females.
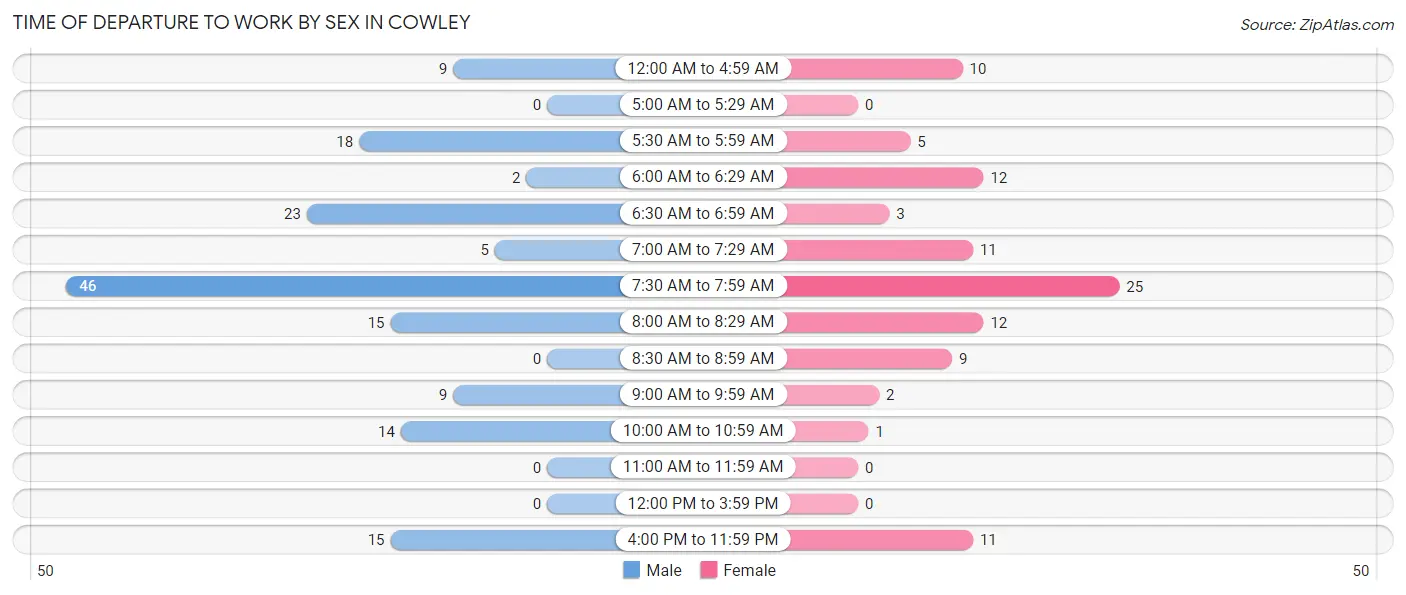
| Time of Departure | Male | Female |
| 12:00 AM to 4:59 AM | 9 (5.8%) | 10 (9.9%) |
| 5:00 AM to 5:29 AM | 0 (0.0%) | 0 (0.0%) |
| 5:30 AM to 5:59 AM | 18 (11.5%) | 5 (5.0%) |
| 6:00 AM to 6:29 AM | 2 (1.3%) | 12 (11.9%) |
| 6:30 AM to 6:59 AM | 23 (14.7%) | 3 (3.0%) |
| 7:00 AM to 7:29 AM | 5 (3.2%) | 11 (10.9%) |
| 7:30 AM to 7:59 AM | 46 (29.5%) | 25 (24.7%) |
| 8:00 AM to 8:29 AM | 15 (9.6%) | 12 (11.9%) |
| 8:30 AM to 8:59 AM | 0 (0.0%) | 9 (8.9%) |
| 9:00 AM to 9:59 AM | 9 (5.8%) | 2 (2.0%) |
| 10:00 AM to 10:59 AM | 14 (9.0%) | 1 (1.0%) |
| 11:00 AM to 11:59 AM | 0 (0.0%) | 0 (0.0%) |
| 12:00 PM to 3:59 PM | 0 (0.0%) | 0 (0.0%) |
| 4:00 PM to 11:59 PM | 15 (9.6%) | 11 (10.9%) |
| Total | 156 (100.0%) | 101 (100.0%) |
Housing Occupancy in Cowley
Occupancy by Ownership in Cowley
Of the total 192 dwellings in Cowley, owner-occupied units account for 171 (89.1%), while renter-occupied units make up 21 (10.9%).
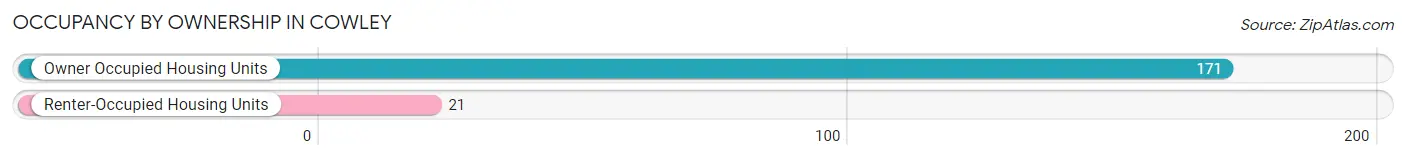
| Occupancy | # Housing Units | % Housing Units |
| Owner Occupied Housing Units | 171 | 89.1% |
| Renter-Occupied Housing Units | 21 | 10.9% |
| Total Occupied Housing Units | 192 | 100.0% |
Occupancy by Household Size in Cowley
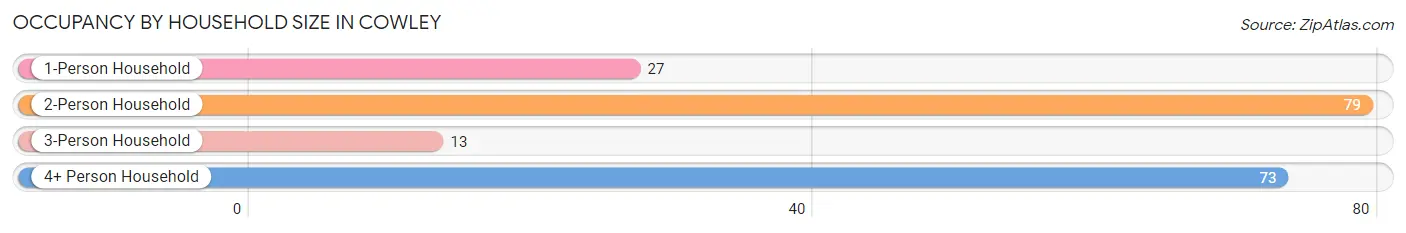
| Household Size | # Housing Units | % Housing Units |
| 1-Person Household | 27 | 14.1% |
| 2-Person Household | 79 | 41.1% |
| 3-Person Household | 13 | 6.8% |
| 4+ Person Household | 73 | 38.0% |
| Total Housing Units | 192 | 100.0% |
Occupancy by Ownership by Household Size in Cowley
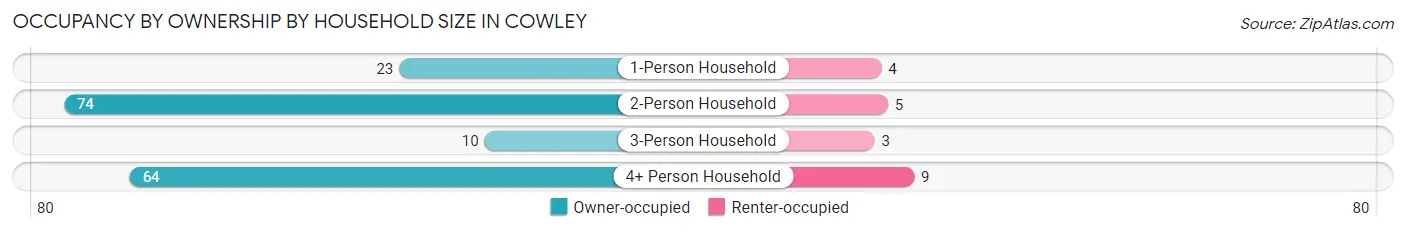
| Household Size | Owner-occupied | Renter-occupied |
| 1-Person Household | 23 (85.2%) | 4 (14.8%) |
| 2-Person Household | 74 (93.7%) | 5 (6.3%) |
| 3-Person Household | 10 (76.9%) | 3 (23.1%) |
| 4+ Person Household | 64 (87.7%) | 9 (12.3%) |
| Total Housing Units | 171 (89.1%) | 21 (10.9%) |
Occupancy by Educational Attainment in Cowley
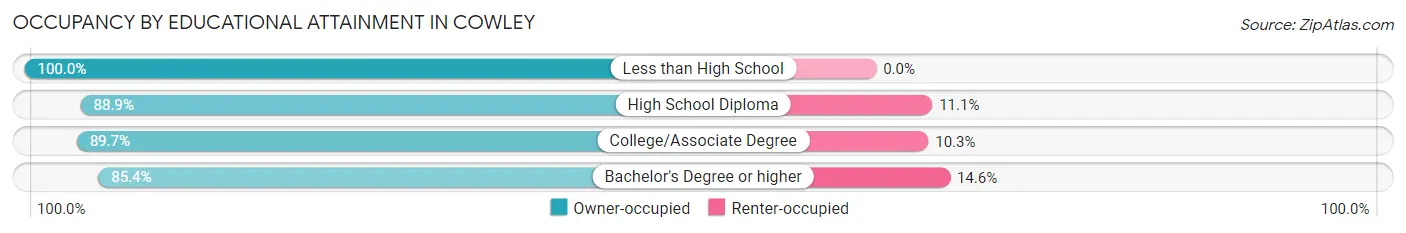
| Household Size | Owner-occupied | Renter-occupied |
| Less than High School | 8 (100.0%) | 0 (0.0%) |
| High School Diploma | 24 (88.9%) | 3 (11.1%) |
| College/Associate Degree | 104 (89.7%) | 12 (10.3%) |
| Bachelor's Degree or higher | 35 (85.4%) | 6 (14.6%) |
Occupancy by Age of Householder in Cowley
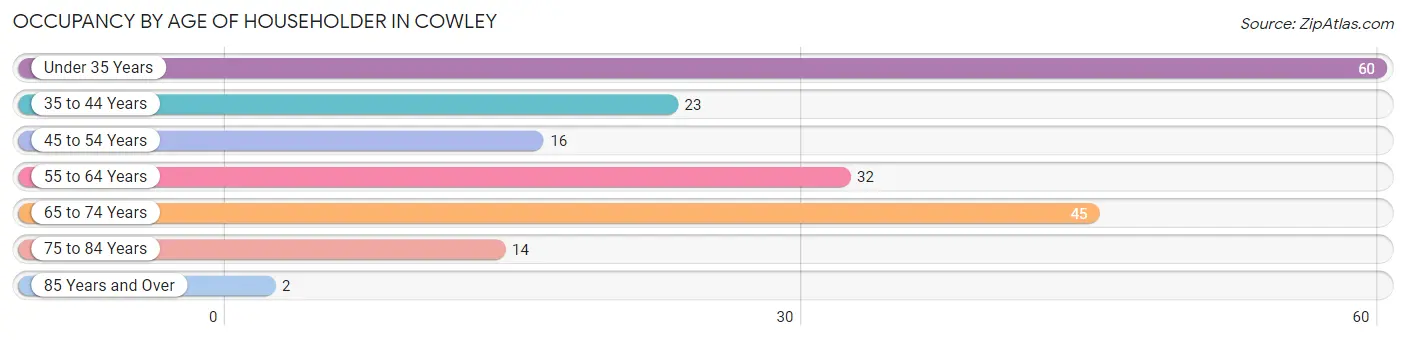
| Age Bracket | # Households | % Households |
| Under 35 Years | 60 | 31.2% |
| 35 to 44 Years | 23 | 12.0% |
| 45 to 54 Years | 16 | 8.3% |
| 55 to 64 Years | 32 | 16.7% |
| 65 to 74 Years | 45 | 23.4% |
| 75 to 84 Years | 14 | 7.3% |
| 85 Years and Over | 2 | 1.0% |
| Total | 192 | 100.0% |
Housing Finances in Cowley
Median Income by Occupancy in Cowley
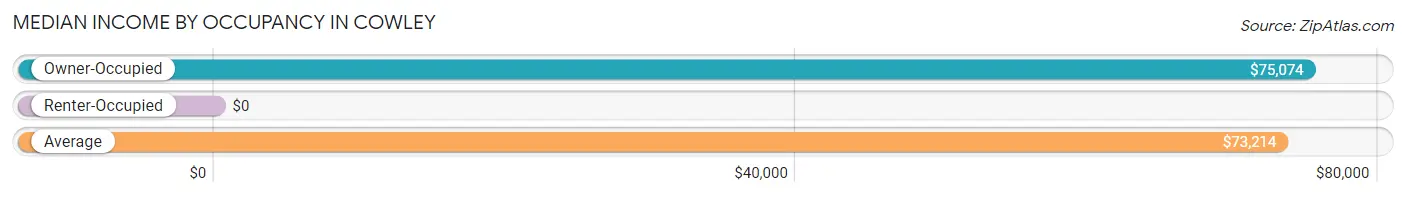
| Occupancy Type | # Households | Median Income |
| Owner-Occupied | 171 (89.1%) | $75,074 |
| Renter-Occupied | 21 (10.9%) | $0 |
| Average | 192 (100.0%) | $73,214 |
Occupancy by Householder Income Bracket in Cowley
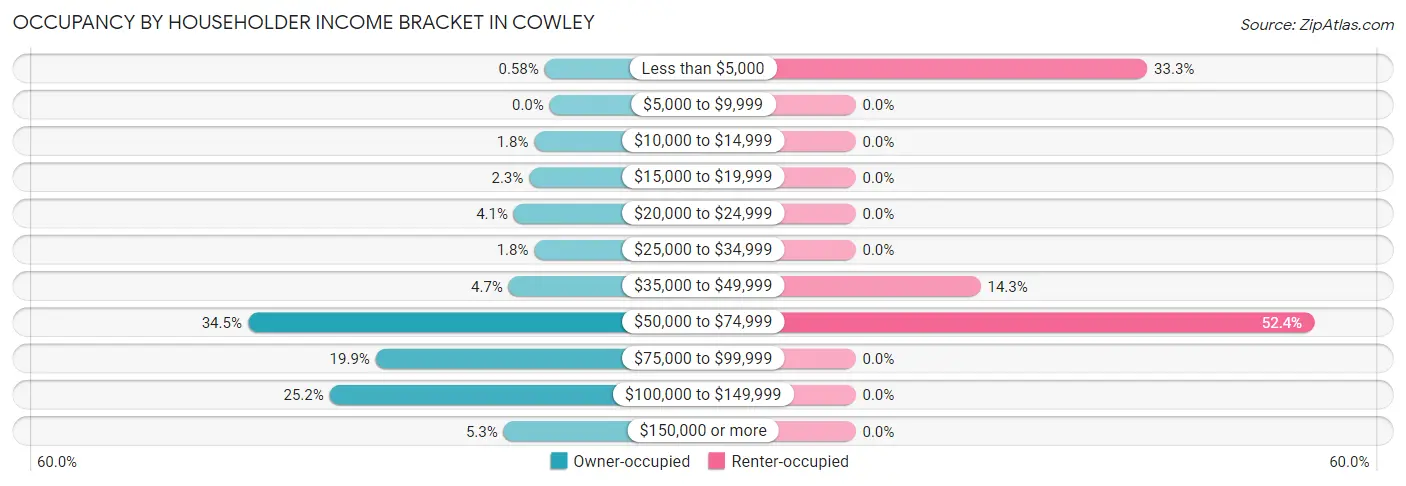
| Income Bracket | Owner-occupied | Renter-occupied |
| Less than $5,000 | 1 (0.6%) | 7 (33.3%) |
| $5,000 to $9,999 | 0 (0.0%) | 0 (0.0%) |
| $10,000 to $14,999 | 3 (1.8%) | 0 (0.0%) |
| $15,000 to $19,999 | 4 (2.3%) | 0 (0.0%) |
| $20,000 to $24,999 | 7 (4.1%) | 0 (0.0%) |
| $25,000 to $34,999 | 3 (1.8%) | 0 (0.0%) |
| $35,000 to $49,999 | 8 (4.7%) | 3 (14.3%) |
| $50,000 to $74,999 | 59 (34.5%) | 11 (52.4%) |
| $75,000 to $99,999 | 34 (19.9%) | 0 (0.0%) |
| $100,000 to $149,999 | 43 (25.2%) | 0 (0.0%) |
| $150,000 or more | 9 (5.3%) | 0 (0.0%) |
| Total | 171 (100.0%) | 21 (100.0%) |
Monthly Housing Cost Tiers in Cowley
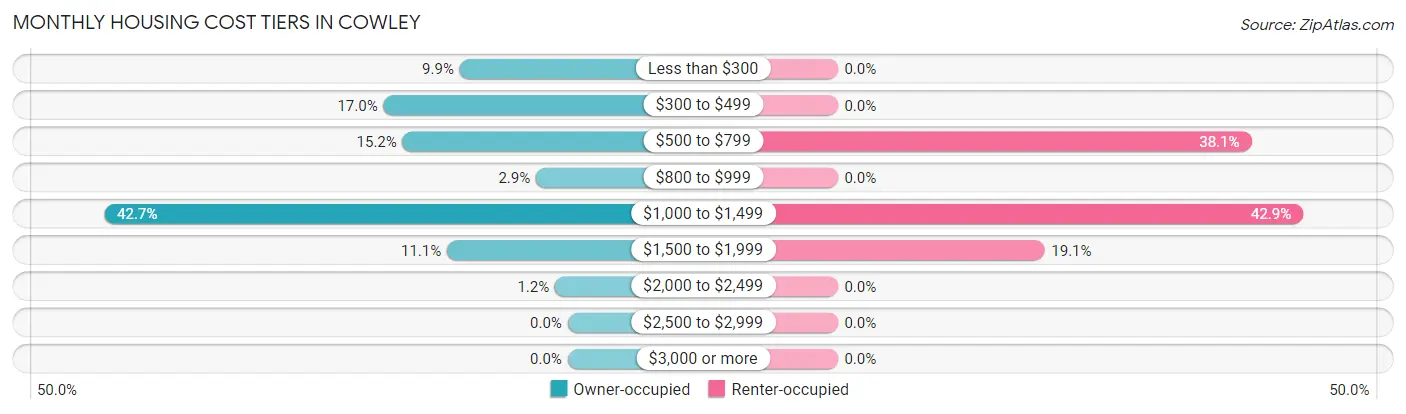
| Monthly Cost | Owner-occupied | Renter-occupied |
| Less than $300 | 17 (9.9%) | 0 (0.0%) |
| $300 to $499 | 29 (17.0%) | 0 (0.0%) |
| $500 to $799 | 26 (15.2%) | 8 (38.1%) |
| $800 to $999 | 5 (2.9%) | 0 (0.0%) |
| $1,000 to $1,499 | 73 (42.7%) | 9 (42.9%) |
| $1,500 to $1,999 | 19 (11.1%) | 4 (19.1%) |
| $2,000 to $2,499 | 2 (1.2%) | 0 (0.0%) |
| $2,500 to $2,999 | 0 (0.0%) | 0 (0.0%) |
| $3,000 or more | 0 (0.0%) | 0 (0.0%) |
| Total | 171 (100.0%) | 21 (100.0%) |
Physical Housing Characteristics in Cowley
Housing Structures in Cowley
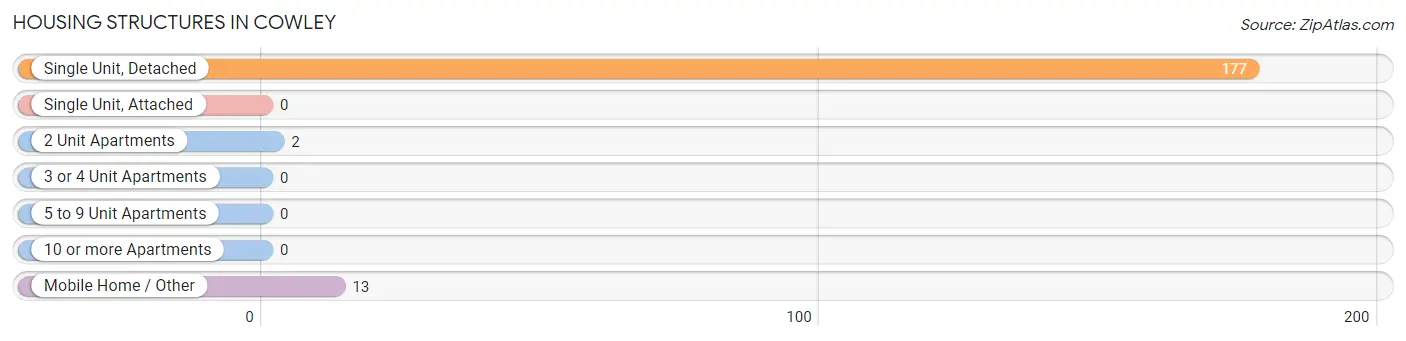
| Structure Type | # Housing Units | % Housing Units |
| Single Unit, Detached | 177 | 92.2% |
| Single Unit, Attached | 0 | 0.0% |
| 2 Unit Apartments | 2 | 1.0% |
| 3 or 4 Unit Apartments | 0 | 0.0% |
| 5 to 9 Unit Apartments | 0 | 0.0% |
| 10 or more Apartments | 0 | 0.0% |
| Mobile Home / Other | 13 | 6.8% |
| Total | 192 | 100.0% |
Housing Structures by Occupancy in Cowley
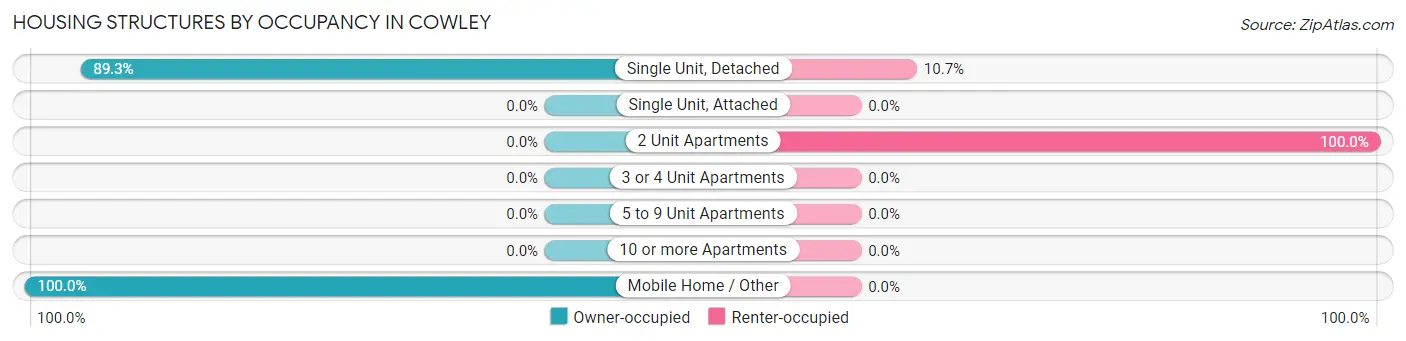
| Structure Type | Owner-occupied | Renter-occupied |
| Single Unit, Detached | 158 (89.3%) | 19 (10.7%) |
| Single Unit, Attached | 0 (0.0%) | 0 (0.0%) |
| 2 Unit Apartments | 0 (0.0%) | 2 (100.0%) |
| 3 or 4 Unit Apartments | 0 (0.0%) | 0 (0.0%) |
| 5 to 9 Unit Apartments | 0 (0.0%) | 0 (0.0%) |
| 10 or more Apartments | 0 (0.0%) | 0 (0.0%) |
| Mobile Home / Other | 13 (100.0%) | 0 (0.0%) |
| Total | 171 (89.1%) | 21 (10.9%) |
Housing Structures by Number of Rooms in Cowley
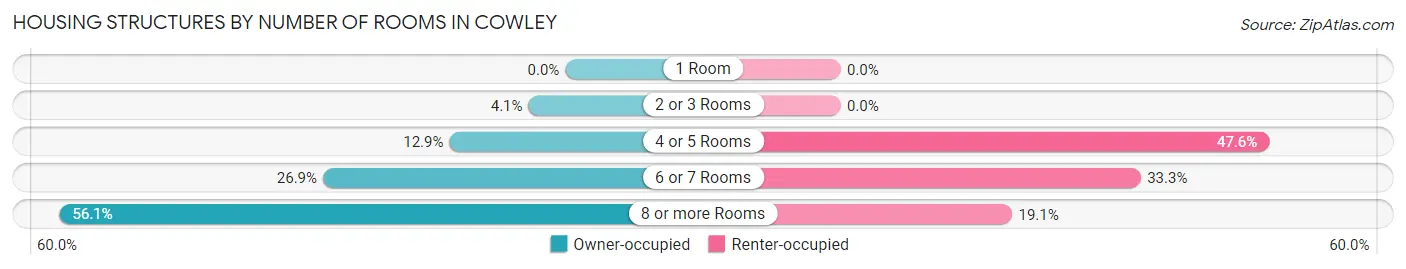
| Number of Rooms | Owner-occupied | Renter-occupied |
| 1 Room | 0 (0.0%) | 0 (0.0%) |
| 2 or 3 Rooms | 7 (4.1%) | 0 (0.0%) |
| 4 or 5 Rooms | 22 (12.9%) | 10 (47.6%) |
| 6 or 7 Rooms | 46 (26.9%) | 7 (33.3%) |
| 8 or more Rooms | 96 (56.1%) | 4 (19.1%) |
| Total | 171 (100.0%) | 21 (100.0%) |
Housing Structure by Heating Type in Cowley
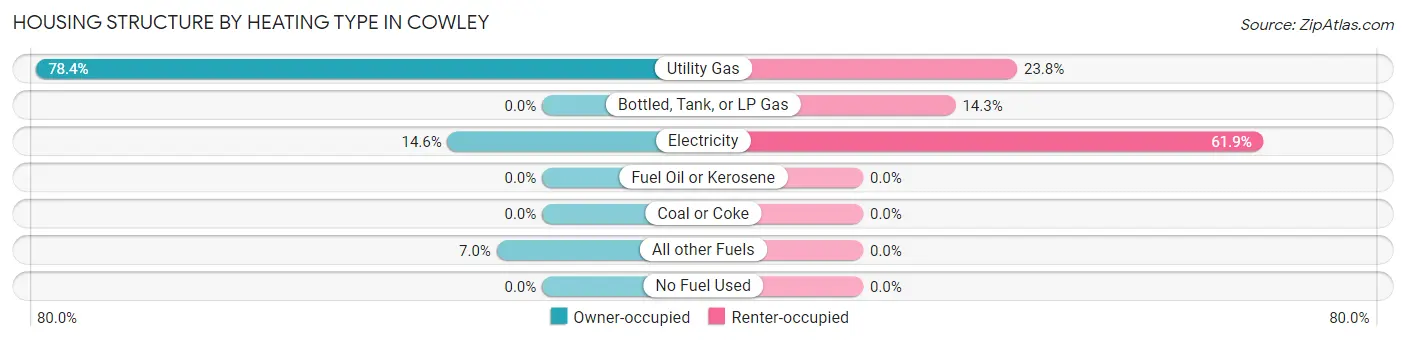
| Heating Type | Owner-occupied | Renter-occupied |
| Utility Gas | 134 (78.4%) | 5 (23.8%) |
| Bottled, Tank, or LP Gas | 0 (0.0%) | 3 (14.3%) |
| Electricity | 25 (14.6%) | 13 (61.9%) |
| Fuel Oil or Kerosene | 0 (0.0%) | 0 (0.0%) |
| Coal or Coke | 0 (0.0%) | 0 (0.0%) |
| All other Fuels | 12 (7.0%) | 0 (0.0%) |
| No Fuel Used | 0 (0.0%) | 0 (0.0%) |
| Total | 171 (100.0%) | 21 (100.0%) |
Household Vehicle Usage in Cowley
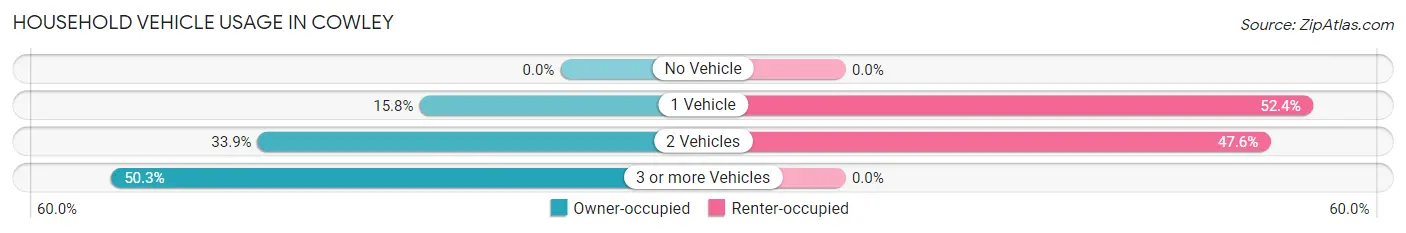
| Vehicles per Household | Owner-occupied | Renter-occupied |
| No Vehicle | 0 (0.0%) | 0 (0.0%) |
| 1 Vehicle | 27 (15.8%) | 11 (52.4%) |
| 2 Vehicles | 58 (33.9%) | 10 (47.6%) |
| 3 or more Vehicles | 86 (50.3%) | 0 (0.0%) |
| Total | 171 (100.0%) | 21 (100.0%) |
Real Estate & Mortgages in Cowley
Real Estate and Mortgage Overview in Cowley
| Characteristic | Without Mortgage | With Mortgage |
| Housing Units | 72 | 99 |
| Median Property Value | $219,200 | $195,400 |
| Median Household Income | $73,750 | $0 |
| Monthly Housing Costs | $452 | $0 |
| Real Estate Taxes | $1,196 | $0 |
Property Value by Mortgage Status in Cowley
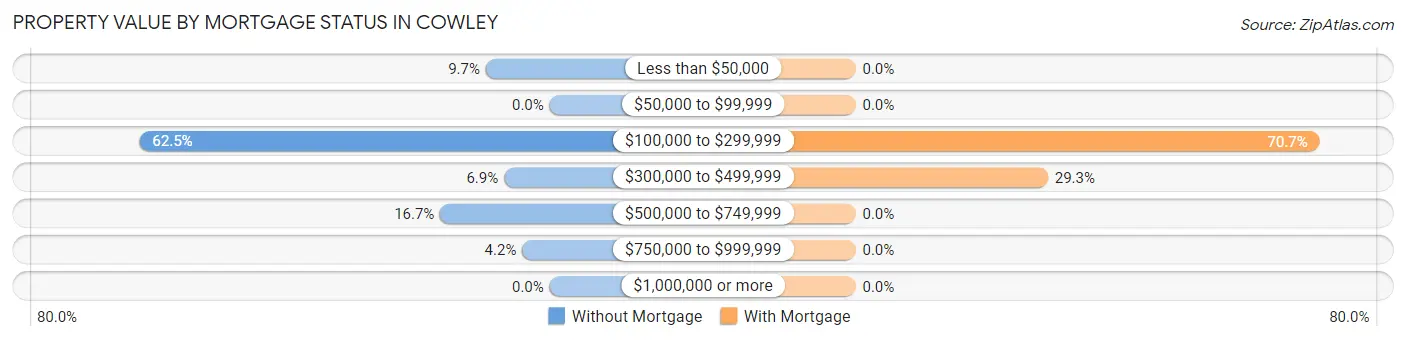
| Property Value | Without Mortgage | With Mortgage |
| Less than $50,000 | 7 (9.7%) | 0 (0.0%) |
| $50,000 to $99,999 | 0 (0.0%) | 0 (0.0%) |
| $100,000 to $299,999 | 45 (62.5%) | 70 (70.7%) |
| $300,000 to $499,999 | 5 (6.9%) | 29 (29.3%) |
| $500,000 to $749,999 | 12 (16.7%) | 0 (0.0%) |
| $750,000 to $999,999 | 3 (4.2%) | 0 (0.0%) |
| $1,000,000 or more | 0 (0.0%) | 0 (0.0%) |
| Total | 72 (100.0%) | 99 (100.0%) |
Household Income by Mortgage Status in Cowley
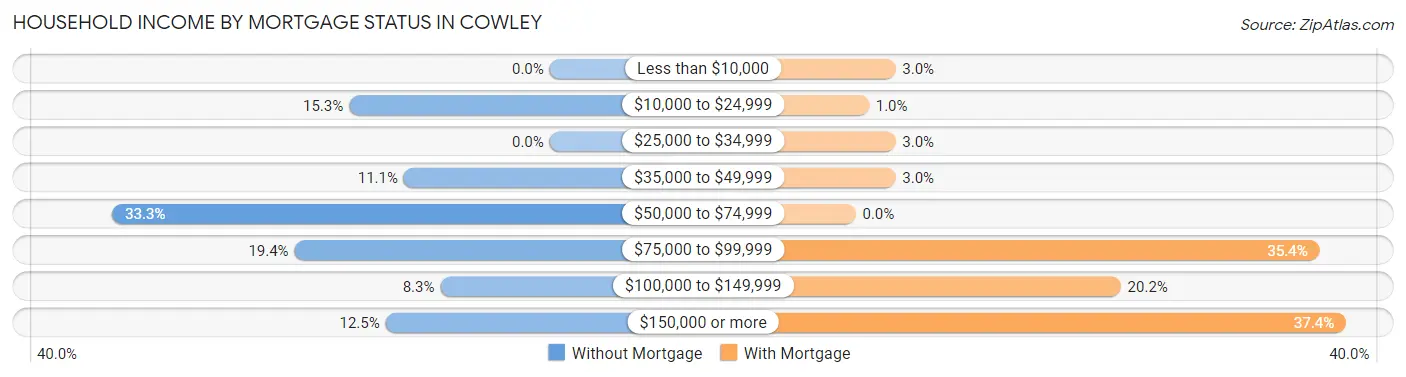
| Household Income | Without Mortgage | With Mortgage |
| Less than $10,000 | 0 (0.0%) | 3 (3.0%) |
| $10,000 to $24,999 | 11 (15.3%) | 1 (1.0%) |
| $25,000 to $34,999 | 0 (0.0%) | 3 (3.0%) |
| $35,000 to $49,999 | 8 (11.1%) | 3 (3.0%) |
| $50,000 to $74,999 | 24 (33.3%) | 0 (0.0%) |
| $75,000 to $99,999 | 14 (19.4%) | 35 (35.3%) |
| $100,000 to $149,999 | 6 (8.3%) | 20 (20.2%) |
| $150,000 or more | 9 (12.5%) | 37 (37.4%) |
| Total | 72 (100.0%) | 99 (100.0%) |
Property Value to Household Income Ratio in Cowley
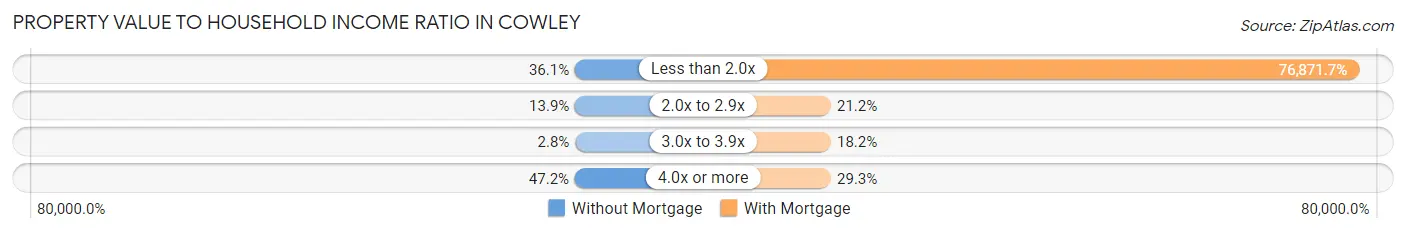
| Value-to-Income Ratio | Without Mortgage | With Mortgage |
| Less than 2.0x | 26 (36.1%) | 76,103 (76,871.7%) |
| 2.0x to 2.9x | 10 (13.9%) | 21 (21.2%) |
| 3.0x to 3.9x | 2 (2.8%) | 18 (18.2%) |
| 4.0x or more | 34 (47.2%) | 29 (29.3%) |
| Total | 72 (100.0%) | 99 (100.0%) |
Real Estate Taxes by Mortgage Status in Cowley
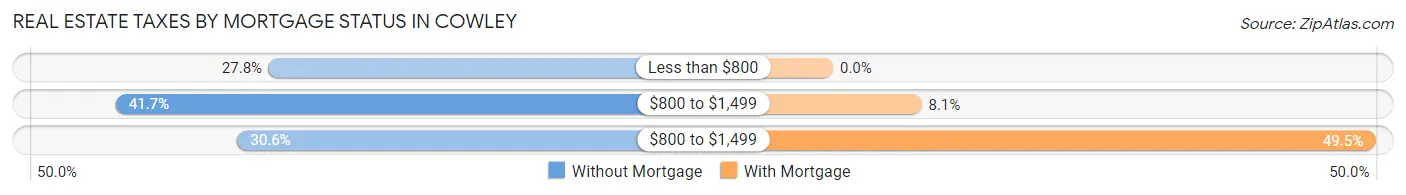
| Property Taxes | Without Mortgage | With Mortgage |
| Less than $800 | 20 (27.8%) | 0 (0.0%) |
| $800 to $1,499 | 30 (41.7%) | 8 (8.1%) |
| $800 to $1,499 | 22 (30.6%) | 49 (49.5%) |
| Total | 72 (100.0%) | 99 (100.0%) |
Health & Disability in Cowley
Health Insurance Coverage by Age in Cowley
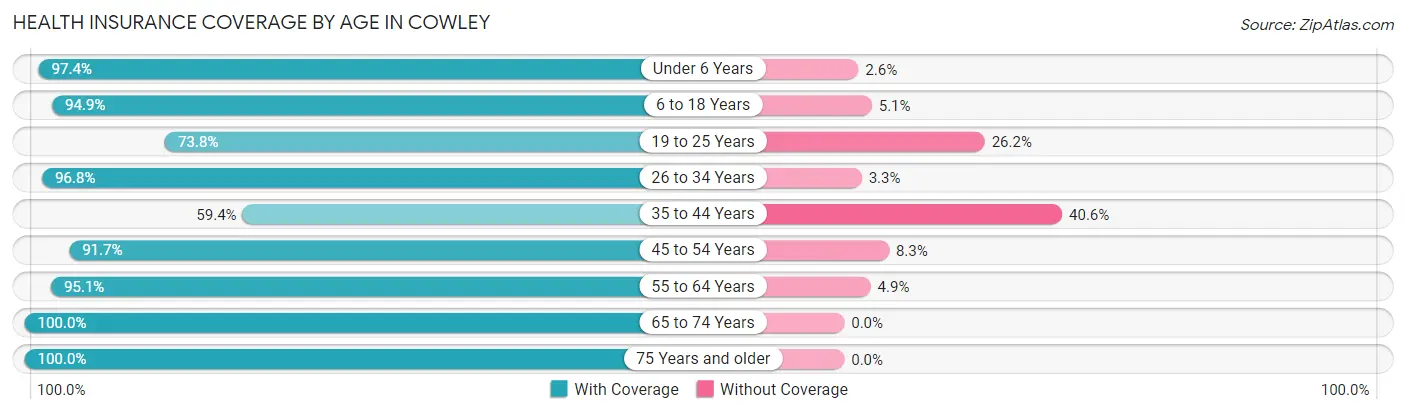
| Age Bracket | With Coverage | Without Coverage |
| Under 6 Years | 111 (97.4%) | 3 (2.6%) |
| 6 to 18 Years | 111 (94.9%) | 6 (5.1%) |
| 19 to 25 Years | 31 (73.8%) | 11 (26.2%) |
| 26 to 34 Years | 119 (96.8%) | 4 (3.3%) |
| 35 to 44 Years | 38 (59.4%) | 26 (40.6%) |
| 45 to 54 Years | 33 (91.7%) | 3 (8.3%) |
| 55 to 64 Years | 58 (95.1%) | 3 (4.9%) |
| 65 to 74 Years | 94 (100.0%) | 0 (0.0%) |
| 75 Years and older | 17 (100.0%) | 0 (0.0%) |
| Total | 612 (91.6%) | 56 (8.4%) |
Health Insurance Coverage by Citizenship Status in Cowley
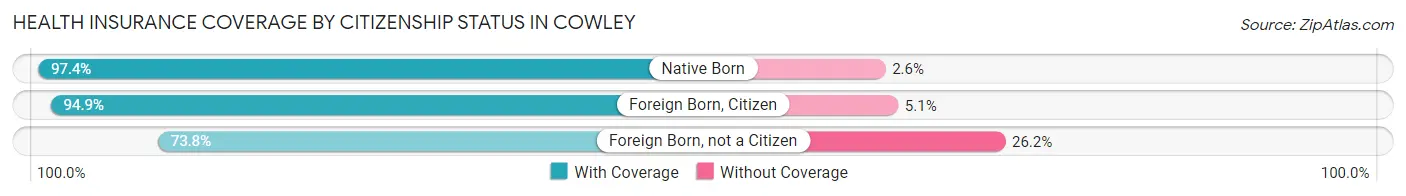
| Citizenship Status | With Coverage | Without Coverage |
| Native Born | 111 (97.4%) | 3 (2.6%) |
| Foreign Born, Citizen | 111 (94.9%) | 6 (5.1%) |
| Foreign Born, not a Citizen | 31 (73.8%) | 11 (26.2%) |
Health Insurance Coverage by Household Income in Cowley
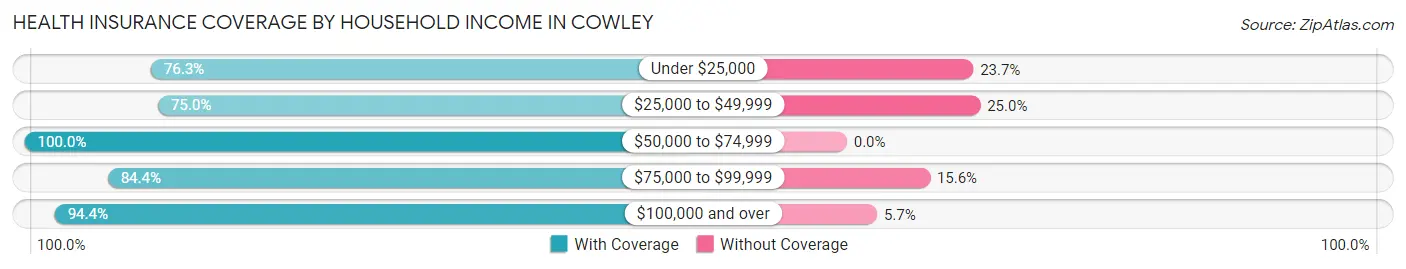
| Household Income | With Coverage | Without Coverage |
| Under $25,000 | 87 (76.3%) | 27 (23.7%) |
| $25,000 to $49,999 | 21 (75.0%) | 7 (25.0%) |
| $50,000 to $74,999 | 272 (100.0%) | 0 (0.0%) |
| $75,000 to $99,999 | 65 (84.4%) | 12 (15.6%) |
| $100,000 and over | 167 (94.4%) | 10 (5.7%) |
Public vs Private Health Insurance Coverage by Age in Cowley
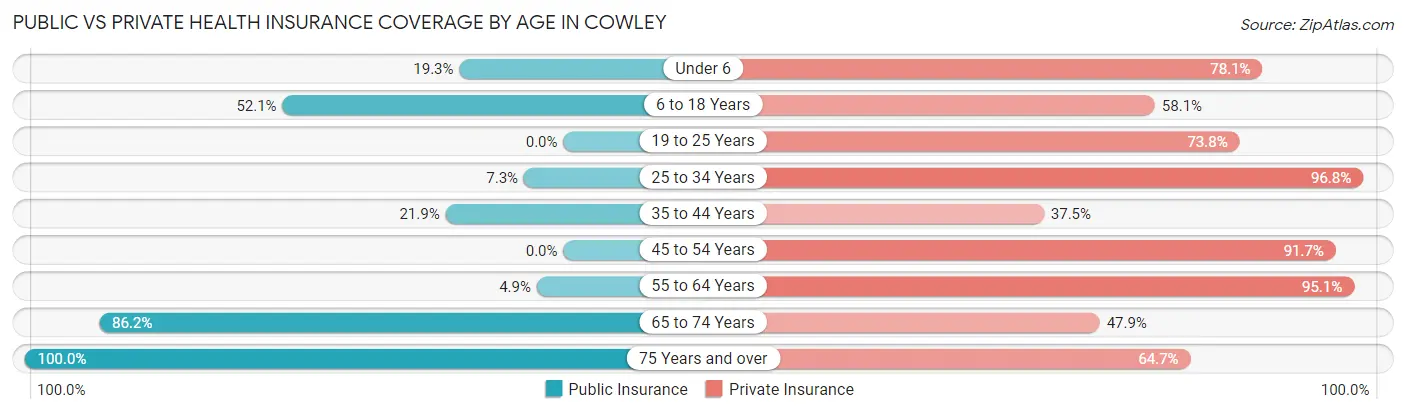
| Age Bracket | Public Insurance | Private Insurance |
| Under 6 | 22 (19.3%) | 89 (78.1%) |
| 6 to 18 Years | 61 (52.1%) | 68 (58.1%) |
| 19 to 25 Years | 0 (0.0%) | 31 (73.8%) |
| 25 to 34 Years | 9 (7.3%) | 119 (96.8%) |
| 35 to 44 Years | 14 (21.9%) | 24 (37.5%) |
| 45 to 54 Years | 0 (0.0%) | 33 (91.7%) |
| 55 to 64 Years | 3 (4.9%) | 58 (95.1%) |
| 65 to 74 Years | 81 (86.2%) | 45 (47.9%) |
| 75 Years and over | 17 (100.0%) | 11 (64.7%) |
| Total | 207 (31.0%) | 478 (71.6%) |
Disability Status by Sex by Age in Cowley
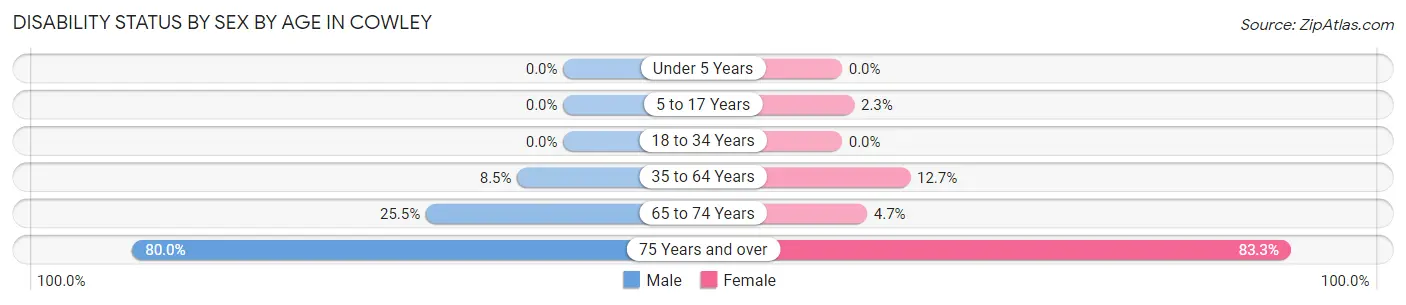
| Age Bracket | Male | Female |
| Under 5 Years | 0 (0.0%) | 0 (0.0%) |
| 5 to 17 Years | 0 (0.0%) | 2 (2.3%) |
| 18 to 34 Years | 0 (0.0%) | 0 (0.0%) |
| 35 to 64 Years | 7 (8.5%) | 10 (12.7%) |
| 65 to 74 Years | 13 (25.5%) | 2 (4.6%) |
| 75 Years and over | 4 (80.0%) | 10 (83.3%) |
Disability Class by Sex by Age in Cowley
Disability Class: Hearing Difficulty
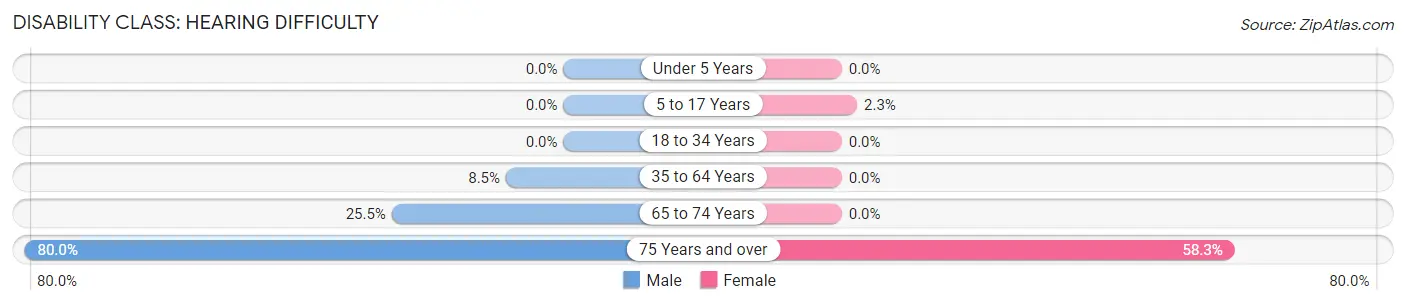
| Age Bracket | Male | Female |
| Under 5 Years | 0 (0.0%) | 0 (0.0%) |
| 5 to 17 Years | 0 (0.0%) | 2 (2.3%) |
| 18 to 34 Years | 0 (0.0%) | 0 (0.0%) |
| 35 to 64 Years | 7 (8.5%) | 0 (0.0%) |
| 65 to 74 Years | 13 (25.5%) | 0 (0.0%) |
| 75 Years and over | 4 (80.0%) | 7 (58.3%) |
Disability Class: Vision Difficulty
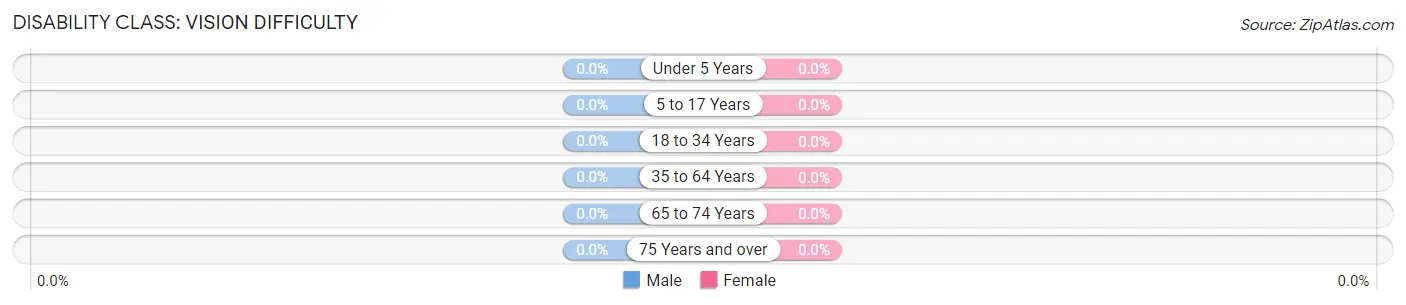
| Age Bracket | Male | Female |
| Under 5 Years | 0 (0.0%) | 0 (0.0%) |
| 5 to 17 Years | 0 (0.0%) | 0 (0.0%) |
| 18 to 34 Years | 0 (0.0%) | 0 (0.0%) |
| 35 to 64 Years | 0 (0.0%) | 0 (0.0%) |
| 65 to 74 Years | 0 (0.0%) | 0 (0.0%) |
| 75 Years and over | 0 (0.0%) | 0 (0.0%) |
Disability Class: Cognitive Difficulty
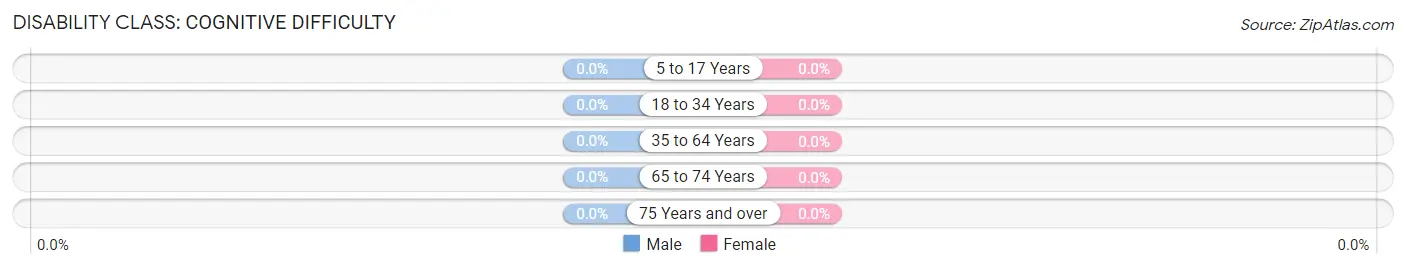
| Age Bracket | Male | Female |
| 5 to 17 Years | 0 (0.0%) | 0 (0.0%) |
| 18 to 34 Years | 0 (0.0%) | 0 (0.0%) |
| 35 to 64 Years | 0 (0.0%) | 0 (0.0%) |
| 65 to 74 Years | 0 (0.0%) | 0 (0.0%) |
| 75 Years and over | 0 (0.0%) | 0 (0.0%) |
Disability Class: Ambulatory Difficulty
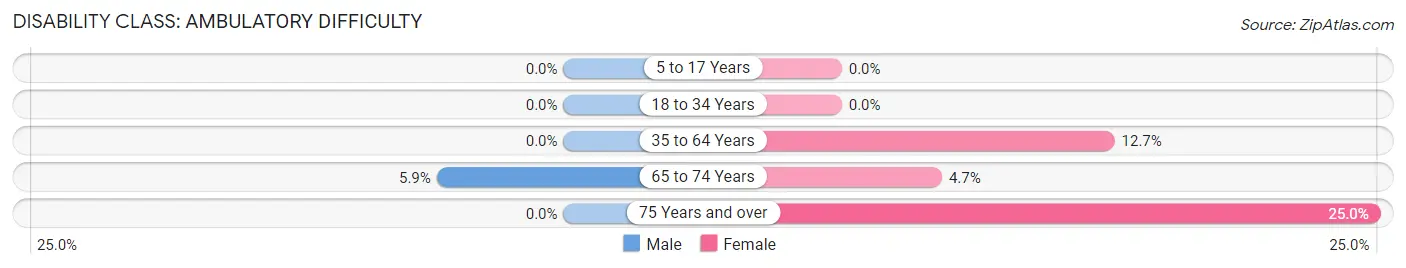
| Age Bracket | Male | Female |
| 5 to 17 Years | 0 (0.0%) | 0 (0.0%) |
| 18 to 34 Years | 0 (0.0%) | 0 (0.0%) |
| 35 to 64 Years | 0 (0.0%) | 10 (12.7%) |
| 65 to 74 Years | 3 (5.9%) | 2 (4.6%) |
| 75 Years and over | 0 (0.0%) | 3 (25.0%) |
Disability Class: Self-Care Difficulty
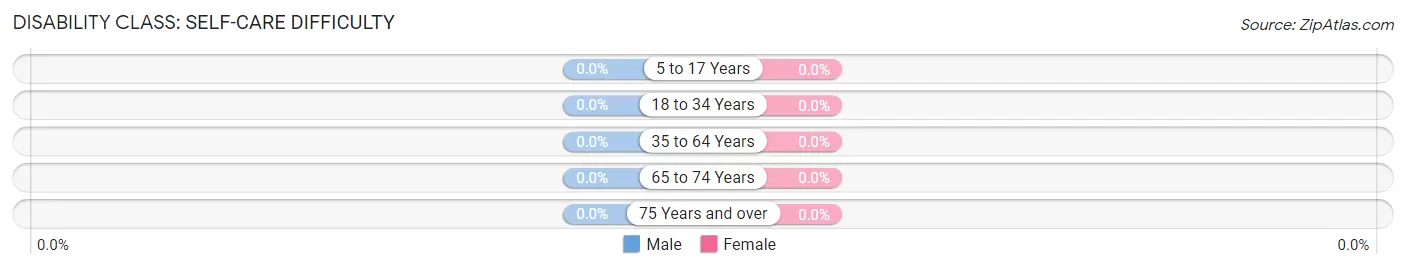
| Age Bracket | Male | Female |
| 5 to 17 Years | 0 (0.0%) | 0 (0.0%) |
| 18 to 34 Years | 0 (0.0%) | 0 (0.0%) |
| 35 to 64 Years | 0 (0.0%) | 0 (0.0%) |
| 65 to 74 Years | 0 (0.0%) | 0 (0.0%) |
| 75 Years and over | 0 (0.0%) | 0 (0.0%) |
Technology Access in Cowley
Computing Device Access in Cowley
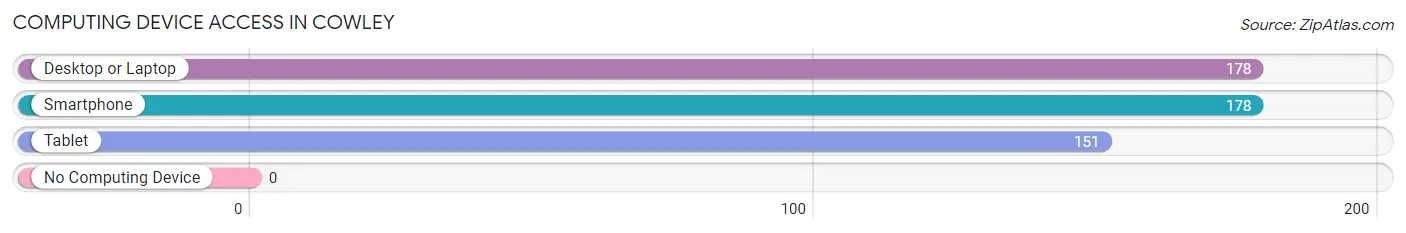
| Device Type | # Households | % Households |
| Desktop or Laptop | 178 | 92.7% |
| Smartphone | 178 | 92.7% |
| Tablet | 151 | 78.6% |
| No Computing Device | 0 | 0.0% |
| Total | 192 | 100.0% |
Internet Access in Cowley
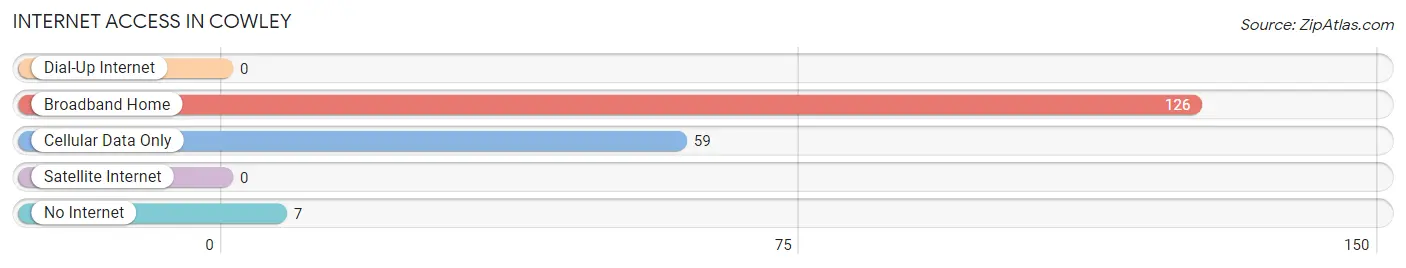
| Internet Type | # Households | % Households |
| Dial-Up Internet | 0 | 0.0% |
| Broadband Home | 126 | 65.6% |
| Cellular Data Only | 59 | 30.7% |
| Satellite Internet | 0 | 0.0% |
| No Internet | 7 | 3.6% |
| Total | 192 | 100.0% |
Cowley Summary
Cowley, Wyoming is a small town located in the Big Horn Basin of the Rocky Mountains. It is situated in the northern part of the state, about 25 miles south of the Montana border. The town was founded in 1884 and has a population of approximately 500 people.
The geography of Cowley is characterized by its mountainous terrain and its proximity to the Big Horn River. The town is situated at an elevation of 4,890 feet and is surrounded by the Big Horn Mountains to the east and the Absaroka Range to the west. The Big Horn River runs through the town, providing a source of irrigation for the local farms and ranches. The climate in Cowley is semi-arid, with hot summers and cold winters.
The economy of Cowley is largely based on agriculture and ranching. The town is home to several large ranches, which produce beef, sheep, and hay. The local farms produce a variety of crops, including wheat, barley, and alfalfa. The town also has a small manufacturing sector, which produces a variety of products, including furniture, clothing, and leather goods.
The demographics of Cowley are largely homogeneous. The majority of the population is white, with a small percentage of Native Americans and Hispanics. The median household income is approximately $35,000, and the median age is 38. The town has a low unemployment rate, and the majority of the population is employed in the agricultural and ranching industries.
Cowley is a small, rural town with a rich history and a strong sense of community. The town is home to a variety of local businesses, including restaurants, shops, and a movie theater. The town also has a number of recreational activities, including fishing, hunting, and camping. The town is also home to a variety of cultural events, including the annual Cowley County Fair.
Cowley is a unique and vibrant community that offers its residents a variety of opportunities for work, recreation, and entertainment. The town is a great place to live, work, and raise a family.
Common Questions
What is Per Capita Income in Cowley?
Per Capita income in Cowley is $27,403.
What is the Median Family Income in Cowley?
Median Family Income in Cowley is $74,911.
What is the Median Household income in Cowley?
Median Household Income in Cowley is $73,214.
What is Income or Wage Gap in Cowley?
Income or Wage Gap in Cowley is 71.7%.
Women in Cowley earn 28.3 cents for every dollar earned by a man.
What is Inequality or Gini Index in Cowley?
Inequality or Gini Index in Cowley is 0.36.
What is the Total Population of Cowley?
Total Population of Cowley is 668.
What is the Total Male Population of Cowley?
Total Male Population of Cowley is 289.
What is the Total Female Population of Cowley?
Total Female Population of Cowley is 379.
What is the Ratio of Males per 100 Females in Cowley?
There are 76.25 Males per 100 Females in Cowley.
What is the Ratio of Females per 100 Males in Cowley?
There are 131.14 Females per 100 Males in Cowley.
What is the Median Population Age in Cowley?
Median Population Age in Cowley is 31.0 Years.
What is the Average Family Size in Cowley
Average Family Size in Cowley is 3.8 People.
What is the Average Household Size in Cowley
Average Household Size in Cowley is 3.5 People.
How Large is the Labor Force in Cowley?
There are 282 People in the Labor Forcein in Cowley.
What is the Percentage of People in the Labor Force in Cowley?
61.4% of People are in the Labor Force in Cowley.
What is the Unemployment Rate in Cowley?
Unemployment Rate in Cowley is 3.2%.