Chugwater, WY Map & Demographics
Chugwater Map
Chugwater Overview
$31,164
PER CAPITA INCOME
$63,725
AVG FAMILY INCOME
$63,309
AVG HOUSEHOLD INCOME
0.20
INEQUALITY / GINI INDEX
196
TOTAL POPULATION
112
MALE POPULATION
84
FEMALE POPULATION
133.33
MALES / 100 FEMALES
75.00
FEMALES / 100 MALES
69.5
MEDIAN AGE
2.0
AVG FAMILY SIZE
1.8
AVG HOUSEHOLD SIZE
72
LABOR FORCE [ PEOPLE ]
41.4%
PERCENT IN LABOR FORCE
2.8%
UNEMPLOYMENT RATE
Chugwater Zip Codes
Chugwater Area Codes
Income in Chugwater
Income Overview in Chugwater
Per Capita Income in Chugwater is $31,164, while median incomes of families and households are $63,725 and $63,309 respectively.
| Characteristic | Number | Measure |
| Per Capita Income | 196 | $31,164 |
| Median Family Income | 90 | $63,725 |
| Mean Family Income | 90 | $69,037 |
| Median Household Income | 107 | $63,309 |
| Mean Household Income | 107 | $62,374 |
| Income Deficit | 90 | $0 |
| Wage / Income Gap (%) | 196 | 0.00% |
| Wage / Income Gap ($) | 196 | 100.00¢ per $1 |
| Gini / Inequality Index | 196 | 0.20 |
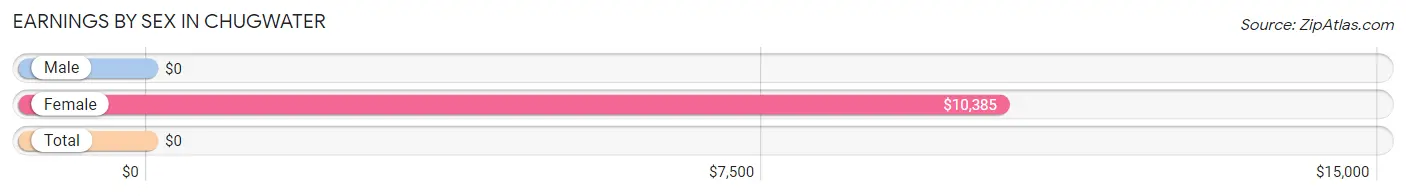
Earnings by Sex in Chugwater
| Sex | Number | Average Earnings |
| Male | 42 (42.9%) | $0 |
| Female | 56 (57.1%) | $10,385 |
| Total | 98 (100.0%) | $0 |
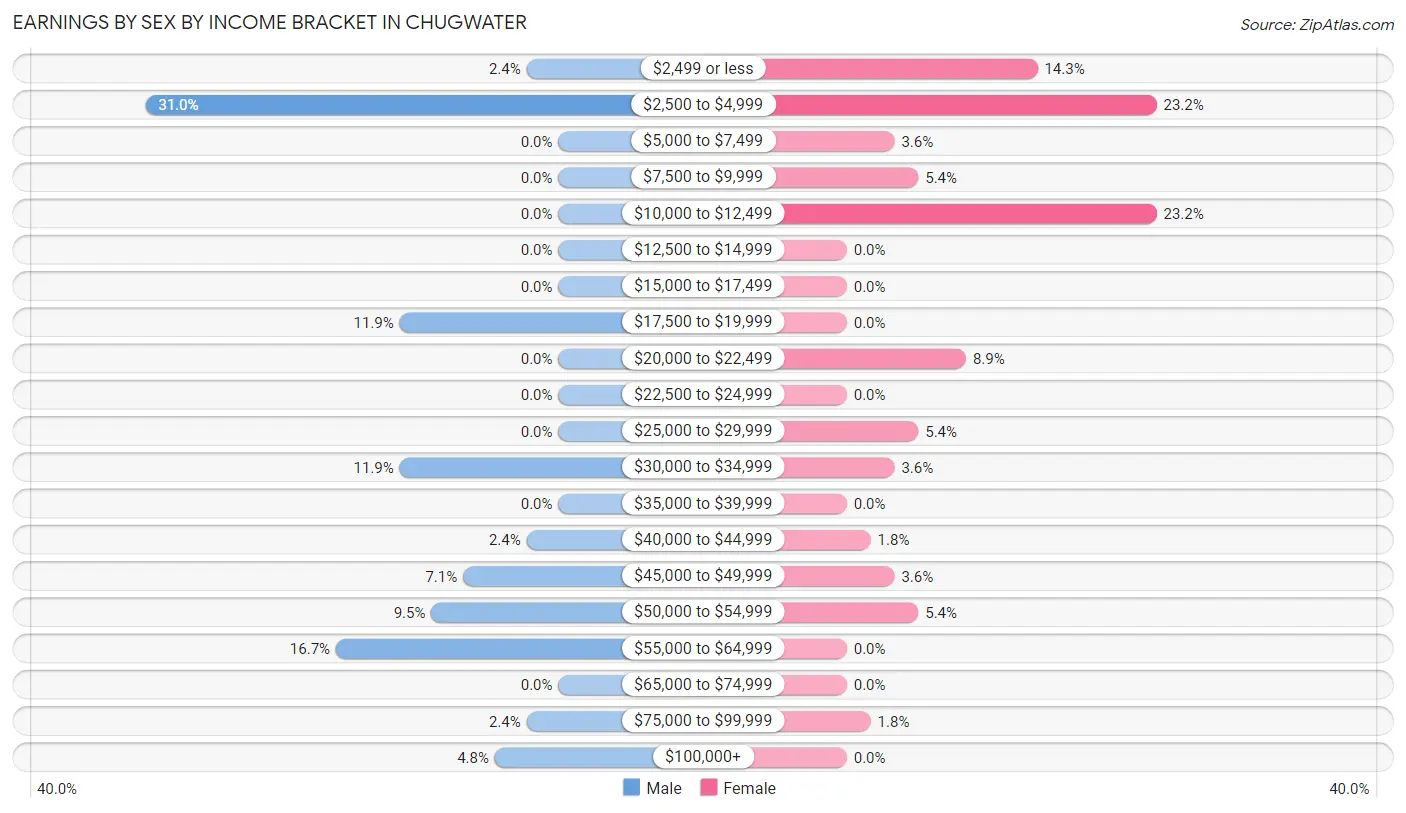
Earnings by Sex by Income Bracket in Chugwater
The most common earnings brackets in Chugwater are $2,500 to $4,999 for men (13 | 30.9%) and $2,500 to $4,999 for women (13 | 23.2%).
| Income | Male | Female |
| $2,499 or less | 1 (2.4%) | 8 (14.3%) |
| $2,500 to $4,999 | 13 (30.9%) | 13 (23.2%) |
| $5,000 to $7,499 | 0 (0.0%) | 2 (3.6%) |
| $7,500 to $9,999 | 0 (0.0%) | 3 (5.4%) |
| $10,000 to $12,499 | 0 (0.0%) | 13 (23.2%) |
| $12,500 to $14,999 | 0 (0.0%) | 0 (0.0%) |
| $15,000 to $17,499 | 0 (0.0%) | 0 (0.0%) |
| $17,500 to $19,999 | 5 (11.9%) | 0 (0.0%) |
| $20,000 to $22,499 | 0 (0.0%) | 5 (8.9%) |
| $22,500 to $24,999 | 0 (0.0%) | 0 (0.0%) |
| $25,000 to $29,999 | 0 (0.0%) | 3 (5.4%) |
| $30,000 to $34,999 | 5 (11.9%) | 2 (3.6%) |
| $35,000 to $39,999 | 0 (0.0%) | 0 (0.0%) |
| $40,000 to $44,999 | 1 (2.4%) | 1 (1.8%) |
| $45,000 to $49,999 | 3 (7.1%) | 2 (3.6%) |
| $50,000 to $54,999 | 4 (9.5%) | 3 (5.4%) |
| $55,000 to $64,999 | 7 (16.7%) | 0 (0.0%) |
| $65,000 to $74,999 | 0 (0.0%) | 0 (0.0%) |
| $75,000 to $99,999 | 1 (2.4%) | 1 (1.8%) |
| $100,000+ | 2 (4.8%) | 0 (0.0%) |
| Total | 42 (100.0%) | 56 (100.0%) |
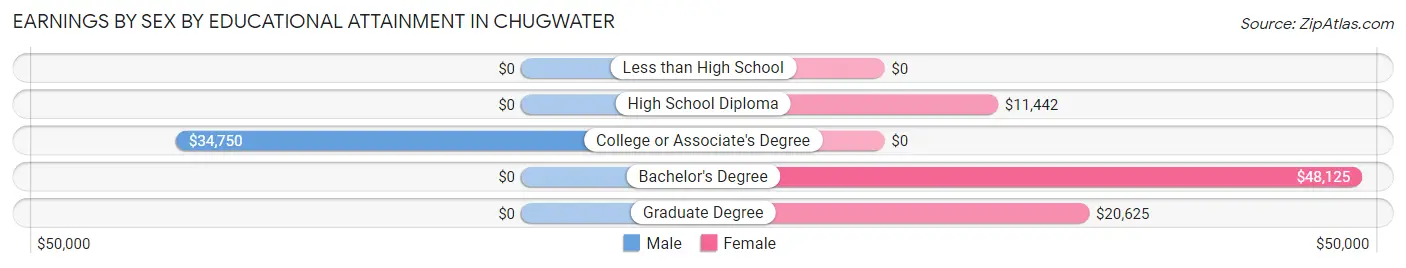
Earnings by Sex by Educational Attainment in Chugwater
| Educational Attainment | Male Income | Female Income |
| Less than High School | - | - |
| High School Diploma | - | - |
| College or Associate's Degree | $34,750 | $0 |
| Bachelor's Degree | - | - |
| Graduate Degree | - | - |
| Total | - | - |
Family Income in Chugwater
Family Income Brackets in Chugwater
According to the Chugwater family income data, there are 75 families falling into the $50,000 to $74,999 income range, which is the most common income bracket and makes up 83.3% of all families.
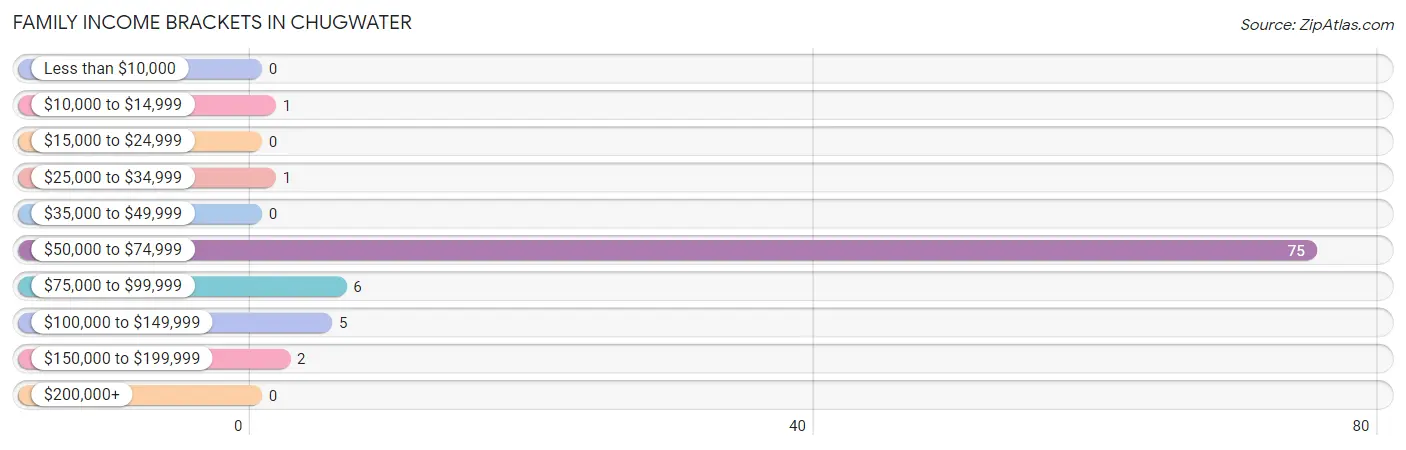
| Income Bracket | # Families | % Families |
| Less than $10,000 | 0 | 0.0% |
| $10,000 to $14,999 | 1 | 1.1% |
| $15,000 to $24,999 | 0 | 0.0% |
| $25,000 to $34,999 | 1 | 1.1% |
| $35,000 to $49,999 | 0 | 0.0% |
| $50,000 to $74,999 | 75 | 83.3% |
| $75,000 to $99,999 | 6 | 6.7% |
| $100,000 to $149,999 | 5 | 5.6% |
| $150,000 to $199,999 | 2 | 2.2% |
| $200,000+ | 0 | 0.0% |
Family Income by Famaliy Size in Chugwater
4-person families (6 | 6.7%) account for the highest median family income in Chugwater with $86,250 per family, while 2-person families (72 | 80.0%) have the highest median income of $31,888 per family member.
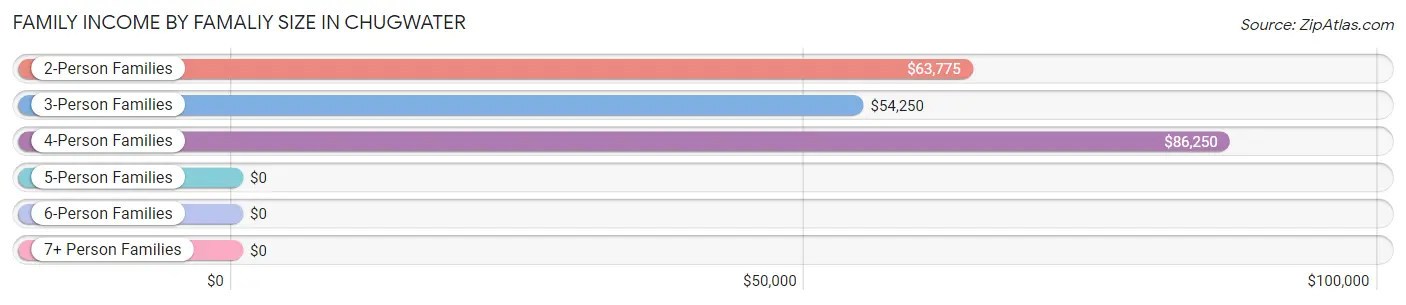
| Income Bracket | # Families | Median Income |
| 2-Person Families | 72 (80.0%) | $63,775 |
| 3-Person Families | 9 (10.0%) | $54,250 |
| 4-Person Families | 6 (6.7%) | $86,250 |
| 5-Person Families | 3 (3.3%) | $0 |
| 6-Person Families | 0 (0.0%) | $0 |
| 7+ Person Families | 0 (0.0%) | $0 |
| Total | 90 (100.0%) | $63,725 |
Family Income by Number of Earners in Chugwater
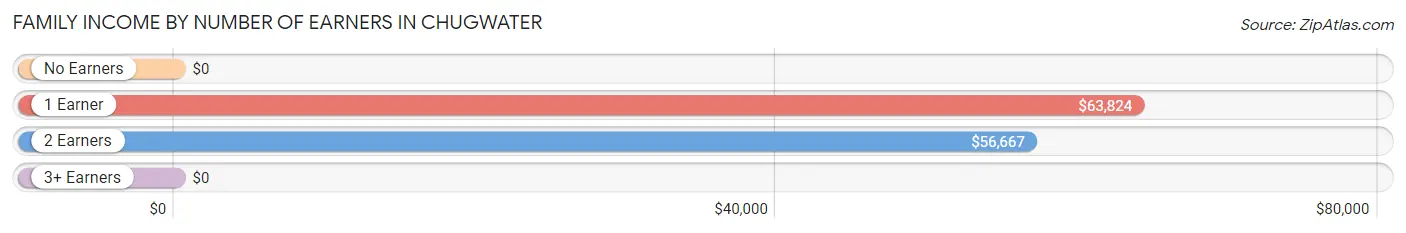
| Number of Earners | # Families | Median Income |
| No Earners | 0 (0.0%) | $0 |
| 1 Earner | 58 (64.4%) | $63,824 |
| 2 Earners | 30 (33.3%) | $56,667 |
| 3+ Earners | 2 (2.2%) | $0 |
| Total | 90 (100.0%) | $63,725 |
Household Income in Chugwater
Household Income Brackets in Chugwater
With 75 households falling in the category, the $50,000 to $74,999 income range is the most frequent in Chugwater, accounting for 70.1% of all households.
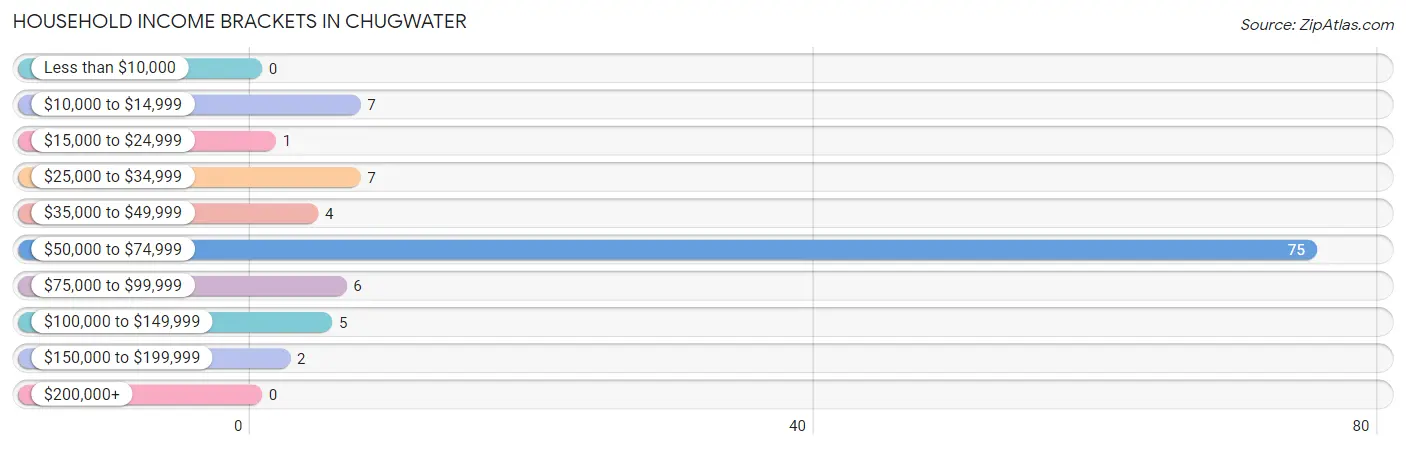
| Income Bracket | # Households | % Households |
| Less than $10,000 | 0 | 0.0% |
| $10,000 to $14,999 | 7 | 6.5% |
| $15,000 to $24,999 | 1 | 0.9% |
| $25,000 to $34,999 | 7 | 6.5% |
| $35,000 to $49,999 | 4 | 3.7% |
| $50,000 to $74,999 | 75 | 70.1% |
| $75,000 to $99,999 | 6 | 5.6% |
| $100,000 to $149,999 | 5 | 4.7% |
| $150,000 to $199,999 | 2 | 1.9% |
| $200,000+ | 0 | 0.0% |
Household Income by Householder Age in Chugwater
The median household income in Chugwater is $63,309, with the highest median household income of $83,125 found in the 25 to 44 years age bracket for the primary householder. A total of 15 households (14.0%) fall into this category. Meanwhile, the 15 to 24 years age bracket for the primary householder has the lowest median household income of $0, with 1 households (0.9%) in this group.
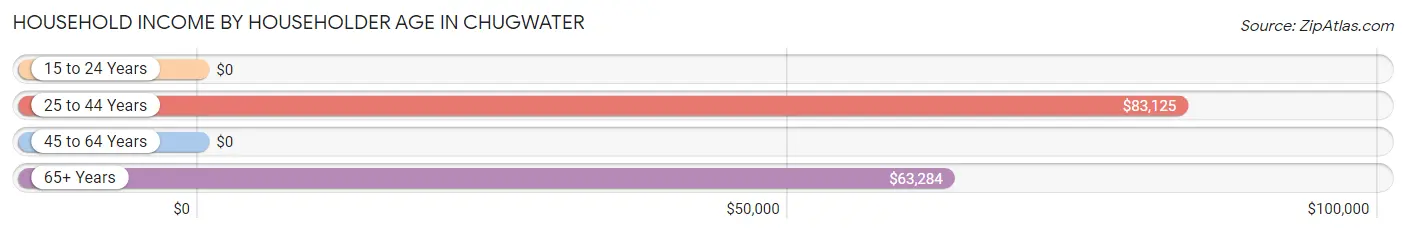
| Income Bracket | # Households | Median Income |
| 15 to 24 Years | 1 (0.9%) | $0 |
| 25 to 44 Years | 15 (14.0%) | $83,125 |
| 45 to 64 Years | 11 (10.3%) | $0 |
| 65+ Years | 80 (74.8%) | $63,284 |
| Total | 107 (100.0%) | $63,309 |
Poverty in Chugwater
Income Below Poverty by Sex and Age in Chugwater
With 8.0% poverty level for males and 3.6% for females among the residents of Chugwater, under 5 year old males and 18 to 24 year old females are the most vulnerable to poverty, with 2 males (66.7%) and 1 females (50.0%) in their respective age groups living below the poverty level.
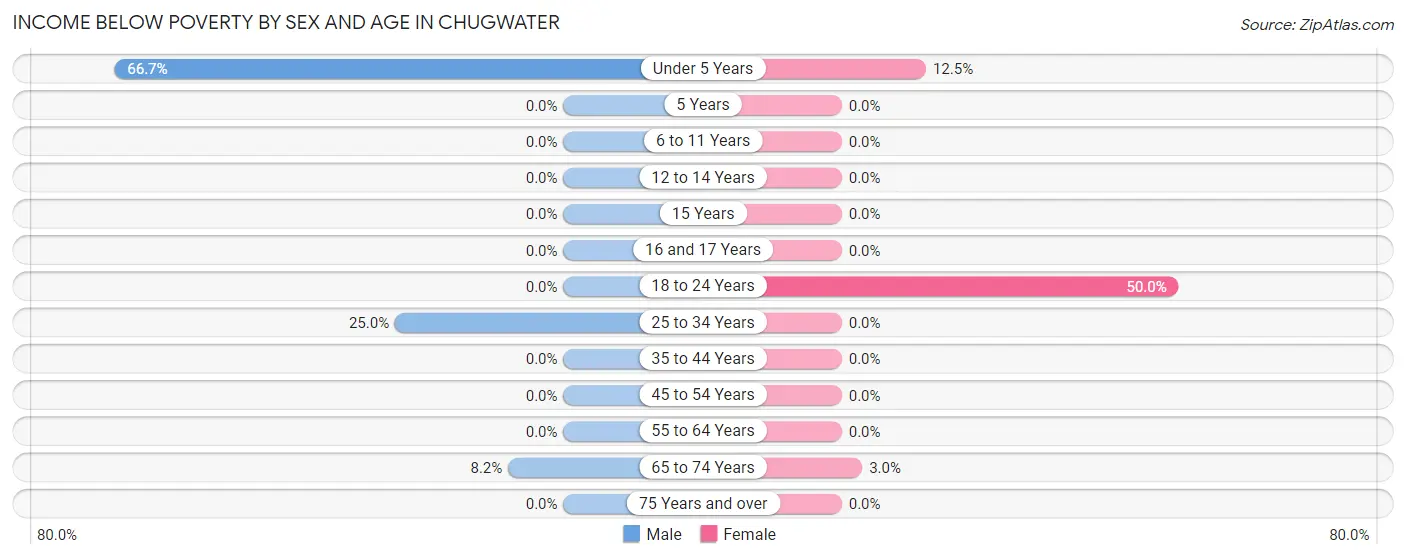
| Age Bracket | Male | Female |
| Under 5 Years | 2 (66.7%) | 1 (12.5%) |
| 5 Years | 0 (0.0%) | 0 (0.0%) |
| 6 to 11 Years | 0 (0.0%) | 0 (0.0%) |
| 12 to 14 Years | 0 (0.0%) | 0 (0.0%) |
| 15 Years | 0 (0.0%) | 0 (0.0%) |
| 16 and 17 Years | 0 (0.0%) | 0 (0.0%) |
| 18 to 24 Years | 0 (0.0%) | 1 (50.0%) |
| 25 to 34 Years | 2 (25.0%) | 0 (0.0%) |
| 35 to 44 Years | 0 (0.0%) | 0 (0.0%) |
| 45 to 54 Years | 0 (0.0%) | 0 (0.0%) |
| 55 to 64 Years | 0 (0.0%) | 0 (0.0%) |
| 65 to 74 Years | 5 (8.2%) | 1 (3.0%) |
| 75 Years and over | 0 (0.0%) | 0 (0.0%) |
| Total | 9 (8.0%) | 3 (3.6%) |
Income Above Poverty by Sex and Age in Chugwater
According to the poverty statistics in Chugwater, males aged 6 to 11 years and females aged 5 years are the age groups that are most secure financially, with 100.0% of males and 100.0% of females in these age groups living above the poverty line.
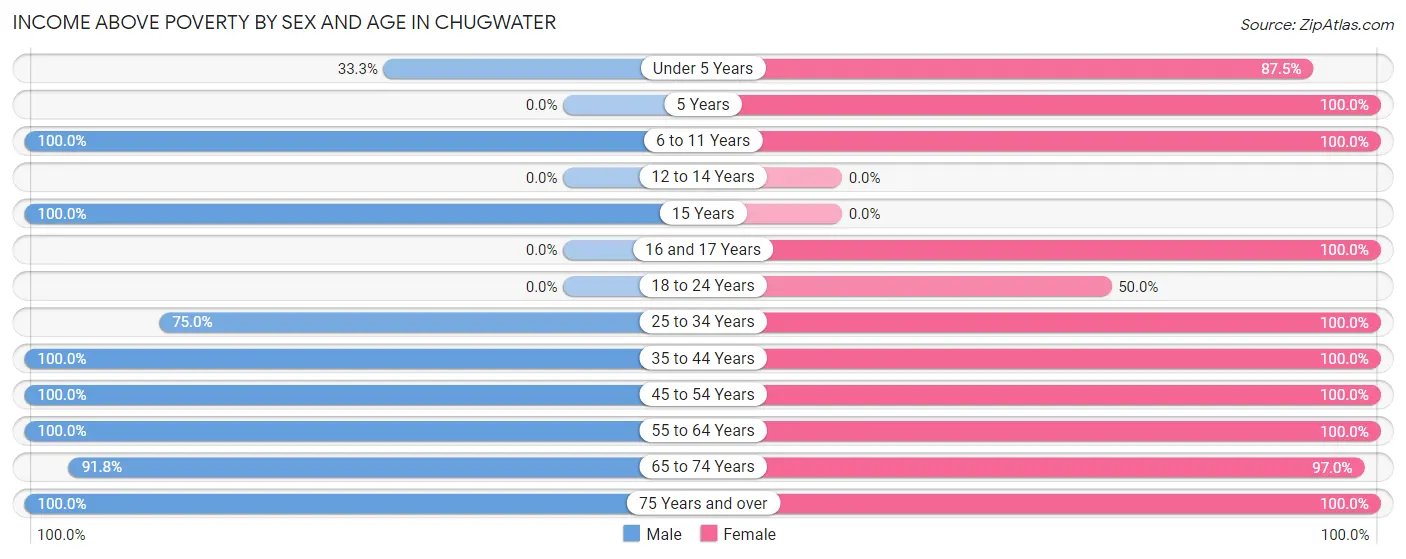
| Age Bracket | Male | Female |
| Under 5 Years | 1 (33.3%) | 7 (87.5%) |
| 5 Years | 0 (0.0%) | 2 (100.0%) |
| 6 to 11 Years | 4 (100.0%) | 3 (100.0%) |
| 12 to 14 Years | 0 (0.0%) | 0 (0.0%) |
| 15 Years | 2 (100.0%) | 0 (0.0%) |
| 16 and 17 Years | 0 (0.0%) | 8 (100.0%) |
| 18 to 24 Years | 0 (0.0%) | 1 (50.0%) |
| 25 to 34 Years | 6 (75.0%) | 7 (100.0%) |
| 35 to 44 Years | 7 (100.0%) | 3 (100.0%) |
| 45 to 54 Years | 3 (100.0%) | 3 (100.0%) |
| 55 to 64 Years | 10 (100.0%) | 11 (100.0%) |
| 65 to 74 Years | 56 (91.8%) | 32 (97.0%) |
| 75 Years and over | 14 (100.0%) | 4 (100.0%) |
| Total | 103 (92.0%) | 81 (96.4%) |
Income Below Poverty Among Married-Couple Families in Chugwater
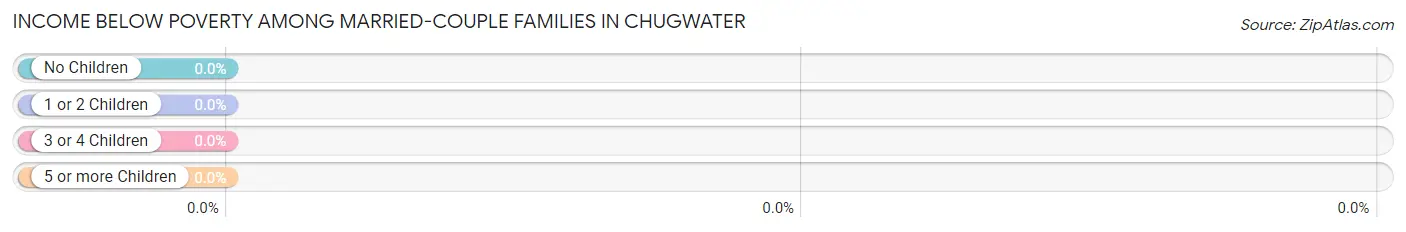
| Children | Above Poverty | Below Poverty |
| No Children | 73 (100.0%) | 0 (0.0%) |
| 1 or 2 Children | 11 (100.0%) | 0 (0.0%) |
| 3 or 4 Children | 3 (100.0%) | 0 (0.0%) |
| 5 or more Children | 0 (0.0%) | 0 (0.0%) |
| Total | 87 (100.0%) | 0 (0.0%) |
Income Below Poverty Among Single-Parent Households in Chugwater
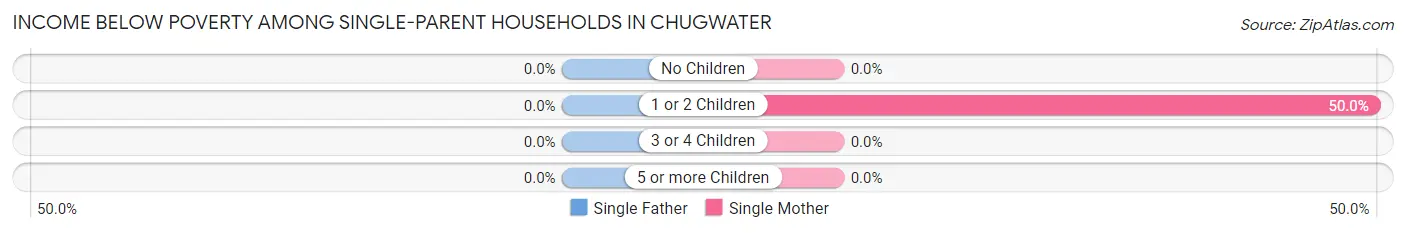
| Children | Single Father | Single Mother |
| No Children | 0 (0.0%) | 0 (0.0%) |
| 1 or 2 Children | 0 (0.0%) | 1 (50.0%) |
| 3 or 4 Children | 0 (0.0%) | 0 (0.0%) |
| 5 or more Children | 0 (0.0%) | 0 (0.0%) |
| Total | 0 (0.0%) | 1 (33.3%) |
Income Below Poverty Among Married-Couple vs Single-Parent Households in Chugwater
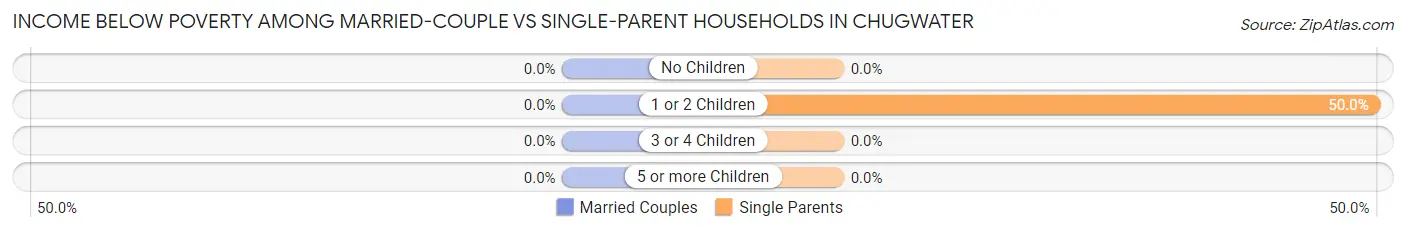
| Children | Married-Couple Families | Single-Parent Households |
| No Children | 0 (0.0%) | 0 (0.0%) |
| 1 or 2 Children | 0 (0.0%) | 1 (50.0%) |
| 3 or 4 Children | 0 (0.0%) | 0 (0.0%) |
| 5 or more Children | 0 (0.0%) | 0 (0.0%) |
| Total | 0 (0.0%) | 1 (33.3%) |
Race in Chugwater
The most populous races in Chugwater are White / Caucasian (192 | 98.0%), and Two or more Races (4 | 2.0%).
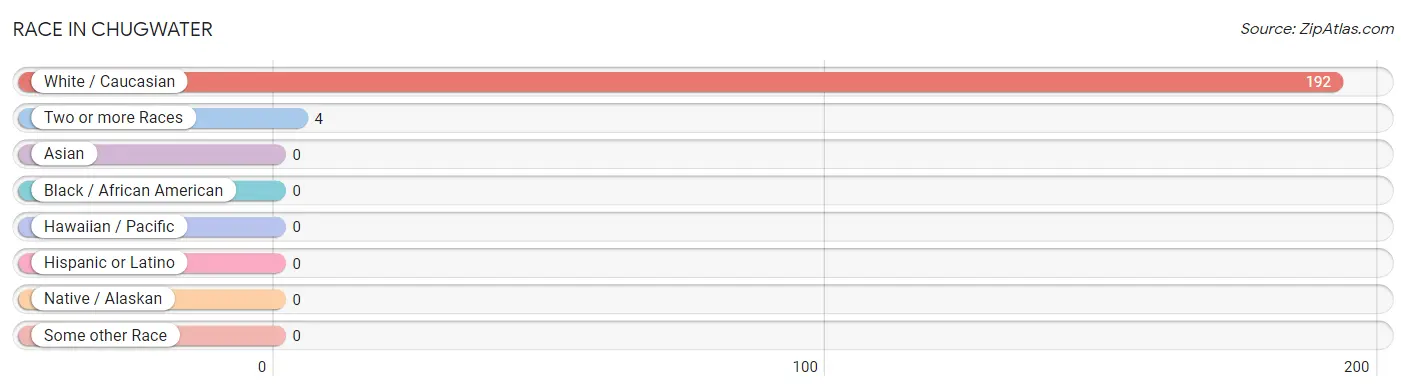
| Race | # Population | % Population |
| Asian | 0 | 0.0% |
| Black / African American | 0 | 0.0% |
| Hawaiian / Pacific | 0 | 0.0% |
| Hispanic or Latino | 0 | 0.0% |
| Native / Alaskan | 0 | 0.0% |
| White / Caucasian | 192 | 98.0% |
| Two or more Races | 4 | 2.0% |
| Some other Race | 0 | 0.0% |
| Total | 196 | 100.0% |
Ancestry in Chugwater
The most populous ancestries reported in Chugwater are German (51 | 26.0%), English (19 | 9.7%), Irish (17 | 8.7%), Dutch (13 | 6.6%), and Swedish (9 | 4.6%), together accounting for 55.6% of all Chugwater residents.
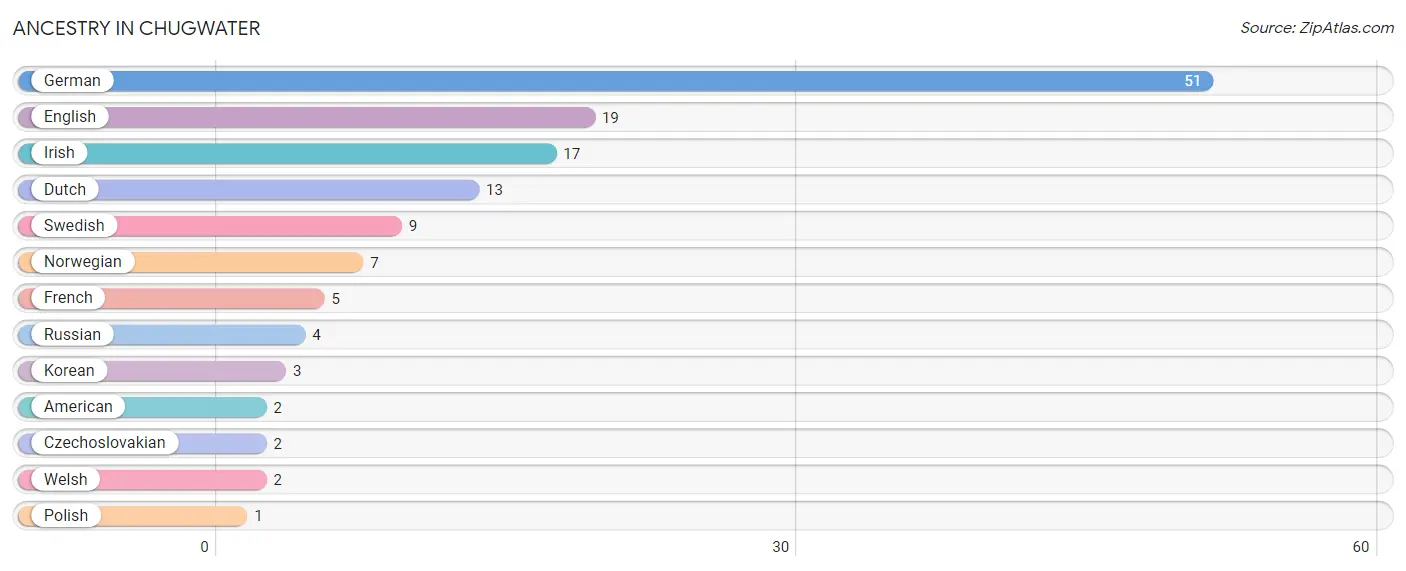
| Ancestry | # Population | % Population |
| American | 2 | 1.0% |
| Czechoslovakian | 2 | 1.0% |
| Dutch | 13 | 6.6% |
| English | 19 | 9.7% |
| French | 5 | 2.5% |
| German | 51 | 26.0% |
| Irish | 17 | 8.7% |
| Korean | 3 | 1.5% |
| Norwegian | 7 | 3.6% |
| Polish | 1 | 0.5% |
| Russian | 4 | 2.0% |
| Swedish | 9 | 4.6% |
| Welsh | 2 | 1.0% | View All 13 Rows |
Immigrants in Chugwater

| Immigration Origin | # Population | % Population | View All 0 Rows |
Sex and Age in Chugwater
Sex and Age in Chugwater
The most populous age groups in Chugwater are 70 to 74 Years (56 | 50.0%) for men and 65 to 69 Years (20 | 23.8%) for women.
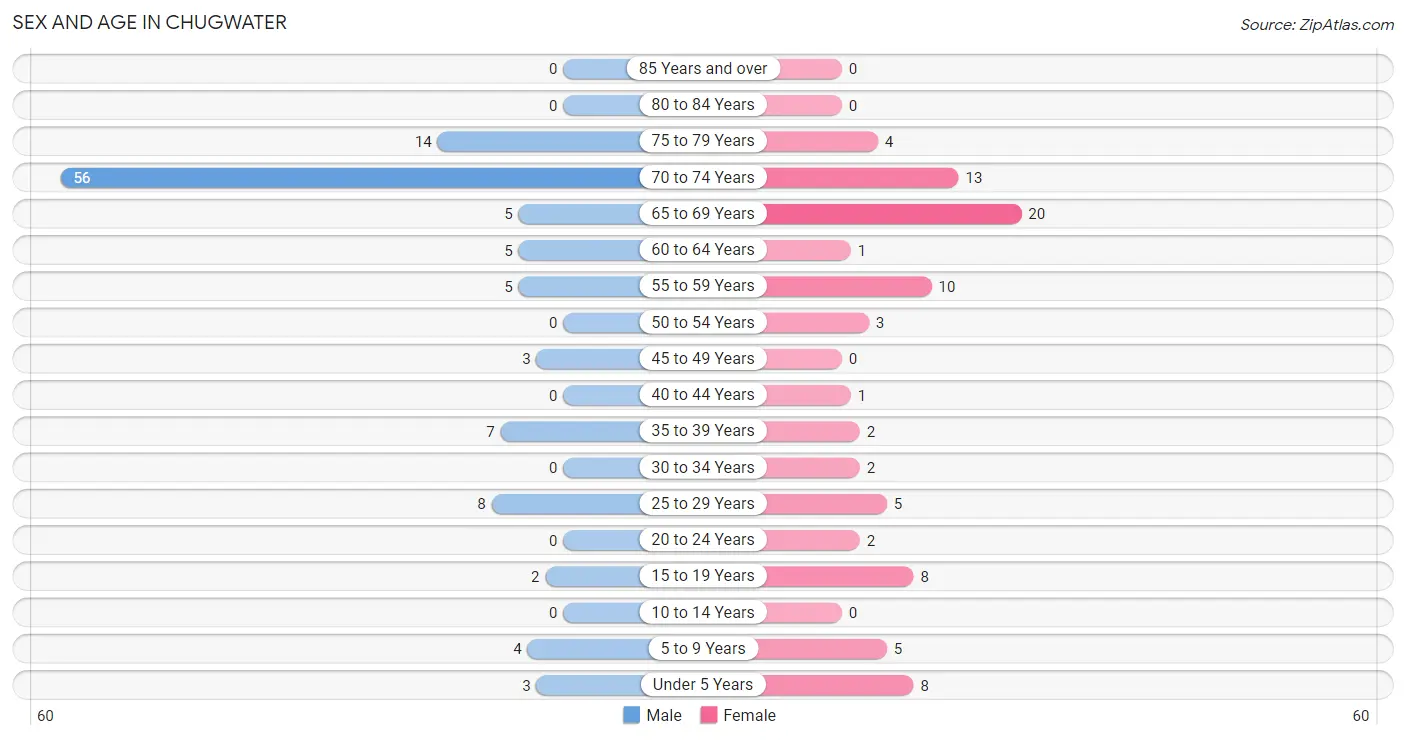
| Age Bracket | Male | Female |
| Under 5 Years | 3 (2.7%) | 8 (9.5%) |
| 5 to 9 Years | 4 (3.6%) | 5 (5.9%) |
| 10 to 14 Years | 0 (0.0%) | 0 (0.0%) |
| 15 to 19 Years | 2 (1.8%) | 8 (9.5%) |
| 20 to 24 Years | 0 (0.0%) | 2 (2.4%) |
| 25 to 29 Years | 8 (7.1%) | 5 (5.9%) |
| 30 to 34 Years | 0 (0.0%) | 2 (2.4%) |
| 35 to 39 Years | 7 (6.2%) | 2 (2.4%) |
| 40 to 44 Years | 0 (0.0%) | 1 (1.2%) |
| 45 to 49 Years | 3 (2.7%) | 0 (0.0%) |
| 50 to 54 Years | 0 (0.0%) | 3 (3.6%) |
| 55 to 59 Years | 5 (4.5%) | 10 (11.9%) |
| 60 to 64 Years | 5 (4.5%) | 1 (1.2%) |
| 65 to 69 Years | 5 (4.5%) | 20 (23.8%) |
| 70 to 74 Years | 56 (50.0%) | 13 (15.5%) |
| 75 to 79 Years | 14 (12.5%) | 4 (4.8%) |
| 80 to 84 Years | 0 (0.0%) | 0 (0.0%) |
| 85 Years and over | 0 (0.0%) | 0 (0.0%) |
| Total | 112 (100.0%) | 84 (100.0%) |
Families and Households in Chugwater
Median Family Size in Chugwater
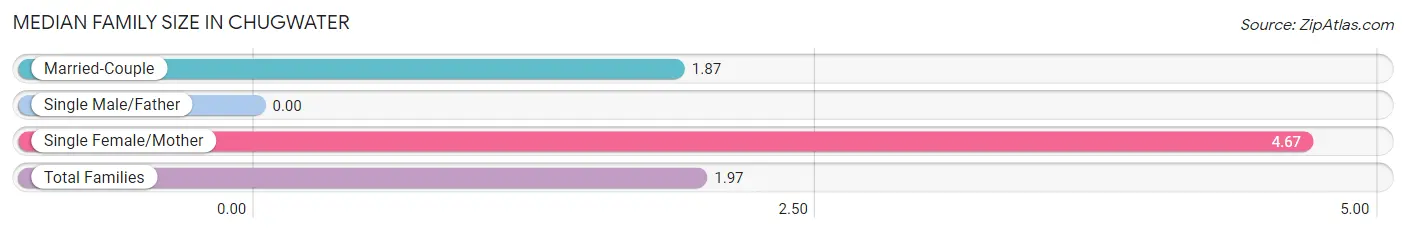
| Family Type | # Families | Family Size |
| Married-Couple | 87 (96.7%) | 1.87 |
| Single Male/Father | 0 (0.0%) | - |
| Single Female/Mother | 3 (3.3%) | 4.67 |
| Total Families | 90 (100.0%) | 1.97 |
Median Household Size in Chugwater
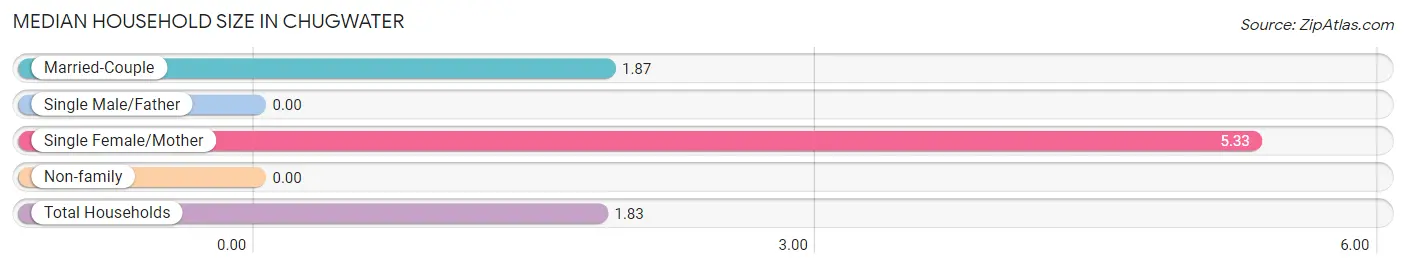
| Household Type | # Households | Household Size |
| Married-Couple | 87 (81.3%) | 1.87 |
| Single Male/Father | 0 (0.0%) | - |
| Single Female/Mother | 3 (2.8%) | 5.33 |
| Non-family | 17 (15.9%) | - |
| Total Households | 107 (100.0%) | 1.83 |
Household Size by Marriage Status in Chugwater
Out of a total of 107 households in Chugwater, 90 (84.1%) are family households, while 17 (15.9%) are nonfamily households. The most numerous type of family households are 2-person households, comprising 72, and the most common type of nonfamily households are 1-person households, comprising 17.
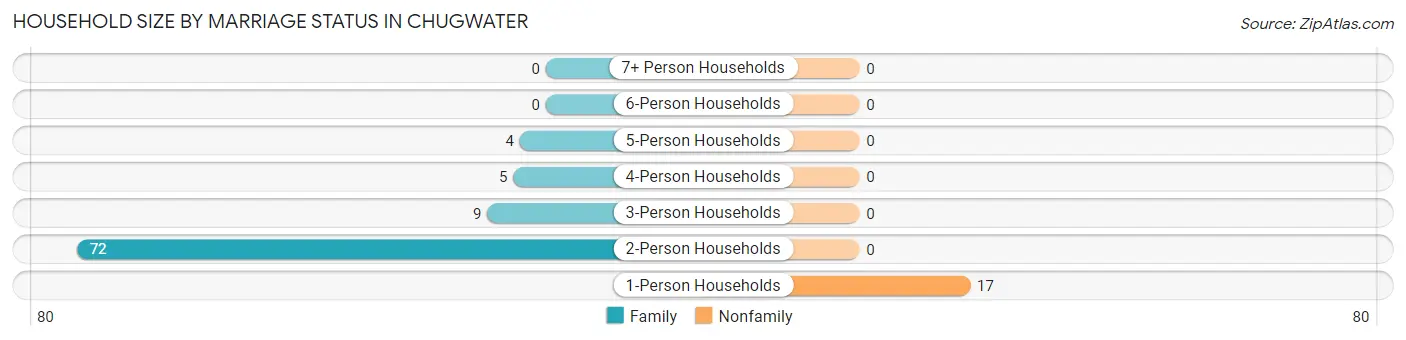
| Household Size | Family Households | Nonfamily Households |
| 1-Person Households | - | 17 (15.9%) |
| 2-Person Households | 72 (67.3%) | 0 (0.0%) |
| 3-Person Households | 9 (8.4%) | 0 (0.0%) |
| 4-Person Households | 5 (4.7%) | 0 (0.0%) |
| 5-Person Households | 4 (3.7%) | 0 (0.0%) |
| 6-Person Households | 0 (0.0%) | 0 (0.0%) |
| 7+ Person Households | 0 (0.0%) | 0 (0.0%) |
| Total | 90 (84.1%) | 17 (15.9%) |
Female Fertility in Chugwater
Fertility by Age in Chugwater
| Age Bracket | Women with Births | Births / 1,000 Women |
| 15 to 19 years | 0 (0.0%) | 0.0 |
| 20 to 34 years | 0 (0.0%) | 0.0 |
| 35 to 50 years | 0 (0.0%) | 0.0 |
| Total | 0 (0.0%) | 0.0 |
Fertility by Age by Marriage Status in Chugwater
| Age Bracket | Married | Unmarried |
| 15 to 19 years | 0 (0.0%) | 0 (0.0%) |
| 20 to 34 years | 0 (0.0%) | 0 (0.0%) |
| 35 to 50 years | 0 (0.0%) | 0 (0.0%) |
| Total | 0 (0.0%) | 0 (0.0%) |
Fertility by Education in Chugwater
| Educational Attainment | Women with Births | Births / 1,000 Women |
| Less than High School | 0 (0.0%) | 0.0 |
| High School Diploma | 0 (0.0%) | 0.0 |
| College or Associate's Degree | 0 (0.0%) | 0.0 |
| Bachelor's Degree | 0 (0.0%) | 0.0 |
| Graduate Degree | 0 (0.0%) | 0.0 |
| Total | 0 (0.0%) | 0.0 |
Fertility by Education by Marriage Status in Chugwater
| Educational Attainment | Married | Unmarried |
| Less than High School | 0 (0.0%) | 0 (0.0%) |
| High School Diploma | 0 (0.0%) | 0 (0.0%) |
| College or Associate's Degree | 0 (0.0%) | 0 (0.0%) |
| Bachelor's Degree | 0 (0.0%) | 0 (0.0%) |
| Graduate Degree | 0 (0.0%) | 0 (0.0%) |
| Total | 0 (0.0%) | 0 (0.0%) |
Employment Characteristics in Chugwater
Employment by Class of Employer in Chugwater
Among the 62 employed individuals in Chugwater, private company employees (16 | 25.8%), unpaid family workers (13 | 21.0%), and local government employees (10 | 16.1%) make up the most common classes of employment.
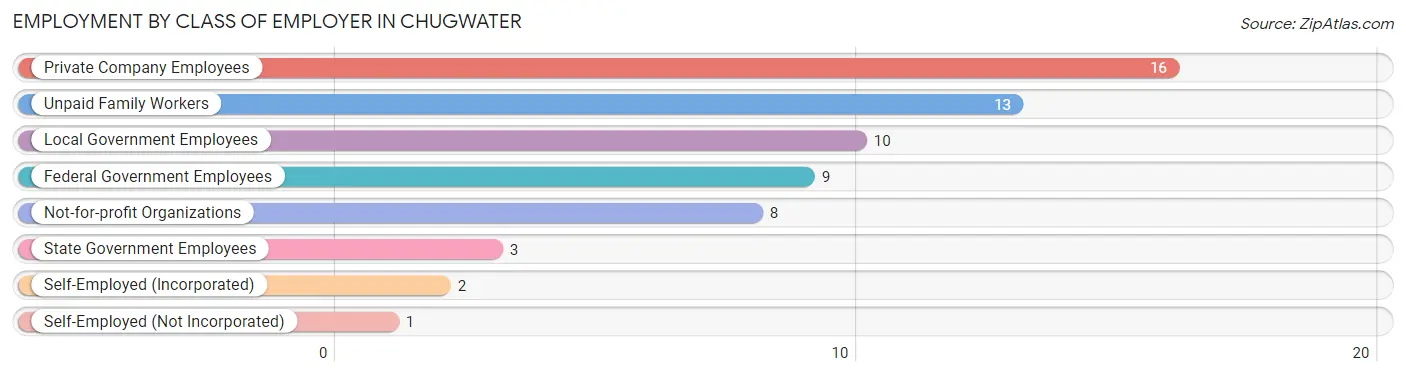
| Employer Class | # Employees | % Employees |
| Private Company Employees | 16 | 25.8% |
| Self-Employed (Incorporated) | 2 | 3.2% |
| Self-Employed (Not Incorporated) | 1 | 1.6% |
| Not-for-profit Organizations | 8 | 12.9% |
| Local Government Employees | 10 | 16.1% |
| State Government Employees | 3 | 4.8% |
| Federal Government Employees | 9 | 14.5% |
| Unpaid Family Workers | 13 | 21.0% |
| Total | 62 | 100.0% |
Employment Status by Age in Chugwater
According to the labor force statistics for Chugwater, out of the total population over 16 years of age (174), 41.4% or 72 individuals are in the labor force, with 2.8% or 2 of them unemployed. The age group with the highest labor force participation rate is 16 to 19 years, with 100.0% or 8 individuals in the labor force. Within the labor force, the 25 to 29 years age range has the highest percentage of unemployed individuals, with 15.4% or 2 of them being unemployed.
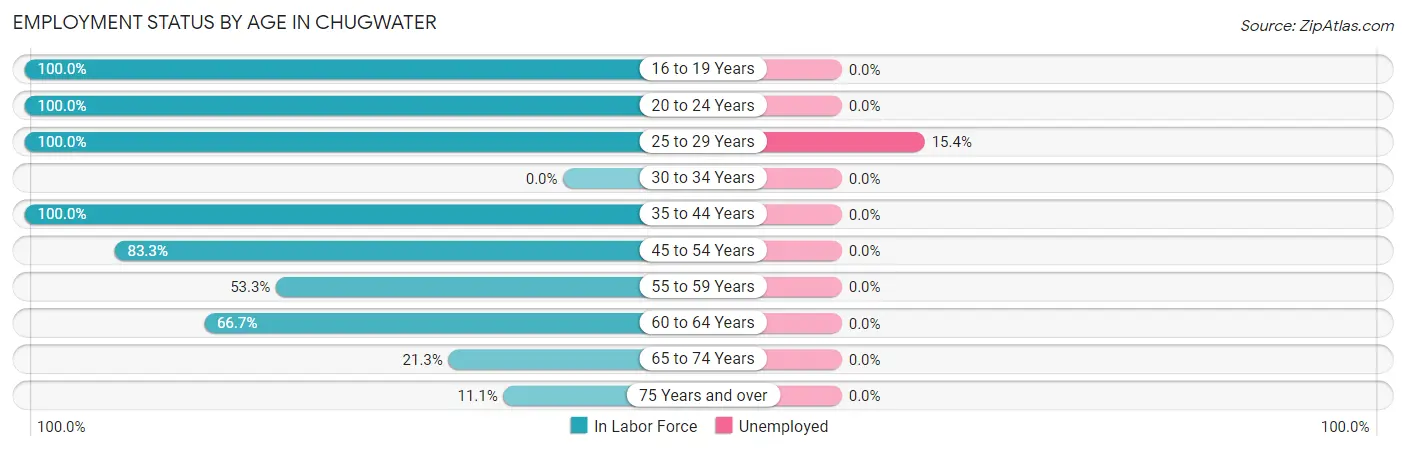
| Age Bracket | In Labor Force | Unemployed |
| 16 to 19 Years | 8 (100.0%) | 0 (0.0%) |
| 20 to 24 Years | 2 (100.0%) | 0 (0.0%) |
| 25 to 29 Years | 13 (100.0%) | 2 (15.4%) |
| 30 to 34 Years | 0 (0.0%) | 0 (0.0%) |
| 35 to 44 Years | 10 (100.0%) | 0 (0.0%) |
| 45 to 54 Years | 5 (83.3%) | 0 (0.0%) |
| 55 to 59 Years | 8 (53.3%) | 0 (0.0%) |
| 60 to 64 Years | 4 (66.7%) | 0 (0.0%) |
| 65 to 74 Years | 20 (21.3%) | 0 (0.0%) |
| 75 Years and over | 2 (11.1%) | 0 (0.0%) |
| Total | 72 (41.4%) | 2 (2.8%) |
Employment Status by Educational Attainment in Chugwater
According to labor force statistics for Chugwater, 76.9% of individuals (40) out of the total population between 25 and 64 years of age (52) are in the labor force, with 5.0% or 2 of them being unemployed. The group with the highest labor force participation rate are those with the educational attainment of bachelor's degree or higher, with 85.7% or 12 individuals in the labor force. Within the labor force, individuals with high school diploma education have the highest percentage of unemployment, with 22.2% or 2 of them being unemployed.
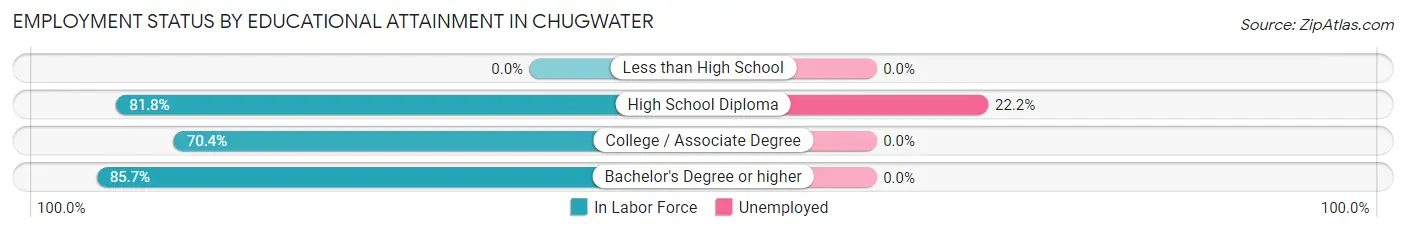
| Educational Attainment | In Labor Force | Unemployed |
| Less than High School | 0 (0.0%) | 0 (0.0%) |
| High School Diploma | 9 (81.8%) | 2 (22.2%) |
| College / Associate Degree | 19 (70.4%) | 0 (0.0%) |
| Bachelor's Degree or higher | 12 (85.7%) | 0 (0.0%) |
| Total | 40 (76.9%) | 3 (5.0%) |
Employment Occupations by Sex in Chugwater
Management, Business, Science and Arts Occupations
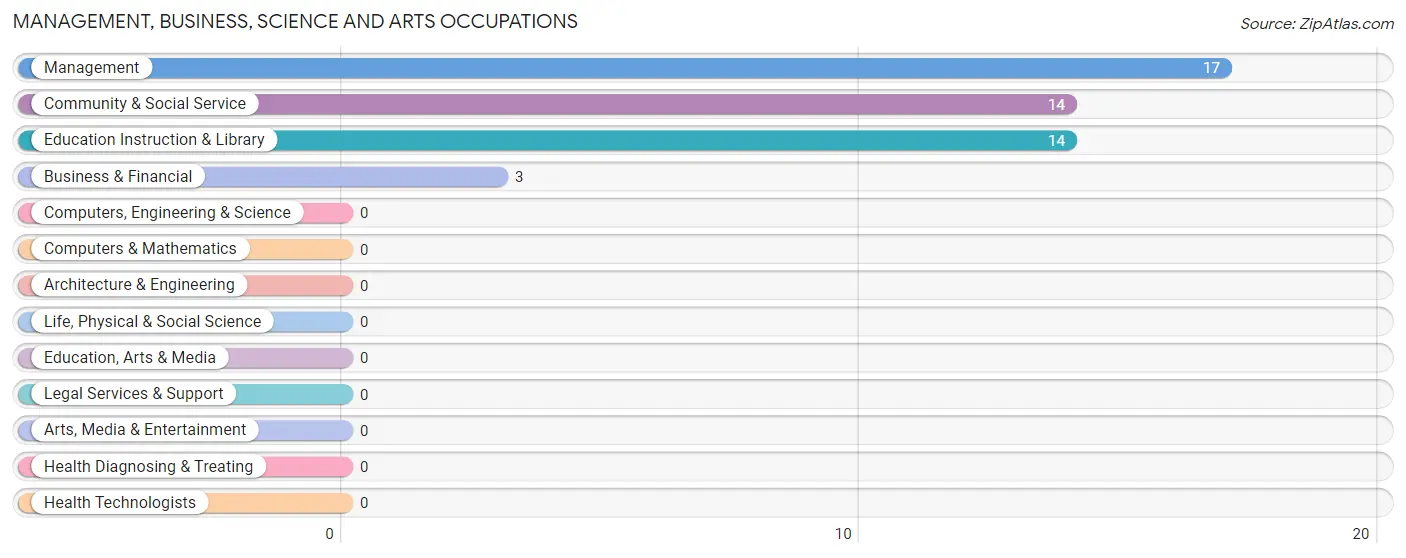
The most common Management, Business, Science and Arts occupations in Chugwater are Management (17 | 24.3%), Community & Social Service (14 | 20.0%), Education Instruction & Library (14 | 20.0%), and Business & Financial (3 | 4.3%).
Management, Business, Science and Arts Occupations by Sex
Within the Management, Business, Science and Arts occupations in Chugwater, the most male-oriented occupations are Community & Social Service (42.9%), Education Instruction & Library (42.9%), and Business & Financial (33.3%), while the most female-oriented occupations are Management (88.2%), Business & Financial (66.7%), and Community & Social Service (57.1%).
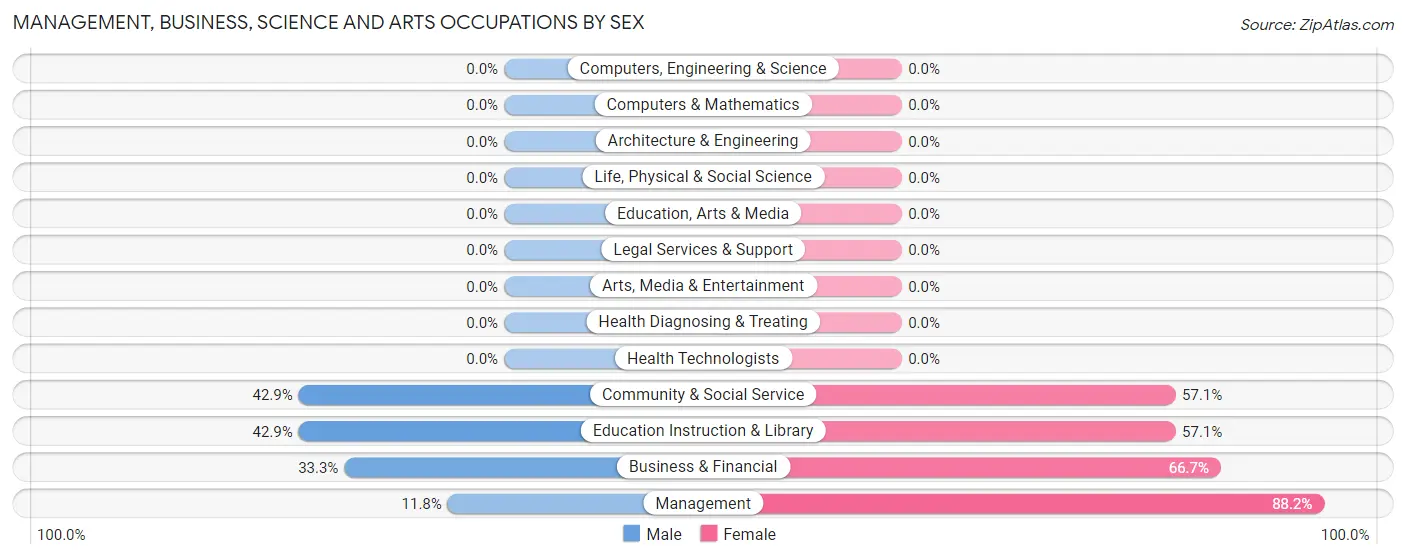
| Occupation | Male | Female |
| Management | 2 (11.8%) | 15 (88.2%) |
| Business & Financial | 1 (33.3%) | 2 (66.7%) |
| Computers, Engineering & Science | 0 (0.0%) | 0 (0.0%) |
| Computers & Mathematics | 0 (0.0%) | 0 (0.0%) |
| Architecture & Engineering | 0 (0.0%) | 0 (0.0%) |
| Life, Physical & Social Science | 0 (0.0%) | 0 (0.0%) |
| Community & Social Service | 6 (42.9%) | 8 (57.1%) |
| Education, Arts & Media | 0 (0.0%) | 0 (0.0%) |
| Legal Services & Support | 0 (0.0%) | 0 (0.0%) |
| Education Instruction & Library | 6 (42.9%) | 8 (57.1%) |
| Arts, Media & Entertainment | 0 (0.0%) | 0 (0.0%) |
| Health Diagnosing & Treating | 0 (0.0%) | 0 (0.0%) |
| Health Technologists | 0 (0.0%) | 0 (0.0%) |
| Total (Category) | 9 (26.5%) | 25 (73.5%) |
| Total (Overall) | 25 (35.7%) | 45 (64.3%) |
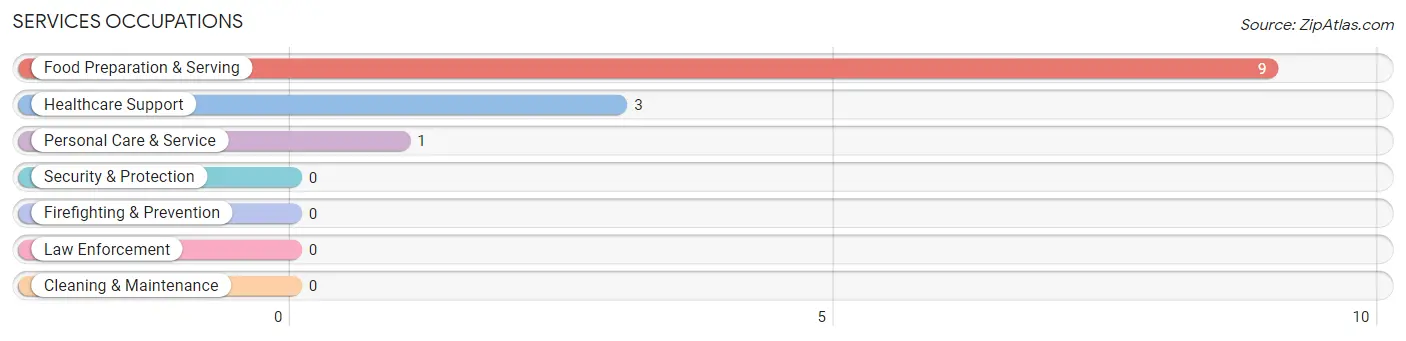
Services Occupations
The most common Services occupations in Chugwater are Food Preparation & Serving (9 | 12.9%), Healthcare Support (3 | 4.3%), and Personal Care & Service (1 | 1.4%).
Services Occupations by Sex
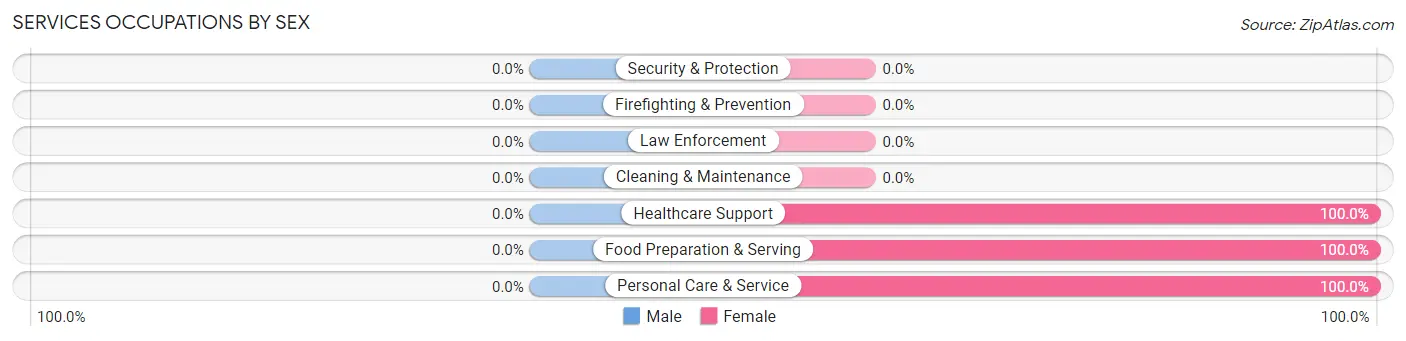
| Occupation | Male | Female |
| Healthcare Support | 0 (0.0%) | 3 (100.0%) |
| Security & Protection | 0 (0.0%) | 0 (0.0%) |
| Firefighting & Prevention | 0 (0.0%) | 0 (0.0%) |
| Law Enforcement | 0 (0.0%) | 0 (0.0%) |
| Food Preparation & Serving | 0 (0.0%) | 9 (100.0%) |
| Cleaning & Maintenance | 0 (0.0%) | 0 (0.0%) |
| Personal Care & Service | 0 (0.0%) | 1 (100.0%) |
| Total (Category) | 0 (0.0%) | 13 (100.0%) |
| Total (Overall) | 25 (35.7%) | 45 (64.3%) |
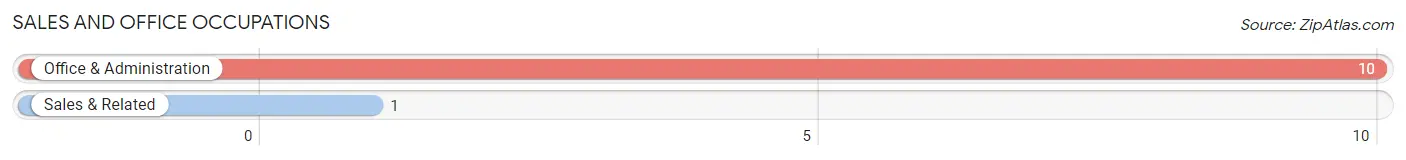
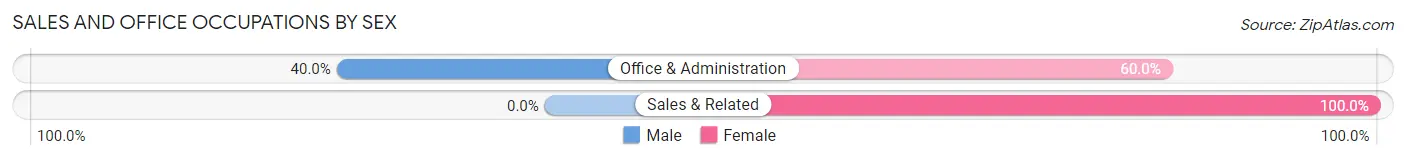
Sales and Office Occupations
The most common Sales and Office occupations in Chugwater are Office & Administration (10 | 14.3%), and Sales & Related (1 | 1.4%).
Sales and Office Occupations by Sex
| Occupation | Male | Female |
| Sales & Related | 0 (0.0%) | 1 (100.0%) |
| Office & Administration | 4 (40.0%) | 6 (60.0%) |
| Total (Category) | 4 (36.4%) | 7 (63.6%) |
| Total (Overall) | 25 (35.7%) | 45 (64.3%) |
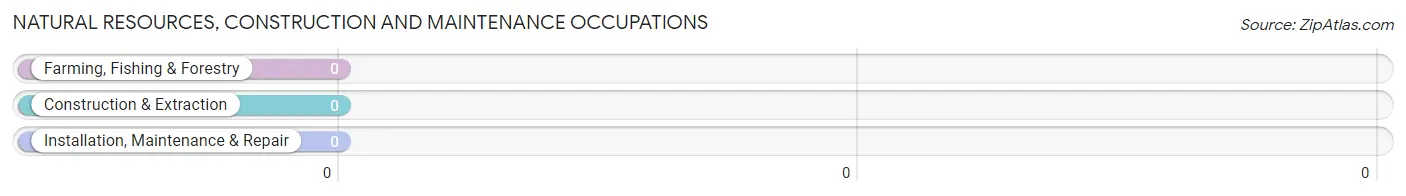
Natural Resources, Construction and Maintenance Occupations
Natural Resources, Construction and Maintenance Occupations by Sex
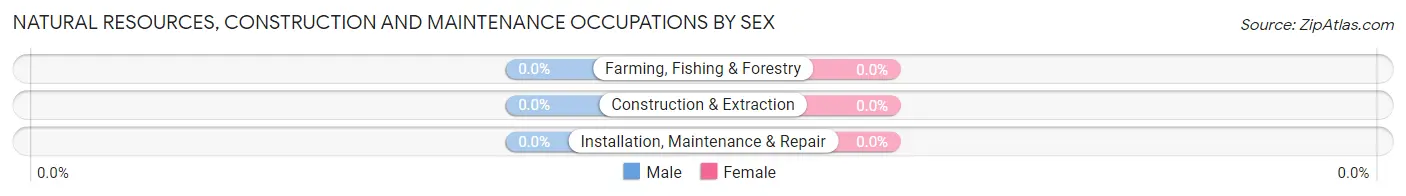
| Occupation | Male | Female |
| Farming, Fishing & Forestry | 0 (0.0%) | 0 (0.0%) |
| Construction & Extraction | 0 (0.0%) | 0 (0.0%) |
| Installation, Maintenance & Repair | 0 (0.0%) | 0 (0.0%) |
| Total (Category) | 0 (0.0%) | 0 (0.0%) |
| Total (Overall) | 25 (35.7%) | 45 (64.3%) |
Production, Transportation and Moving Occupations
The most common Production, Transportation and Moving occupations in Chugwater are Production (6 | 8.6%), and Material Moving (6 | 8.6%).
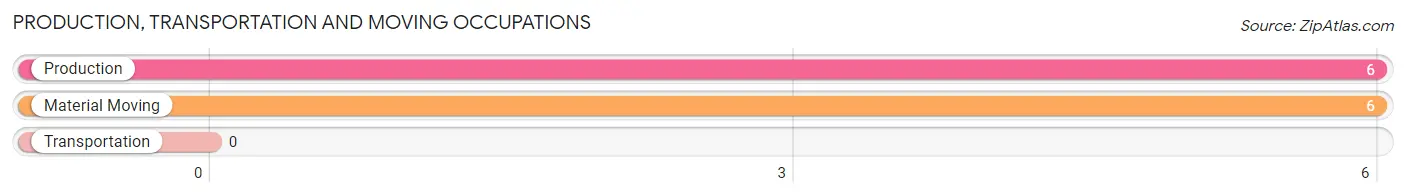
Production, Transportation and Moving Occupations by Sex
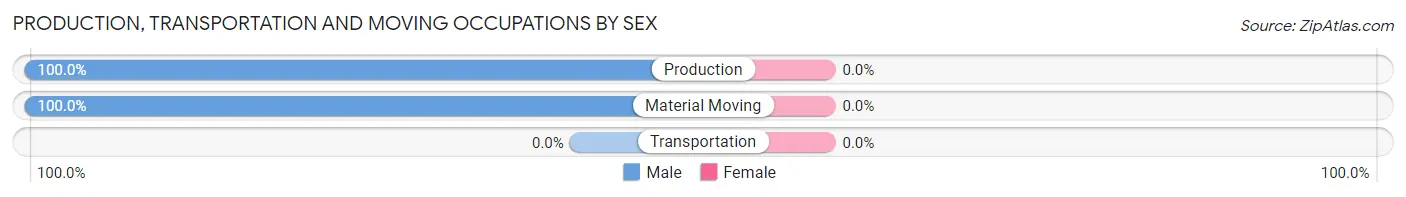
| Occupation | Male | Female |
| Production | 6 (100.0%) | 0 (0.0%) |
| Transportation | 0 (0.0%) | 0 (0.0%) |
| Material Moving | 6 (100.0%) | 0 (0.0%) |
| Total (Category) | 12 (100.0%) | 0 (0.0%) |
| Total (Overall) | 25 (35.7%) | 45 (64.3%) |
Employment Industries by Sex in Chugwater
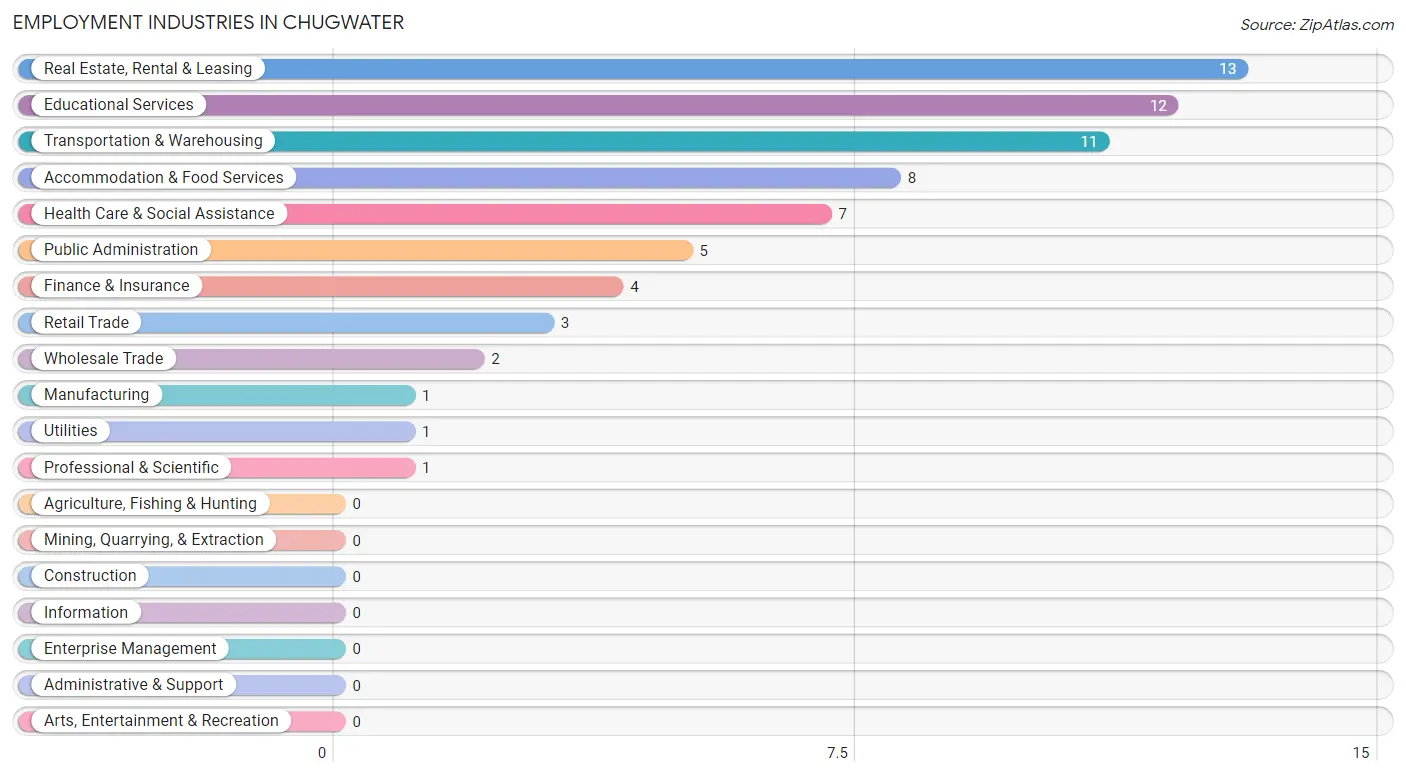
Employment Industries in Chugwater
The major employment industries in Chugwater include Real Estate, Rental & Leasing (13 | 18.6%), Educational Services (12 | 17.1%), Transportation & Warehousing (11 | 15.7%), Accommodation & Food Services (8 | 11.4%), and Health Care & Social Assistance (7 | 10.0%).
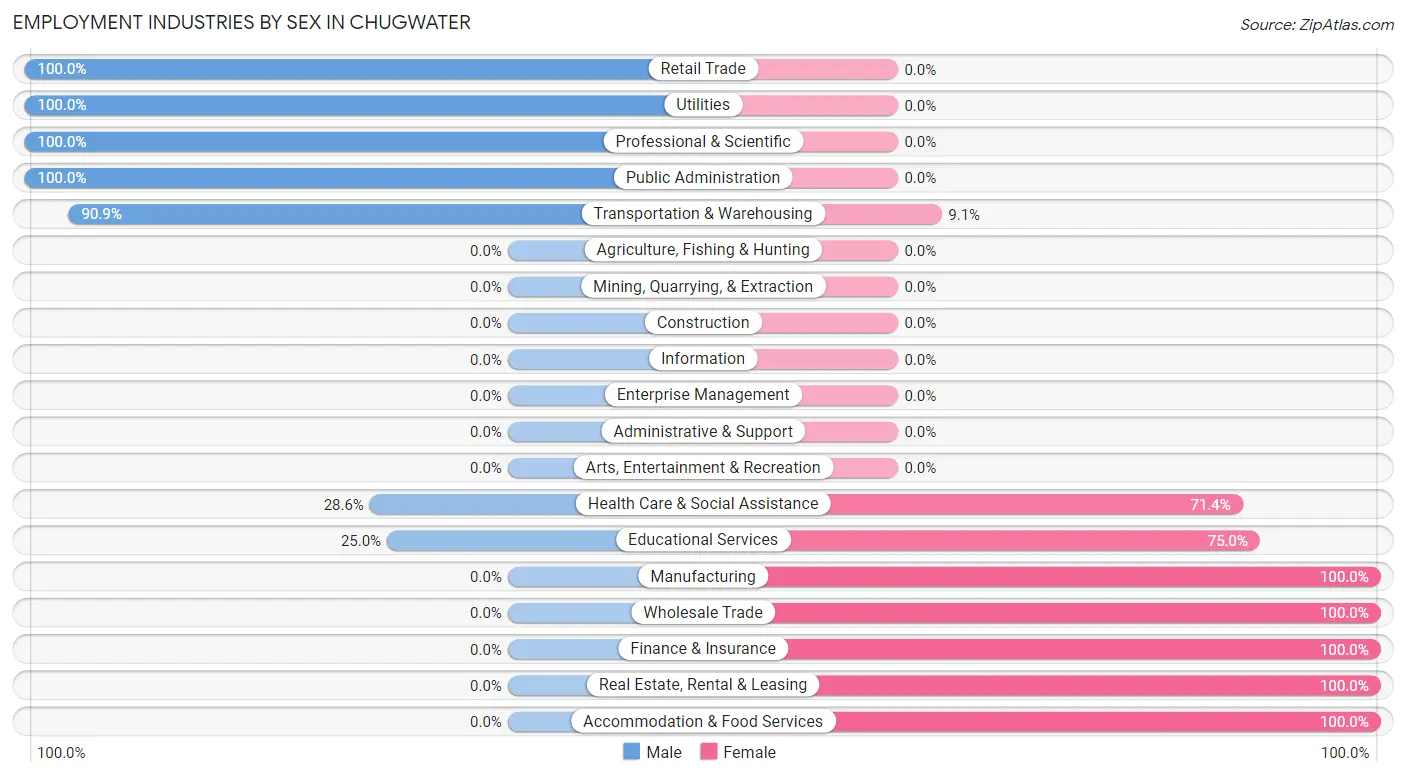
Employment Industries by Sex in Chugwater
The Chugwater industries that see more men than women are Retail Trade (100.0%), Utilities (100.0%), and Professional & Scientific (100.0%), whereas the industries that tend to have a higher number of women are Manufacturing (100.0%), Wholesale Trade (100.0%), and Finance & Insurance (100.0%).
| Industry | Male | Female |
| Agriculture, Fishing & Hunting | 0 (0.0%) | 0 (0.0%) |
| Mining, Quarrying, & Extraction | 0 (0.0%) | 0 (0.0%) |
| Construction | 0 (0.0%) | 0 (0.0%) |
| Manufacturing | 0 (0.0%) | 1 (100.0%) |
| Wholesale Trade | 0 (0.0%) | 2 (100.0%) |
| Retail Trade | 3 (100.0%) | 0 (0.0%) |
| Transportation & Warehousing | 10 (90.9%) | 1 (9.1%) |
| Utilities | 1 (100.0%) | 0 (0.0%) |
| Information | 0 (0.0%) | 0 (0.0%) |
| Finance & Insurance | 0 (0.0%) | 4 (100.0%) |
| Real Estate, Rental & Leasing | 0 (0.0%) | 13 (100.0%) |
| Professional & Scientific | 1 (100.0%) | 0 (0.0%) |
| Enterprise Management | 0 (0.0%) | 0 (0.0%) |
| Administrative & Support | 0 (0.0%) | 0 (0.0%) |
| Educational Services | 3 (25.0%) | 9 (75.0%) |
| Health Care & Social Assistance | 2 (28.6%) | 5 (71.4%) |
| Arts, Entertainment & Recreation | 0 (0.0%) | 0 (0.0%) |
| Accommodation & Food Services | 0 (0.0%) | 8 (100.0%) |
| Public Administration | 5 (100.0%) | 0 (0.0%) |
| Total | 25 (35.7%) | 45 (64.3%) |
Education in Chugwater
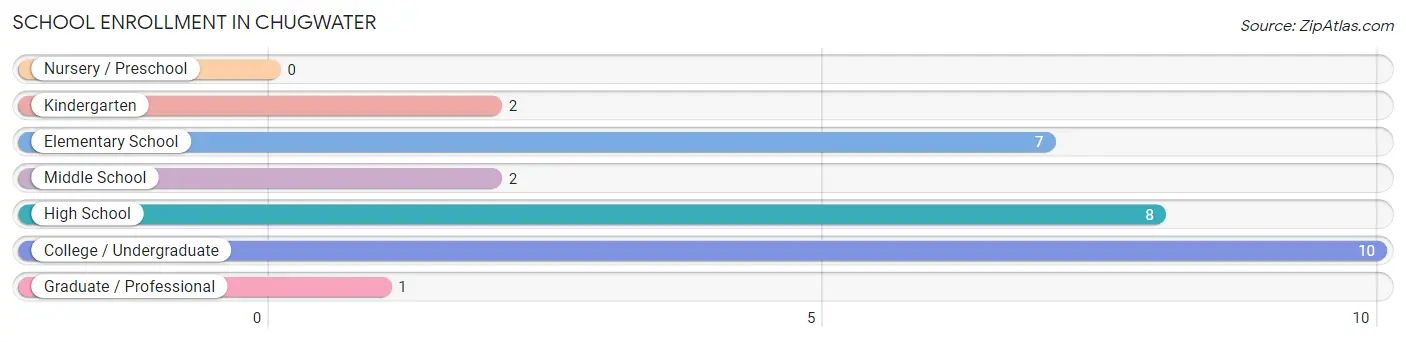
School Enrollment in Chugwater
The most common levels of schooling among the 30 students in Chugwater are college / undergraduate (10 | 33.3%), high school (8 | 26.7%), and elementary school (7 | 23.3%).
| School Level | # Students | % Students |
| Nursery / Preschool | 0 | 0.0% |
| Kindergarten | 2 | 6.7% |
| Elementary School | 7 | 23.3% |
| Middle School | 2 | 6.7% |
| High School | 8 | 26.7% |
| College / Undergraduate | 10 | 33.3% |
| Graduate / Professional | 1 | 3.3% |
| Total | 30 | 100.0% |
School Enrollment by Age by Funding Source in Chugwater
Out of a total of 30 students who are enrolled in schools in Chugwater, 4 (13.3%) attend a private institution, while the remaining 26 (86.7%) are enrolled in public schools. The age group of 5 to 9 year old has the highest likelihood of being enrolled in private schools, with 4 (44.4% in the age bracket) enrolled. Conversely, the age group of 15 to 17 year olds has the lowest likelihood of being enrolled in a private school, with 10 (100.0% in the age bracket) attending a public institution.
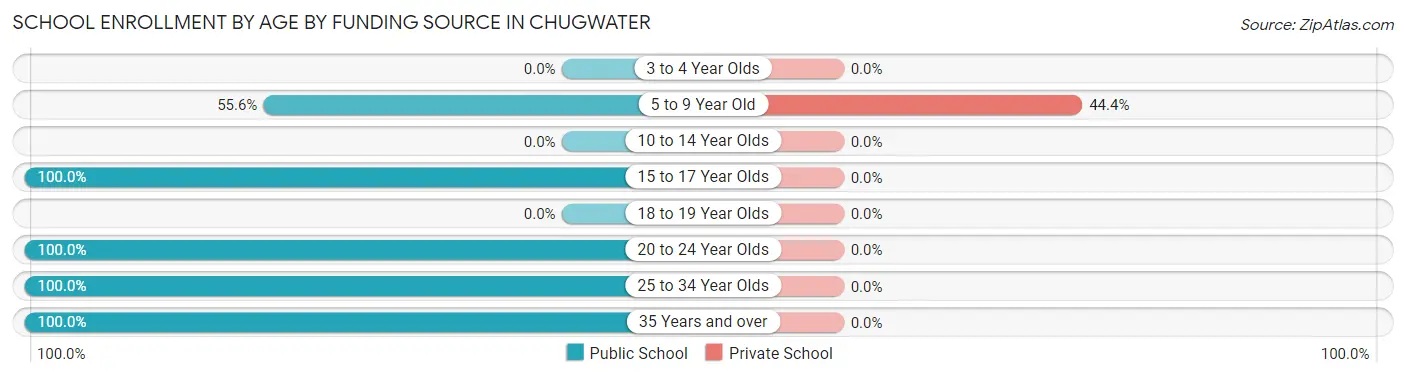
| Age Bracket | Public School | Private School |
| 3 to 4 Year Olds | 0 (0.0%) | 0 (0.0%) |
| 5 to 9 Year Old | 5 (55.6%) | 4 (44.4%) |
| 10 to 14 Year Olds | 0 (0.0%) | 0 (0.0%) |
| 15 to 17 Year Olds | 10 (100.0%) | 0 (0.0%) |
| 18 to 19 Year Olds | 0 (0.0%) | 0 (0.0%) |
| 20 to 24 Year Olds | 1 (100.0%) | 0 (0.0%) |
| 25 to 34 Year Olds | 9 (100.0%) | 0 (0.0%) |
| 35 Years and over | 1 (100.0%) | 0 (0.0%) |
| Total | 26 (86.7%) | 4 (13.3%) |
Educational Attainment by Field of Study in Chugwater
Education (5 | 20.8%), arts & humanities (4 | 16.7%), bio, nature & agricultural (3 | 12.5%), science & technology (3 | 12.5%), and liberal arts & history (3 | 12.5%) are the most common fields of study among 24 individuals in Chugwater who have obtained a bachelor's degree or higher.
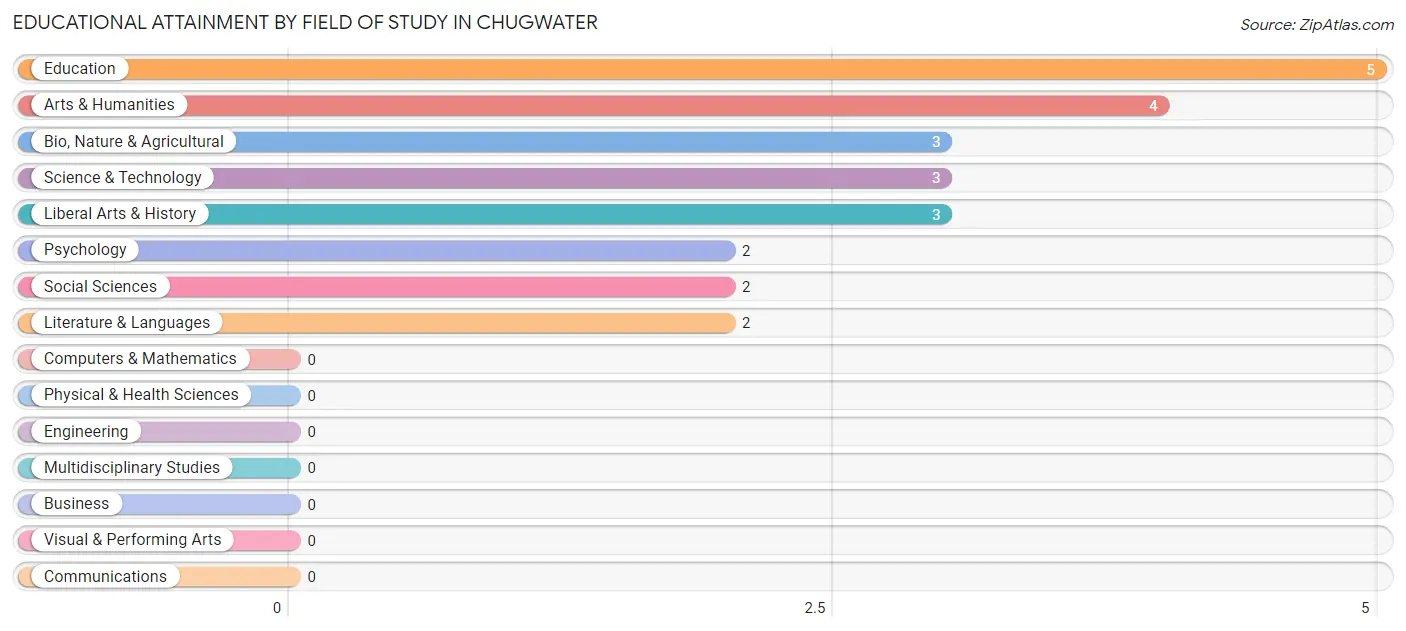
| Field of Study | # Graduates | % Graduates |
| Computers & Mathematics | 0 | 0.0% |
| Bio, Nature & Agricultural | 3 | 12.5% |
| Physical & Health Sciences | 0 | 0.0% |
| Psychology | 2 | 8.3% |
| Social Sciences | 2 | 8.3% |
| Engineering | 0 | 0.0% |
| Multidisciplinary Studies | 0 | 0.0% |
| Science & Technology | 3 | 12.5% |
| Business | 0 | 0.0% |
| Education | 5 | 20.8% |
| Literature & Languages | 2 | 8.3% |
| Liberal Arts & History | 3 | 12.5% |
| Visual & Performing Arts | 0 | 0.0% |
| Communications | 0 | 0.0% |
| Arts & Humanities | 4 | 16.7% |
| Total | 24 | 100.0% |
Transportation & Commute in Chugwater
Vehicle Availability by Sex in Chugwater
The most prevalent vehicle ownership categories in Chugwater are males with 2 vehicles (11, accounting for 44.0%) and females with 2 vehicles (7, making up 29.7%).
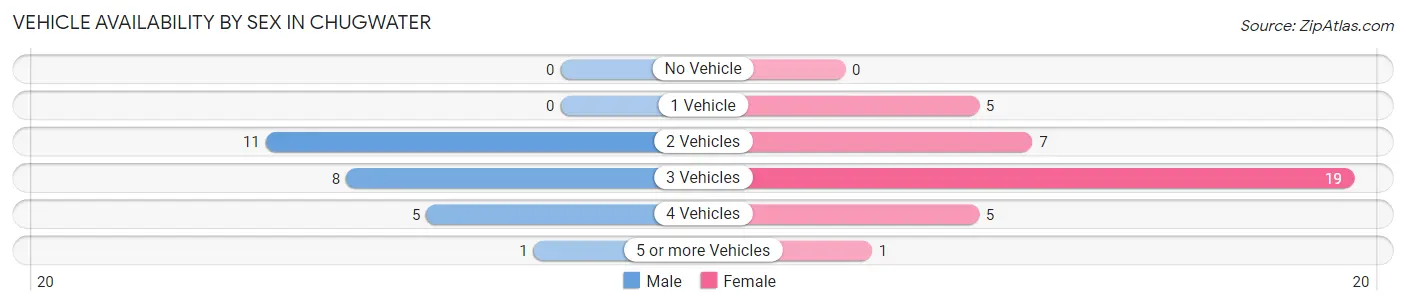
| Vehicles Available | Male | Female |
| No Vehicle | 0 (0.0%) | 0 (0.0%) |
| 1 Vehicle | 0 (0.0%) | 5 (13.5%) |
| 2 Vehicles | 11 (44.0%) | 7 (18.9%) |
| 3 Vehicles | 8 (32.0%) | 19 (51.3%) |
| 4 Vehicles | 5 (20.0%) | 5 (13.5%) |
| 5 or more Vehicles | 1 (4.0%) | 1 (2.7%) |
| Total | 25 (100.0%) | 37 (100.0%) |
Commute Time in Chugwater
The most frequently occuring commute durations in Chugwater are 45 to 59 minutes (23 commuters, 39.7%), 40 to 44 minutes (13 commuters, 22.4%), and less than 5 minutes (11 commuters, 19.0%).
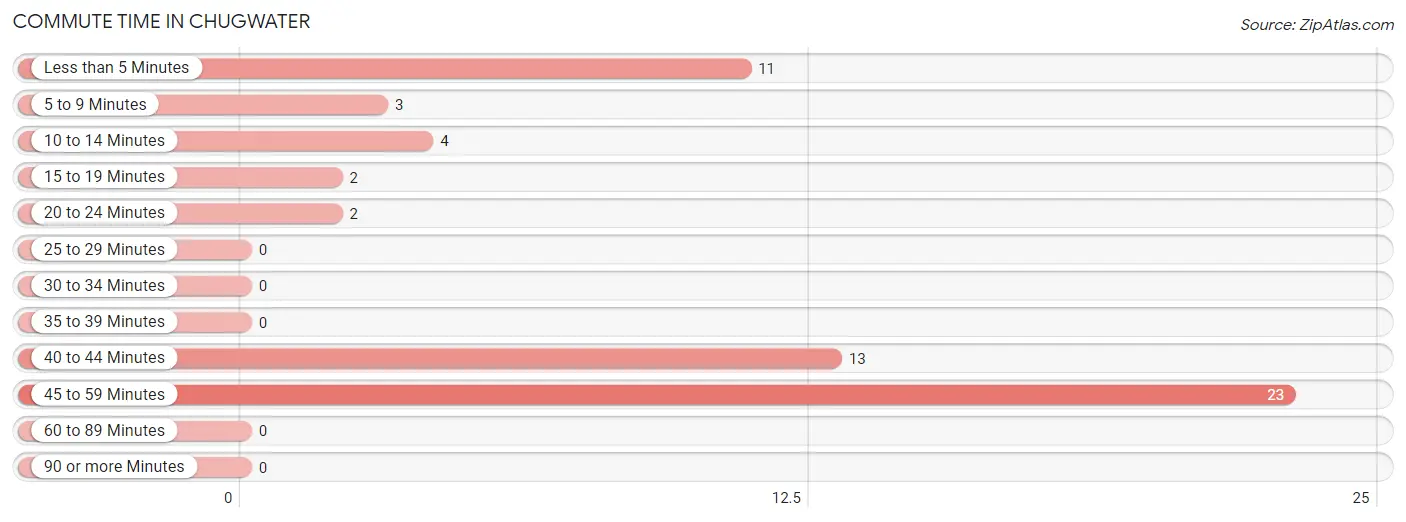
| Commute Time | # Commuters | % Commuters |
| Less than 5 Minutes | 11 | 19.0% |
| 5 to 9 Minutes | 3 | 5.2% |
| 10 to 14 Minutes | 4 | 6.9% |
| 15 to 19 Minutes | 2 | 3.5% |
| 20 to 24 Minutes | 2 | 3.5% |
| 25 to 29 Minutes | 0 | 0.0% |
| 30 to 34 Minutes | 0 | 0.0% |
| 35 to 39 Minutes | 0 | 0.0% |
| 40 to 44 Minutes | 13 | 22.4% |
| 45 to 59 Minutes | 23 | 39.7% |
| 60 to 89 Minutes | 0 | 0.0% |
| 90 or more Minutes | 0 | 0.0% |
Commute Time by Sex in Chugwater
The most common commute times in Chugwater are 40 to 44 minutes (10 commuters, 41.7%) for males and 45 to 59 minutes (16 commuters, 47.1%) for females.
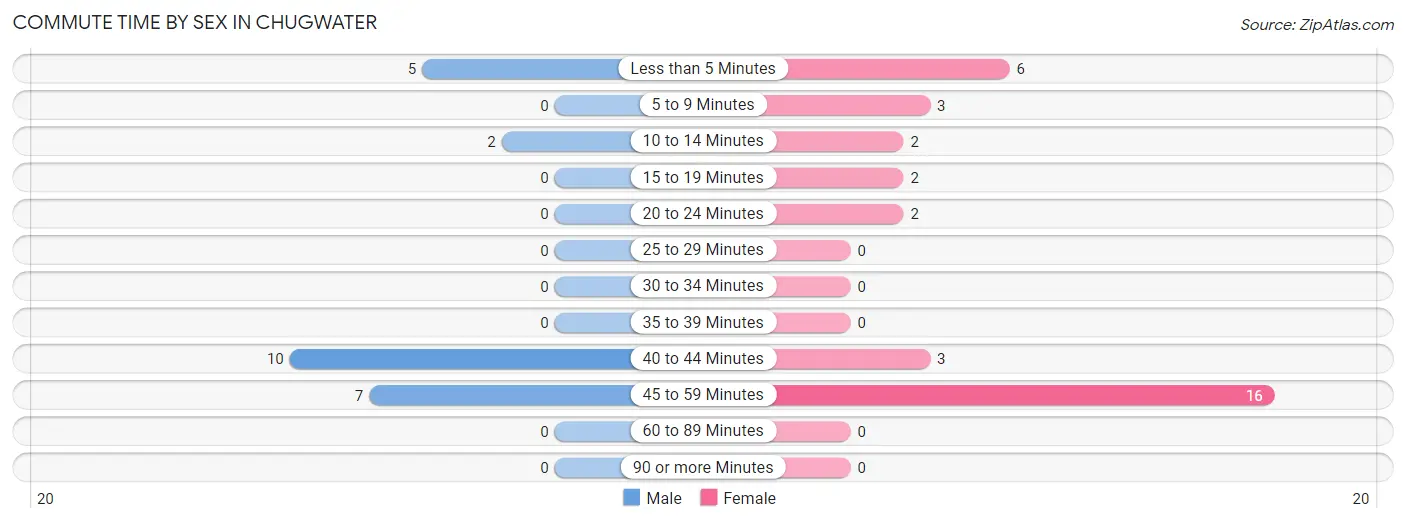
| Commute Time | Male | Female |
| Less than 5 Minutes | 5 (20.8%) | 6 (17.6%) |
| 5 to 9 Minutes | 0 (0.0%) | 3 (8.8%) |
| 10 to 14 Minutes | 2 (8.3%) | 2 (5.9%) |
| 15 to 19 Minutes | 0 (0.0%) | 2 (5.9%) |
| 20 to 24 Minutes | 0 (0.0%) | 2 (5.9%) |
| 25 to 29 Minutes | 0 (0.0%) | 0 (0.0%) |
| 30 to 34 Minutes | 0 (0.0%) | 0 (0.0%) |
| 35 to 39 Minutes | 0 (0.0%) | 0 (0.0%) |
| 40 to 44 Minutes | 10 (41.7%) | 3 (8.8%) |
| 45 to 59 Minutes | 7 (29.2%) | 16 (47.1%) |
| 60 to 89 Minutes | 0 (0.0%) | 0 (0.0%) |
| 90 or more Minutes | 0 (0.0%) | 0 (0.0%) |
Time of Departure to Work by Sex in Chugwater
The most frequent times of departure to work in Chugwater are 6:30 AM to 6:59 AM (8, 33.3%) for males and 6:00 AM to 6:29 AM (15, 44.1%) for females.
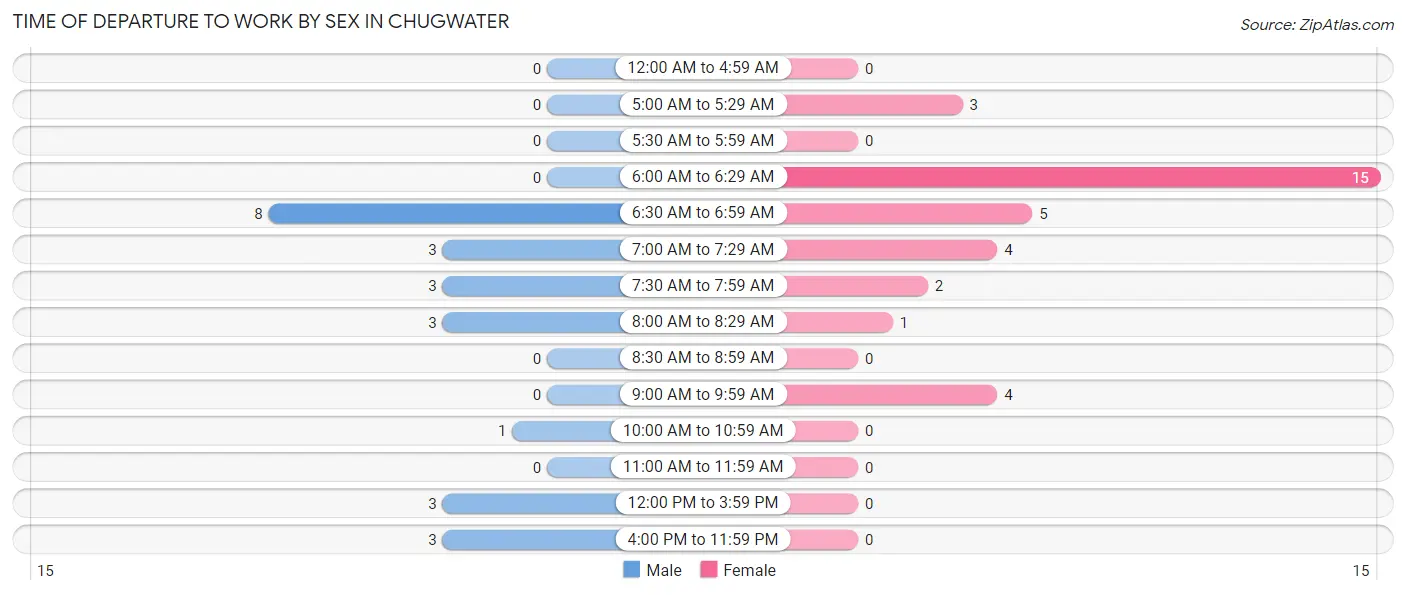
| Time of Departure | Male | Female |
| 12:00 AM to 4:59 AM | 0 (0.0%) | 0 (0.0%) |
| 5:00 AM to 5:29 AM | 0 (0.0%) | 3 (8.8%) |
| 5:30 AM to 5:59 AM | 0 (0.0%) | 0 (0.0%) |
| 6:00 AM to 6:29 AM | 0 (0.0%) | 15 (44.1%) |
| 6:30 AM to 6:59 AM | 8 (33.3%) | 5 (14.7%) |
| 7:00 AM to 7:29 AM | 3 (12.5%) | 4 (11.8%) |
| 7:30 AM to 7:59 AM | 3 (12.5%) | 2 (5.9%) |
| 8:00 AM to 8:29 AM | 3 (12.5%) | 1 (2.9%) |
| 8:30 AM to 8:59 AM | 0 (0.0%) | 0 (0.0%) |
| 9:00 AM to 9:59 AM | 0 (0.0%) | 4 (11.8%) |
| 10:00 AM to 10:59 AM | 1 (4.2%) | 0 (0.0%) |
| 11:00 AM to 11:59 AM | 0 (0.0%) | 0 (0.0%) |
| 12:00 PM to 3:59 PM | 3 (12.5%) | 0 (0.0%) |
| 4:00 PM to 11:59 PM | 3 (12.5%) | 0 (0.0%) |
| Total | 24 (100.0%) | 34 (100.0%) |
Housing Occupancy in Chugwater
Occupancy by Ownership in Chugwater
Of the total 107 dwellings in Chugwater, owner-occupied units account for 98 (91.6%), while renter-occupied units make up 9 (8.4%).
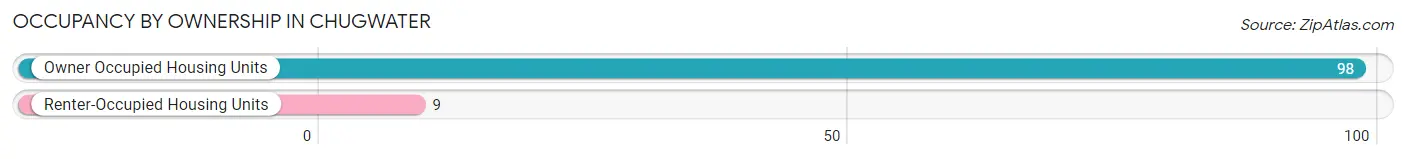
| Occupancy | # Housing Units | % Housing Units |
| Owner Occupied Housing Units | 98 | 91.6% |
| Renter-Occupied Housing Units | 9 | 8.4% |
| Total Occupied Housing Units | 107 | 100.0% |
Occupancy by Household Size in Chugwater
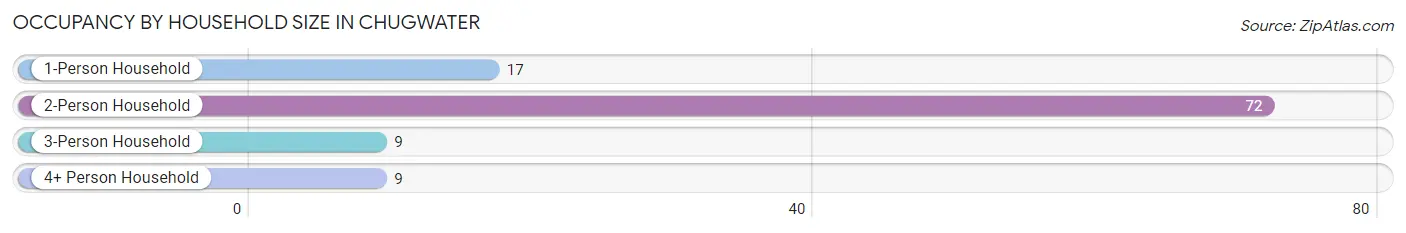
| Household Size | # Housing Units | % Housing Units |
| 1-Person Household | 17 | 15.9% |
| 2-Person Household | 72 | 67.3% |
| 3-Person Household | 9 | 8.4% |
| 4+ Person Household | 9 | 8.4% |
| Total Housing Units | 107 | 100.0% |
Occupancy by Ownership by Household Size in Chugwater
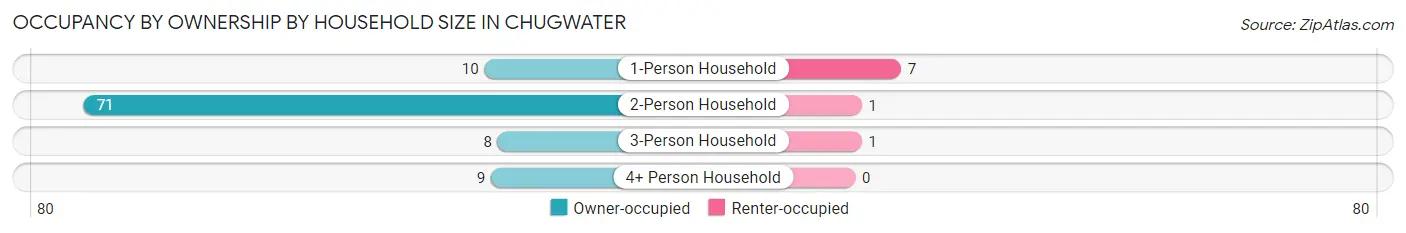
| Household Size | Owner-occupied | Renter-occupied |
| 1-Person Household | 10 (58.8%) | 7 (41.2%) |
| 2-Person Household | 71 (98.6%) | 1 (1.4%) |
| 3-Person Household | 8 (88.9%) | 1 (11.1%) |
| 4+ Person Household | 9 (100.0%) | 0 (0.0%) |
| Total Housing Units | 98 (91.6%) | 9 (8.4%) |
Occupancy by Educational Attainment in Chugwater
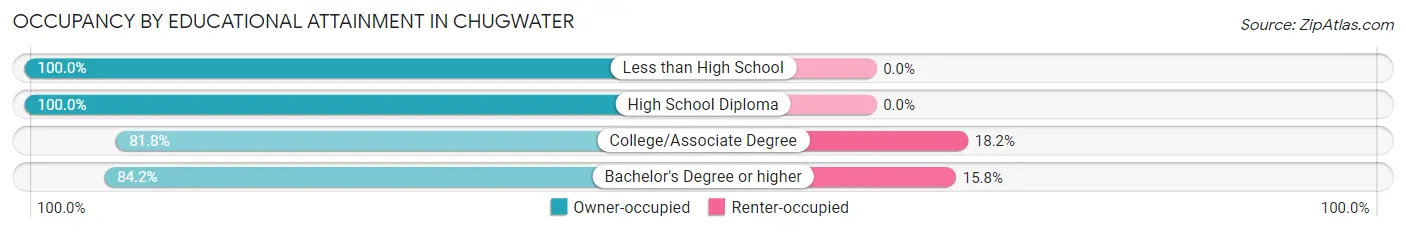
| Household Size | Owner-occupied | Renter-occupied |
| Less than High School | 1 (100.0%) | 0 (0.0%) |
| High School Diploma | 54 (100.0%) | 0 (0.0%) |
| College/Associate Degree | 27 (81.8%) | 6 (18.2%) |
| Bachelor's Degree or higher | 16 (84.2%) | 3 (15.8%) |
Occupancy by Age of Householder in Chugwater
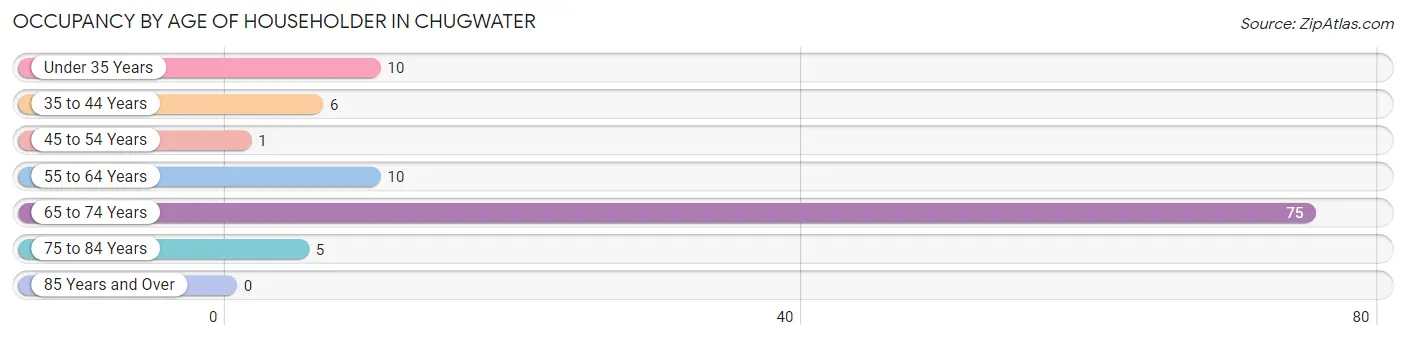
| Age Bracket | # Households | % Households |
| Under 35 Years | 10 | 9.3% |
| 35 to 44 Years | 6 | 5.6% |
| 45 to 54 Years | 1 | 0.9% |
| 55 to 64 Years | 10 | 9.3% |
| 65 to 74 Years | 75 | 70.1% |
| 75 to 84 Years | 5 | 4.7% |
| 85 Years and Over | 0 | 0.0% |
| Total | 107 | 100.0% |
Housing Finances in Chugwater
Median Income by Occupancy in Chugwater
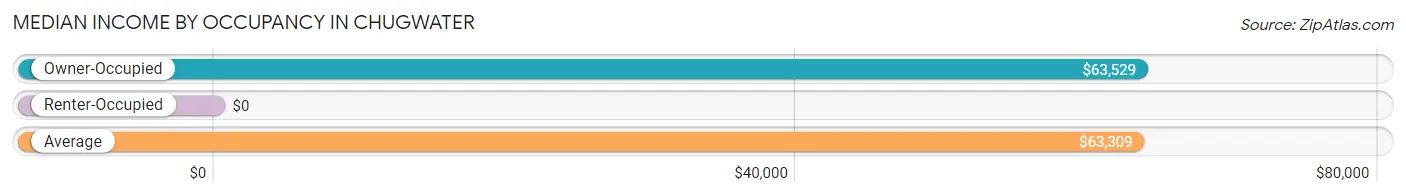
| Occupancy Type | # Households | Median Income |
| Owner-Occupied | 98 (91.6%) | $63,529 |
| Renter-Occupied | 9 (8.4%) | $0 |
| Average | 107 (100.0%) | $63,309 |
Occupancy by Householder Income Bracket in Chugwater
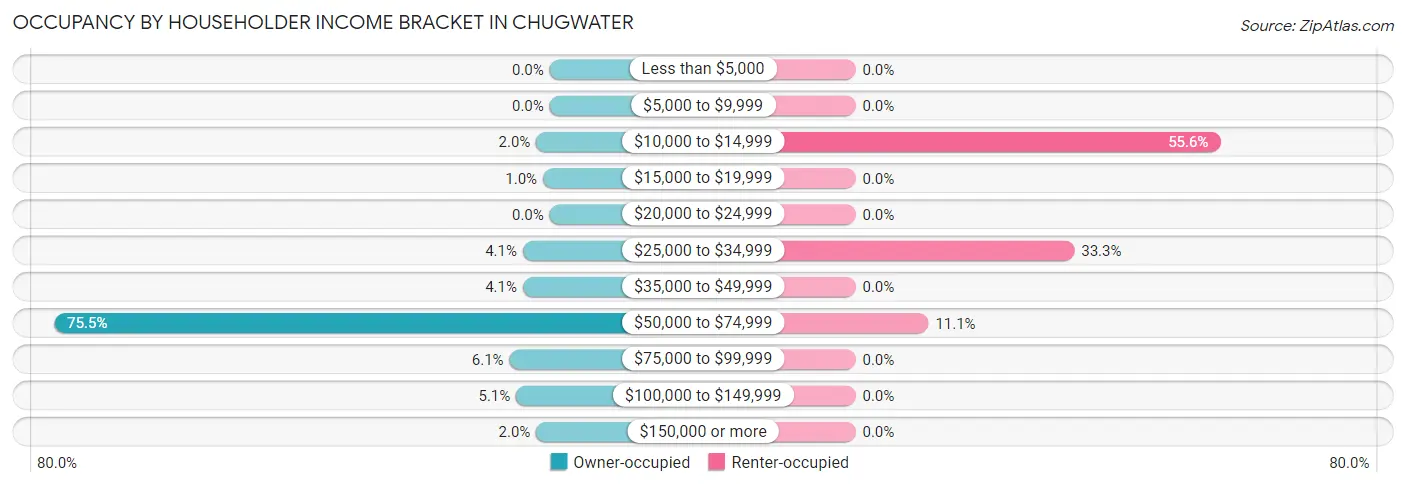
| Income Bracket | Owner-occupied | Renter-occupied |
| Less than $5,000 | 0 (0.0%) | 0 (0.0%) |
| $5,000 to $9,999 | 0 (0.0%) | 0 (0.0%) |
| $10,000 to $14,999 | 2 (2.0%) | 5 (55.6%) |
| $15,000 to $19,999 | 1 (1.0%) | 0 (0.0%) |
| $20,000 to $24,999 | 0 (0.0%) | 0 (0.0%) |
| $25,000 to $34,999 | 4 (4.1%) | 3 (33.3%) |
| $35,000 to $49,999 | 4 (4.1%) | 0 (0.0%) |
| $50,000 to $74,999 | 74 (75.5%) | 1 (11.1%) |
| $75,000 to $99,999 | 6 (6.1%) | 0 (0.0%) |
| $100,000 to $149,999 | 5 (5.1%) | 0 (0.0%) |
| $150,000 or more | 2 (2.0%) | 0 (0.0%) |
| Total | 98 (100.0%) | 9 (100.0%) |
Monthly Housing Cost Tiers in Chugwater
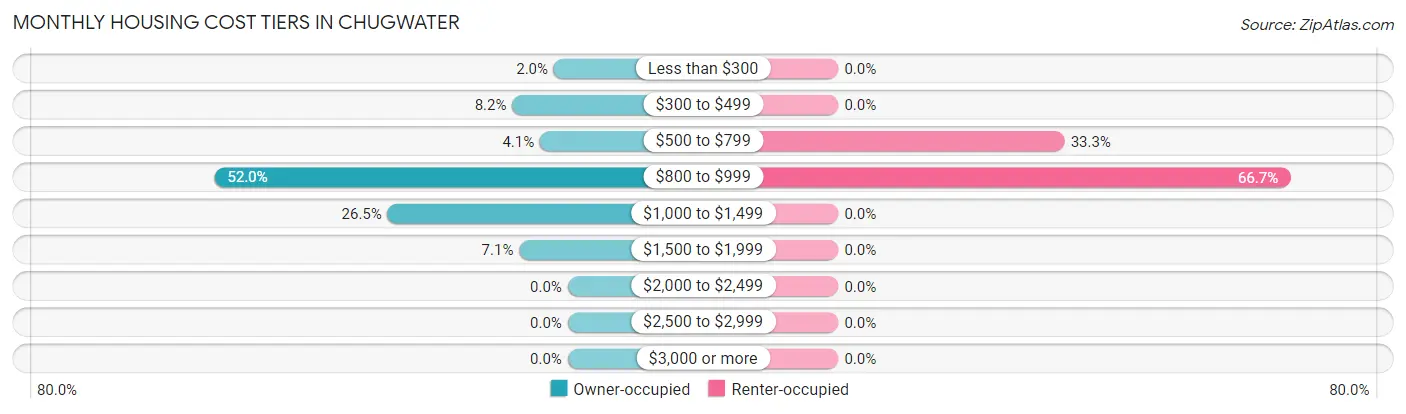
| Monthly Cost | Owner-occupied | Renter-occupied |
| Less than $300 | 2 (2.0%) | 0 (0.0%) |
| $300 to $499 | 8 (8.2%) | 0 (0.0%) |
| $500 to $799 | 4 (4.1%) | 3 (33.3%) |
| $800 to $999 | 51 (52.0%) | 6 (66.7%) |
| $1,000 to $1,499 | 26 (26.5%) | 0 (0.0%) |
| $1,500 to $1,999 | 7 (7.1%) | 0 (0.0%) |
| $2,000 to $2,499 | 0 (0.0%) | 0 (0.0%) |
| $2,500 to $2,999 | 0 (0.0%) | 0 (0.0%) |
| $3,000 or more | 0 (0.0%) | 0 (0.0%) |
| Total | 98 (100.0%) | 9 (100.0%) |
Physical Housing Characteristics in Chugwater
Housing Structures in Chugwater
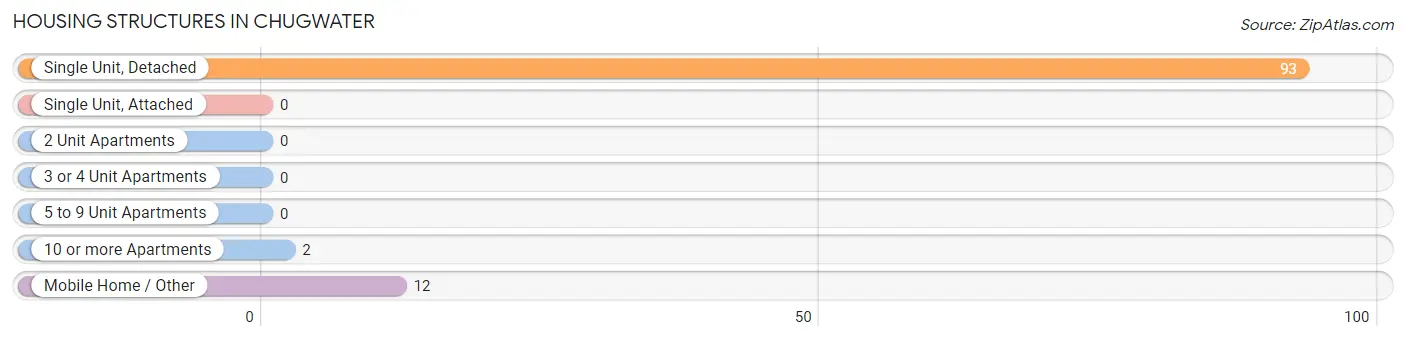
| Structure Type | # Housing Units | % Housing Units |
| Single Unit, Detached | 93 | 86.9% |
| Single Unit, Attached | 0 | 0.0% |
| 2 Unit Apartments | 0 | 0.0% |
| 3 or 4 Unit Apartments | 0 | 0.0% |
| 5 to 9 Unit Apartments | 0 | 0.0% |
| 10 or more Apartments | 2 | 1.9% |
| Mobile Home / Other | 12 | 11.2% |
| Total | 107 | 100.0% |
Housing Structures by Occupancy in Chugwater
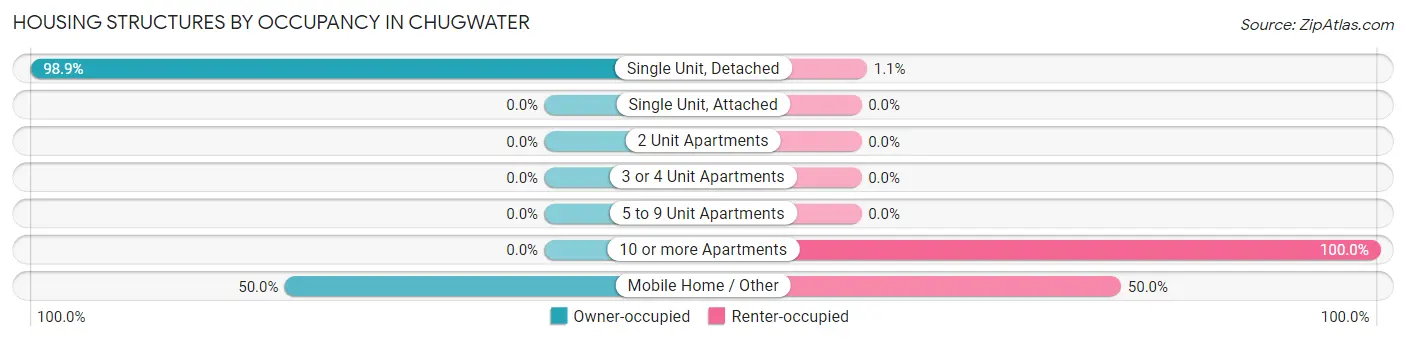
| Structure Type | Owner-occupied | Renter-occupied |
| Single Unit, Detached | 92 (98.9%) | 1 (1.1%) |
| Single Unit, Attached | 0 (0.0%) | 0 (0.0%) |
| 2 Unit Apartments | 0 (0.0%) | 0 (0.0%) |
| 3 or 4 Unit Apartments | 0 (0.0%) | 0 (0.0%) |
| 5 to 9 Unit Apartments | 0 (0.0%) | 0 (0.0%) |
| 10 or more Apartments | 0 (0.0%) | 2 (100.0%) |
| Mobile Home / Other | 6 (50.0%) | 6 (50.0%) |
| Total | 98 (91.6%) | 9 (8.4%) |
Housing Structures by Number of Rooms in Chugwater
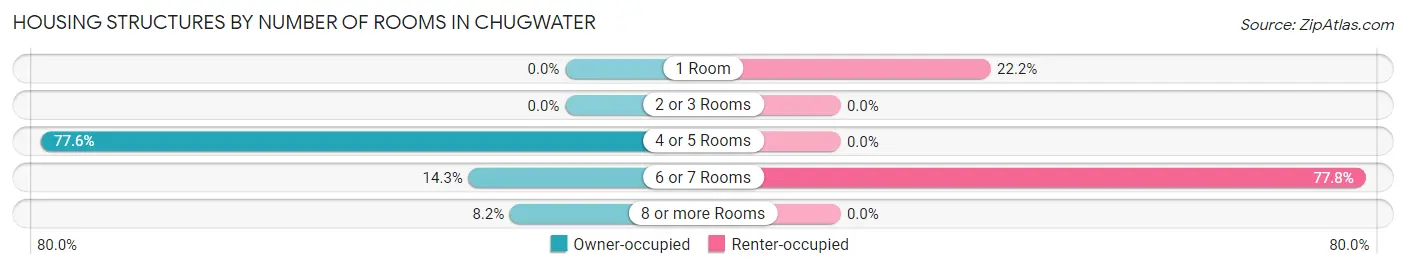
| Number of Rooms | Owner-occupied | Renter-occupied |
| 1 Room | 0 (0.0%) | 2 (22.2%) |
| 2 or 3 Rooms | 0 (0.0%) | 0 (0.0%) |
| 4 or 5 Rooms | 76 (77.5%) | 0 (0.0%) |
| 6 or 7 Rooms | 14 (14.3%) | 7 (77.8%) |
| 8 or more Rooms | 8 (8.2%) | 0 (0.0%) |
| Total | 98 (100.0%) | 9 (100.0%) |
Housing Structure by Heating Type in Chugwater
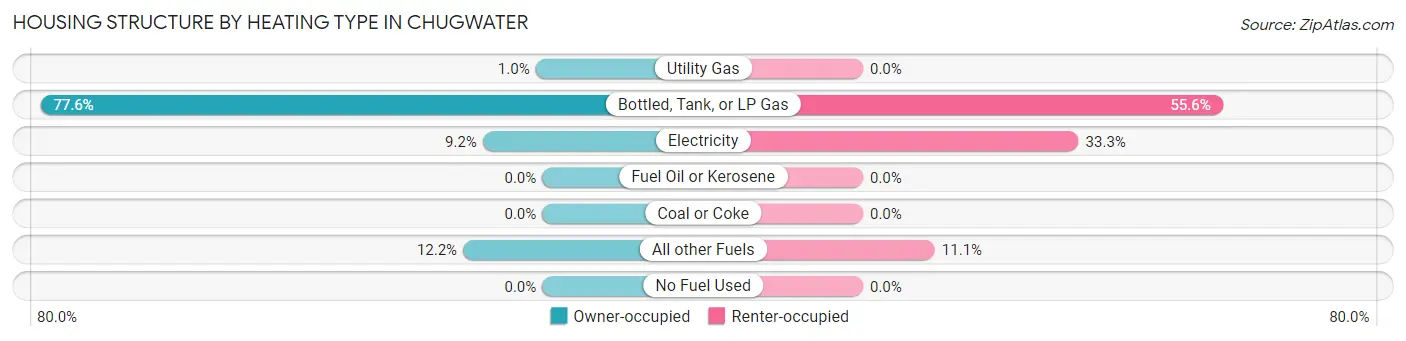
| Heating Type | Owner-occupied | Renter-occupied |
| Utility Gas | 1 (1.0%) | 0 (0.0%) |
| Bottled, Tank, or LP Gas | 76 (77.5%) | 5 (55.6%) |
| Electricity | 9 (9.2%) | 3 (33.3%) |
| Fuel Oil or Kerosene | 0 (0.0%) | 0 (0.0%) |
| Coal or Coke | 0 (0.0%) | 0 (0.0%) |
| All other Fuels | 12 (12.2%) | 1 (11.1%) |
| No Fuel Used | 0 (0.0%) | 0 (0.0%) |
| Total | 98 (100.0%) | 9 (100.0%) |
Household Vehicle Usage in Chugwater
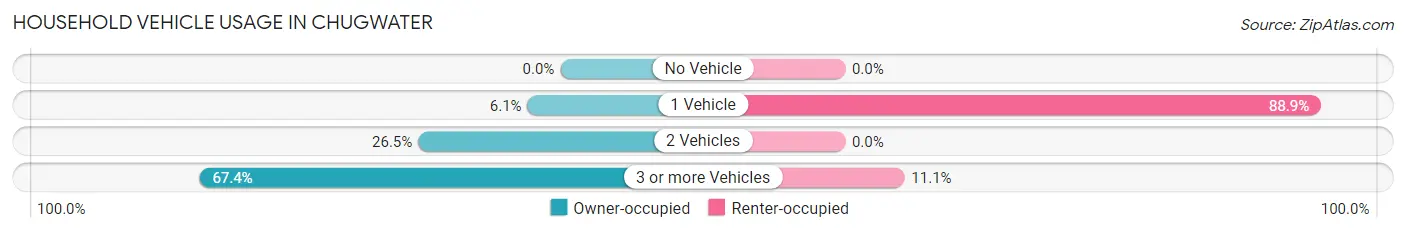
| Vehicles per Household | Owner-occupied | Renter-occupied |
| No Vehicle | 0 (0.0%) | 0 (0.0%) |
| 1 Vehicle | 6 (6.1%) | 8 (88.9%) |
| 2 Vehicles | 26 (26.5%) | 0 (0.0%) |
| 3 or more Vehicles | 66 (67.3%) | 1 (11.1%) |
| Total | 98 (100.0%) | 9 (100.0%) |
Real Estate & Mortgages in Chugwater
Real Estate and Mortgage Overview in Chugwater
| Characteristic | Without Mortgage | With Mortgage |
| Housing Units | 65 | 33 |
| Median Property Value | $268,100 | $179,800 |
| Median Household Income | $63,750 | $2 |
| Monthly Housing Costs | $836 | $0 |
| Real Estate Taxes | $1,681 | $0 |
Property Value by Mortgage Status in Chugwater
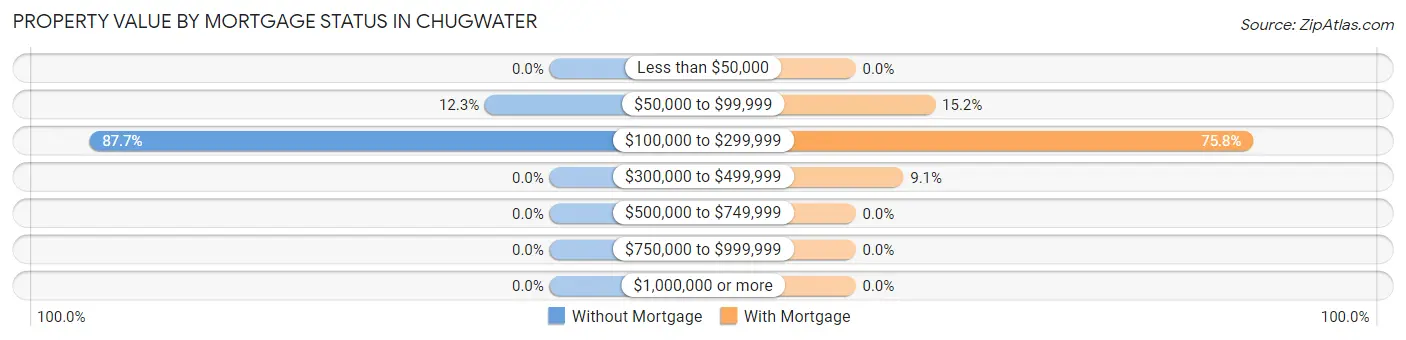
| Property Value | Without Mortgage | With Mortgage |
| Less than $50,000 | 0 (0.0%) | 0 (0.0%) |
| $50,000 to $99,999 | 8 (12.3%) | 5 (15.1%) |
| $100,000 to $299,999 | 57 (87.7%) | 25 (75.8%) |
| $300,000 to $499,999 | 0 (0.0%) | 3 (9.1%) |
| $500,000 to $749,999 | 0 (0.0%) | 0 (0.0%) |
| $750,000 to $999,999 | 0 (0.0%) | 0 (0.0%) |
| $1,000,000 or more | 0 (0.0%) | 0 (0.0%) |
| Total | 65 (100.0%) | 33 (100.0%) |
Household Income by Mortgage Status in Chugwater
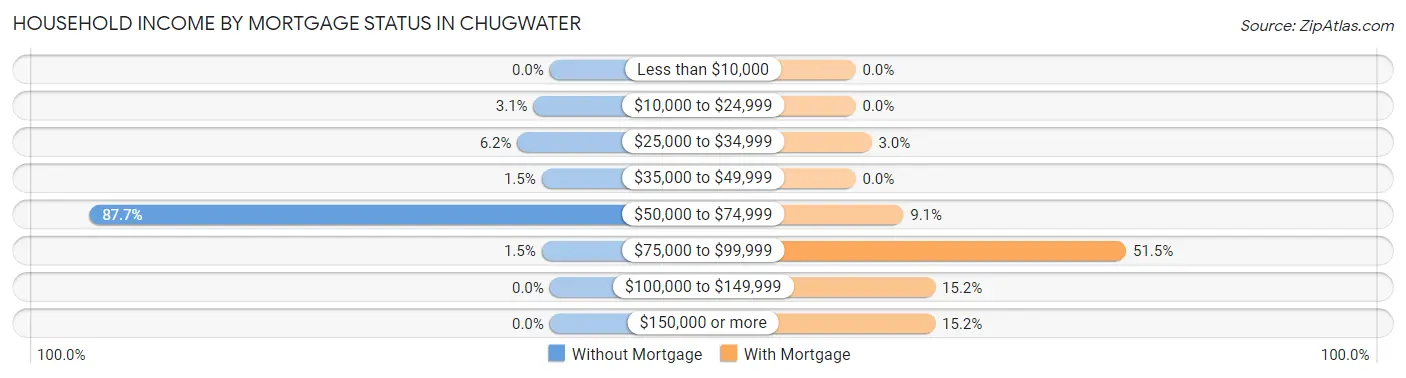
| Household Income | Without Mortgage | With Mortgage |
| Less than $10,000 | 0 (0.0%) | 0 (0.0%) |
| $10,000 to $24,999 | 2 (3.1%) | 0 (0.0%) |
| $25,000 to $34,999 | 4 (6.1%) | 1 (3.0%) |
| $35,000 to $49,999 | 1 (1.5%) | 0 (0.0%) |
| $50,000 to $74,999 | 57 (87.7%) | 3 (9.1%) |
| $75,000 to $99,999 | 1 (1.5%) | 17 (51.5%) |
| $100,000 to $149,999 | 0 (0.0%) | 5 (15.1%) |
| $150,000 or more | 0 (0.0%) | 5 (15.1%) |
| Total | 65 (100.0%) | 33 (100.0%) |
Property Value to Household Income Ratio in Chugwater
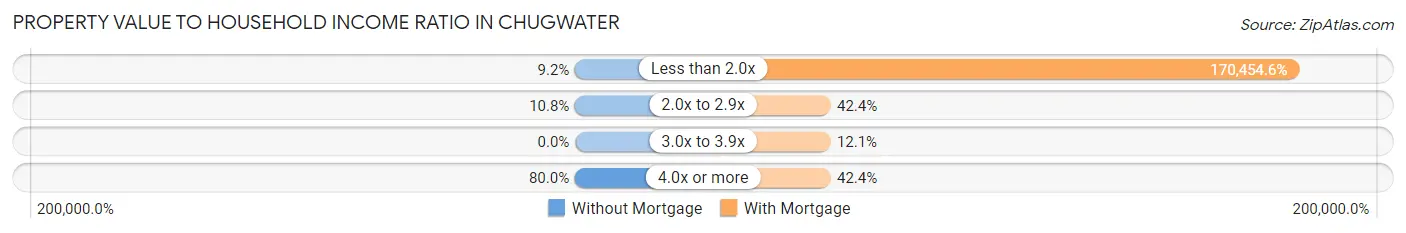
| Value-to-Income Ratio | Without Mortgage | With Mortgage |
| Less than 2.0x | 6 (9.2%) | 56,250 (170,454.5%) |
| 2.0x to 2.9x | 7 (10.8%) | 14 (42.4%) |
| 3.0x to 3.9x | 0 (0.0%) | 4 (12.1%) |
| 4.0x or more | 52 (80.0%) | 14 (42.4%) |
| Total | 65 (100.0%) | 33 (100.0%) |
Real Estate Taxes by Mortgage Status in Chugwater
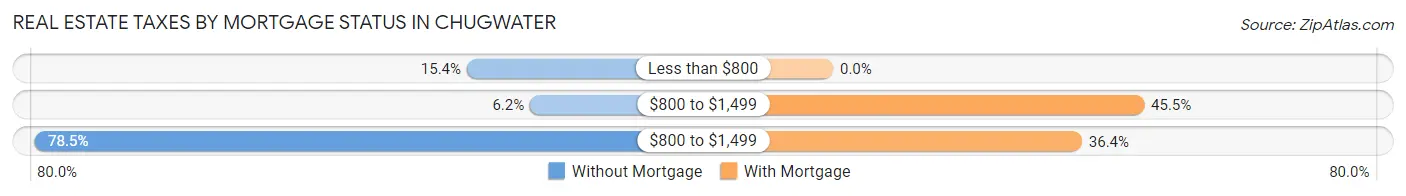
| Property Taxes | Without Mortgage | With Mortgage |
| Less than $800 | 10 (15.4%) | 0 (0.0%) |
| $800 to $1,499 | 4 (6.1%) | 15 (45.5%) |
| $800 to $1,499 | 51 (78.5%) | 12 (36.4%) |
| Total | 65 (100.0%) | 33 (100.0%) |
Health & Disability in Chugwater
Health Insurance Coverage by Age in Chugwater
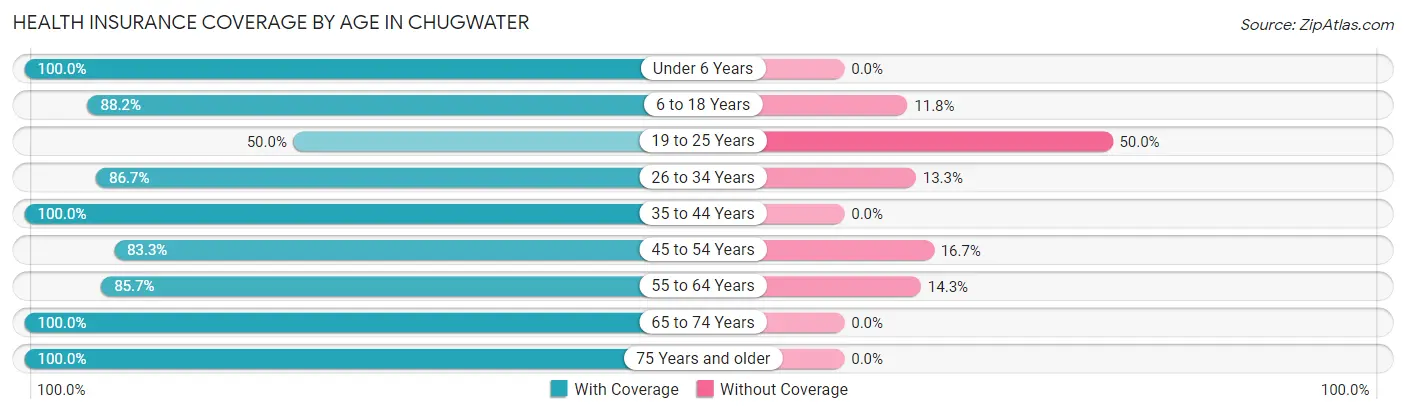
| Age Bracket | With Coverage | Without Coverage |
| Under 6 Years | 13 (100.0%) | 0 (0.0%) |
| 6 to 18 Years | 15 (88.2%) | 2 (11.8%) |
| 19 to 25 Years | 1 (50.0%) | 1 (50.0%) |
| 26 to 34 Years | 13 (86.7%) | 2 (13.3%) |
| 35 to 44 Years | 10 (100.0%) | 0 (0.0%) |
| 45 to 54 Years | 5 (83.3%) | 1 (16.7%) |
| 55 to 64 Years | 18 (85.7%) | 3 (14.3%) |
| 65 to 74 Years | 94 (100.0%) | 0 (0.0%) |
| 75 Years and older | 18 (100.0%) | 0 (0.0%) |
| Total | 187 (95.4%) | 9 (4.6%) |
Health Insurance Coverage by Citizenship Status in Chugwater
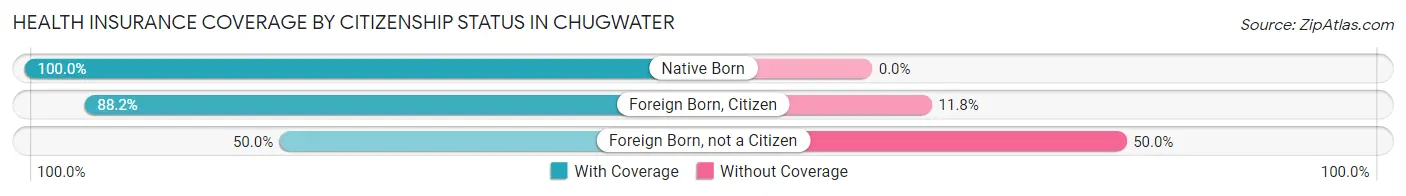
| Citizenship Status | With Coverage | Without Coverage |
| Native Born | 13 (100.0%) | 0 (0.0%) |
| Foreign Born, Citizen | 15 (88.2%) | 2 (11.8%) |
| Foreign Born, not a Citizen | 1 (50.0%) | 1 (50.0%) |
Health Insurance Coverage by Household Income in Chugwater
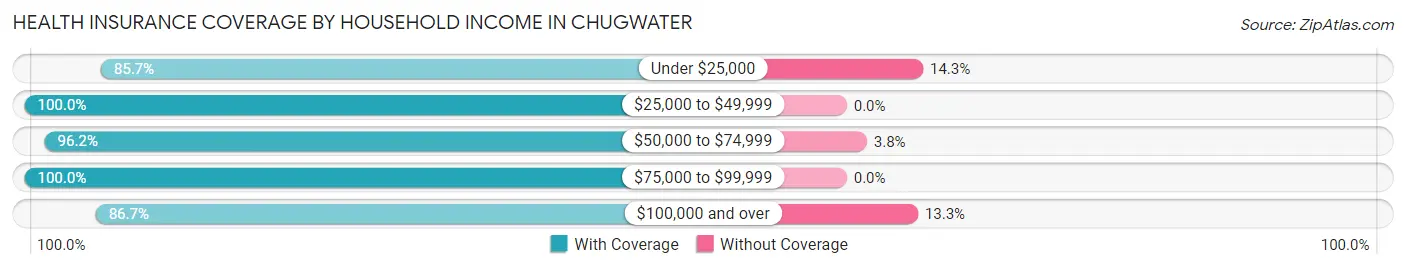
| Household Income | With Coverage | Without Coverage |
| Under $25,000 | 12 (85.7%) | 2 (14.3%) |
| $25,000 to $49,999 | 12 (100.0%) | 0 (0.0%) |
| $50,000 to $74,999 | 128 (96.2%) | 5 (3.8%) |
| $75,000 to $99,999 | 22 (100.0%) | 0 (0.0%) |
| $100,000 and over | 13 (86.7%) | 2 (13.3%) |
Public vs Private Health Insurance Coverage by Age in Chugwater
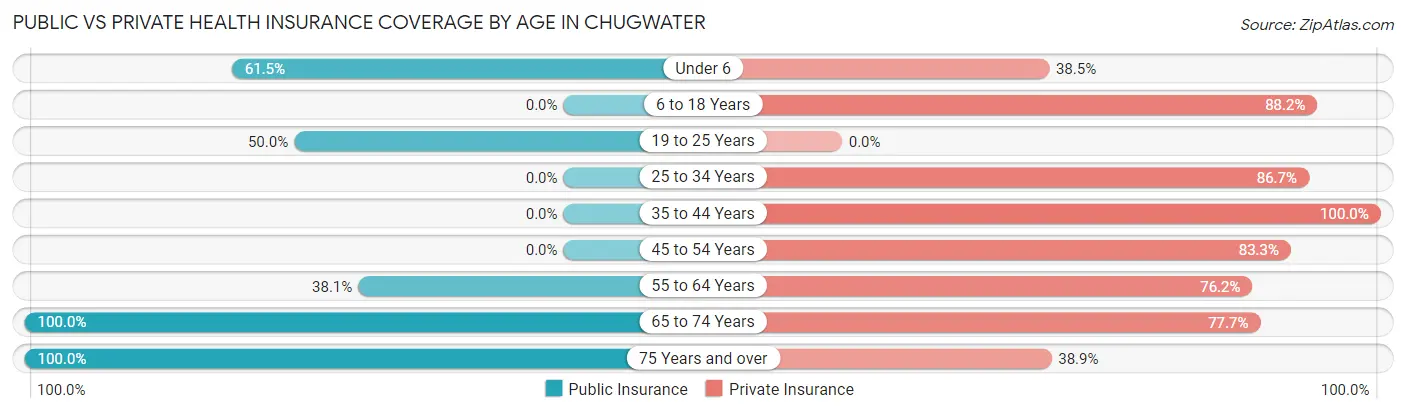
| Age Bracket | Public Insurance | Private Insurance |
| Under 6 | 8 (61.5%) | 5 (38.5%) |
| 6 to 18 Years | 0 (0.0%) | 15 (88.2%) |
| 19 to 25 Years | 1 (50.0%) | 0 (0.0%) |
| 25 to 34 Years | 0 (0.0%) | 13 (86.7%) |
| 35 to 44 Years | 0 (0.0%) | 10 (100.0%) |
| 45 to 54 Years | 0 (0.0%) | 5 (83.3%) |
| 55 to 64 Years | 8 (38.1%) | 16 (76.2%) |
| 65 to 74 Years | 94 (100.0%) | 73 (77.7%) |
| 75 Years and over | 18 (100.0%) | 7 (38.9%) |
| Total | 129 (65.8%) | 144 (73.5%) |
Disability Status by Sex by Age in Chugwater
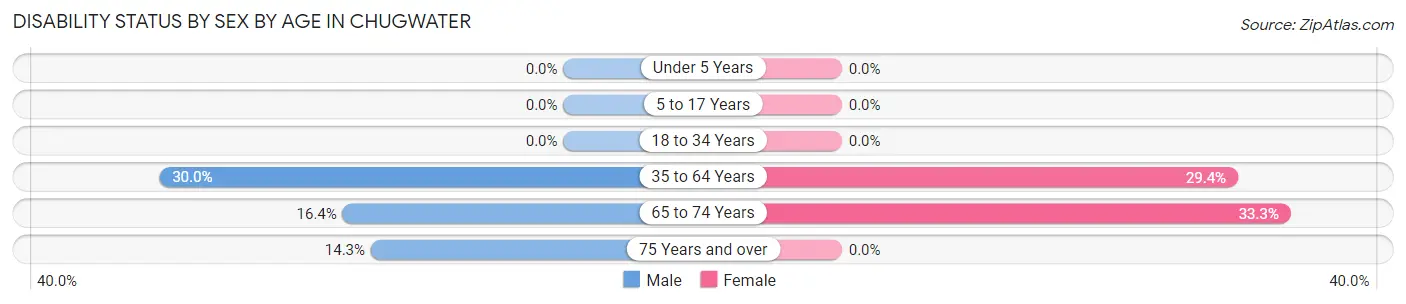
| Age Bracket | Male | Female |
| Under 5 Years | 0 (0.0%) | 0 (0.0%) |
| 5 to 17 Years | 0 (0.0%) | 0 (0.0%) |
| 18 to 34 Years | 0 (0.0%) | 0 (0.0%) |
| 35 to 64 Years | 6 (30.0%) | 5 (29.4%) |
| 65 to 74 Years | 10 (16.4%) | 11 (33.3%) |
| 75 Years and over | 2 (14.3%) | 0 (0.0%) |
Disability Class by Sex by Age in Chugwater
Disability Class: Hearing Difficulty
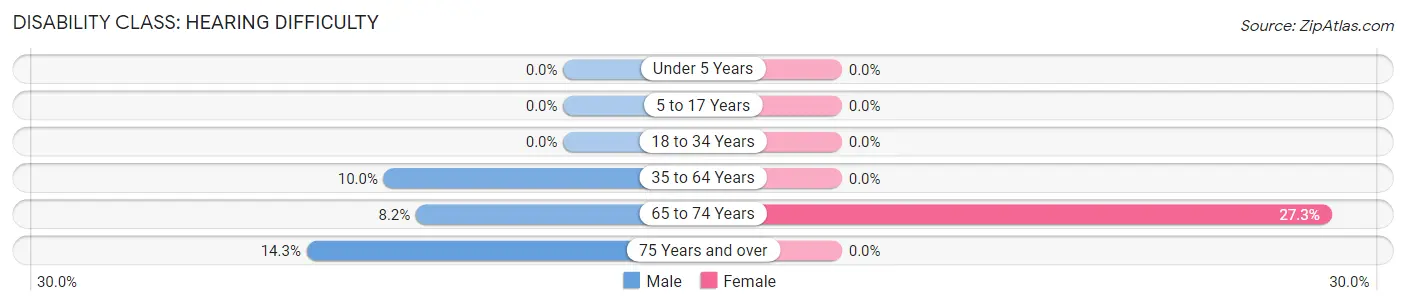
| Age Bracket | Male | Female |
| Under 5 Years | 0 (0.0%) | 0 (0.0%) |
| 5 to 17 Years | 0 (0.0%) | 0 (0.0%) |
| 18 to 34 Years | 0 (0.0%) | 0 (0.0%) |
| 35 to 64 Years | 2 (10.0%) | 0 (0.0%) |
| 65 to 74 Years | 5 (8.2%) | 9 (27.3%) |
| 75 Years and over | 2 (14.3%) | 0 (0.0%) |
Disability Class: Vision Difficulty
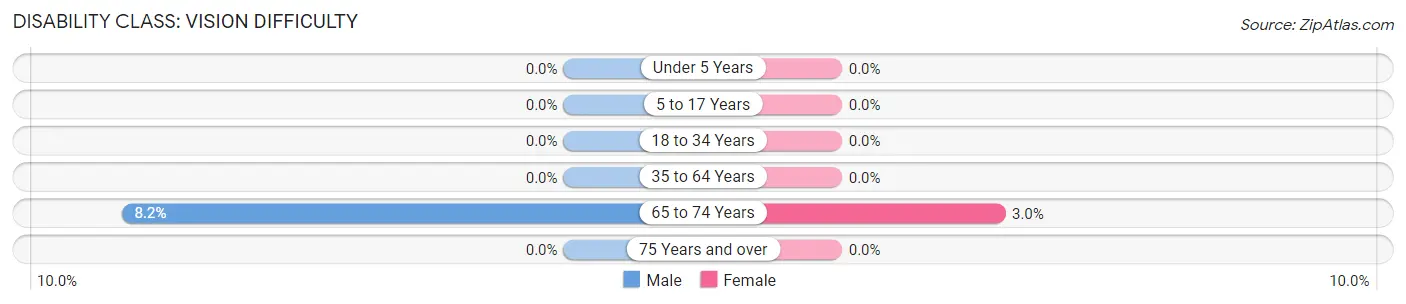
| Age Bracket | Male | Female |
| Under 5 Years | 0 (0.0%) | 0 (0.0%) |
| 5 to 17 Years | 0 (0.0%) | 0 (0.0%) |
| 18 to 34 Years | 0 (0.0%) | 0 (0.0%) |
| 35 to 64 Years | 0 (0.0%) | 0 (0.0%) |
| 65 to 74 Years | 5 (8.2%) | 1 (3.0%) |
| 75 Years and over | 0 (0.0%) | 0 (0.0%) |
Disability Class: Cognitive Difficulty
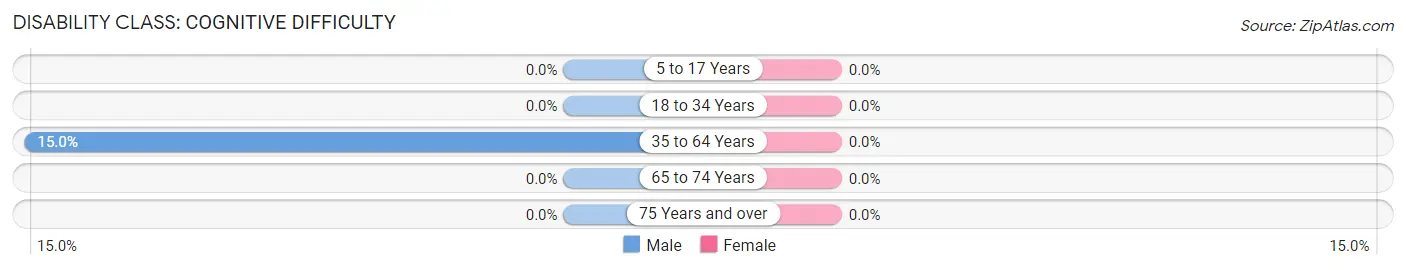
| Age Bracket | Male | Female |
| 5 to 17 Years | 0 (0.0%) | 0 (0.0%) |
| 18 to 34 Years | 0 (0.0%) | 0 (0.0%) |
| 35 to 64 Years | 3 (15.0%) | 0 (0.0%) |
| 65 to 74 Years | 0 (0.0%) | 0 (0.0%) |
| 75 Years and over | 0 (0.0%) | 0 (0.0%) |
Disability Class: Ambulatory Difficulty
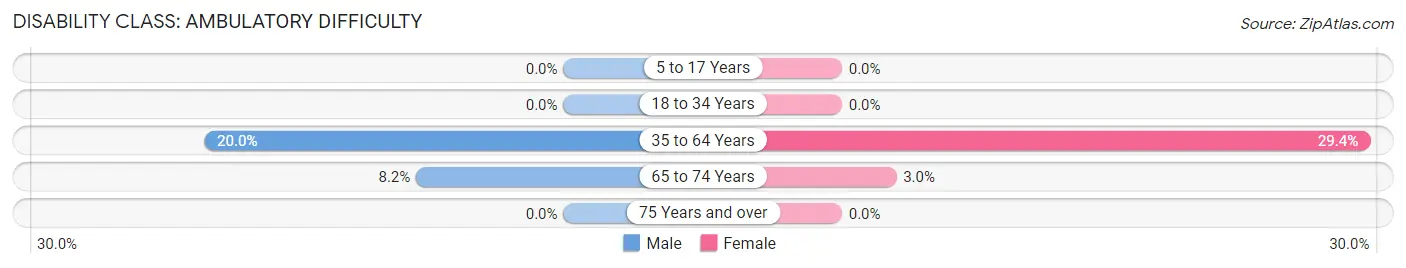
| Age Bracket | Male | Female |
| 5 to 17 Years | 0 (0.0%) | 0 (0.0%) |
| 18 to 34 Years | 0 (0.0%) | 0 (0.0%) |
| 35 to 64 Years | 4 (20.0%) | 5 (29.4%) |
| 65 to 74 Years | 5 (8.2%) | 1 (3.0%) |
| 75 Years and over | 0 (0.0%) | 0 (0.0%) |
Disability Class: Self-Care Difficulty
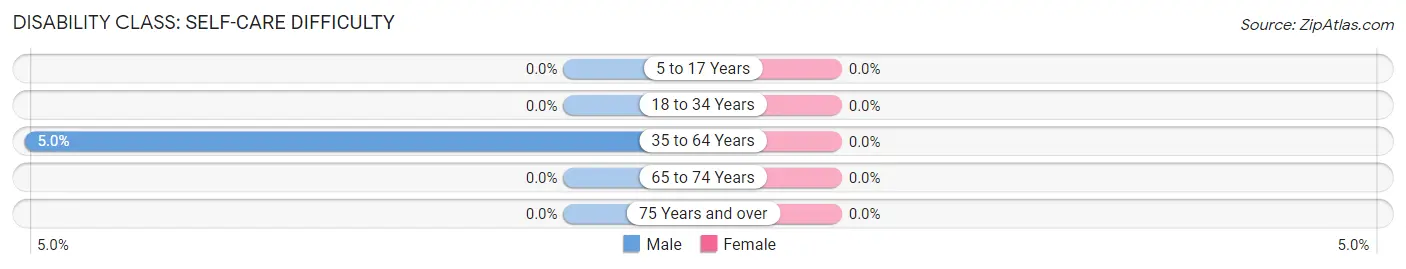
| Age Bracket | Male | Female |
| 5 to 17 Years | 0 (0.0%) | 0 (0.0%) |
| 18 to 34 Years | 0 (0.0%) | 0 (0.0%) |
| 35 to 64 Years | 1 (5.0%) | 0 (0.0%) |
| 65 to 74 Years | 0 (0.0%) | 0 (0.0%) |
| 75 Years and over | 0 (0.0%) | 0 (0.0%) |
Technology Access in Chugwater
Computing Device Access in Chugwater
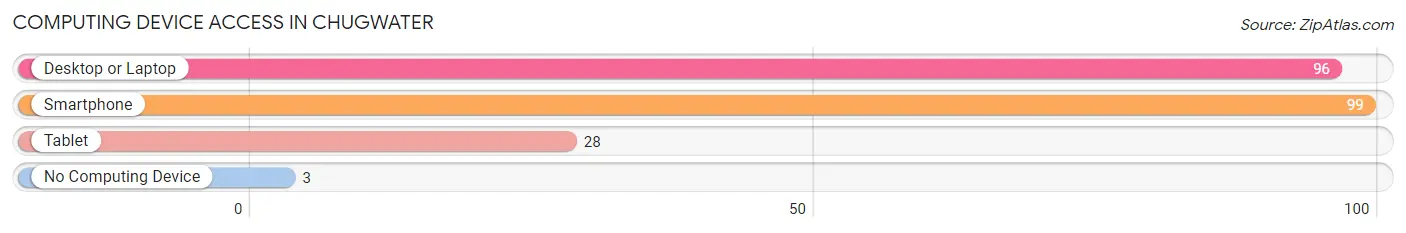
| Device Type | # Households | % Households |
| Desktop or Laptop | 96 | 89.7% |
| Smartphone | 99 | 92.5% |
| Tablet | 28 | 26.2% |
| No Computing Device | 3 | 2.8% |
| Total | 107 | 100.0% |
Internet Access in Chugwater
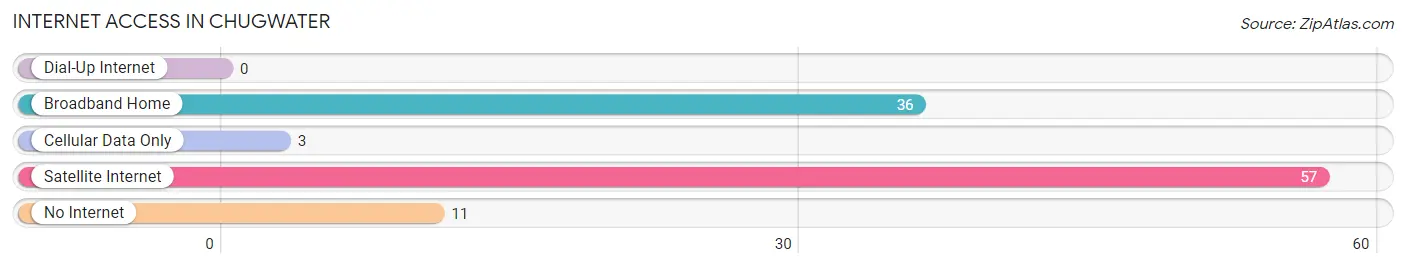
| Internet Type | # Households | % Households |
| Dial-Up Internet | 0 | 0.0% |
| Broadband Home | 36 | 33.6% |
| Cellular Data Only | 3 | 2.8% |
| Satellite Internet | 57 | 53.3% |
| No Internet | 11 | 10.3% |
| Total | 107 | 100.0% |
Chugwater Summary
Chugwater, Wyoming is a small town located in Platte County, Wyoming. It is situated along the Chugwater Creek, which is a tributary of the Laramie River. The town was founded in 1869 and is the oldest settlement in Platte County. The population of Chugwater was estimated to be around 250 people in 2020.
History
Chugwater was founded in 1869 by a group of settlers from the Midwest. The town was named after the Chugwater Creek, which was named by the Native Americans who lived in the area. The creek was named for the sound it made when it was running. The settlers built a trading post and a few cabins, and the town quickly grew.
In 1872, the Union Pacific Railroad built a line through Chugwater, which helped the town to grow even more. The railroad brought in new settlers and businesses, and the town soon had a post office, a school, a hotel, and several stores.
In the late 1800s, Chugwater was a thriving agricultural community. The town was known for its wheat, barley, and oats, and it was also home to several cattle ranches. The town also had a brickyard, a flour mill, and a creamery.
Geography
Chugwater is located in Platte County, Wyoming, about 40 miles west of Cheyenne. The town is situated along the Chugwater Creek, which is a tributary of the Laramie River. The town is surrounded by rolling hills and grasslands, and the nearby Medicine Bow National Forest provides plenty of outdoor recreation opportunities.
The climate in Chugwater is semi-arid, with hot summers and cold winters. The average annual temperature is around 50 degrees Fahrenheit, and the average annual precipitation is around 15 inches.
Economy
The economy of Chugwater is largely based on agriculture and ranching. The town is home to several cattle ranches, and the surrounding area is used for growing wheat, barley, and oats. The town also has a few small businesses, including a grocery store, a hardware store, and a few restaurants.
Demographics
The population of Chugwater was estimated to be around 250 people in 2020. The town is predominantly white, with a small Hispanic population. The median household income is around $45,000, and the median home value is around $150,000.
Conclusion
Chugwater, Wyoming is a small town with a rich history and a vibrant economy. The town is situated along the Chugwater Creek, and it is surrounded by rolling hills and grasslands. The town is predominantly white, with a small Hispanic population, and the median household income is around $45,000. The town is home to several cattle ranches and is known for its wheat, barley, and oats. Chugwater is a great place to live and work, and it is a great place to visit for outdoor recreation.
Common Questions
What is Per Capita Income in Chugwater?
Per Capita income in Chugwater is $31,164.
What is the Median Family Income in Chugwater?
Median Family Income in Chugwater is $63,725.
What is the Median Household income in Chugwater?
Median Household Income in Chugwater is $63,309.
What is Inequality or Gini Index in Chugwater?
Inequality or Gini Index in Chugwater is 0.20.
What is the Total Population of Chugwater?
Total Population of Chugwater is 196.
What is the Total Male Population of Chugwater?
Total Male Population of Chugwater is 112.
What is the Total Female Population of Chugwater?
Total Female Population of Chugwater is 84.
What is the Ratio of Males per 100 Females in Chugwater?
There are 133.33 Males per 100 Females in Chugwater.
What is the Ratio of Females per 100 Males in Chugwater?
There are 75.00 Females per 100 Males in Chugwater.
What is the Median Population Age in Chugwater?
Median Population Age in Chugwater is 69.5 Years.
What is the Average Family Size in Chugwater
Average Family Size in Chugwater is 2.0 People.
What is the Average Household Size in Chugwater
Average Household Size in Chugwater is 1.8 People.
How Large is the Labor Force in Chugwater?
There are 72 People in the Labor Forcein in Chugwater.
What is the Percentage of People in the Labor Force in Chugwater?
41.4% of People are in the Labor Force in Chugwater.
What is the Unemployment Rate in Chugwater?
Unemployment Rate in Chugwater is 2.8%.