Burns, WY Map & Demographics
Burns Map
Burns Overview
$33,205
PER CAPITA INCOME
$47,128
AVG HOUSEHOLD INCOME
42.9%
WAGE / INCOME GAP [ % ]
57.1¢/ $1
WAGE / INCOME GAP [ $ ]
0.35
INEQUALITY / GINI INDEX
392
TOTAL POPULATION
186
MALE POPULATION
206
FEMALE POPULATION
90.29
MALES / 100 FEMALES
110.75
FEMALES / 100 MALES
54.5
MEDIAN AGE
2.7
AVG FAMILY SIZE
2.1
AVG HOUSEHOLD SIZE
179
LABOR FORCE [ PEOPLE ]
53.8%
PERCENT IN LABOR FORCE
Burns Zip Codes
Burns Area Codes
Income in Burns
Income Overview in Burns
| Characteristic | Number | Measure |
| Per Capita Income | 392 | $33,205 |
| Median Family Income | 119 | $0 |
| Mean Family Income | 119 | $85,753 |
| Median Household Income | 182 | $47,128 |
| Mean Household Income | 182 | $71,149 |
| Income Deficit | 119 | $0 |
| Wage / Income Gap (%) | 392 | 42.86% |
| Wage / Income Gap ($) | 392 | 57.14¢ per $1 |
| Gini / Inequality Index | 392 | 0.35 |
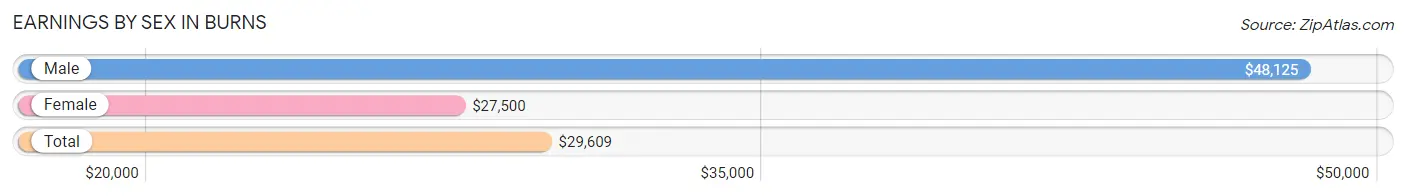
Earnings by Sex in Burns
Average Earnings in Burns are $29,609, $48,125 for men and $27,500 for women, a difference of 42.9%.
| Sex | Number | Average Earnings |
| Male | 119 (58.1%) | $48,125 |
| Female | 86 (41.9%) | $27,500 |
| Total | 205 (100.0%) | $29,609 |
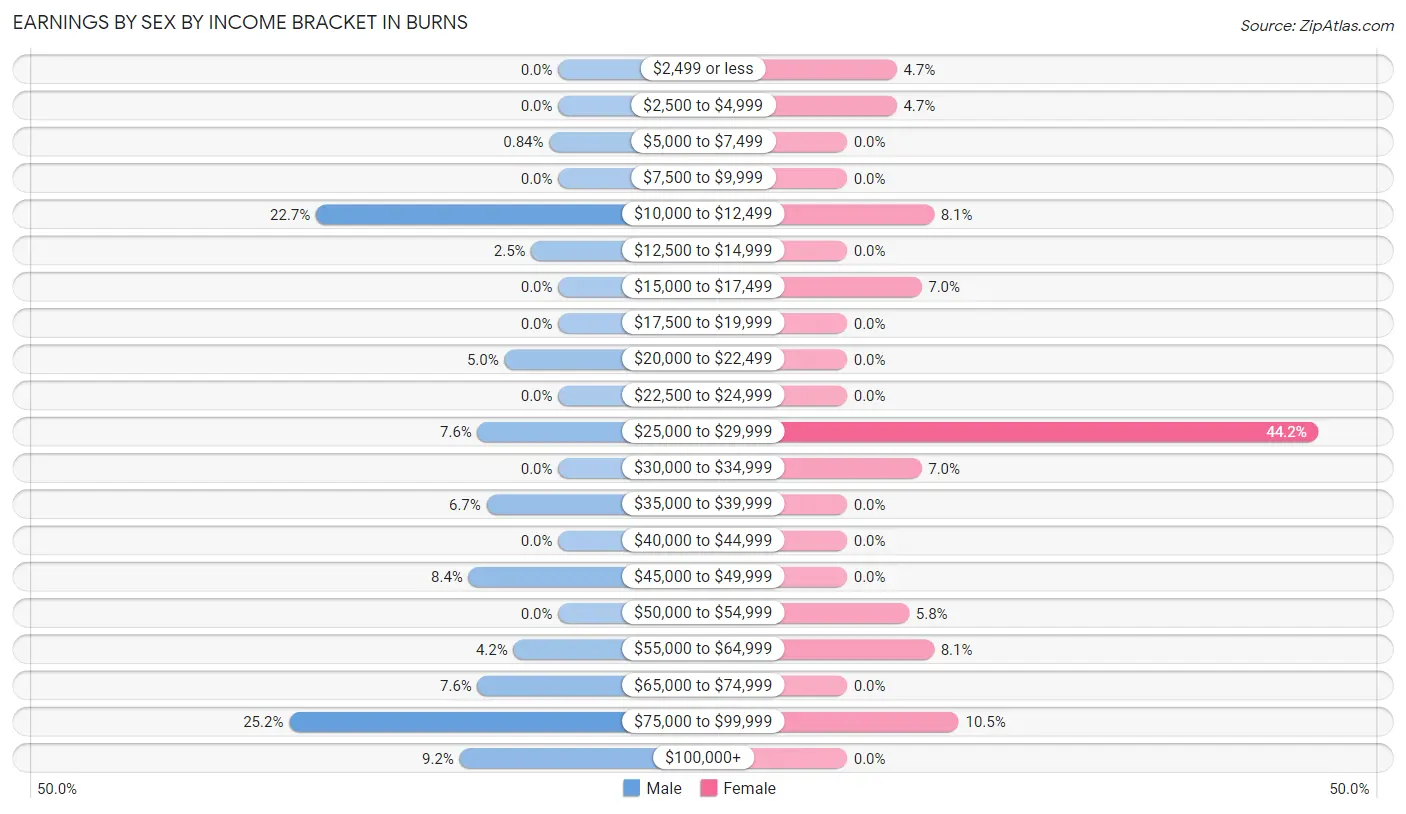
Earnings by Sex by Income Bracket in Burns
The most common earnings brackets in Burns are $75,000 to $99,999 for men (30 | 25.2%) and $25,000 to $29,999 for women (38 | 44.2%).
| Income | Male | Female |
| $2,499 or less | 0 (0.0%) | 4 (4.6%) |
| $2,500 to $4,999 | 0 (0.0%) | 4 (4.6%) |
| $5,000 to $7,499 | 1 (0.8%) | 0 (0.0%) |
| $7,500 to $9,999 | 0 (0.0%) | 0 (0.0%) |
| $10,000 to $12,499 | 27 (22.7%) | 7 (8.1%) |
| $12,500 to $14,999 | 3 (2.5%) | 0 (0.0%) |
| $15,000 to $17,499 | 0 (0.0%) | 6 (7.0%) |
| $17,500 to $19,999 | 0 (0.0%) | 0 (0.0%) |
| $20,000 to $22,499 | 6 (5.0%) | 0 (0.0%) |
| $22,500 to $24,999 | 0 (0.0%) | 0 (0.0%) |
| $25,000 to $29,999 | 9 (7.6%) | 38 (44.2%) |
| $30,000 to $34,999 | 0 (0.0%) | 6 (7.0%) |
| $35,000 to $39,999 | 8 (6.7%) | 0 (0.0%) |
| $40,000 to $44,999 | 0 (0.0%) | 0 (0.0%) |
| $45,000 to $49,999 | 10 (8.4%) | 0 (0.0%) |
| $50,000 to $54,999 | 0 (0.0%) | 5 (5.8%) |
| $55,000 to $64,999 | 5 (4.2%) | 7 (8.1%) |
| $65,000 to $74,999 | 9 (7.6%) | 0 (0.0%) |
| $75,000 to $99,999 | 30 (25.2%) | 9 (10.5%) |
| $100,000+ | 11 (9.2%) | 0 (0.0%) |
| Total | 119 (100.0%) | 86 (100.0%) |
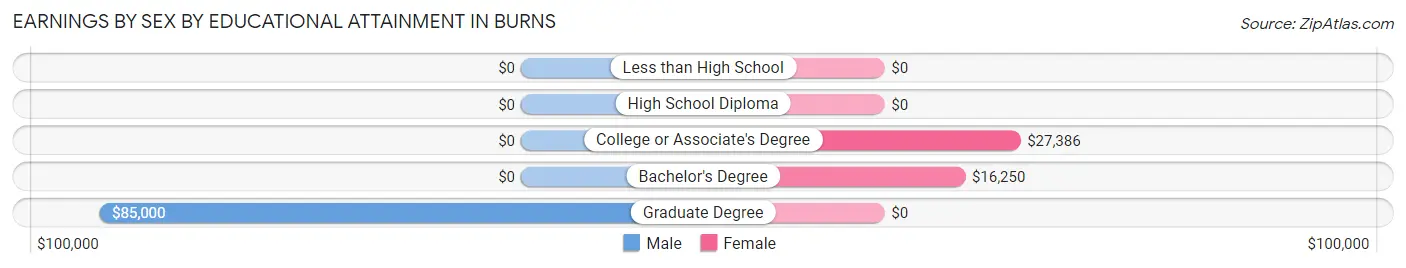
Earnings by Sex by Educational Attainment in Burns
Average earnings in Burns are $49,375 for men and $27,500 for women, a difference of 44.3%. Men with an educational attainment of graduate degree enjoy the highest average annual earnings of $85,000, while those with graduate degree education earn the least with $85,000. Women with an educational attainment of college or associate's degree earn the most with the average annual earnings of $27,386, while those with bachelor's degree education have the smallest earnings of $16,250.
| Educational Attainment | Male Income | Female Income |
| Less than High School | - | - |
| High School Diploma | - | - |
| College or Associate's Degree | - | - |
| Bachelor's Degree | - | - |
| Graduate Degree | $85,000 | $0 |
| Total | $49,375 | $27,500 |
Family Income in Burns
Family Income Brackets in Burns
According to the Burns family income data, there are 43 families falling into the $35,000 to $49,999 income range, which is the most common income bracket and makes up 36.1% of all families.
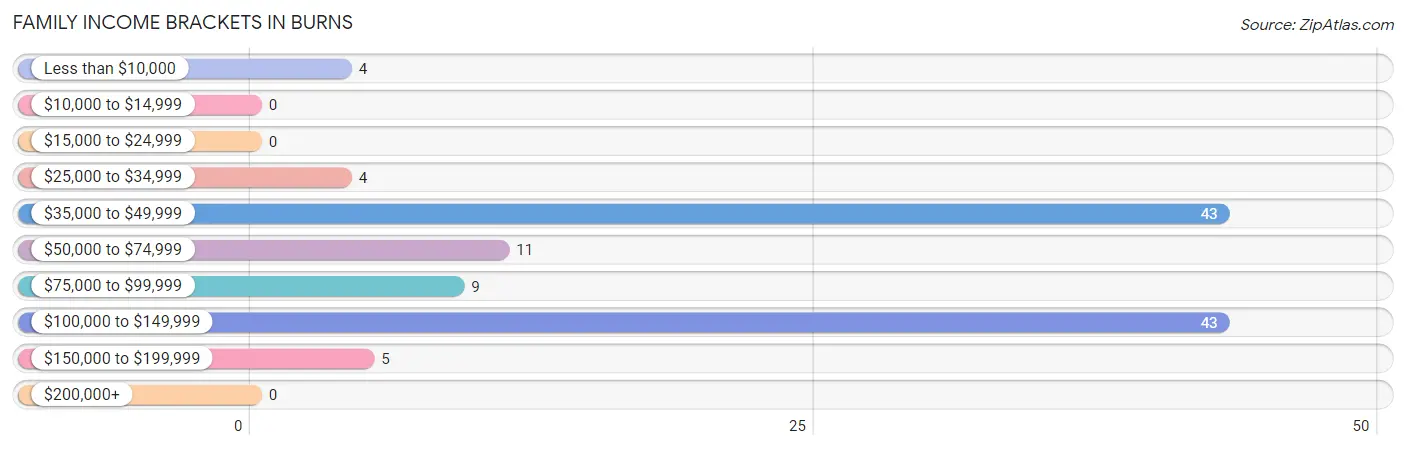
| Income Bracket | # Families | % Families |
| Less than $10,000 | 4 | 3.4% |
| $10,000 to $14,999 | 0 | 0.0% |
| $15,000 to $24,999 | 0 | 0.0% |
| $25,000 to $34,999 | 4 | 3.4% |
| $35,000 to $49,999 | 43 | 36.1% |
| $50,000 to $74,999 | 11 | 9.2% |
| $75,000 to $99,999 | 9 | 7.6% |
| $100,000 to $149,999 | 43 | 36.1% |
| $150,000 to $199,999 | 5 | 4.2% |
| $200,000+ | 0 | 0.0% |
Family Income by Famaliy Size in Burns
3-person families (35 | 29.4%) account for the highest median family income in Burns with $143,512 per family, while 3-person families (35 | 29.4%) have the highest median income of $47,837 per family member.
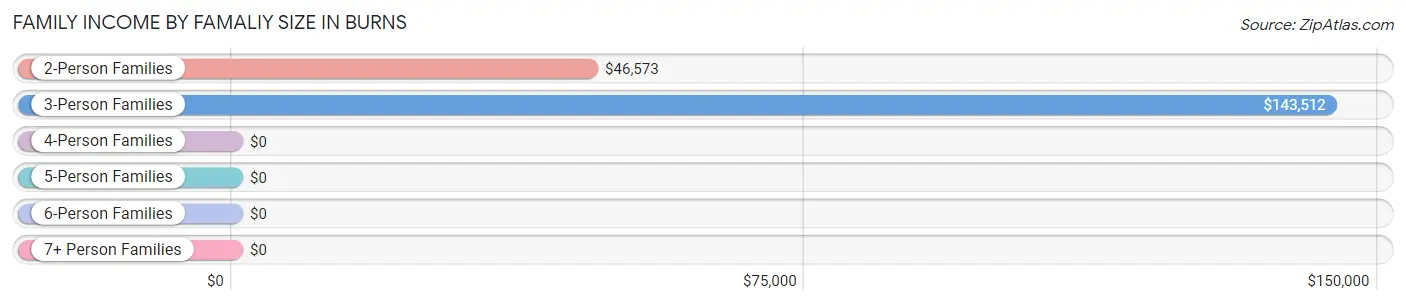
| Income Bracket | # Families | Median Income |
| 2-Person Families | 63 (52.9%) | $46,573 |
| 3-Person Families | 35 (29.4%) | $143,512 |
| 4-Person Families | 11 (9.2%) | $0 |
| 5-Person Families | 1 (0.8%) | $0 |
| 6-Person Families | 9 (7.6%) | $0 |
| 7+ Person Families | 0 (0.0%) | $0 |
| Total | 119 (100.0%) | $0 |
Family Income by Number of Earners in Burns
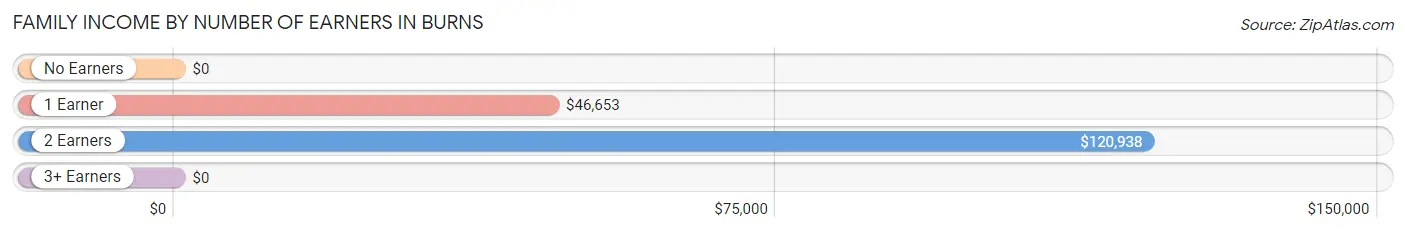
| Number of Earners | # Families | Median Income |
| No Earners | 12 (10.1%) | $0 |
| 1 Earner | 57 (47.9%) | $46,653 |
| 2 Earners | 29 (24.4%) | $120,938 |
| 3+ Earners | 21 (17.6%) | $0 |
| Total | 119 (100.0%) | $0 |
Household Income in Burns
Household Income Brackets in Burns
With 63 households falling in the category, the $35,000 to $49,999 income range is the most frequent in Burns, accounting for 34.6% of all households.
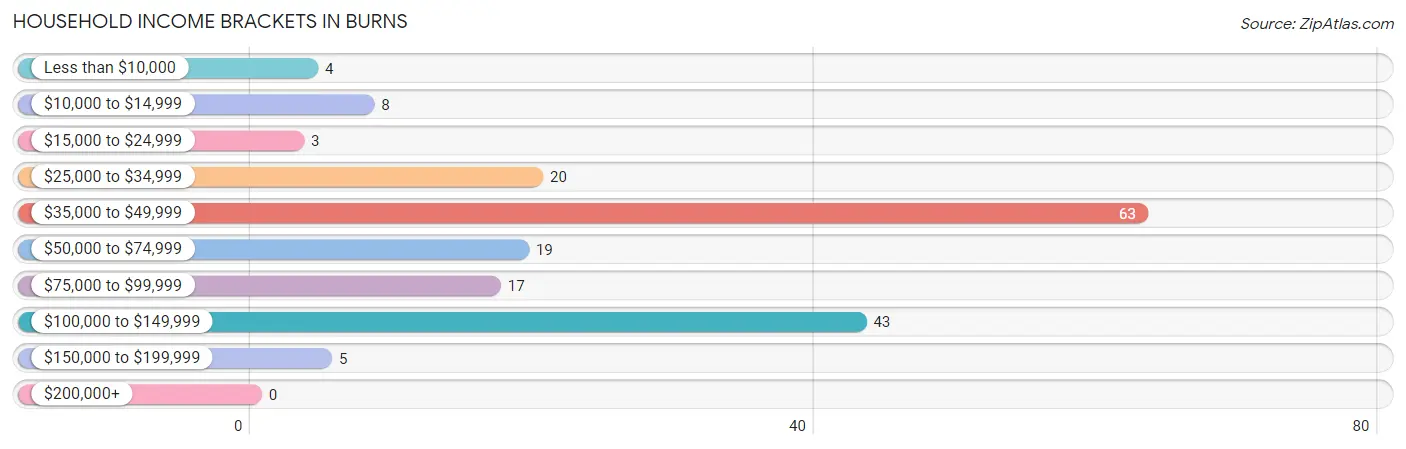
| Income Bracket | # Households | % Households |
| Less than $10,000 | 4 | 2.2% |
| $10,000 to $14,999 | 8 | 4.4% |
| $15,000 to $24,999 | 3 | 1.6% |
| $25,000 to $34,999 | 20 | 11.0% |
| $35,000 to $49,999 | 63 | 34.6% |
| $50,000 to $74,999 | 19 | 10.4% |
| $75,000 to $99,999 | 17 | 9.3% |
| $100,000 to $149,999 | 43 | 23.6% |
| $150,000 to $199,999 | 5 | 2.7% |
| $200,000+ | 0 | 0.0% |
Household Income by Householder Age in Burns
The median household income in Burns is $47,128, with the highest median household income of $76,875 found in the 25 to 44 years age bracket for the primary householder. A total of 40 households (22.0%) fall into this category.
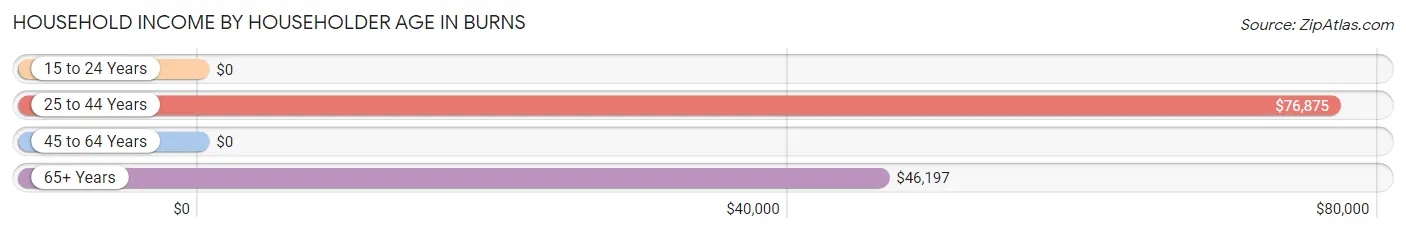
| Income Bracket | # Households | Median Income |
| 15 to 24 Years | 0 (0.0%) | $0 |
| 25 to 44 Years | 40 (22.0%) | $76,875 |
| 45 to 64 Years | 51 (28.0%) | $0 |
| 65+ Years | 91 (50.0%) | $46,197 |
| Total | 182 (100.0%) | $47,128 |
Poverty in Burns
Income Below Poverty by Sex and Age in Burns
With 5.9% poverty level for males and 11.2% for females among the residents of Burns, 55 to 64 year old males and 16 and 17 year old females are the most vulnerable to poverty, with 8 males (25.8%) and 4 females (100.0%) in their respective age groups living below the poverty level.
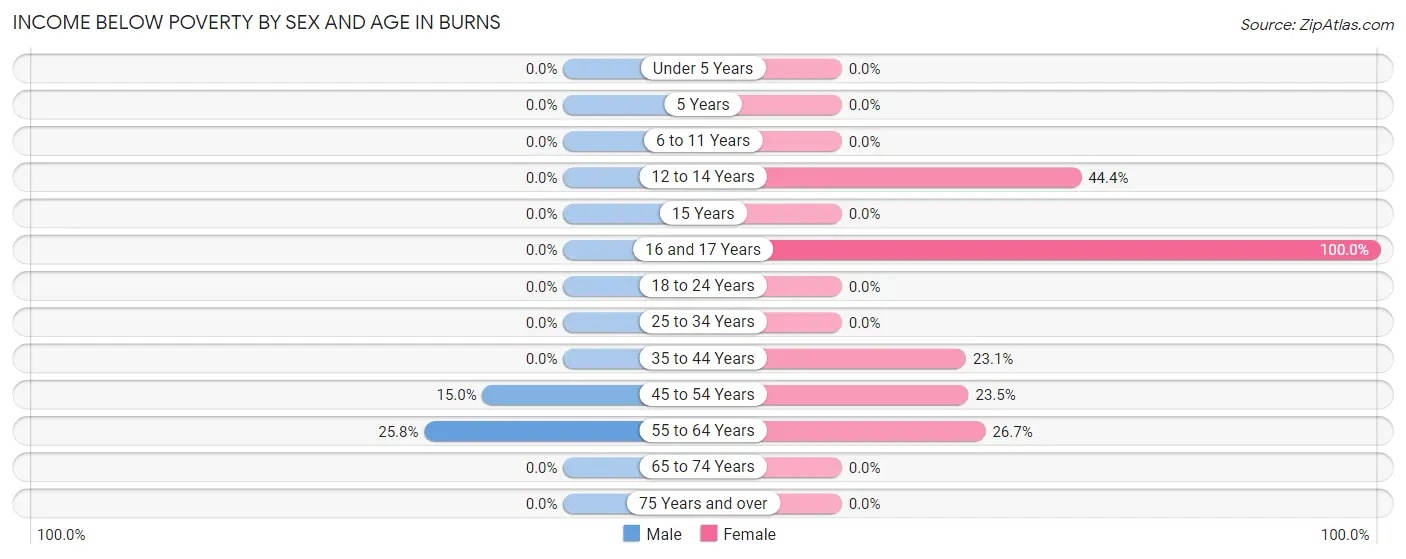
| Age Bracket | Male | Female |
| Under 5 Years | 0 (0.0%) | 0 (0.0%) |
| 5 Years | 0 (0.0%) | 0 (0.0%) |
| 6 to 11 Years | 0 (0.0%) | 0 (0.0%) |
| 12 to 14 Years | 0 (0.0%) | 4 (44.4%) |
| 15 Years | 0 (0.0%) | 0 (0.0%) |
| 16 and 17 Years | 0 (0.0%) | 4 (100.0%) |
| 18 to 24 Years | 0 (0.0%) | 0 (0.0%) |
| 25 to 34 Years | 0 (0.0%) | 0 (0.0%) |
| 35 to 44 Years | 0 (0.0%) | 3 (23.1%) |
| 45 to 54 Years | 3 (15.0%) | 8 (23.5%) |
| 55 to 64 Years | 8 (25.8%) | 4 (26.7%) |
| 65 to 74 Years | 0 (0.0%) | 0 (0.0%) |
| 75 Years and over | 0 (0.0%) | 0 (0.0%) |
| Total | 11 (5.9%) | 23 (11.2%) |
Income Above Poverty by Sex and Age in Burns
According to the poverty statistics in Burns, males aged under 5 years and females aged under 5 years are the age groups that are most secure financially, with 100.0% of males and 100.0% of females in these age groups living above the poverty line.
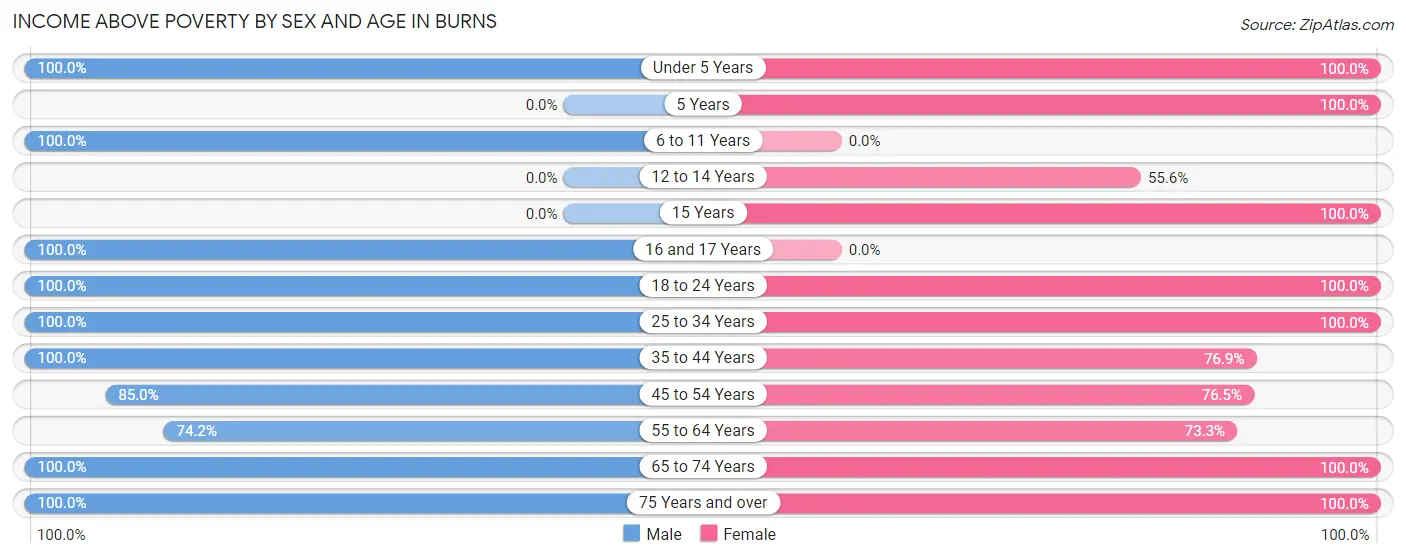
| Age Bracket | Male | Female |
| Under 5 Years | 12 (100.0%) | 14 (100.0%) |
| 5 Years | 0 (0.0%) | 7 (100.0%) |
| 6 to 11 Years | 10 (100.0%) | 0 (0.0%) |
| 12 to 14 Years | 0 (0.0%) | 5 (55.6%) |
| 15 Years | 0 (0.0%) | 7 (100.0%) |
| 16 and 17 Years | 6 (100.0%) | 0 (0.0%) |
| 18 to 24 Years | 6 (100.0%) | 3 (100.0%) |
| 25 to 34 Years | 15 (100.0%) | 19 (100.0%) |
| 35 to 44 Years | 28 (100.0%) | 10 (76.9%) |
| 45 to 54 Years | 17 (85.0%) | 26 (76.5%) |
| 55 to 64 Years | 23 (74.2%) | 11 (73.3%) |
| 65 to 74 Years | 40 (100.0%) | 65 (100.0%) |
| 75 Years and over | 18 (100.0%) | 16 (100.0%) |
| Total | 175 (94.1%) | 183 (88.8%) |
Income Below Poverty Among Married-Couple Families in Burns
The poverty statistics for married-couple families in Burns show that 3.6% or 4 of the total 111 families live below the poverty line. Families with 1 or 2 children have the highest poverty rate of 20.0%, comprising of 4 families. On the other hand, families with no children have the lowest poverty rate of 0.0%, which includes 0 families.
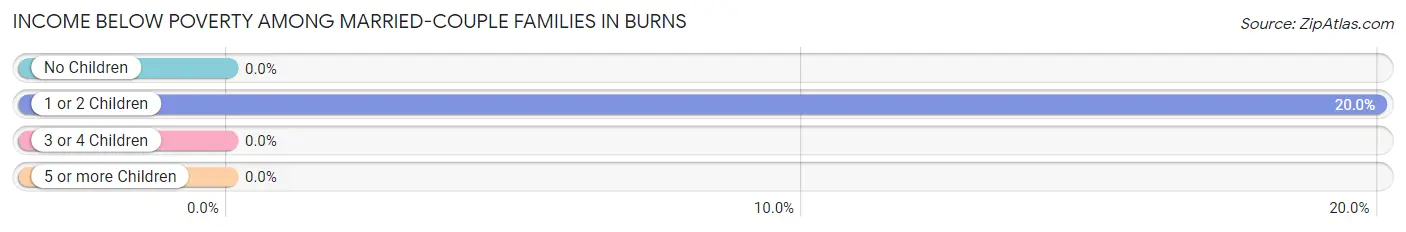
| Children | Above Poverty | Below Poverty |
| No Children | 81 (100.0%) | 0 (0.0%) |
| 1 or 2 Children | 16 (80.0%) | 4 (20.0%) |
| 3 or 4 Children | 10 (100.0%) | 0 (0.0%) |
| 5 or more Children | 0 (0.0%) | 0 (0.0%) |
| Total | 107 (96.4%) | 4 (3.6%) |
Income Below Poverty Among Single-Parent Households in Burns
| Children | Single Father | Single Mother |
| No Children | 0 (0.0%) | 0 (0.0%) |
| 1 or 2 Children | 0 (0.0%) | 0 (0.0%) |
| 3 or 4 Children | 0 (0.0%) | 0 (0.0%) |
| 5 or more Children | 0 (0.0%) | 0 (0.0%) |
| Total | 0 (0.0%) | 0 (0.0%) |
Income Below Poverty Among Married-Couple vs Single-Parent Households in Burns
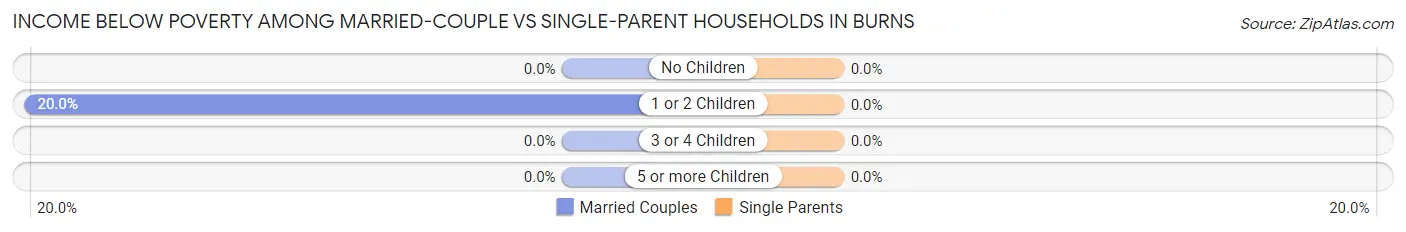
| Children | Married-Couple Families | Single-Parent Households |
| No Children | 0 (0.0%) | 0 (0.0%) |
| 1 or 2 Children | 4 (20.0%) | 0 (0.0%) |
| 3 or 4 Children | 0 (0.0%) | 0 (0.0%) |
| 5 or more Children | 0 (0.0%) | 0 (0.0%) |
| Total | 4 (3.6%) | 0 (0.0%) |
Race in Burns
The most populous races in Burns are White / Caucasian (329 | 83.9%), Two or more Races (47 | 12.0%), and Some other Race (16 | 4.1%).
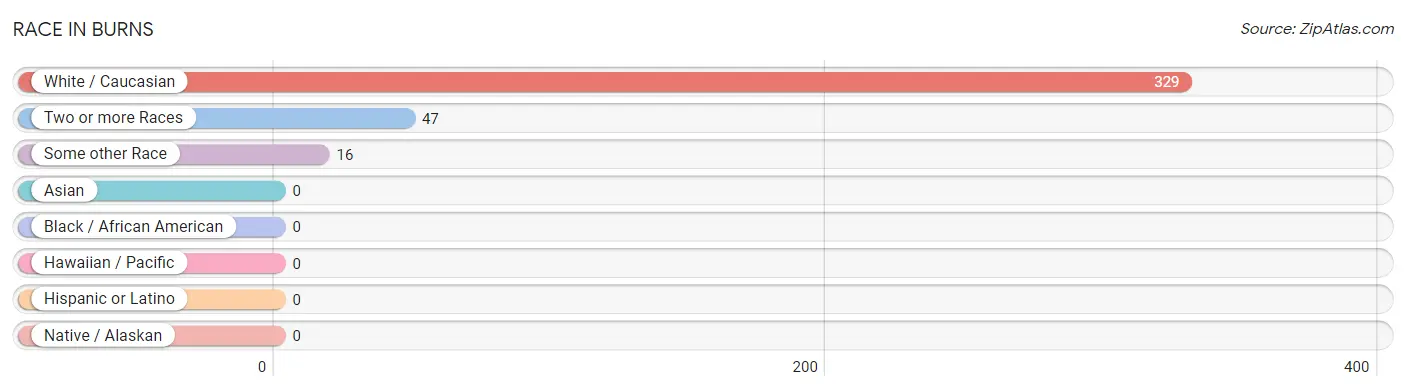
| Race | # Population | % Population |
| Asian | 0 | 0.0% |
| Black / African American | 0 | 0.0% |
| Hawaiian / Pacific | 0 | 0.0% |
| Hispanic or Latino | 0 | 0.0% |
| Native / Alaskan | 0 | 0.0% |
| White / Caucasian | 329 | 83.9% |
| Two or more Races | 47 | 12.0% |
| Some other Race | 16 | 4.1% |
| Total | 392 | 100.0% |
Ancestry in Burns
The most populous ancestries reported in Burns are English (97 | 24.7%), German (52 | 13.3%), Irish (29 | 7.4%), Scottish (24 | 6.1%), and Scandinavian (23 | 5.9%), together accounting for 57.4% of all Burns residents.
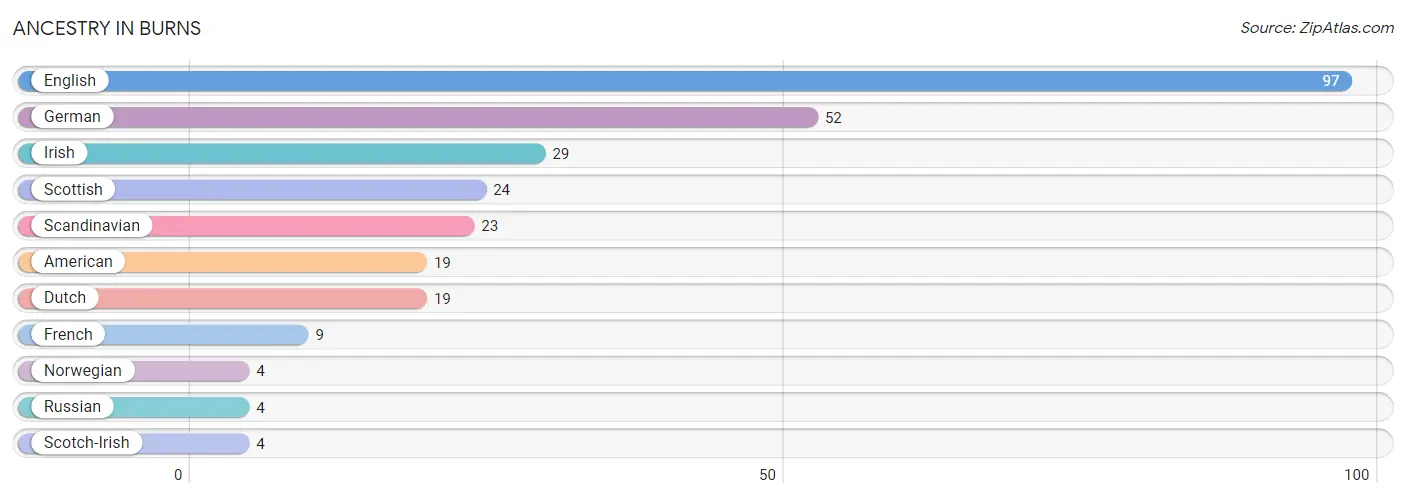
| Ancestry | # Population | % Population |
| American | 19 | 4.9% |
| Dutch | 19 | 4.9% |
| English | 97 | 24.7% |
| French | 9 | 2.3% |
| German | 52 | 13.3% |
| Irish | 29 | 7.4% |
| Norwegian | 4 | 1.0% |
| Russian | 4 | 1.0% |
| Scandinavian | 23 | 5.9% |
| Scotch-Irish | 4 | 1.0% |
| Scottish | 24 | 6.1% | View All 11 Rows |
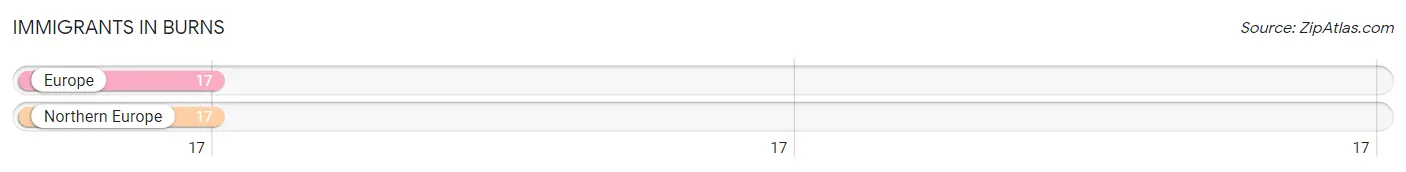
Immigrants in Burns
The most numerous immigrant groups reported in Burns came from Europe (17 | 4.3%), and Northern Europe (17 | 4.3%), together accounting for 8.7% of all Burns residents.
| Immigration Origin | # Population | % Population |
| Europe | 17 | 4.3% |
| Northern Europe | 17 | 4.3% | View All 2 Rows |
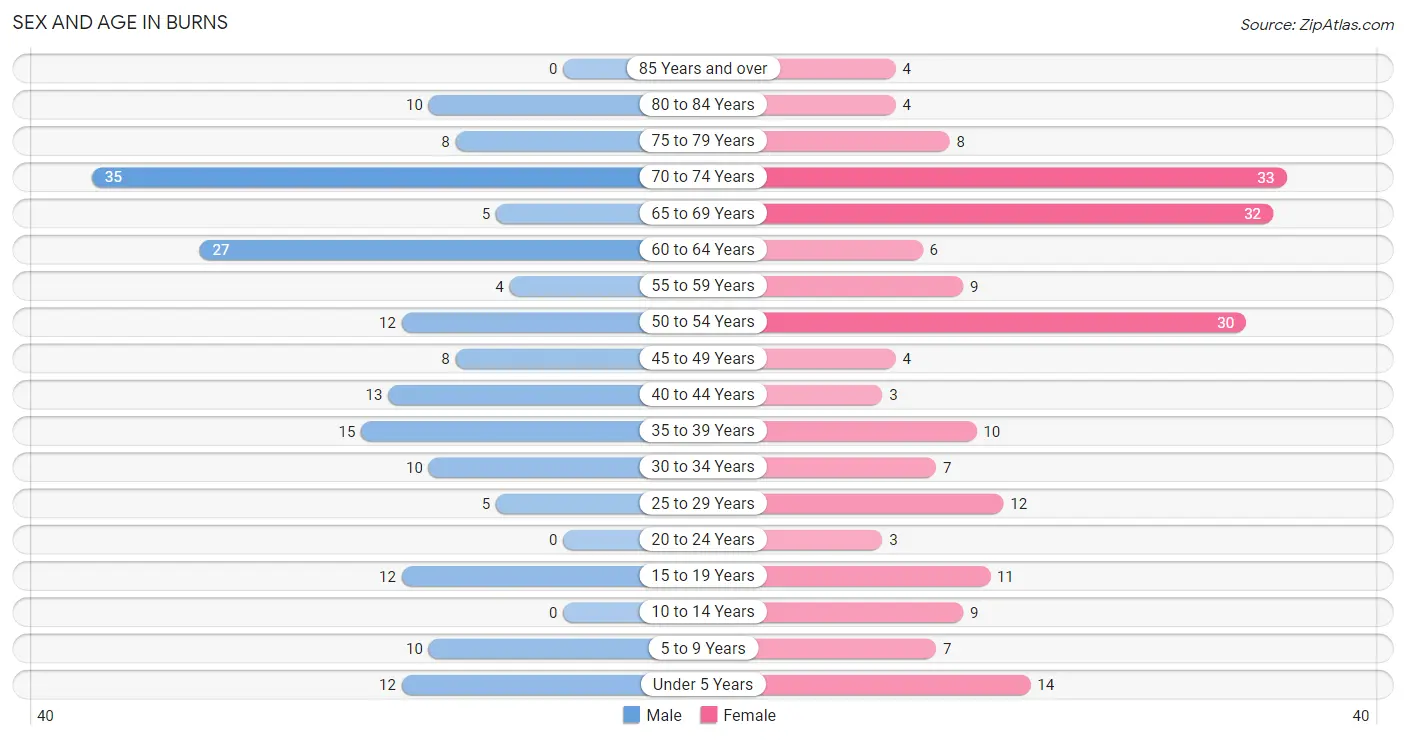
Sex and Age in Burns
Sex and Age in Burns
The most populous age groups in Burns are 70 to 74 Years (35 | 18.8%) for men and 70 to 74 Years (33 | 16.0%) for women.
| Age Bracket | Male | Female |
| Under 5 Years | 12 (6.5%) | 14 (6.8%) |
| 5 to 9 Years | 10 (5.4%) | 7 (3.4%) |
| 10 to 14 Years | 0 (0.0%) | 9 (4.4%) |
| 15 to 19 Years | 12 (6.5%) | 11 (5.3%) |
| 20 to 24 Years | 0 (0.0%) | 3 (1.5%) |
| 25 to 29 Years | 5 (2.7%) | 12 (5.8%) |
| 30 to 34 Years | 10 (5.4%) | 7 (3.4%) |
| 35 to 39 Years | 15 (8.1%) | 10 (4.9%) |
| 40 to 44 Years | 13 (7.0%) | 3 (1.5%) |
| 45 to 49 Years | 8 (4.3%) | 4 (1.9%) |
| 50 to 54 Years | 12 (6.5%) | 30 (14.6%) |
| 55 to 59 Years | 4 (2.1%) | 9 (4.4%) |
| 60 to 64 Years | 27 (14.5%) | 6 (2.9%) |
| 65 to 69 Years | 5 (2.7%) | 32 (15.5%) |
| 70 to 74 Years | 35 (18.8%) | 33 (16.0%) |
| 75 to 79 Years | 8 (4.3%) | 8 (3.9%) |
| 80 to 84 Years | 10 (5.4%) | 4 (1.9%) |
| 85 Years and over | 0 (0.0%) | 4 (1.9%) |
| Total | 186 (100.0%) | 206 (100.0%) |
Families and Households in Burns
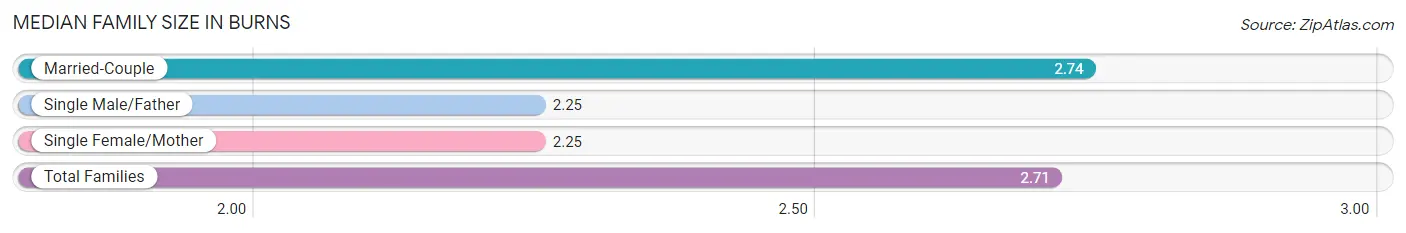
Median Family Size in Burns
The median family size in Burns is 2.71 persons per family, with married-couple families (111 | 93.3%) accounting for the largest median family size of 2.74 persons per family. On the other hand, single male/father families (4 | 3.4%) represent the smallest median family size with 2.25 persons per family.
| Family Type | # Families | Family Size |
| Married-Couple | 111 (93.3%) | 2.74 |
| Single Male/Father | 4 (3.4%) | 2.25 |
| Single Female/Mother | 4 (3.4%) | 2.25 |
| Total Families | 119 (100.0%) | 2.71 |
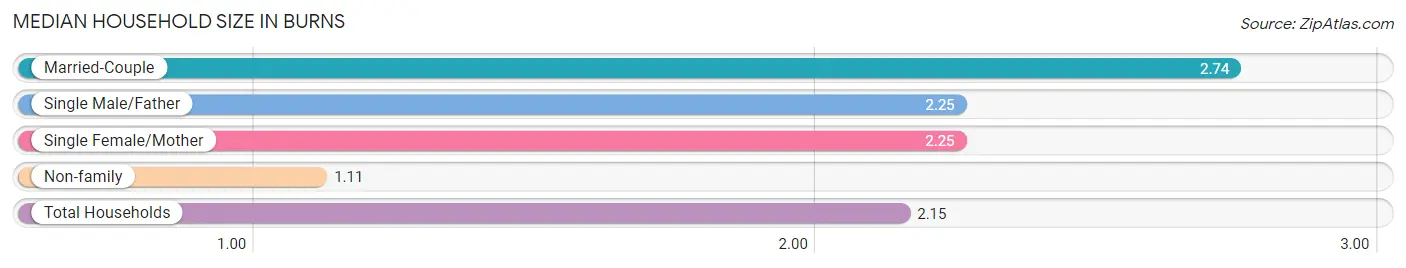
Median Household Size in Burns
The median household size in Burns is 2.15 persons per household, with married-couple households (111 | 61.0%) accounting for the largest median household size of 2.74 persons per household. non-family households (63 | 34.6%) represent the smallest median household size with 1.11 persons per household.
| Household Type | # Households | Household Size |
| Married-Couple | 111 (61.0%) | 2.74 |
| Single Male/Father | 4 (2.2%) | 2.25 |
| Single Female/Mother | 4 (2.2%) | 2.25 |
| Non-family | 63 (34.6%) | 1.11 |
| Total Households | 182 (100.0%) | 2.15 |
Household Size by Marriage Status in Burns
Out of a total of 182 households in Burns, 119 (65.4%) are family households, while 63 (34.6%) are nonfamily households. The most numerous type of family households are 2-person households, comprising 63, and the most common type of nonfamily households are 1-person households, comprising 56.
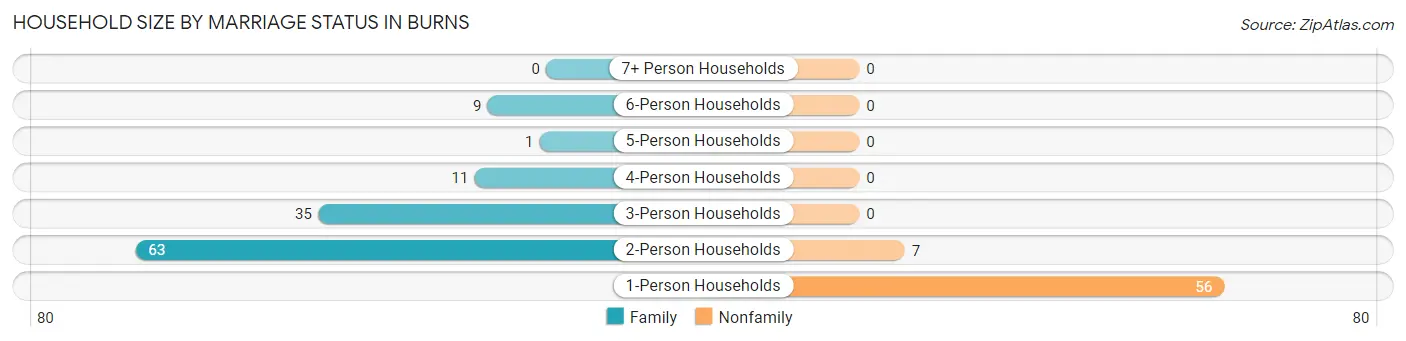
| Household Size | Family Households | Nonfamily Households |
| 1-Person Households | - | 56 (30.8%) |
| 2-Person Households | 63 (34.6%) | 7 (3.8%) |
| 3-Person Households | 35 (19.2%) | 0 (0.0%) |
| 4-Person Households | 11 (6.0%) | 0 (0.0%) |
| 5-Person Households | 1 (0.5%) | 0 (0.0%) |
| 6-Person Households | 9 (5.0%) | 0 (0.0%) |
| 7+ Person Households | 0 (0.0%) | 0 (0.0%) |
| Total | 119 (65.4%) | 63 (34.6%) |
Female Fertility in Burns
Fertility by Age in Burns
Average fertility rate in Burns is 182.0 births per 1,000 women. Women in the age bracket of 35 to 50 years have the highest fertility rate with 273.0 births per 1,000 women. Women in the age bracket of 35 to 50 years acount for 60.0% of all women with births.
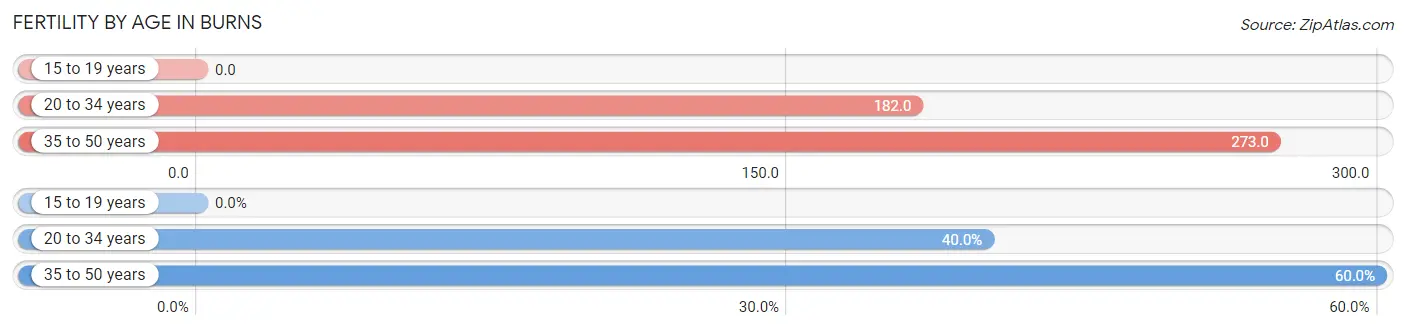
| Age Bracket | Women with Births | Births / 1,000 Women |
| 15 to 19 years | 0 (0.0%) | 0.0 |
| 20 to 34 years | 4 (40.0%) | 182.0 |
| 35 to 50 years | 6 (60.0%) | 273.0 |
| Total | 10 (100.0%) | 182.0 |
Fertility by Age by Marriage Status in Burns
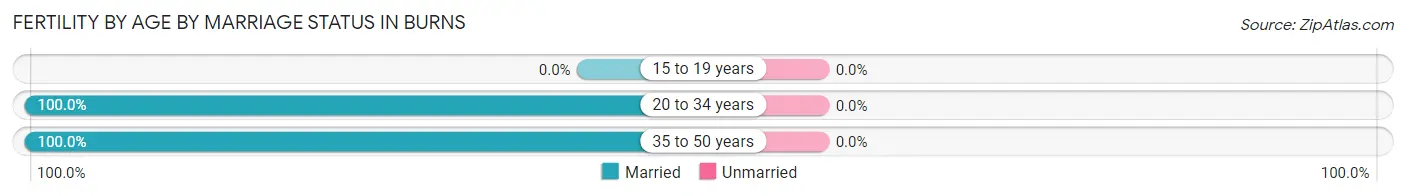
| Age Bracket | Married | Unmarried |
| 15 to 19 years | 0 (0.0%) | 0 (0.0%) |
| 20 to 34 years | 4 (100.0%) | 0 (0.0%) |
| 35 to 50 years | 6 (100.0%) | 0 (0.0%) |
| Total | 10 (100.0%) | 0 (0.0%) |
Fertility by Education in Burns
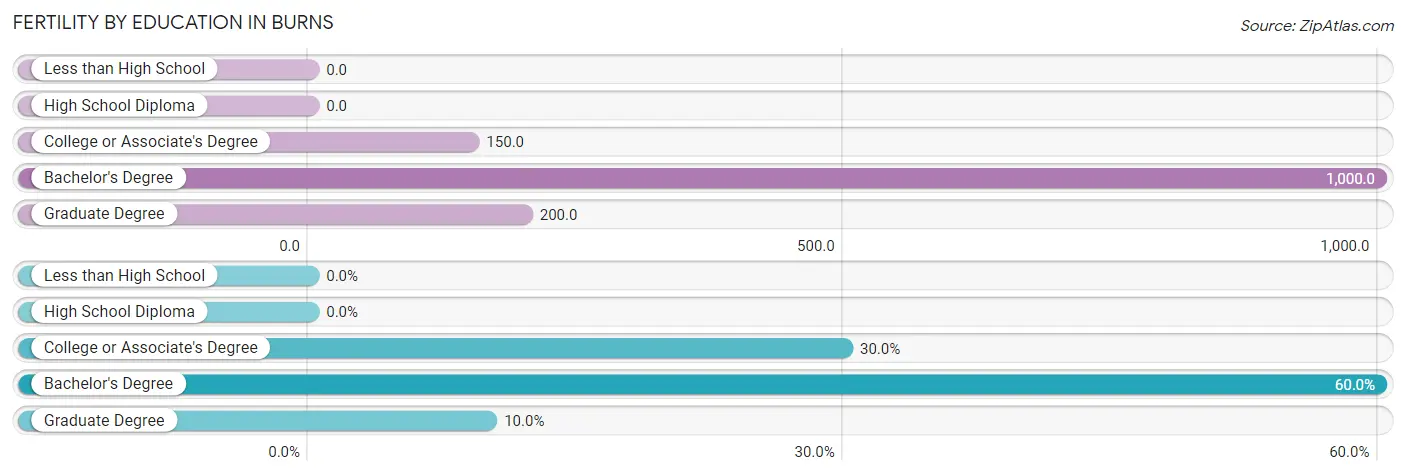
| Educational Attainment | Women with Births | Births / 1,000 Women |
| Less than High School | 0 (0.0%) | 0.0 |
| High School Diploma | 0 (0.0%) | 0.0 |
| College or Associate's Degree | 3 (30.0%) | 150.0 |
| Bachelor's Degree | 6 (60.0%) | 1,000.0 |
| Graduate Degree | 1 (10.0%) | 200.0 |
| Total | 10 (100.0%) | 182.0 |
Fertility by Education by Marriage Status in Burns
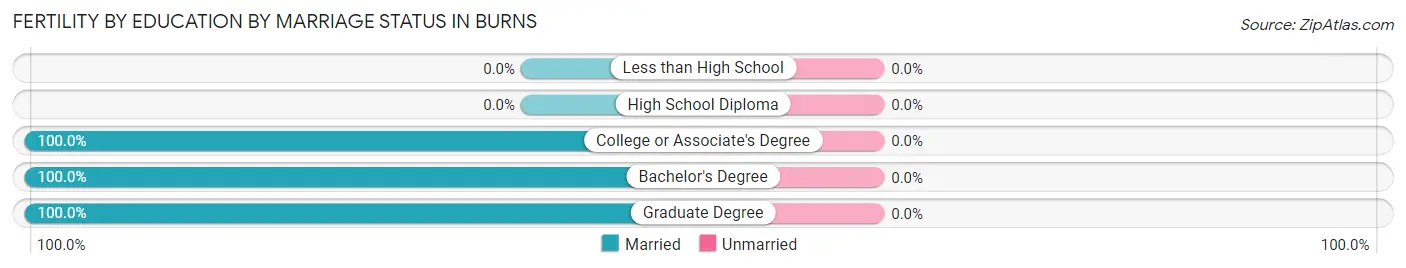
| Educational Attainment | Married | Unmarried |
| Less than High School | 0 (0.0%) | 0 (0.0%) |
| High School Diploma | 0 (0.0%) | 0 (0.0%) |
| College or Associate's Degree | 3 (100.0%) | 0 (0.0%) |
| Bachelor's Degree | 6 (100.0%) | 0 (0.0%) |
| Graduate Degree | 1 (100.0%) | 0 (0.0%) |
| Total | 10 (100.0%) | 0 (0.0%) |
Employment Characteristics in Burns
Employment by Class of Employer in Burns
Among the 179 employed individuals in Burns, private company employees (111 | 62.0%), local government employees (49 | 27.4%), and self-employed (not incorporated) (6 | 3.4%) make up the most common classes of employment.
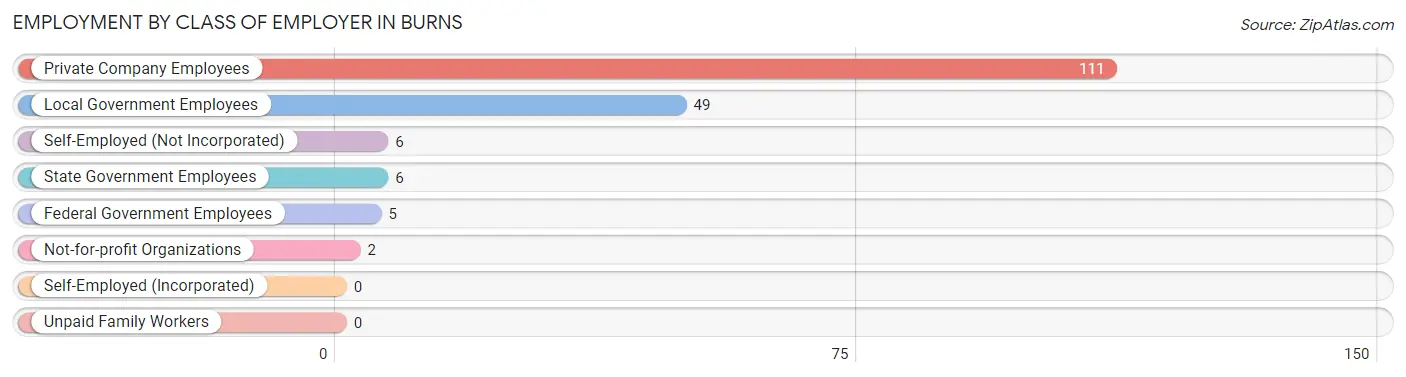
| Employer Class | # Employees | % Employees |
| Private Company Employees | 111 | 62.0% |
| Self-Employed (Incorporated) | 0 | 0.0% |
| Self-Employed (Not Incorporated) | 6 | 3.4% |
| Not-for-profit Organizations | 2 | 1.1% |
| Local Government Employees | 49 | 27.4% |
| State Government Employees | 6 | 3.4% |
| Federal Government Employees | 5 | 2.8% |
| Unpaid Family Workers | 0 | 0.0% |
| Total | 179 | 100.0% |
Employment Status by Age in Burns
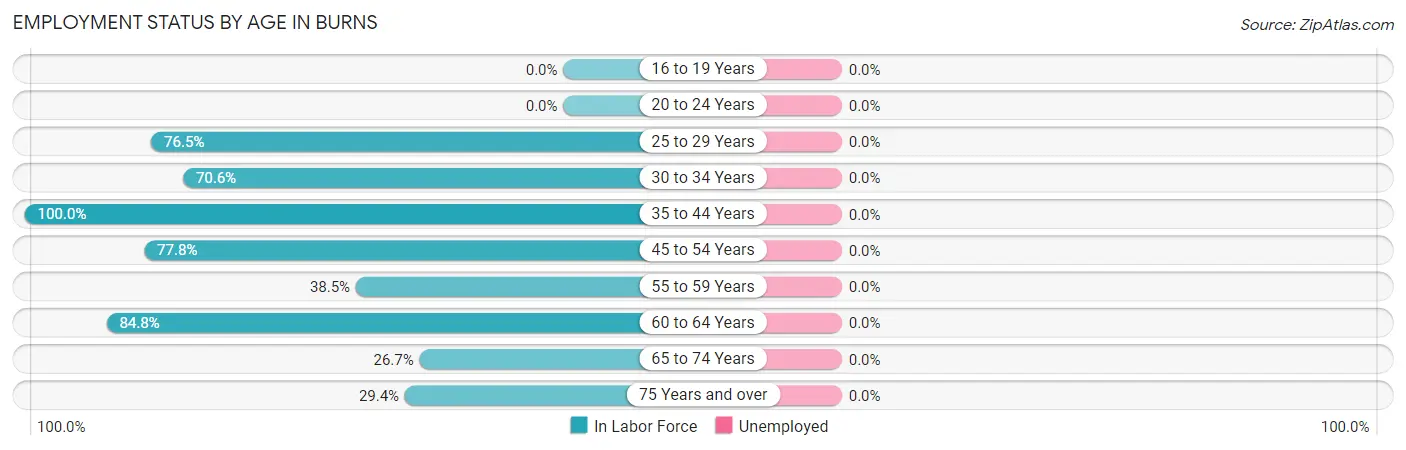
| Age Bracket | In Labor Force | Unemployed |
| 16 to 19 Years | 0 (0.0%) | 0 (0.0%) |
| 20 to 24 Years | 0 (0.0%) | 0 (0.0%) |
| 25 to 29 Years | 13 (76.5%) | 0 (0.0%) |
| 30 to 34 Years | 12 (70.6%) | 0 (0.0%) |
| 35 to 44 Years | 41 (100.0%) | 0 (0.0%) |
| 45 to 54 Years | 42 (77.8%) | 0 (0.0%) |
| 55 to 59 Years | 5 (38.5%) | 0 (0.0%) |
| 60 to 64 Years | 28 (84.8%) | 0 (0.0%) |
| 65 to 74 Years | 28 (26.7%) | 0 (0.0%) |
| 75 Years and over | 10 (29.4%) | 0 (0.0%) |
| Total | 179 (53.8%) | 0 (0.0%) |
Employment Status by Educational Attainment in Burns
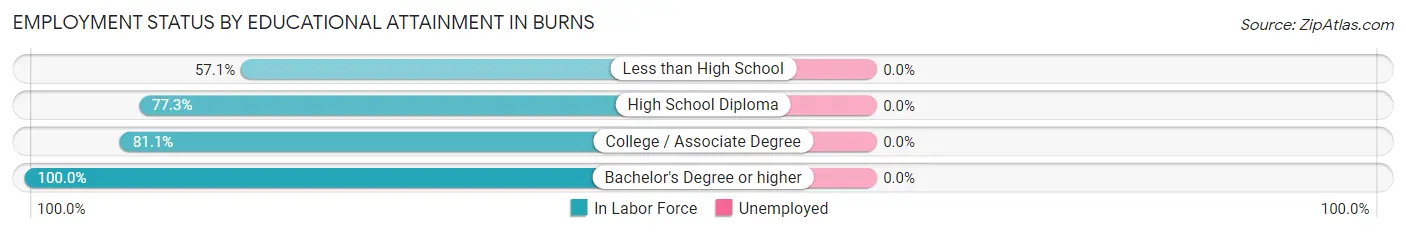
| Educational Attainment | In Labor Force | Unemployed |
| Less than High School | 12 (57.1%) | 0 (0.0%) |
| High School Diploma | 17 (77.3%) | 0 (0.0%) |
| College / Associate Degree | 86 (81.1%) | 0 (0.0%) |
| Bachelor's Degree or higher | 26 (100.0%) | 0 (0.0%) |
| Total | 141 (80.6%) | 0 (0.0%) |
Employment Occupations by Sex in Burns
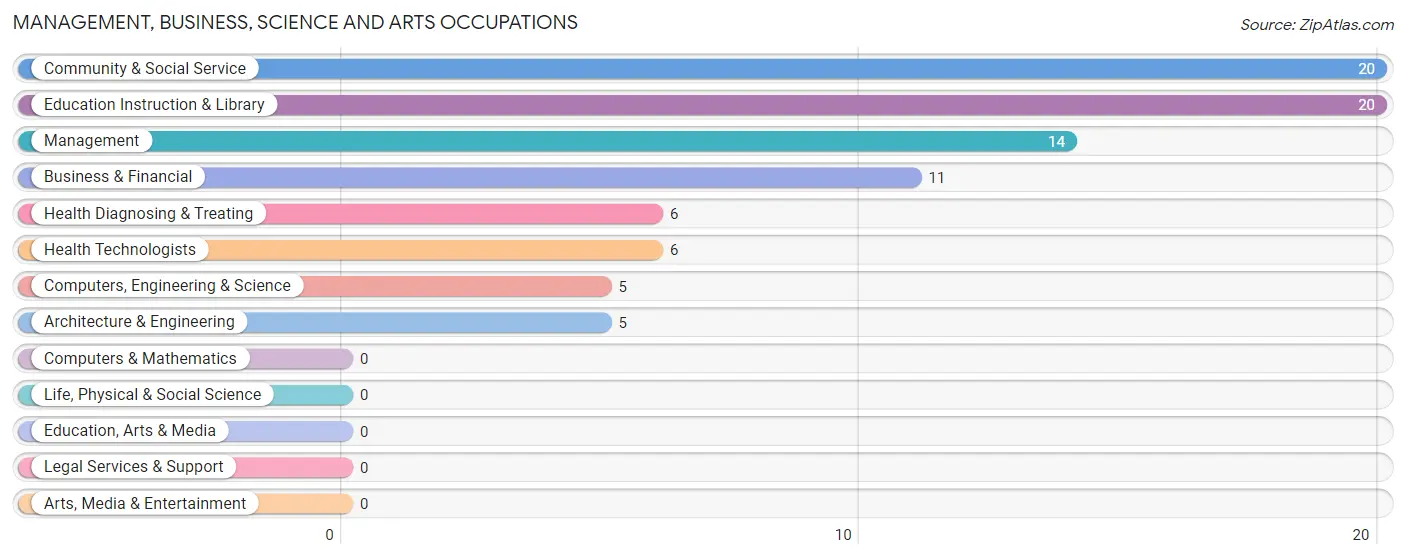
Management, Business, Science and Arts Occupations
The most common Management, Business, Science and Arts occupations in Burns are Community & Social Service (20 | 11.5%), Education Instruction & Library (20 | 11.5%), Management (14 | 8.1%), Business & Financial (11 | 6.3%), and Health Diagnosing & Treating (6 | 3.5%).
Management, Business, Science and Arts Occupations by Sex
Within the Management, Business, Science and Arts occupations in Burns, the most male-oriented occupations are Computers, Engineering & Science (100.0%), Architecture & Engineering (100.0%), and Community & Social Service (70.0%), while the most female-oriented occupations are Health Diagnosing & Treating (100.0%), Health Technologists (100.0%), and Business & Financial (45.5%).
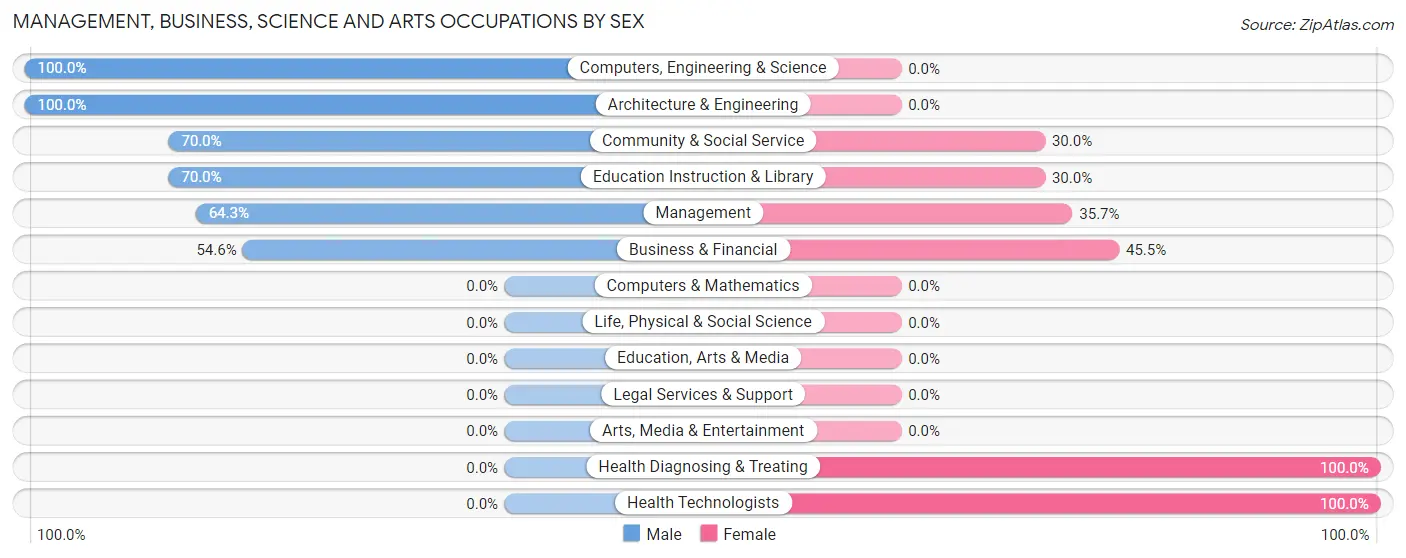
| Occupation | Male | Female |
| Management | 9 (64.3%) | 5 (35.7%) |
| Business & Financial | 6 (54.5%) | 5 (45.5%) |
| Computers, Engineering & Science | 5 (100.0%) | 0 (0.0%) |
| Computers & Mathematics | 0 (0.0%) | 0 (0.0%) |
| Architecture & Engineering | 5 (100.0%) | 0 (0.0%) |
| Life, Physical & Social Science | 0 (0.0%) | 0 (0.0%) |
| Community & Social Service | 14 (70.0%) | 6 (30.0%) |
| Education, Arts & Media | 0 (0.0%) | 0 (0.0%) |
| Legal Services & Support | 0 (0.0%) | 0 (0.0%) |
| Education Instruction & Library | 14 (70.0%) | 6 (30.0%) |
| Arts, Media & Entertainment | 0 (0.0%) | 0 (0.0%) |
| Health Diagnosing & Treating | 0 (0.0%) | 6 (100.0%) |
| Health Technologists | 0 (0.0%) | 6 (100.0%) |
| Total (Category) | 34 (60.7%) | 22 (39.3%) |
| Total (Overall) | 108 (62.1%) | 66 (37.9%) |
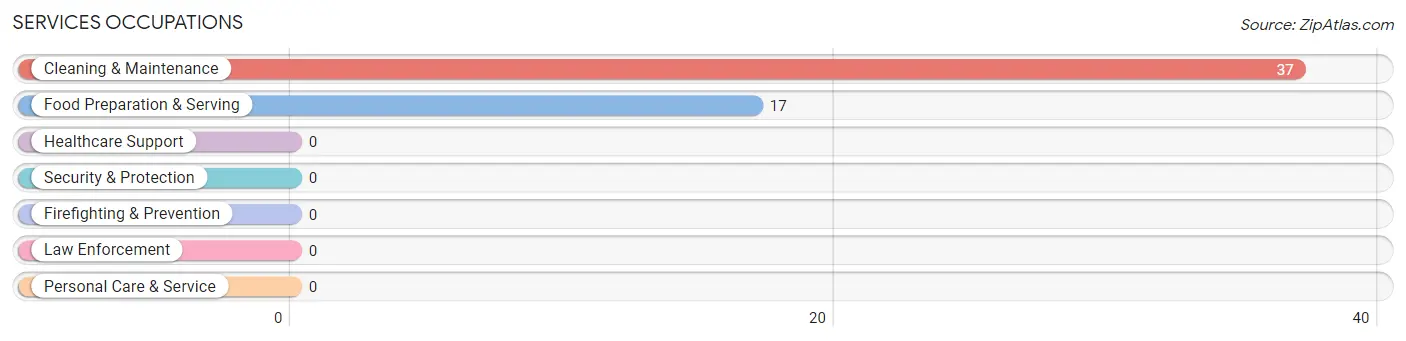
Services Occupations
The most common Services occupations in Burns are Cleaning & Maintenance (37 | 21.3%), and Food Preparation & Serving (17 | 9.8%).
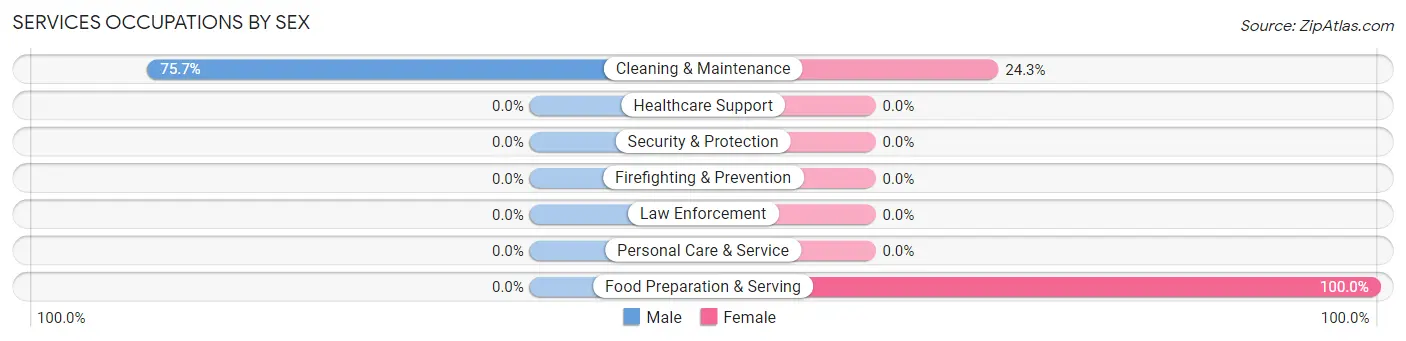
Services Occupations by Sex
| Occupation | Male | Female |
| Healthcare Support | 0 (0.0%) | 0 (0.0%) |
| Security & Protection | 0 (0.0%) | 0 (0.0%) |
| Firefighting & Prevention | 0 (0.0%) | 0 (0.0%) |
| Law Enforcement | 0 (0.0%) | 0 (0.0%) |
| Food Preparation & Serving | 0 (0.0%) | 17 (100.0%) |
| Cleaning & Maintenance | 28 (75.7%) | 9 (24.3%) |
| Personal Care & Service | 0 (0.0%) | 0 (0.0%) |
| Total (Category) | 28 (51.8%) | 26 (48.1%) |
| Total (Overall) | 108 (62.1%) | 66 (37.9%) |
Sales and Office Occupations
The most common Sales and Office occupations in Burns are , and Sales & Related (15 | 8.6%).
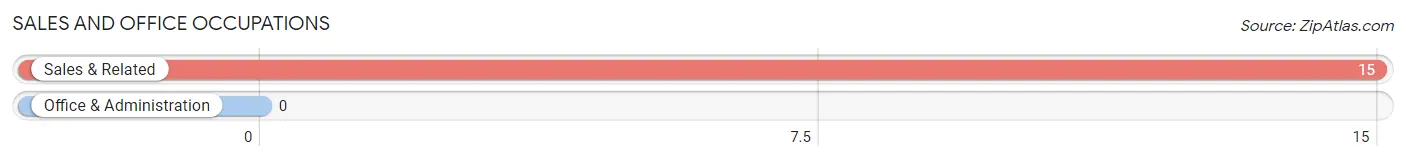
Sales and Office Occupations by Sex
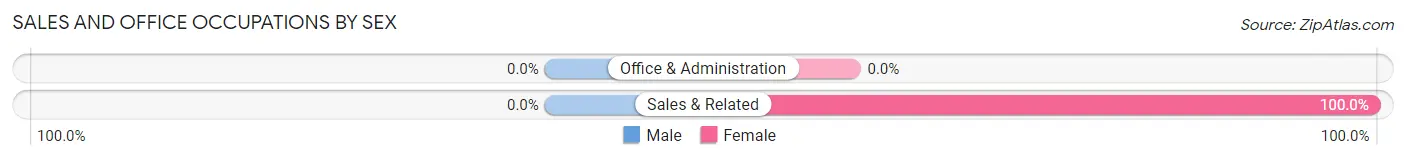
| Occupation | Male | Female |
| Sales & Related | 0 (0.0%) | 15 (100.0%) |
| Office & Administration | 0 (0.0%) | 0 (0.0%) |
| Total (Category) | 0 (0.0%) | 15 (100.0%) |
| Total (Overall) | 108 (62.1%) | 66 (37.9%) |
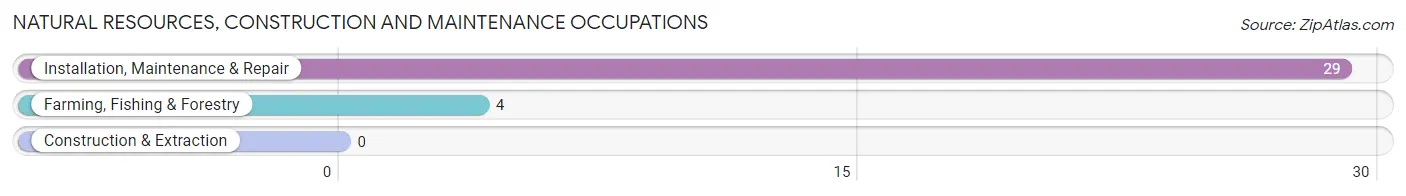
Natural Resources, Construction and Maintenance Occupations
The most common Natural Resources, Construction and Maintenance occupations in Burns are Installation, Maintenance & Repair (29 | 16.7%), and Farming, Fishing & Forestry (4 | 2.3%).
Natural Resources, Construction and Maintenance Occupations by Sex
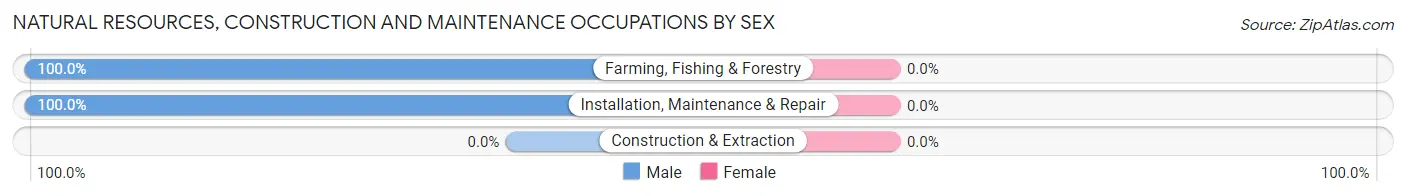
| Occupation | Male | Female |
| Farming, Fishing & Forestry | 4 (100.0%) | 0 (0.0%) |
| Construction & Extraction | 0 (0.0%) | 0 (0.0%) |
| Installation, Maintenance & Repair | 29 (100.0%) | 0 (0.0%) |
| Total (Category) | 33 (100.0%) | 0 (0.0%) |
| Total (Overall) | 108 (62.1%) | 66 (37.9%) |
Production, Transportation and Moving Occupations
The most common Production, Transportation and Moving occupations in Burns are Transportation (13 | 7.5%), and Material Moving (3 | 1.7%).
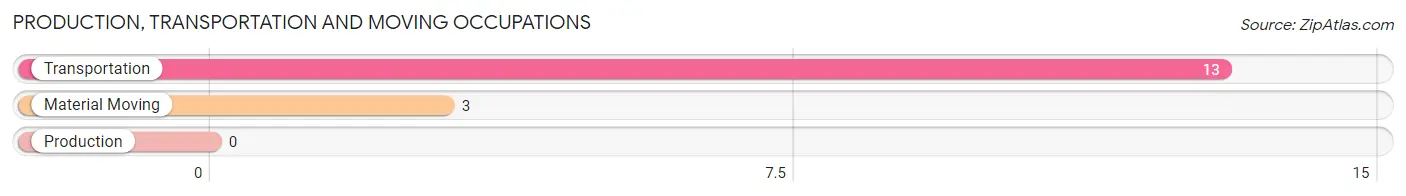
Production, Transportation and Moving Occupations by Sex
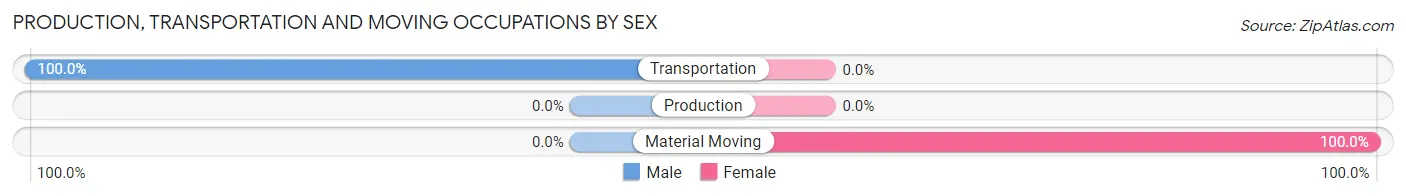
| Occupation | Male | Female |
| Production | 0 (0.0%) | 0 (0.0%) |
| Transportation | 13 (100.0%) | 0 (0.0%) |
| Material Moving | 0 (0.0%) | 3 (100.0%) |
| Total (Category) | 13 (81.2%) | 3 (18.8%) |
| Total (Overall) | 108 (62.1%) | 66 (37.9%) |
Employment Industries by Sex in Burns
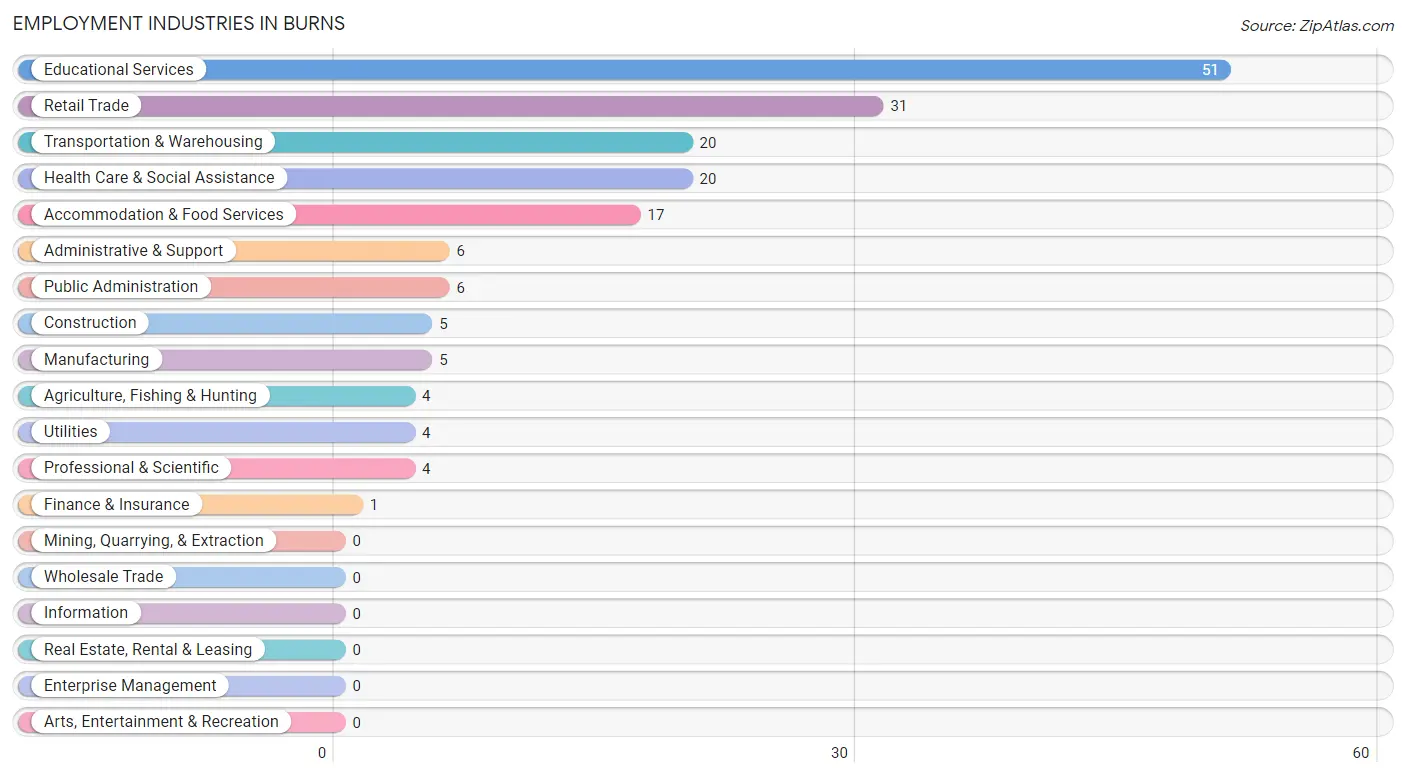
Employment Industries in Burns
The major employment industries in Burns include Educational Services (51 | 29.3%), Retail Trade (31 | 17.8%), Transportation & Warehousing (20 | 11.5%), Health Care & Social Assistance (20 | 11.5%), and Accommodation & Food Services (17 | 9.8%).
Employment Industries by Sex in Burns
The Burns industries that see more men than women are Agriculture, Fishing & Hunting (100.0%), Manufacturing (100.0%), and Utilities (100.0%), whereas the industries that tend to have a higher number of women are Construction (100.0%), Finance & Insurance (100.0%), and Professional & Scientific (100.0%).
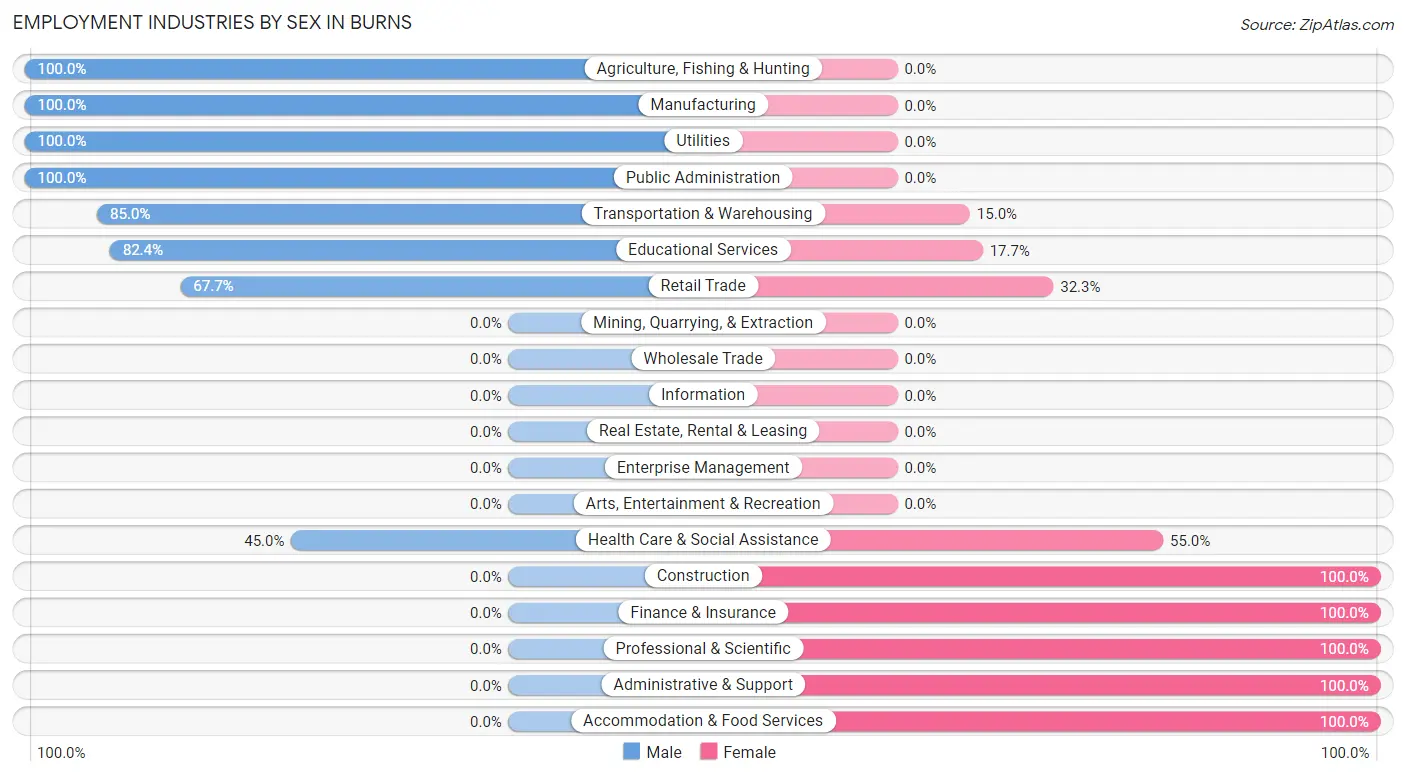
| Industry | Male | Female |
| Agriculture, Fishing & Hunting | 4 (100.0%) | 0 (0.0%) |
| Mining, Quarrying, & Extraction | 0 (0.0%) | 0 (0.0%) |
| Construction | 0 (0.0%) | 5 (100.0%) |
| Manufacturing | 5 (100.0%) | 0 (0.0%) |
| Wholesale Trade | 0 (0.0%) | 0 (0.0%) |
| Retail Trade | 21 (67.7%) | 10 (32.3%) |
| Transportation & Warehousing | 17 (85.0%) | 3 (15.0%) |
| Utilities | 4 (100.0%) | 0 (0.0%) |
| Information | 0 (0.0%) | 0 (0.0%) |
| Finance & Insurance | 0 (0.0%) | 1 (100.0%) |
| Real Estate, Rental & Leasing | 0 (0.0%) | 0 (0.0%) |
| Professional & Scientific | 0 (0.0%) | 4 (100.0%) |
| Enterprise Management | 0 (0.0%) | 0 (0.0%) |
| Administrative & Support | 0 (0.0%) | 6 (100.0%) |
| Educational Services | 42 (82.4%) | 9 (17.6%) |
| Health Care & Social Assistance | 9 (45.0%) | 11 (55.0%) |
| Arts, Entertainment & Recreation | 0 (0.0%) | 0 (0.0%) |
| Accommodation & Food Services | 0 (0.0%) | 17 (100.0%) |
| Public Administration | 6 (100.0%) | 0 (0.0%) |
| Total | 108 (62.1%) | 66 (37.9%) |
Education in Burns
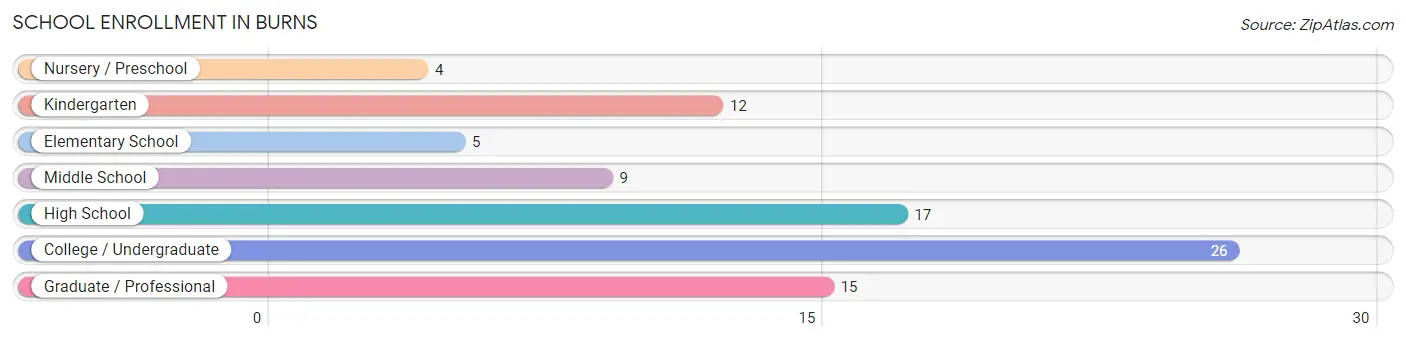
School Enrollment in Burns
The most common levels of schooling among the 88 students in Burns are college / undergraduate (26 | 29.5%), high school (17 | 19.3%), and graduate / professional (15 | 17.1%).
| School Level | # Students | % Students |
| Nursery / Preschool | 4 | 4.5% |
| Kindergarten | 12 | 13.6% |
| Elementary School | 5 | 5.7% |
| Middle School | 9 | 10.2% |
| High School | 17 | 19.3% |
| College / Undergraduate | 26 | 29.5% |
| Graduate / Professional | 15 | 17.1% |
| Total | 88 | 100.0% |
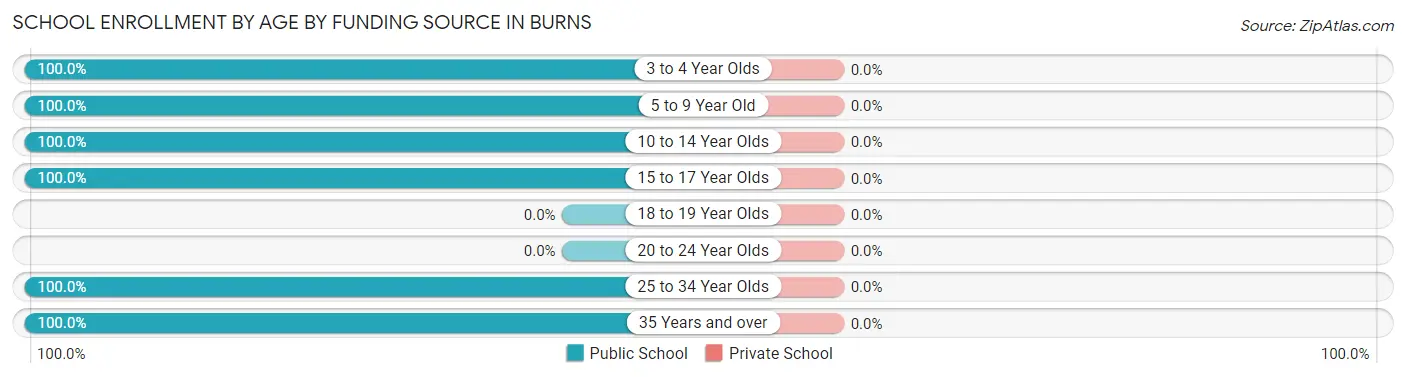
School Enrollment by Age by Funding Source in Burns
| Age Bracket | Public School | Private School |
| 3 to 4 Year Olds | 4 (100.0%) | 0 (0.0%) |
| 5 to 9 Year Old | 17 (100.0%) | 0 (0.0%) |
| 10 to 14 Year Olds | 9 (100.0%) | 0 (0.0%) |
| 15 to 17 Year Olds | 17 (100.0%) | 0 (0.0%) |
| 18 to 19 Year Olds | 0 (0.0%) | 0 (0.0%) |
| 20 to 24 Year Olds | 0 (0.0%) | 0 (0.0%) |
| 25 to 34 Year Olds | 10 (100.0%) | 0 (0.0%) |
| 35 Years and over | 31 (100.0%) | 0 (0.0%) |
| Total | 88 (100.0%) | 0 (0.0%) |
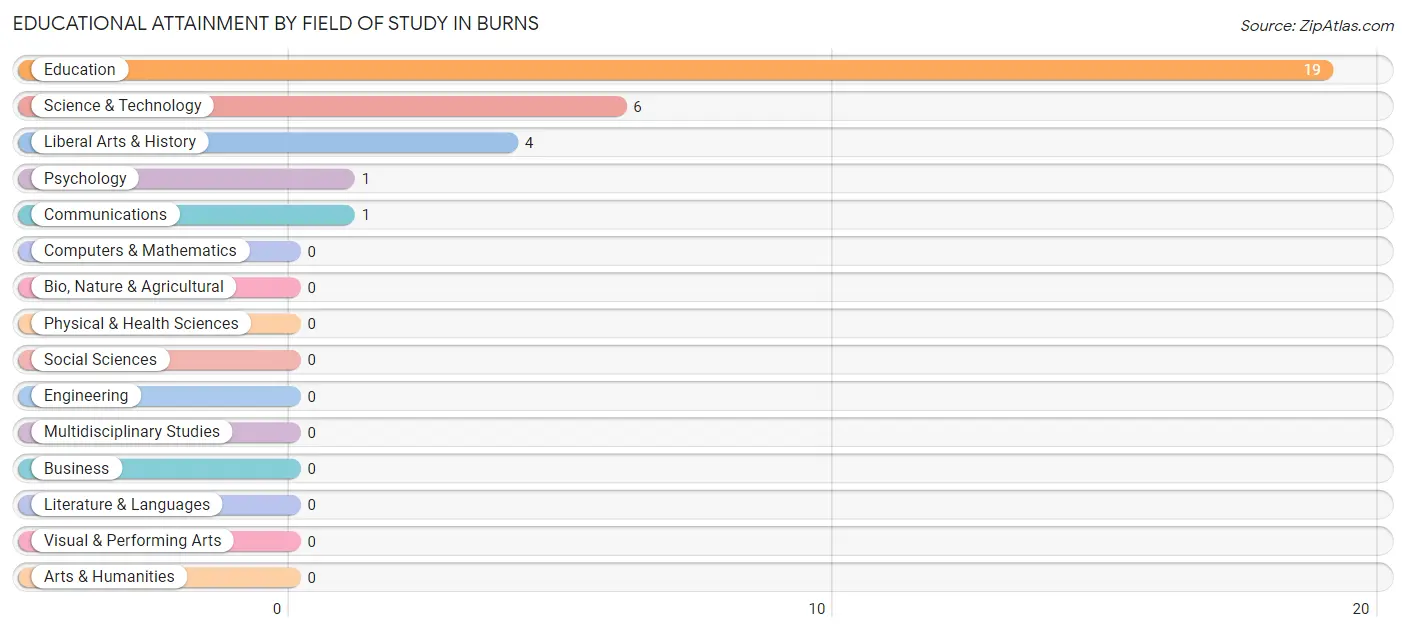
Educational Attainment by Field of Study in Burns
Education (19 | 61.3%), science & technology (6 | 19.4%), liberal arts & history (4 | 12.9%), psychology (1 | 3.2%), and communications (1 | 3.2%) are the most common fields of study among 31 individuals in Burns who have obtained a bachelor's degree or higher.
| Field of Study | # Graduates | % Graduates |
| Computers & Mathematics | 0 | 0.0% |
| Bio, Nature & Agricultural | 0 | 0.0% |
| Physical & Health Sciences | 0 | 0.0% |
| Psychology | 1 | 3.2% |
| Social Sciences | 0 | 0.0% |
| Engineering | 0 | 0.0% |
| Multidisciplinary Studies | 0 | 0.0% |
| Science & Technology | 6 | 19.4% |
| Business | 0 | 0.0% |
| Education | 19 | 61.3% |
| Literature & Languages | 0 | 0.0% |
| Liberal Arts & History | 4 | 12.9% |
| Visual & Performing Arts | 0 | 0.0% |
| Communications | 1 | 3.2% |
| Arts & Humanities | 0 | 0.0% |
| Total | 31 | 100.0% |
Transportation & Commute in Burns
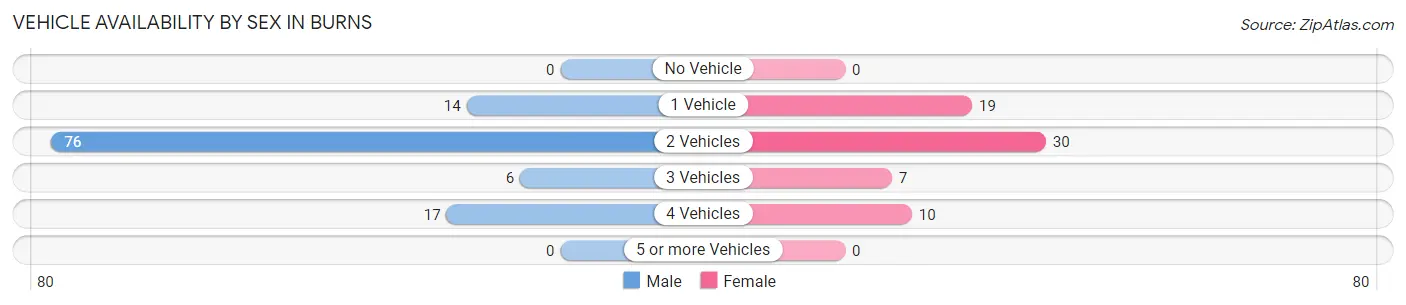
Vehicle Availability by Sex in Burns
The most prevalent vehicle ownership categories in Burns are males with 2 vehicles (76, accounting for 67.3%) and females with 2 vehicles (30, making up 115.1%).
| Vehicles Available | Male | Female |
| No Vehicle | 0 (0.0%) | 0 (0.0%) |
| 1 Vehicle | 14 (12.4%) | 19 (28.8%) |
| 2 Vehicles | 76 (67.3%) | 30 (45.5%) |
| 3 Vehicles | 6 (5.3%) | 7 (10.6%) |
| 4 Vehicles | 17 (15.0%) | 10 (15.1%) |
| 5 or more Vehicles | 0 (0.0%) | 0 (0.0%) |
| Total | 113 (100.0%) | 66 (100.0%) |
Commute Time in Burns
The most frequently occuring commute durations in Burns are less than 5 minutes (66 commuters, 36.9%), 5 to 9 minutes (33 commuters, 18.4%), and 30 to 34 minutes (19 commuters, 10.6%).
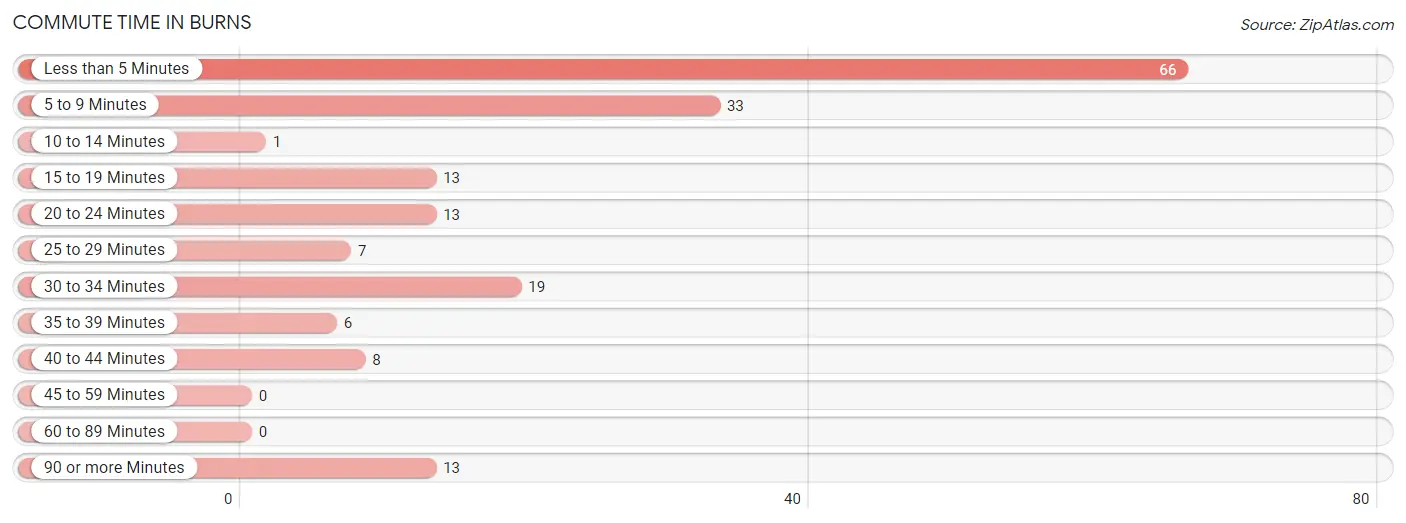
| Commute Time | # Commuters | % Commuters |
| Less than 5 Minutes | 66 | 36.9% |
| 5 to 9 Minutes | 33 | 18.4% |
| 10 to 14 Minutes | 1 | 0.6% |
| 15 to 19 Minutes | 13 | 7.3% |
| 20 to 24 Minutes | 13 | 7.3% |
| 25 to 29 Minutes | 7 | 3.9% |
| 30 to 34 Minutes | 19 | 10.6% |
| 35 to 39 Minutes | 6 | 3.4% |
| 40 to 44 Minutes | 8 | 4.5% |
| 45 to 59 Minutes | 0 | 0.0% |
| 60 to 89 Minutes | 0 | 0.0% |
| 90 or more Minutes | 13 | 7.3% |
Commute Time by Sex in Burns
The most common commute times in Burns are less than 5 minutes (53 commuters, 46.9%) for males and 5 to 9 minutes (24 commuters, 36.4%) for females.
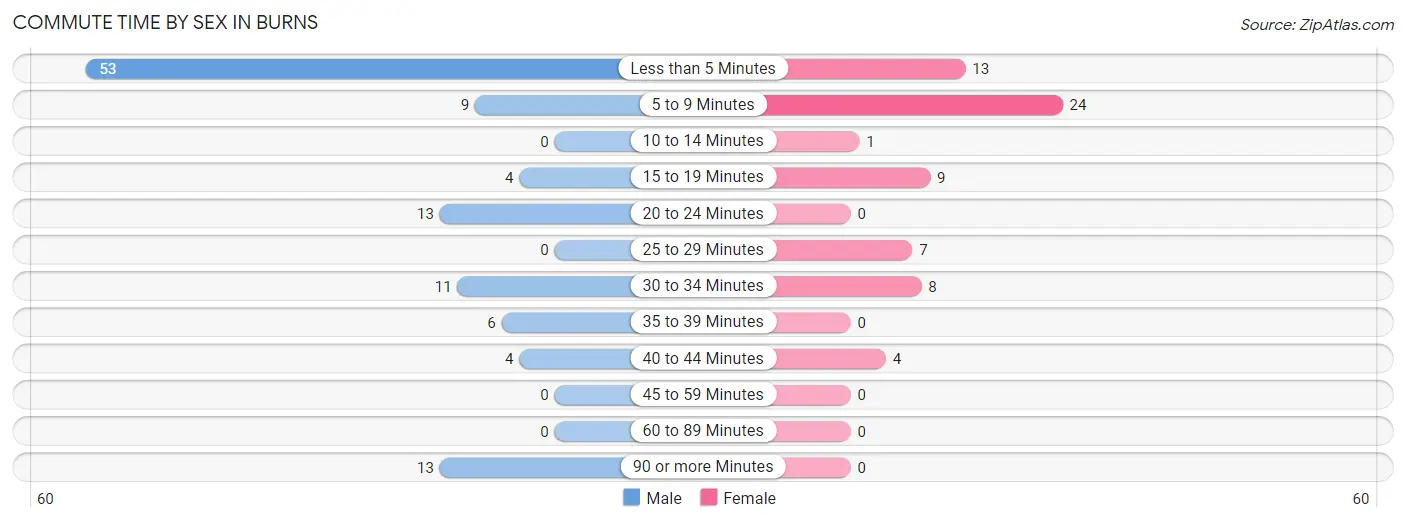
| Commute Time | Male | Female |
| Less than 5 Minutes | 53 (46.9%) | 13 (19.7%) |
| 5 to 9 Minutes | 9 (8.0%) | 24 (36.4%) |
| 10 to 14 Minutes | 0 (0.0%) | 1 (1.5%) |
| 15 to 19 Minutes | 4 (3.5%) | 9 (13.6%) |
| 20 to 24 Minutes | 13 (11.5%) | 0 (0.0%) |
| 25 to 29 Minutes | 0 (0.0%) | 7 (10.6%) |
| 30 to 34 Minutes | 11 (9.7%) | 8 (12.1%) |
| 35 to 39 Minutes | 6 (5.3%) | 0 (0.0%) |
| 40 to 44 Minutes | 4 (3.5%) | 4 (6.1%) |
| 45 to 59 Minutes | 0 (0.0%) | 0 (0.0%) |
| 60 to 89 Minutes | 0 (0.0%) | 0 (0.0%) |
| 90 or more Minutes | 13 (11.5%) | 0 (0.0%) |
Time of Departure to Work by Sex in Burns
The most frequent times of departure to work in Burns are 6:00 AM to 6:29 AM (41, 36.3%) for males and 5:00 AM to 5:29 AM (17, 25.8%) for females.
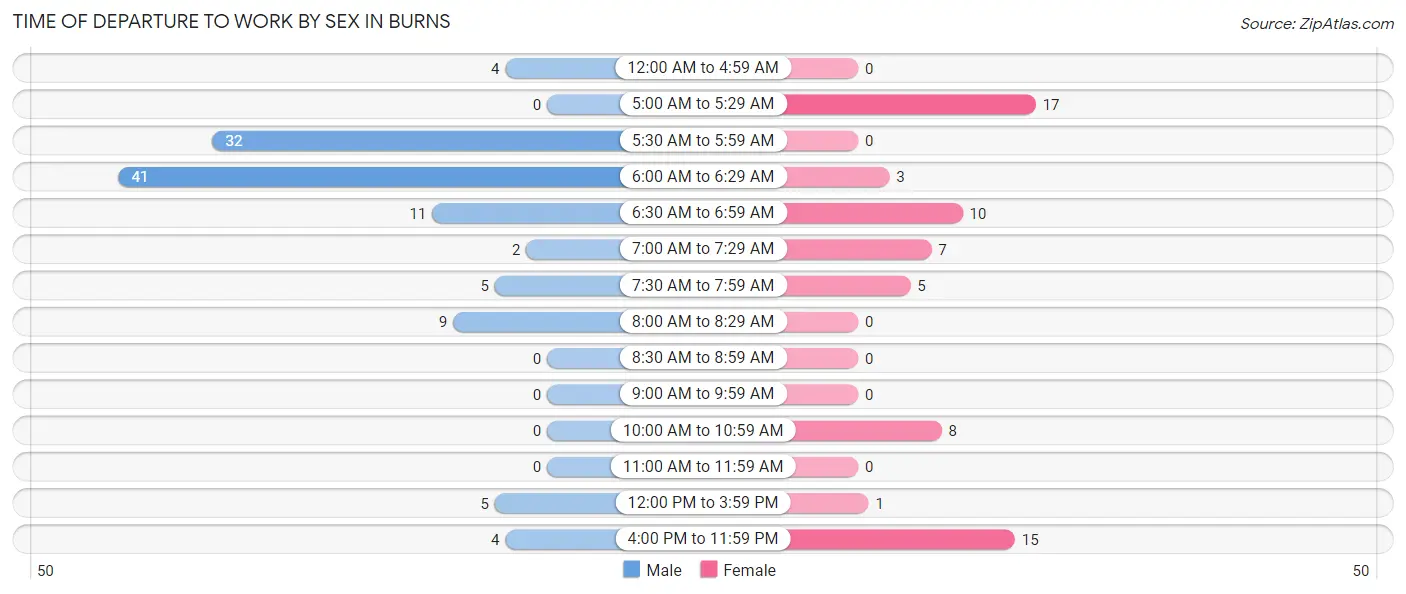
| Time of Departure | Male | Female |
| 12:00 AM to 4:59 AM | 4 (3.5%) | 0 (0.0%) |
| 5:00 AM to 5:29 AM | 0 (0.0%) | 17 (25.8%) |
| 5:30 AM to 5:59 AM | 32 (28.3%) | 0 (0.0%) |
| 6:00 AM to 6:29 AM | 41 (36.3%) | 3 (4.5%) |
| 6:30 AM to 6:59 AM | 11 (9.7%) | 10 (15.1%) |
| 7:00 AM to 7:29 AM | 2 (1.8%) | 7 (10.6%) |
| 7:30 AM to 7:59 AM | 5 (4.4%) | 5 (7.6%) |
| 8:00 AM to 8:29 AM | 9 (8.0%) | 0 (0.0%) |
| 8:30 AM to 8:59 AM | 0 (0.0%) | 0 (0.0%) |
| 9:00 AM to 9:59 AM | 0 (0.0%) | 0 (0.0%) |
| 10:00 AM to 10:59 AM | 0 (0.0%) | 8 (12.1%) |
| 11:00 AM to 11:59 AM | 0 (0.0%) | 0 (0.0%) |
| 12:00 PM to 3:59 PM | 5 (4.4%) | 1 (1.5%) |
| 4:00 PM to 11:59 PM | 4 (3.5%) | 15 (22.7%) |
| Total | 113 (100.0%) | 66 (100.0%) |
Housing Occupancy in Burns
Occupancy by Ownership in Burns
Of the total 182 dwellings in Burns, owner-occupied units account for 153 (84.1%), while renter-occupied units make up 29 (15.9%).
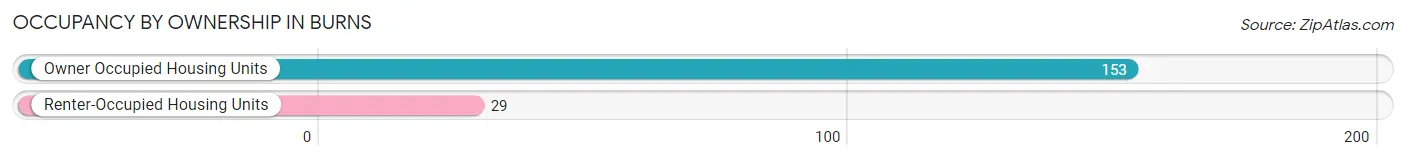
| Occupancy | # Housing Units | % Housing Units |
| Owner Occupied Housing Units | 153 | 84.1% |
| Renter-Occupied Housing Units | 29 | 15.9% |
| Total Occupied Housing Units | 182 | 100.0% |
Occupancy by Household Size in Burns
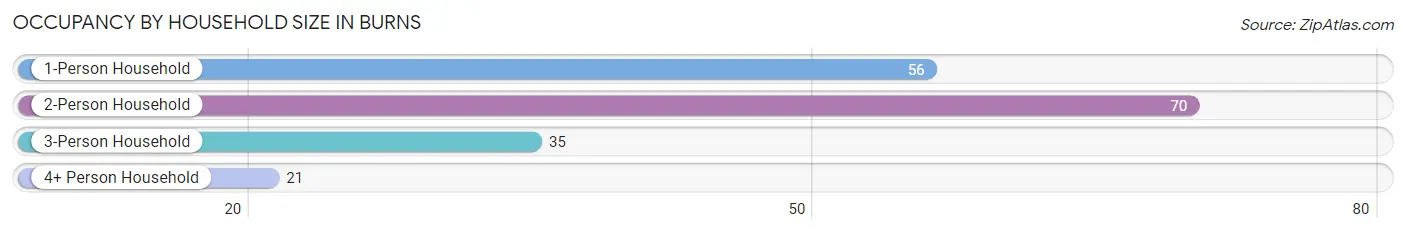
| Household Size | # Housing Units | % Housing Units |
| 1-Person Household | 56 | 30.8% |
| 2-Person Household | 70 | 38.5% |
| 3-Person Household | 35 | 19.2% |
| 4+ Person Household | 21 | 11.5% |
| Total Housing Units | 182 | 100.0% |
Occupancy by Ownership by Household Size in Burns
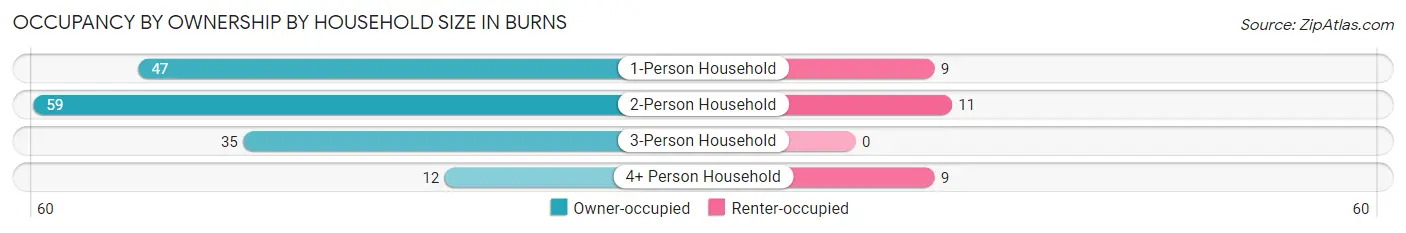
| Household Size | Owner-occupied | Renter-occupied |
| 1-Person Household | 47 (83.9%) | 9 (16.1%) |
| 2-Person Household | 59 (84.3%) | 11 (15.7%) |
| 3-Person Household | 35 (100.0%) | 0 (0.0%) |
| 4+ Person Household | 12 (57.1%) | 9 (42.9%) |
| Total Housing Units | 153 (84.1%) | 29 (15.9%) |
Occupancy by Educational Attainment in Burns
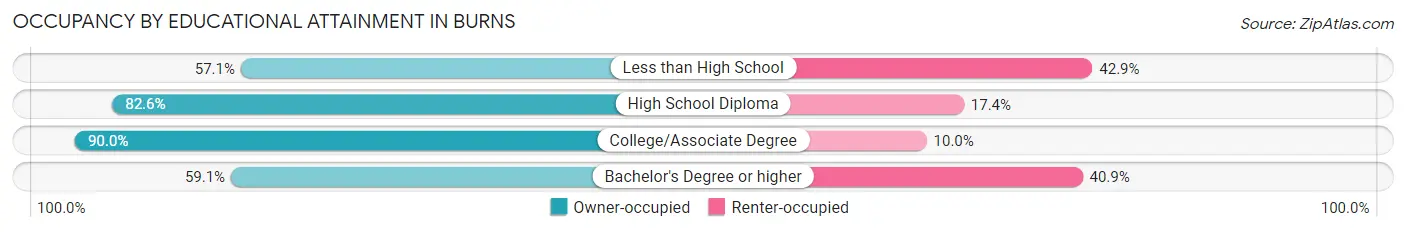
| Household Size | Owner-occupied | Renter-occupied |
| Less than High School | 4 (57.1%) | 3 (42.9%) |
| High School Diploma | 19 (82.6%) | 4 (17.4%) |
| College/Associate Degree | 117 (90.0%) | 13 (10.0%) |
| Bachelor's Degree or higher | 13 (59.1%) | 9 (40.9%) |
Occupancy by Age of Householder in Burns
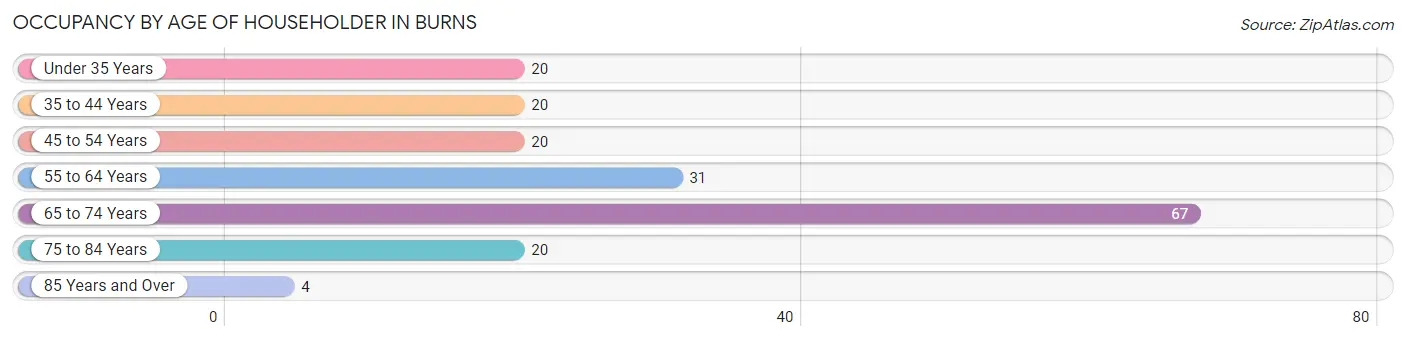
| Age Bracket | # Households | % Households |
| Under 35 Years | 20 | 11.0% |
| 35 to 44 Years | 20 | 11.0% |
| 45 to 54 Years | 20 | 11.0% |
| 55 to 64 Years | 31 | 17.0% |
| 65 to 74 Years | 67 | 36.8% |
| 75 to 84 Years | 20 | 11.0% |
| 85 Years and Over | 4 | 2.2% |
| Total | 182 | 100.0% |
Housing Finances in Burns
Median Income by Occupancy in Burns

| Occupancy Type | # Households | Median Income |
| Owner-Occupied | 153 (84.1%) | $47,420 |
| Renter-Occupied | 29 (15.9%) | $43,281 |
| Average | 182 (100.0%) | $47,128 |
Occupancy by Householder Income Bracket in Burns
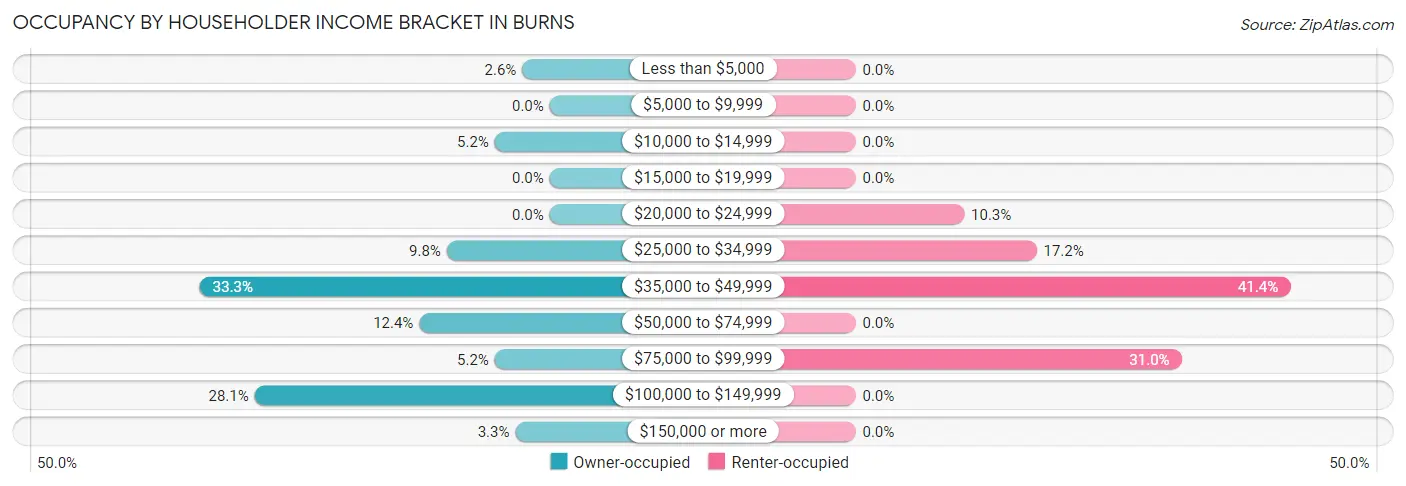
| Income Bracket | Owner-occupied | Renter-occupied |
| Less than $5,000 | 4 (2.6%) | 0 (0.0%) |
| $5,000 to $9,999 | 0 (0.0%) | 0 (0.0%) |
| $10,000 to $14,999 | 8 (5.2%) | 0 (0.0%) |
| $15,000 to $19,999 | 0 (0.0%) | 0 (0.0%) |
| $20,000 to $24,999 | 0 (0.0%) | 3 (10.3%) |
| $25,000 to $34,999 | 15 (9.8%) | 5 (17.2%) |
| $35,000 to $49,999 | 51 (33.3%) | 12 (41.4%) |
| $50,000 to $74,999 | 19 (12.4%) | 0 (0.0%) |
| $75,000 to $99,999 | 8 (5.2%) | 9 (31.0%) |
| $100,000 to $149,999 | 43 (28.1%) | 0 (0.0%) |
| $150,000 or more | 5 (3.3%) | 0 (0.0%) |
| Total | 153 (100.0%) | 29 (100.0%) |
Monthly Housing Cost Tiers in Burns
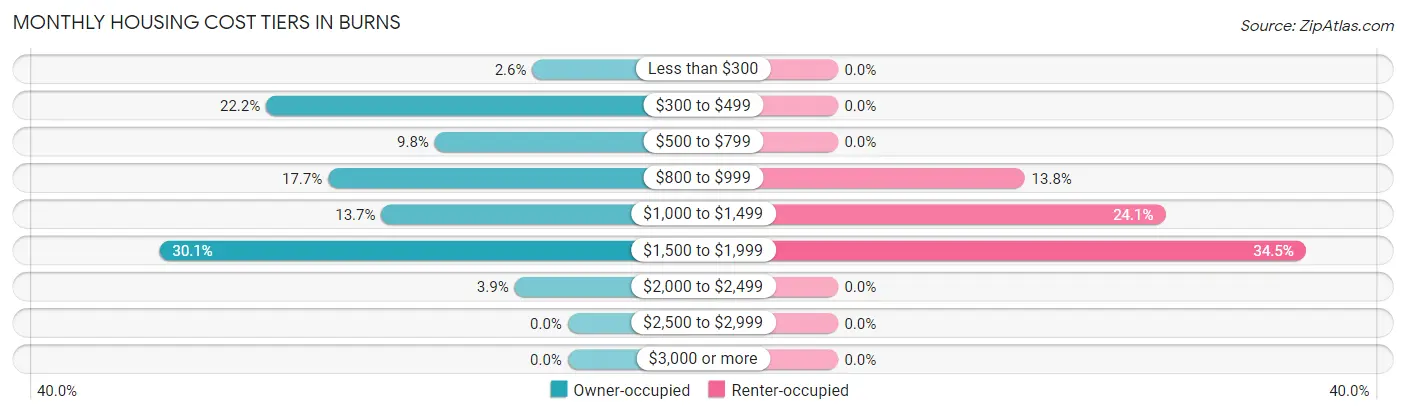
| Monthly Cost | Owner-occupied | Renter-occupied |
| Less than $300 | 4 (2.6%) | 0 (0.0%) |
| $300 to $499 | 34 (22.2%) | 0 (0.0%) |
| $500 to $799 | 15 (9.8%) | 0 (0.0%) |
| $800 to $999 | 27 (17.6%) | 4 (13.8%) |
| $1,000 to $1,499 | 21 (13.7%) | 7 (24.1%) |
| $1,500 to $1,999 | 46 (30.1%) | 10 (34.5%) |
| $2,000 to $2,499 | 6 (3.9%) | 0 (0.0%) |
| $2,500 to $2,999 | 0 (0.0%) | 0 (0.0%) |
| $3,000 or more | 0 (0.0%) | 0 (0.0%) |
| Total | 153 (100.0%) | 29 (100.0%) |
Physical Housing Characteristics in Burns
Housing Structures in Burns
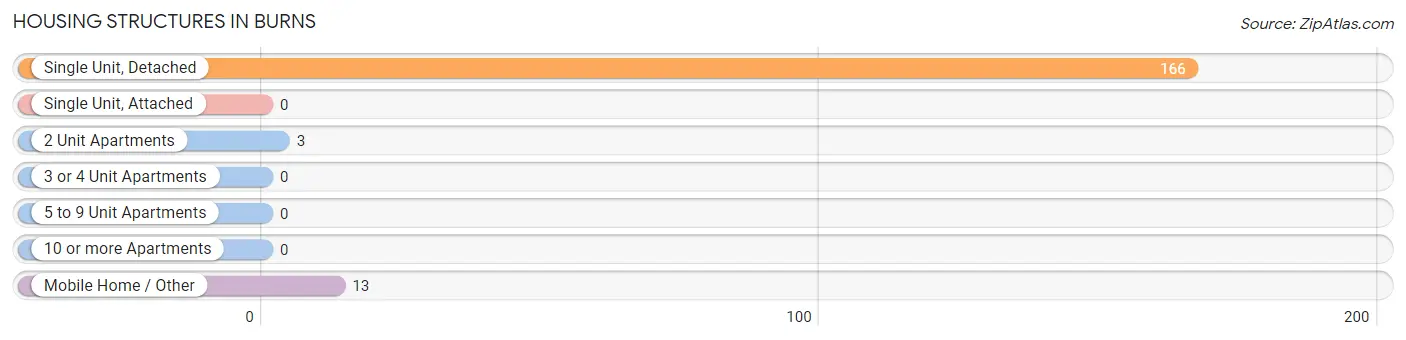
| Structure Type | # Housing Units | % Housing Units |
| Single Unit, Detached | 166 | 91.2% |
| Single Unit, Attached | 0 | 0.0% |
| 2 Unit Apartments | 3 | 1.7% |
| 3 or 4 Unit Apartments | 0 | 0.0% |
| 5 to 9 Unit Apartments | 0 | 0.0% |
| 10 or more Apartments | 0 | 0.0% |
| Mobile Home / Other | 13 | 7.1% |
| Total | 182 | 100.0% |
Housing Structures by Occupancy in Burns
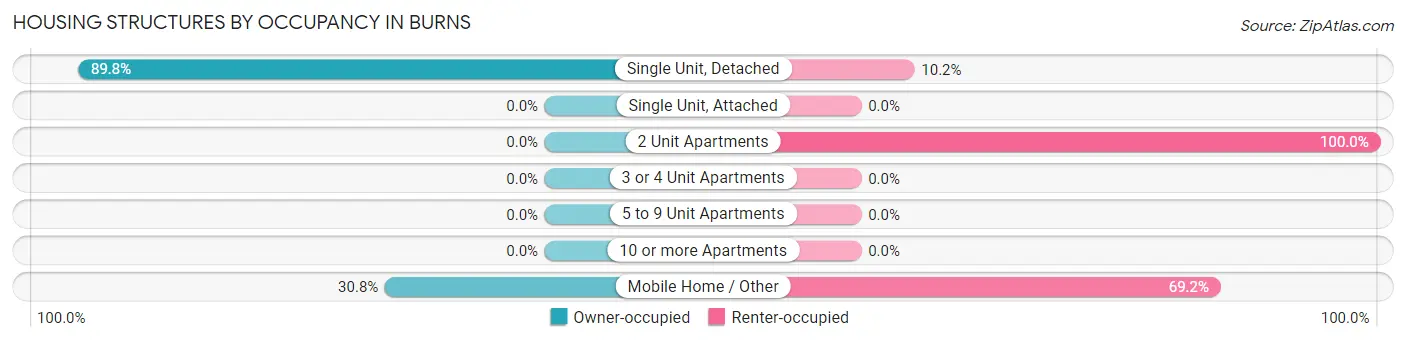
| Structure Type | Owner-occupied | Renter-occupied |
| Single Unit, Detached | 149 (89.8%) | 17 (10.2%) |
| Single Unit, Attached | 0 (0.0%) | 0 (0.0%) |
| 2 Unit Apartments | 0 (0.0%) | 3 (100.0%) |
| 3 or 4 Unit Apartments | 0 (0.0%) | 0 (0.0%) |
| 5 to 9 Unit Apartments | 0 (0.0%) | 0 (0.0%) |
| 10 or more Apartments | 0 (0.0%) | 0 (0.0%) |
| Mobile Home / Other | 4 (30.8%) | 9 (69.2%) |
| Total | 153 (84.1%) | 29 (15.9%) |
Housing Structures by Number of Rooms in Burns
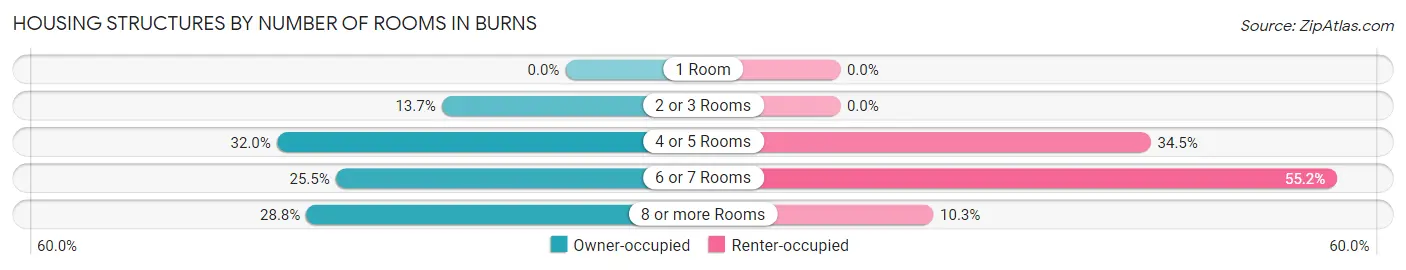
| Number of Rooms | Owner-occupied | Renter-occupied |
| 1 Room | 0 (0.0%) | 0 (0.0%) |
| 2 or 3 Rooms | 21 (13.7%) | 0 (0.0%) |
| 4 or 5 Rooms | 49 (32.0%) | 10 (34.5%) |
| 6 or 7 Rooms | 39 (25.5%) | 16 (55.2%) |
| 8 or more Rooms | 44 (28.8%) | 3 (10.3%) |
| Total | 153 (100.0%) | 29 (100.0%) |
Housing Structure by Heating Type in Burns
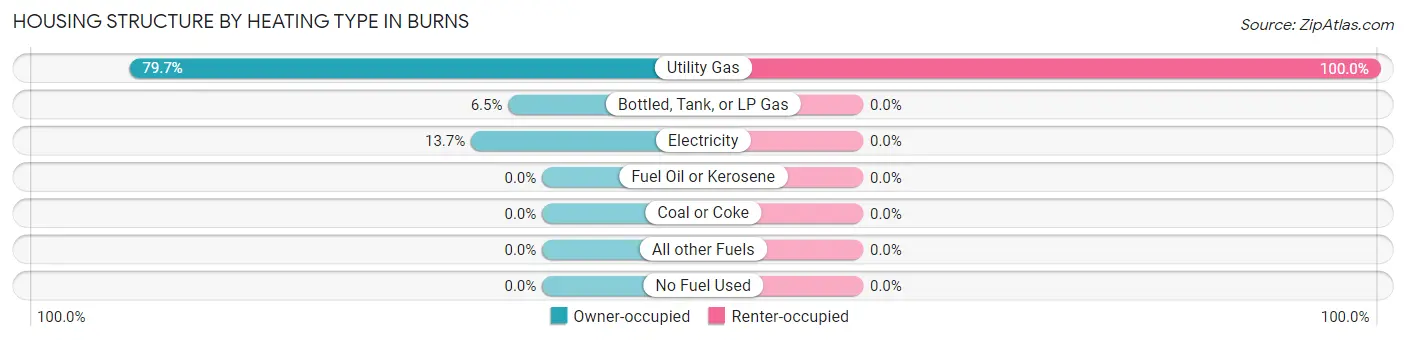
| Heating Type | Owner-occupied | Renter-occupied |
| Utility Gas | 122 (79.7%) | 29 (100.0%) |
| Bottled, Tank, or LP Gas | 10 (6.5%) | 0 (0.0%) |
| Electricity | 21 (13.7%) | 0 (0.0%) |
| Fuel Oil or Kerosene | 0 (0.0%) | 0 (0.0%) |
| Coal or Coke | 0 (0.0%) | 0 (0.0%) |
| All other Fuels | 0 (0.0%) | 0 (0.0%) |
| No Fuel Used | 0 (0.0%) | 0 (0.0%) |
| Total | 153 (100.0%) | 29 (100.0%) |
Household Vehicle Usage in Burns
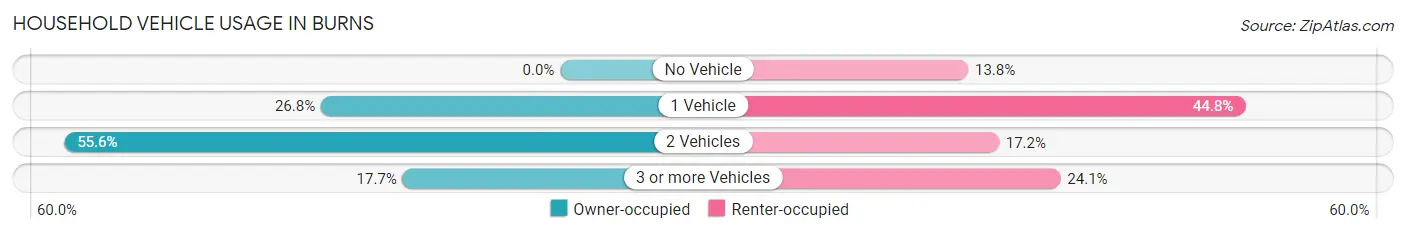
| Vehicles per Household | Owner-occupied | Renter-occupied |
| No Vehicle | 0 (0.0%) | 4 (13.8%) |
| 1 Vehicle | 41 (26.8%) | 13 (44.8%) |
| 2 Vehicles | 85 (55.6%) | 5 (17.2%) |
| 3 or more Vehicles | 27 (17.6%) | 7 (24.1%) |
| Total | 153 (100.0%) | 29 (100.0%) |
Real Estate & Mortgages in Burns
Real Estate and Mortgage Overview in Burns
| Characteristic | Without Mortgage | With Mortgage |
| Housing Units | 42 | 111 |
| Median Property Value | $230,000 | $168,600 |
| Median Household Income | $45,781 | $0 |
| Monthly Housing Costs | $435 | $0 |
| Real Estate Taxes | $942 | $0 |
Property Value by Mortgage Status in Burns
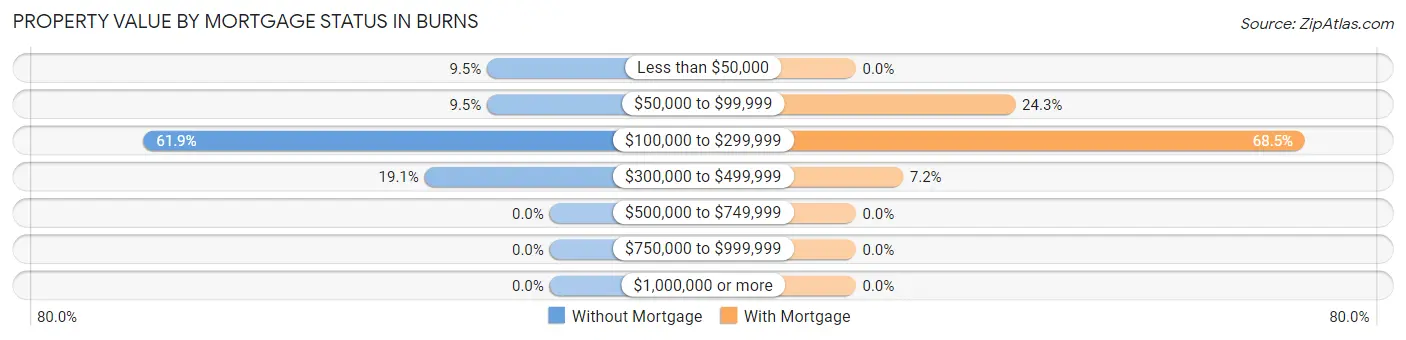
| Property Value | Without Mortgage | With Mortgage |
| Less than $50,000 | 4 (9.5%) | 0 (0.0%) |
| $50,000 to $99,999 | 4 (9.5%) | 27 (24.3%) |
| $100,000 to $299,999 | 26 (61.9%) | 76 (68.5%) |
| $300,000 to $499,999 | 8 (19.1%) | 8 (7.2%) |
| $500,000 to $749,999 | 0 (0.0%) | 0 (0.0%) |
| $750,000 to $999,999 | 0 (0.0%) | 0 (0.0%) |
| $1,000,000 or more | 0 (0.0%) | 0 (0.0%) |
| Total | 42 (100.0%) | 111 (100.0%) |
Household Income by Mortgage Status in Burns
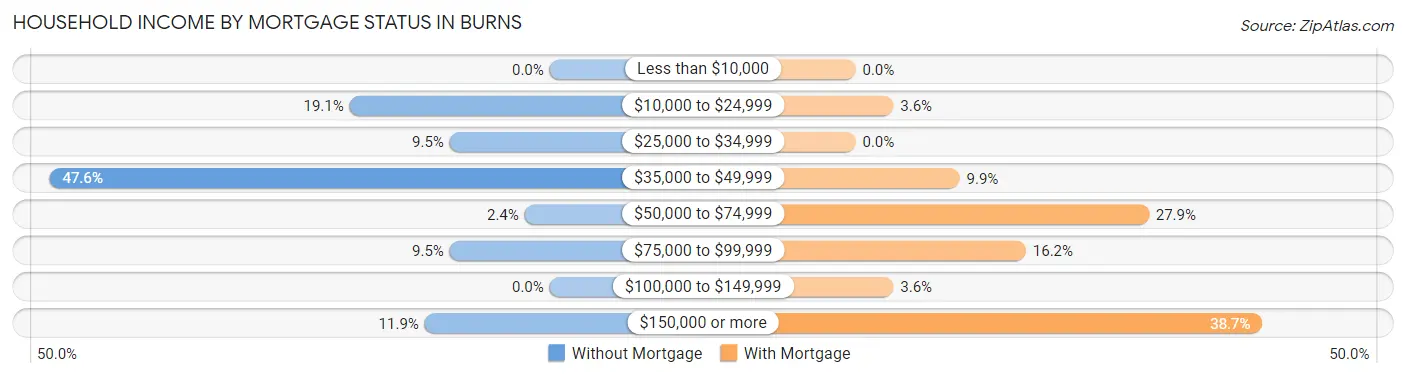
| Household Income | Without Mortgage | With Mortgage |
| Less than $10,000 | 0 (0.0%) | 0 (0.0%) |
| $10,000 to $24,999 | 8 (19.1%) | 4 (3.6%) |
| $25,000 to $34,999 | 4 (9.5%) | 0 (0.0%) |
| $35,000 to $49,999 | 20 (47.6%) | 11 (9.9%) |
| $50,000 to $74,999 | 1 (2.4%) | 31 (27.9%) |
| $75,000 to $99,999 | 4 (9.5%) | 18 (16.2%) |
| $100,000 to $149,999 | 0 (0.0%) | 4 (3.6%) |
| $150,000 or more | 5 (11.9%) | 43 (38.7%) |
| Total | 42 (100.0%) | 111 (100.0%) |
Property Value to Household Income Ratio in Burns
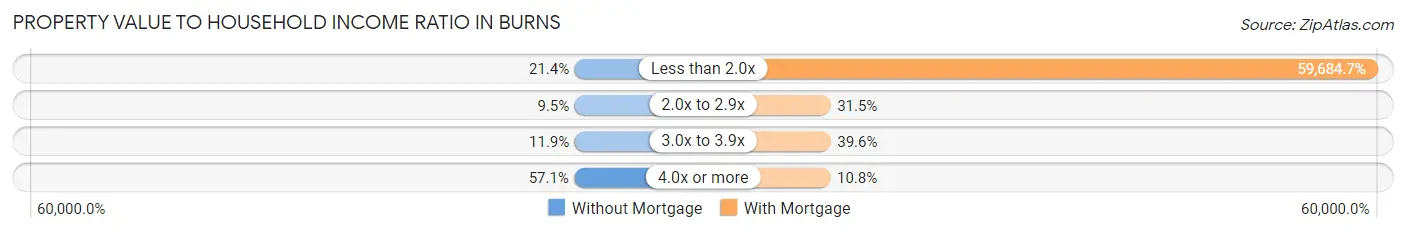
| Value-to-Income Ratio | Without Mortgage | With Mortgage |
| Less than 2.0x | 9 (21.4%) | 66,250 (59,684.7%) |
| 2.0x to 2.9x | 4 (9.5%) | 35 (31.5%) |
| 3.0x to 3.9x | 5 (11.9%) | 44 (39.6%) |
| 4.0x or more | 24 (57.1%) | 12 (10.8%) |
| Total | 42 (100.0%) | 111 (100.0%) |
Real Estate Taxes by Mortgage Status in Burns
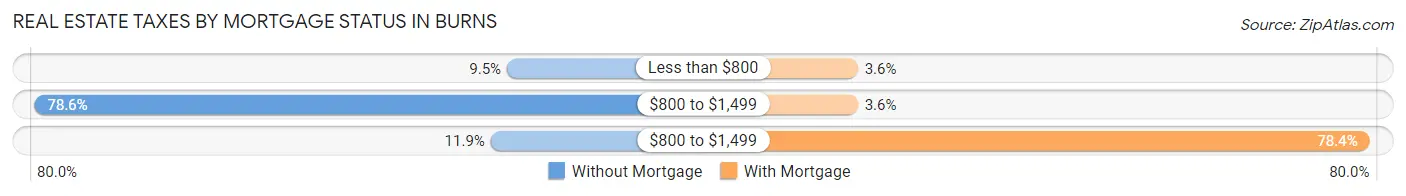
| Property Taxes | Without Mortgage | With Mortgage |
| Less than $800 | 4 (9.5%) | 4 (3.6%) |
| $800 to $1,499 | 33 (78.6%) | 4 (3.6%) |
| $800 to $1,499 | 5 (11.9%) | 87 (78.4%) |
| Total | 42 (100.0%) | 111 (100.0%) |
Health & Disability in Burns
Health Insurance Coverage by Age in Burns
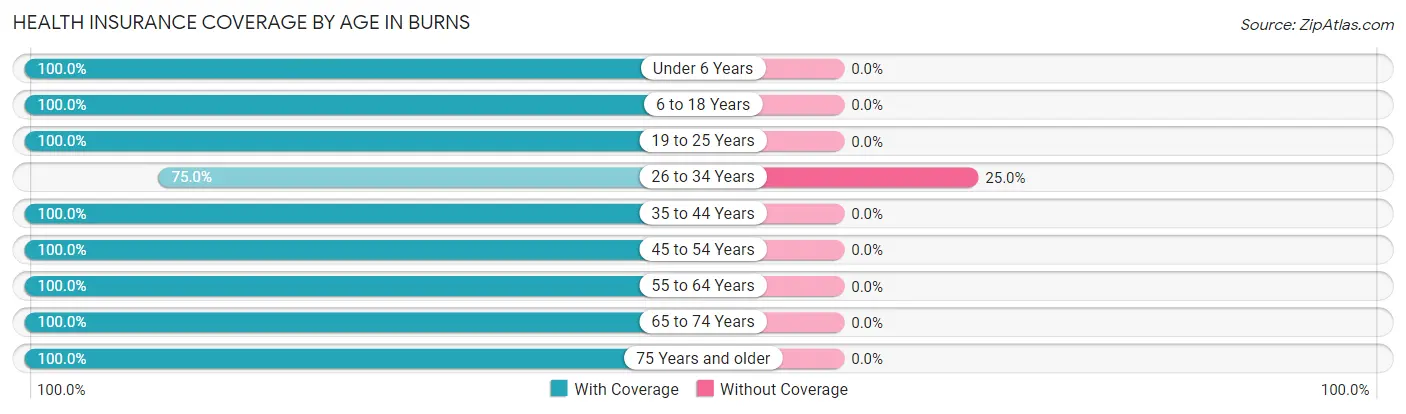
| Age Bracket | With Coverage | Without Coverage |
| Under 6 Years | 33 (100.0%) | 0 (0.0%) |
| 6 to 18 Years | 42 (100.0%) | 0 (0.0%) |
| 19 to 25 Years | 8 (100.0%) | 0 (0.0%) |
| 26 to 34 Years | 18 (75.0%) | 6 (25.0%) |
| 35 to 44 Years | 41 (100.0%) | 0 (0.0%) |
| 45 to 54 Years | 54 (100.0%) | 0 (0.0%) |
| 55 to 64 Years | 46 (100.0%) | 0 (0.0%) |
| 65 to 74 Years | 105 (100.0%) | 0 (0.0%) |
| 75 Years and older | 34 (100.0%) | 0 (0.0%) |
| Total | 381 (98.5%) | 6 (1.5%) |
Health Insurance Coverage by Citizenship Status in Burns
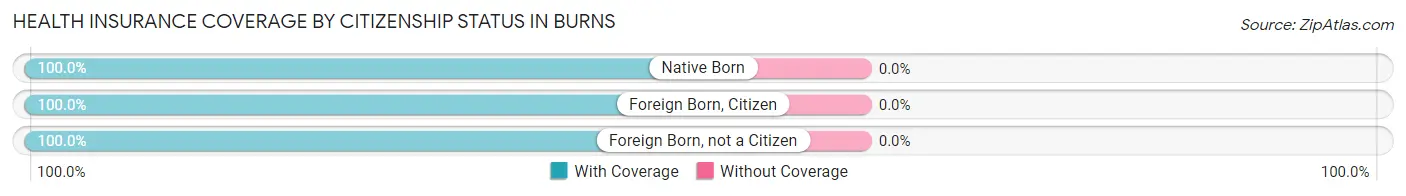
| Citizenship Status | With Coverage | Without Coverage |
| Native Born | 33 (100.0%) | 0 (0.0%) |
| Foreign Born, Citizen | 42 (100.0%) | 0 (0.0%) |
| Foreign Born, not a Citizen | 8 (100.0%) | 0 (0.0%) |
Health Insurance Coverage by Household Income in Burns
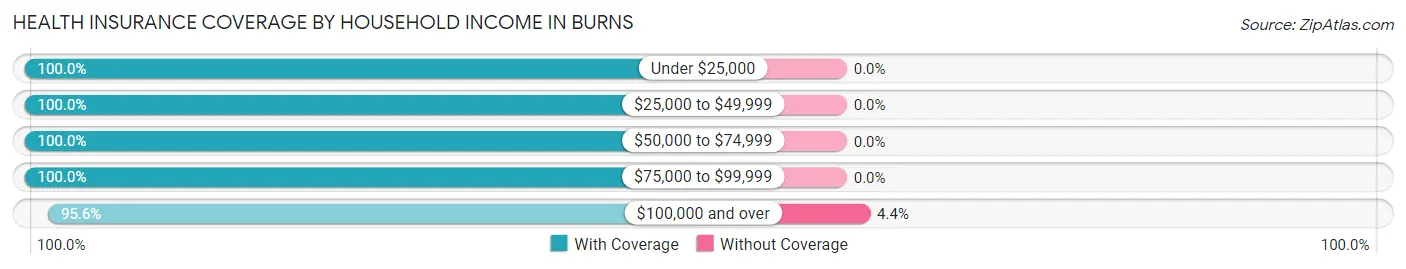
| Household Income | With Coverage | Without Coverage |
| Under $25,000 | 30 (100.0%) | 0 (0.0%) |
| $25,000 to $49,999 | 154 (100.0%) | 0 (0.0%) |
| $50,000 to $74,999 | 25 (100.0%) | 0 (0.0%) |
| $75,000 to $99,999 | 41 (100.0%) | 0 (0.0%) |
| $100,000 and over | 131 (95.6%) | 6 (4.4%) |
Public vs Private Health Insurance Coverage by Age in Burns
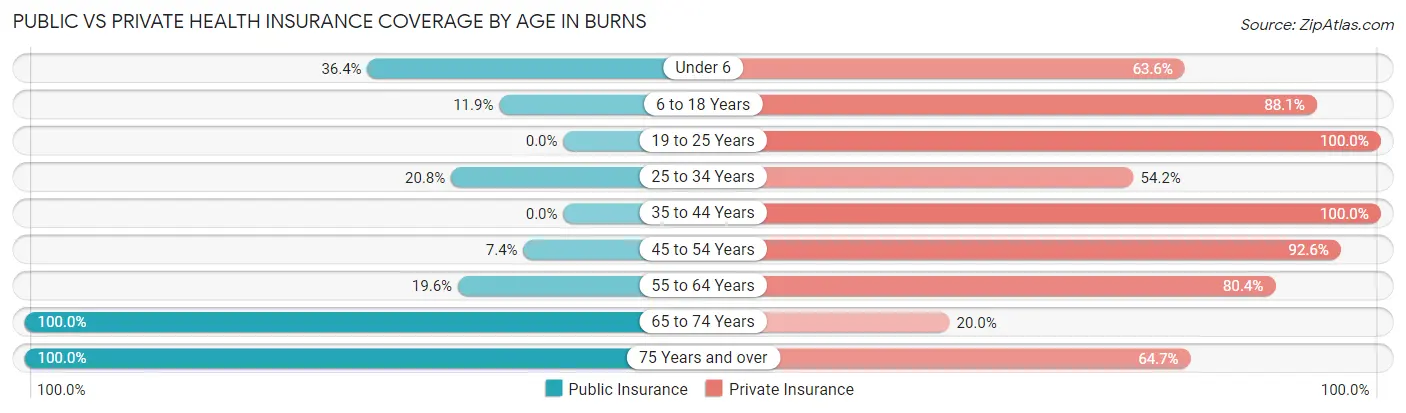
| Age Bracket | Public Insurance | Private Insurance |
| Under 6 | 12 (36.4%) | 21 (63.6%) |
| 6 to 18 Years | 5 (11.9%) | 37 (88.1%) |
| 19 to 25 Years | 0 (0.0%) | 8 (100.0%) |
| 25 to 34 Years | 5 (20.8%) | 13 (54.2%) |
| 35 to 44 Years | 0 (0.0%) | 41 (100.0%) |
| 45 to 54 Years | 4 (7.4%) | 50 (92.6%) |
| 55 to 64 Years | 9 (19.6%) | 37 (80.4%) |
| 65 to 74 Years | 105 (100.0%) | 21 (20.0%) |
| 75 Years and over | 34 (100.0%) | 22 (64.7%) |
| Total | 174 (45.0%) | 250 (64.6%) |
Disability Status by Sex by Age in Burns
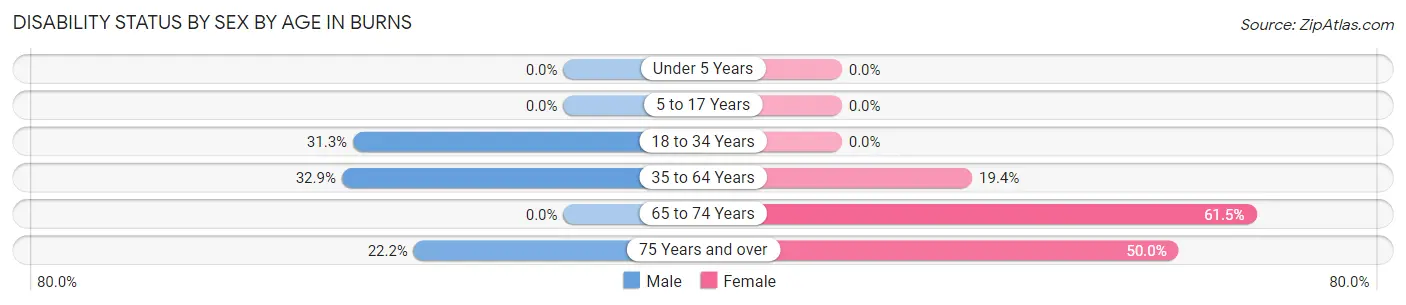
| Age Bracket | Male | Female |
| Under 5 Years | 0 (0.0%) | 0 (0.0%) |
| 5 to 17 Years | 0 (0.0%) | 0 (0.0%) |
| 18 to 34 Years | 5 (31.2%) | 0 (0.0%) |
| 35 to 64 Years | 26 (32.9%) | 12 (19.4%) |
| 65 to 74 Years | 0 (0.0%) | 40 (61.5%) |
| 75 Years and over | 4 (22.2%) | 8 (50.0%) |
Disability Class by Sex by Age in Burns
Disability Class: Hearing Difficulty
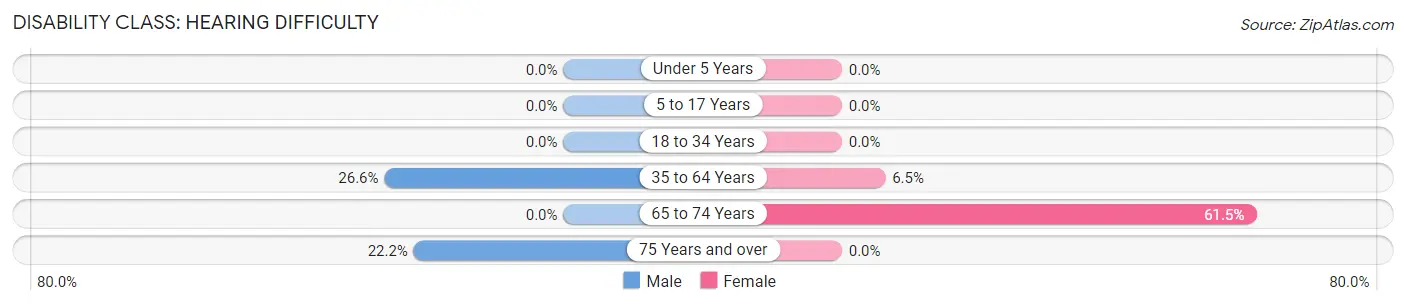
| Age Bracket | Male | Female |
| Under 5 Years | 0 (0.0%) | 0 (0.0%) |
| 5 to 17 Years | 0 (0.0%) | 0 (0.0%) |
| 18 to 34 Years | 0 (0.0%) | 0 (0.0%) |
| 35 to 64 Years | 21 (26.6%) | 4 (6.5%) |
| 65 to 74 Years | 0 (0.0%) | 40 (61.5%) |
| 75 Years and over | 4 (22.2%) | 0 (0.0%) |
Disability Class: Vision Difficulty
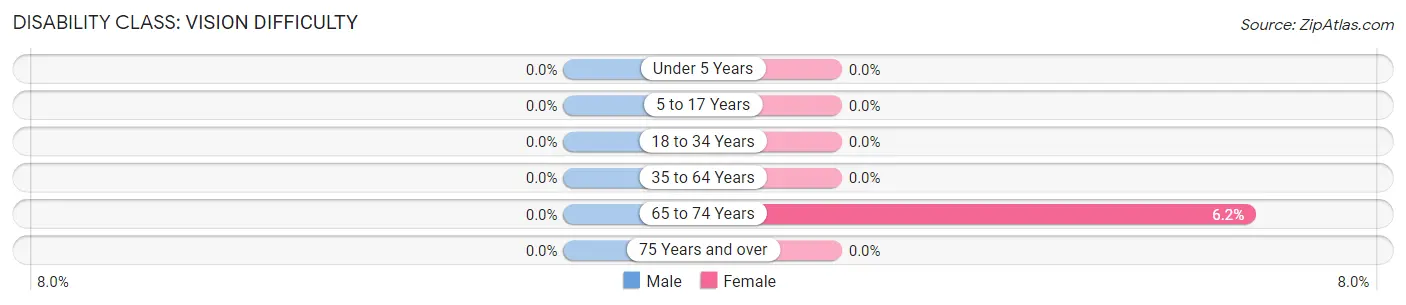
| Age Bracket | Male | Female |
| Under 5 Years | 0 (0.0%) | 0 (0.0%) |
| 5 to 17 Years | 0 (0.0%) | 0 (0.0%) |
| 18 to 34 Years | 0 (0.0%) | 0 (0.0%) |
| 35 to 64 Years | 0 (0.0%) | 0 (0.0%) |
| 65 to 74 Years | 0 (0.0%) | 4 (6.1%) |
| 75 Years and over | 0 (0.0%) | 0 (0.0%) |
Disability Class: Cognitive Difficulty
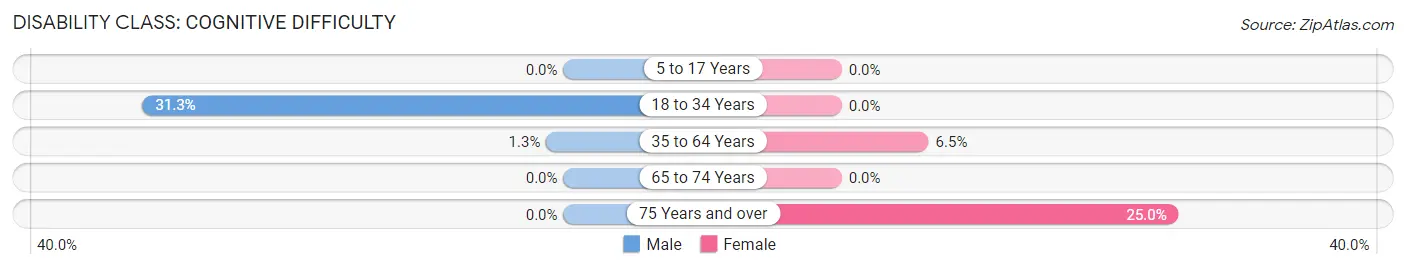
| Age Bracket | Male | Female |
| 5 to 17 Years | 0 (0.0%) | 0 (0.0%) |
| 18 to 34 Years | 5 (31.2%) | 0 (0.0%) |
| 35 to 64 Years | 1 (1.3%) | 4 (6.5%) |
| 65 to 74 Years | 0 (0.0%) | 0 (0.0%) |
| 75 Years and over | 0 (0.0%) | 4 (25.0%) |
Disability Class: Ambulatory Difficulty
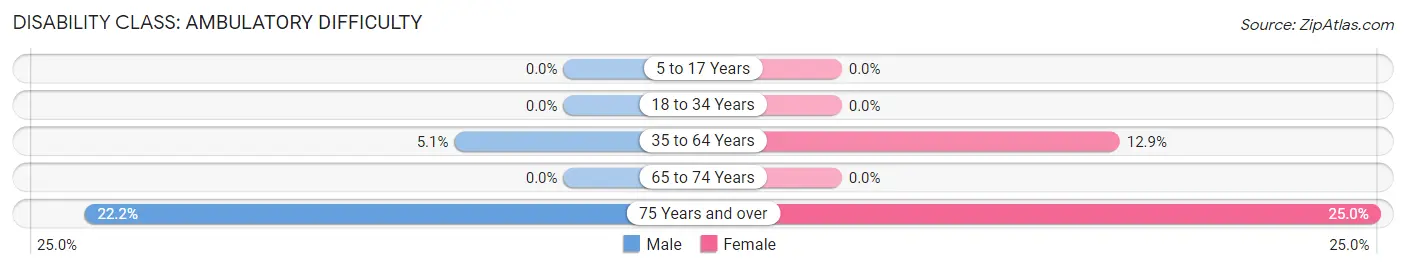
| Age Bracket | Male | Female |
| 5 to 17 Years | 0 (0.0%) | 0 (0.0%) |
| 18 to 34 Years | 0 (0.0%) | 0 (0.0%) |
| 35 to 64 Years | 4 (5.1%) | 8 (12.9%) |
| 65 to 74 Years | 0 (0.0%) | 0 (0.0%) |
| 75 Years and over | 4 (22.2%) | 4 (25.0%) |
Disability Class: Self-Care Difficulty
| Age Bracket | Male | Female |
| 5 to 17 Years | 0 (0.0%) | 0 (0.0%) |
| 18 to 34 Years | 0 (0.0%) | 0 (0.0%) |
| 35 to 64 Years | 0 (0.0%) | 0 (0.0%) |
| 65 to 74 Years | 0 (0.0%) | 0 (0.0%) |
| 75 Years and over | 0 (0.0%) | 0 (0.0%) |
Technology Access in Burns
Computing Device Access in Burns
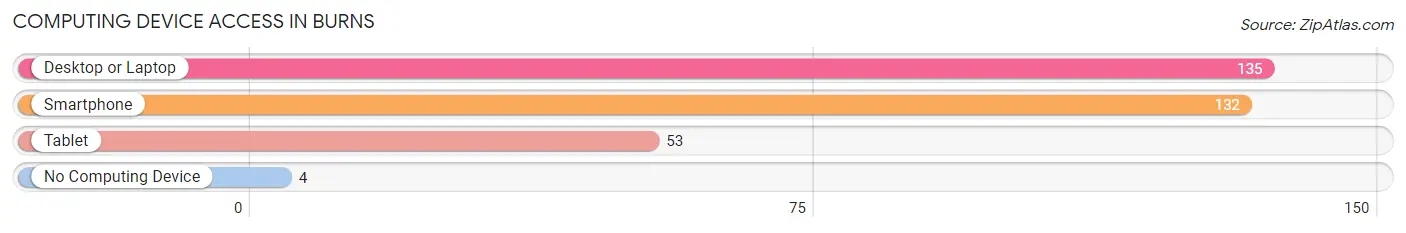
| Device Type | # Households | % Households |
| Desktop or Laptop | 135 | 74.2% |
| Smartphone | 132 | 72.5% |
| Tablet | 53 | 29.1% |
| No Computing Device | 4 | 2.2% |
| Total | 182 | 100.0% |
Internet Access in Burns
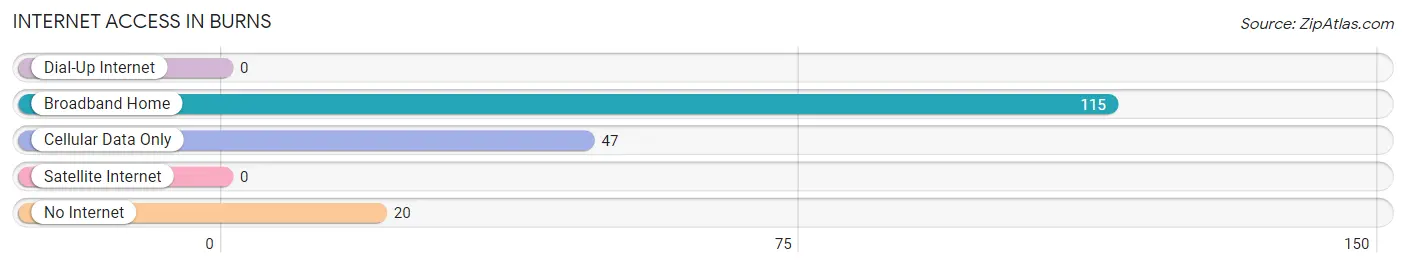
| Internet Type | # Households | % Households |
| Dial-Up Internet | 0 | 0.0% |
| Broadband Home | 115 | 63.2% |
| Cellular Data Only | 47 | 25.8% |
| Satellite Internet | 0 | 0.0% |
| No Internet | 20 | 11.0% |
| Total | 182 | 100.0% |
Burns Summary
Burns, Wyoming is a small town located in the southeastern corner of the state, near the border of Colorado and Nebraska. It is the county seat of Carbon County and has a population of just over 1,000 people. The town was founded in 1882 and named after a local rancher, William Burns.
Geography
Burns is located in the high plains of southeastern Wyoming, at an elevation of 5,845 feet. The town is situated on the banks of the North Platte River, which flows through the area. The surrounding area is mostly flat, with rolling hills and grasslands. The climate is semi-arid, with hot summers and cold winters.
Economy
The economy of Burns is largely based on agriculture and ranching. The town is home to several large ranches, including the Burns Ranch, which is one of the largest in the state. The town also has a small manufacturing sector, with several small businesses producing a variety of products.
The town is also home to a number of tourist attractions, including the Carbon County Museum, which houses artifacts from the area's history. The town also has a number of restaurants, bars, and other businesses catering to tourists.
Demographics
As of the 2010 census, the population of Burns was 1,037. The racial makeup of the town was 95.3% White, 0.3% African American, 0.2% Native American, 0.2% Asian, 0.1% Pacific Islander, 0.7% from other races, and 2.4% from two or more races. Hispanic or Latino of any race were 3.2% of the population.
The median income for a household in Burns was $37,500, and the median income for a family was $45,000. The per capita income for the town was $19,845. About 11.2% of families and 14.2% of the population were below the poverty line, including 18.2% of those under age 18 and 8.3% of those age 65 or over.
History
Burns was founded in 1882 by William Burns, a local rancher. The town was originally called "Burns Station" and served as a stop on the Union Pacific Railroad. The town was officially incorporated in 1887.
In the early 1900s, Burns was a bustling town, with a population of over 1,000 people. The town had several stores, a hotel, a bank, and a post office. The town also had a school, a newspaper, and a library.
In the late 1950s, the town began to decline as the railroad industry declined. The population dropped to just over 500 people by the 1970s. In recent years, the town has seen a resurgence, with the population increasing to over 1,000 people. The town is now home to several businesses, including a grocery store, a hardware store, and a restaurant.
Common Questions
What is Per Capita Income in Burns?
Per Capita income in Burns is $33,205.
What is the Median Household income in Burns?
Median Household Income in Burns is $47,128.
What is Income or Wage Gap in Burns?
Income or Wage Gap in Burns is 42.9%.
Women in Burns earn 57.1 cents for every dollar earned by a man.
What is Inequality or Gini Index in Burns?
Inequality or Gini Index in Burns is 0.35.
What is the Total Population of Burns?
Total Population of Burns is 392.
What is the Total Male Population of Burns?
Total Male Population of Burns is 186.
What is the Total Female Population of Burns?
Total Female Population of Burns is 206.
What is the Ratio of Males per 100 Females in Burns?
There are 90.29 Males per 100 Females in Burns.
What is the Ratio of Females per 100 Males in Burns?
There are 110.75 Females per 100 Males in Burns.
What is the Median Population Age in Burns?
Median Population Age in Burns is 54.5 Years.
What is the Average Family Size in Burns
Average Family Size in Burns is 2.7 People.
What is the Average Household Size in Burns
Average Household Size in Burns is 2.1 People.
How Large is the Labor Force in Burns?
There are 179 People in the Labor Forcein in Burns.
What is the Percentage of People in the Labor Force in Burns?
53.8% of People are in the Labor Force in Burns.