Big Piney, WY Map & Demographics
Big Piney Map
Big Piney Overview
$32,136
PER CAPITA INCOME
$74,375
AVG FAMILY INCOME
$60,893
AVG HOUSEHOLD INCOME
0.35
INEQUALITY / GINI INDEX
450
TOTAL POPULATION
245
MALE POPULATION
205
FEMALE POPULATION
119.51
MALES / 100 FEMALES
83.67
FEMALES / 100 MALES
43.5
MEDIAN AGE
4.5
AVG FAMILY SIZE
2.8
AVG HOUSEHOLD SIZE
223
LABOR FORCE [ PEOPLE ]
65.0%
PERCENT IN LABOR FORCE
7.6%
UNEMPLOYMENT RATE
Big Piney Zip Codes
Big Piney Area Codes
Income in Big Piney
Income Overview in Big Piney
Per Capita Income in Big Piney is $32,136, while median incomes of families and households are $74,375 and $60,893 respectively.
| Characteristic | Number | Measure |
| Per Capita Income | 450 | $32,136 |
| Median Family Income | 70 | $74,375 |
| Mean Family Income | 70 | $86,817 |
| Median Household Income | 163 | $60,893 |
| Mean Household Income | 163 | $70,545 |
| Income Deficit | 70 | $0 |
| Wage / Income Gap (%) | 450 | 0.00% |
| Wage / Income Gap ($) | 450 | 100.00¢ per $1 |
| Gini / Inequality Index | 450 | 0.35 |
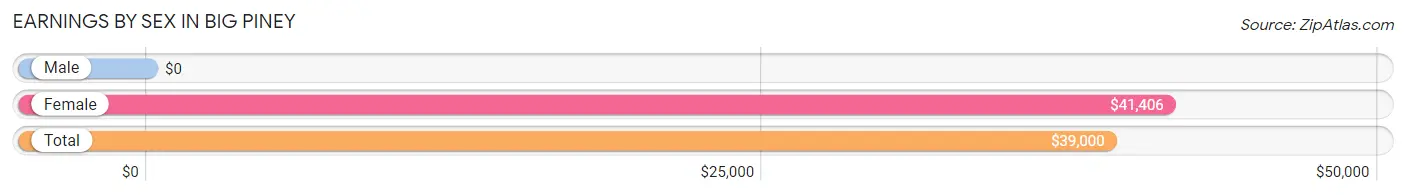
Earnings by Sex in Big Piney
| Sex | Number | Average Earnings |
| Male | 163 (65.2%) | $0 |
| Female | 87 (34.8%) | $41,406 |
| Total | 250 (100.0%) | $39,000 |
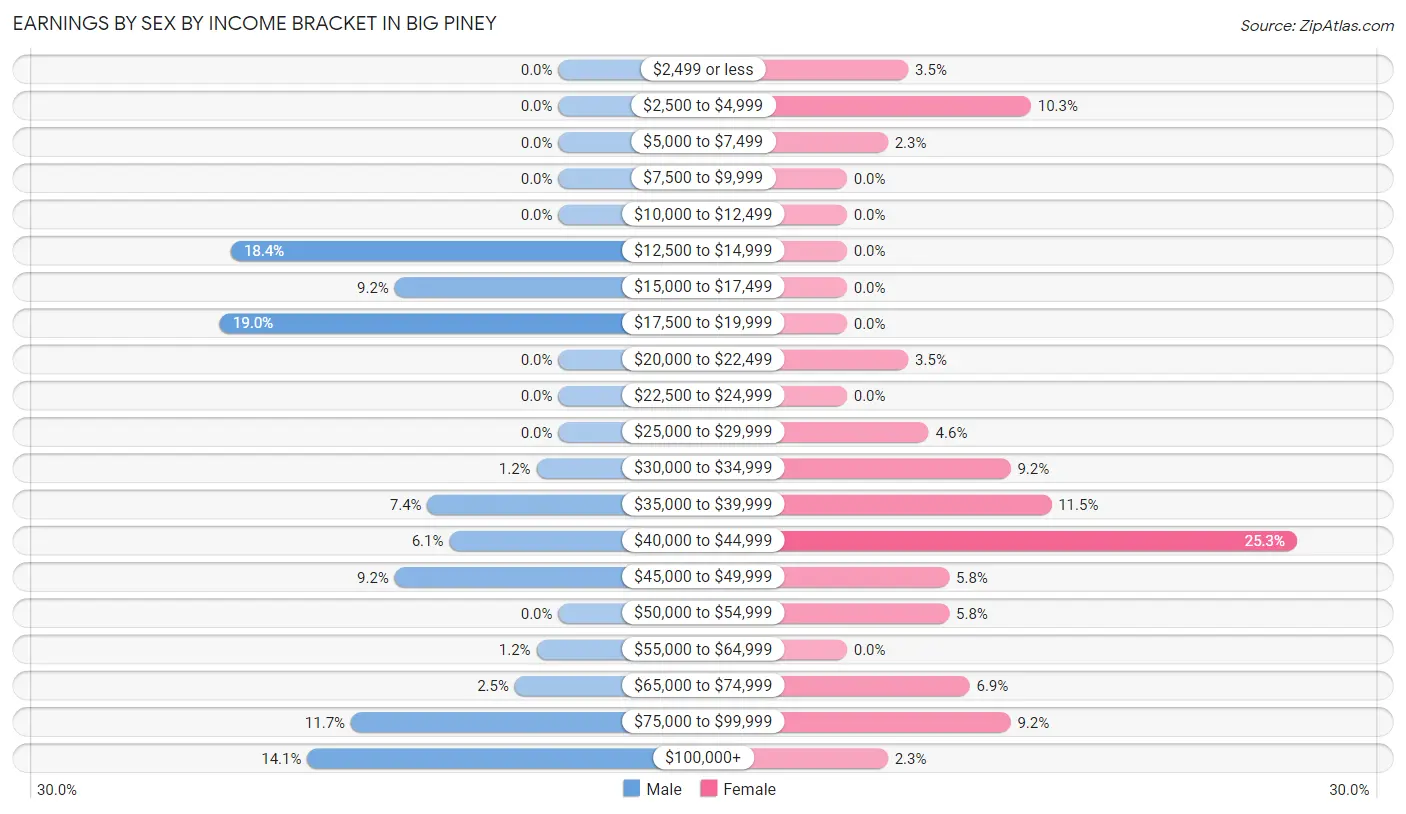
Earnings by Sex by Income Bracket in Big Piney
The most common earnings brackets in Big Piney are $17,500 to $19,999 for men (31 | 19.0%) and $40,000 to $44,999 for women (22 | 25.3%).
| Income | Male | Female |
| $2,499 or less | 0 (0.0%) | 3 (3.5%) |
| $2,500 to $4,999 | 0 (0.0%) | 9 (10.3%) |
| $5,000 to $7,499 | 0 (0.0%) | 2 (2.3%) |
| $7,500 to $9,999 | 0 (0.0%) | 0 (0.0%) |
| $10,000 to $12,499 | 0 (0.0%) | 0 (0.0%) |
| $12,500 to $14,999 | 30 (18.4%) | 0 (0.0%) |
| $15,000 to $17,499 | 15 (9.2%) | 0 (0.0%) |
| $17,500 to $19,999 | 31 (19.0%) | 0 (0.0%) |
| $20,000 to $22,499 | 0 (0.0%) | 3 (3.5%) |
| $22,500 to $24,999 | 0 (0.0%) | 0 (0.0%) |
| $25,000 to $29,999 | 0 (0.0%) | 4 (4.6%) |
| $30,000 to $34,999 | 2 (1.2%) | 8 (9.2%) |
| $35,000 to $39,999 | 12 (7.4%) | 10 (11.5%) |
| $40,000 to $44,999 | 10 (6.1%) | 22 (25.3%) |
| $45,000 to $49,999 | 15 (9.2%) | 5 (5.8%) |
| $50,000 to $54,999 | 0 (0.0%) | 5 (5.8%) |
| $55,000 to $64,999 | 2 (1.2%) | 0 (0.0%) |
| $65,000 to $74,999 | 4 (2.5%) | 6 (6.9%) |
| $75,000 to $99,999 | 19 (11.7%) | 8 (9.2%) |
| $100,000+ | 23 (14.1%) | 2 (2.3%) |
| Total | 163 (100.0%) | 87 (100.0%) |
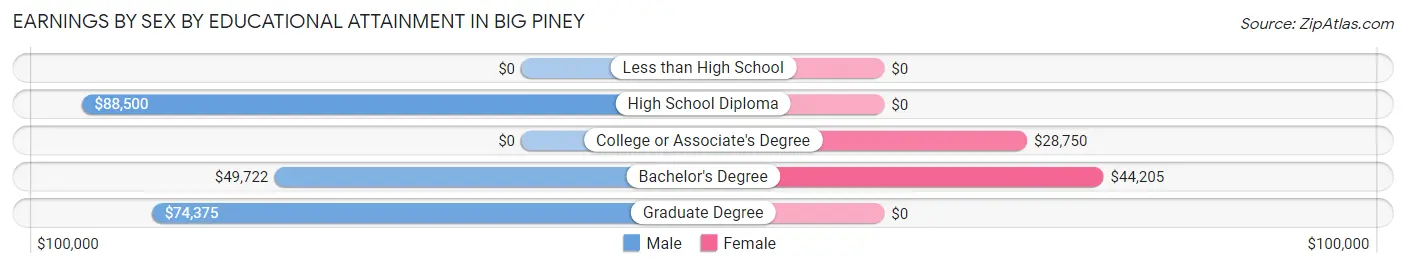
Earnings by Sex by Educational Attainment in Big Piney
Average earnings in Big Piney are $36,250 for men and $42,857 for women, a difference of 15.4%. Men with an educational attainment of high school diploma enjoy the highest average annual earnings of $88,500, while those with bachelor's degree education earn the least with $49,722. Women with an educational attainment of bachelor's degree earn the most with the average annual earnings of $44,205, while those with college or associate's degree education have the smallest earnings of $28,750.
| Educational Attainment | Male Income | Female Income |
| Less than High School | - | - |
| High School Diploma | $88,500 | $0 |
| College or Associate's Degree | - | - |
| Bachelor's Degree | $49,722 | $44,205 |
| Graduate Degree | $74,375 | $0 |
| Total | $36,250 | $42,857 |
Family Income in Big Piney
Family Income Brackets in Big Piney
According to the Big Piney family income data, there are 21 families falling into the $50,000 to $74,999 income range, which is the most common income bracket and makes up 30.0% of all families.
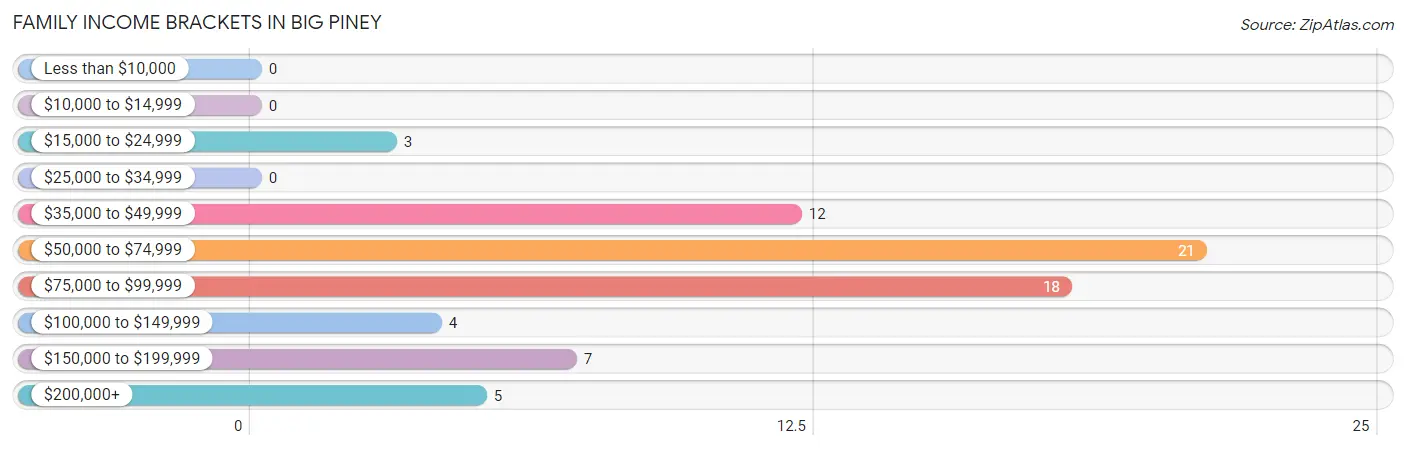
| Income Bracket | # Families | % Families |
| Less than $10,000 | 0 | 0.0% |
| $10,000 to $14,999 | 0 | 0.0% |
| $15,000 to $24,999 | 3 | 4.3% |
| $25,000 to $34,999 | 0 | 0.0% |
| $35,000 to $49,999 | 12 | 17.1% |
| $50,000 to $74,999 | 21 | 30.0% |
| $75,000 to $99,999 | 18 | 25.7% |
| $100,000 to $149,999 | 4 | 5.7% |
| $150,000 to $199,999 | 7 | 10.0% |
| $200,000+ | 5 | 7.1% |
Family Income by Famaliy Size in Big Piney
2-person families (30 | 42.9%) account for the highest median family income in Big Piney with $53,750 per family, while 2-person families (30 | 42.9%) have the highest median income of $26,875 per family member.
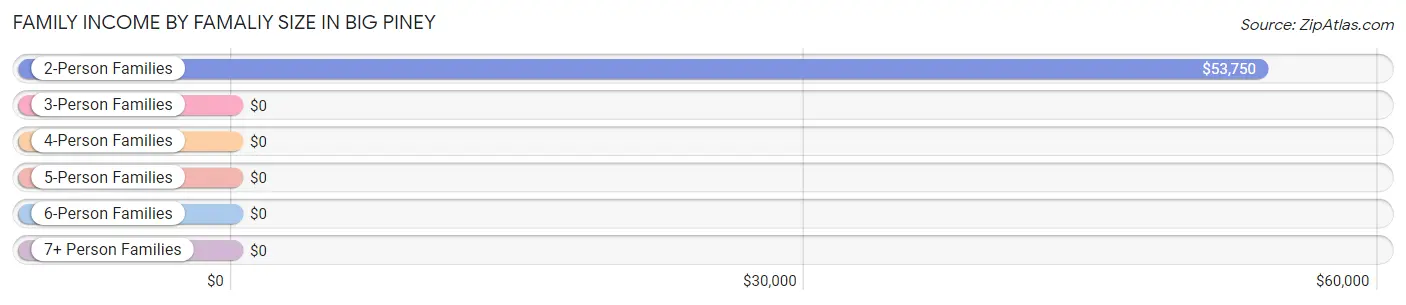
| Income Bracket | # Families | Median Income |
| 2-Person Families | 30 (42.9%) | $53,750 |
| 3-Person Families | 15 (21.4%) | $0 |
| 4-Person Families | 17 (24.3%) | $0 |
| 5-Person Families | 0 (0.0%) | $0 |
| 6-Person Families | 0 (0.0%) | $0 |
| 7+ Person Families | 8 (11.4%) | $0 |
| Total | 70 (100.0%) | $74,375 |
Family Income by Number of Earners in Big Piney
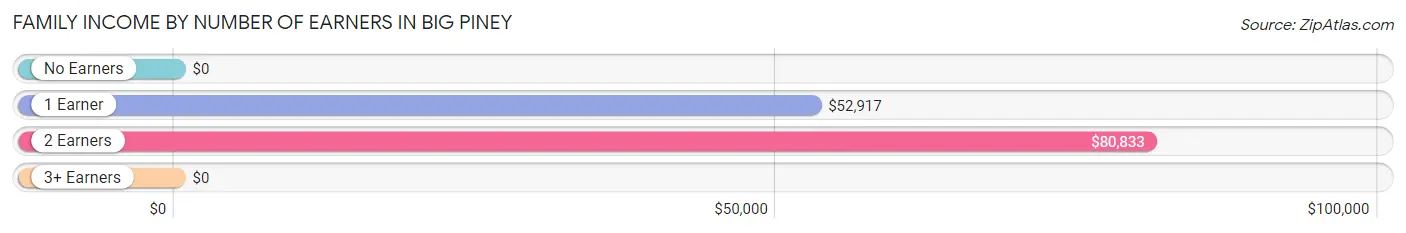
| Number of Earners | # Families | Median Income |
| No Earners | 4 (5.7%) | $0 |
| 1 Earner | 31 (44.3%) | $52,917 |
| 2 Earners | 26 (37.1%) | $80,833 |
| 3+ Earners | 9 (12.9%) | $0 |
| Total | 70 (100.0%) | $74,375 |
Household Income in Big Piney
Household Income Brackets in Big Piney
With 64 households falling in the category, the $50,000 to $74,999 income range is the most frequent in Big Piney, accounting for 39.3% of all households.
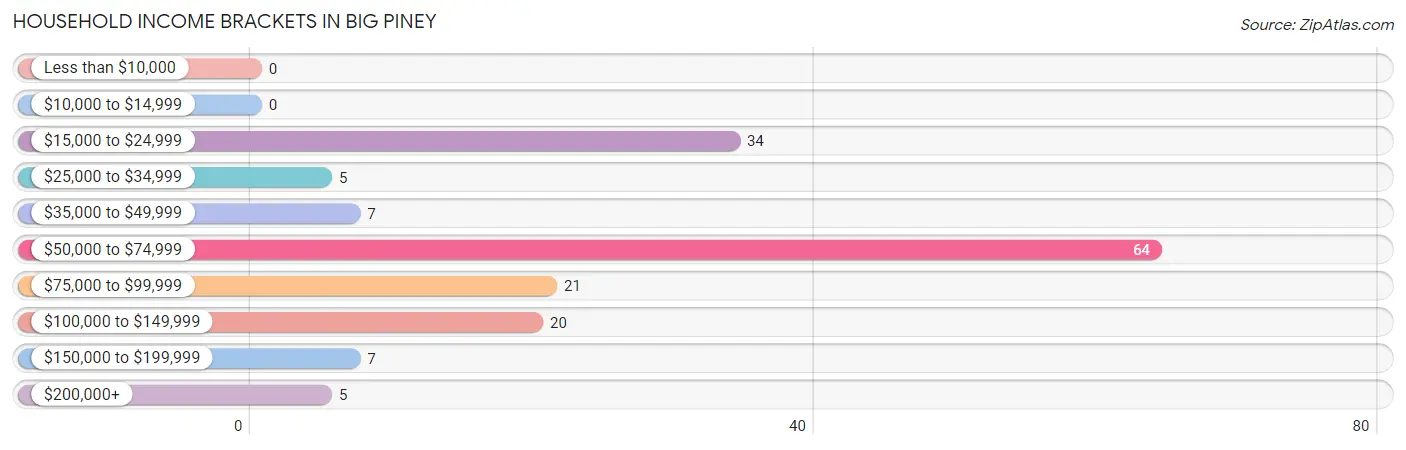
| Income Bracket | # Households | % Households |
| Less than $10,000 | 0 | 0.0% |
| $10,000 to $14,999 | 0 | 0.0% |
| $15,000 to $24,999 | 34 | 20.9% |
| $25,000 to $34,999 | 5 | 3.1% |
| $35,000 to $49,999 | 7 | 4.3% |
| $50,000 to $74,999 | 64 | 39.3% |
| $75,000 to $99,999 | 21 | 12.9% |
| $100,000 to $149,999 | 20 | 12.3% |
| $150,000 to $199,999 | 7 | 4.3% |
| $200,000+ | 5 | 3.1% |
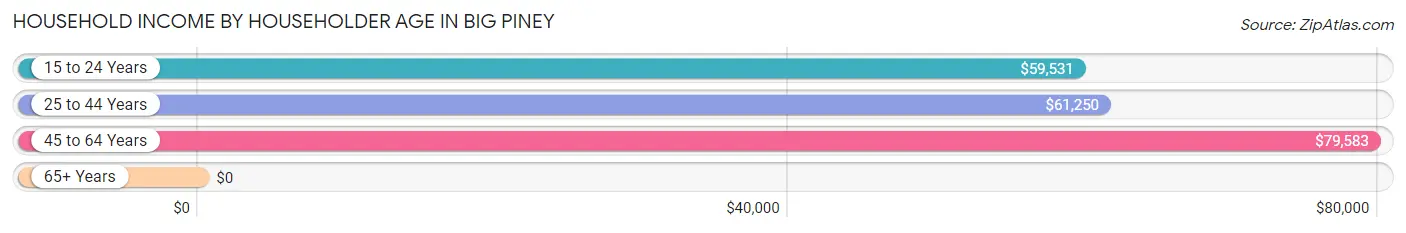
Household Income by Householder Age in Big Piney
The median household income in Big Piney is $60,893, with the highest median household income of $79,583 found in the 45 to 64 years age bracket for the primary householder. A total of 33 households (20.3%) fall into this category. Meanwhile, the 65+ years age bracket for the primary householder has the lowest median household income of $0, with 74 households (45.4%) in this group.
| Income Bracket | # Households | Median Income |
| 15 to 24 Years | 13 (8.0%) | $59,531 |
| 25 to 44 Years | 43 (26.4%) | $61,250 |
| 45 to 64 Years | 33 (20.3%) | $79,583 |
| 65+ Years | 74 (45.4%) | $0 |
| Total | 163 (100.0%) | $60,893 |
Poverty in Big Piney
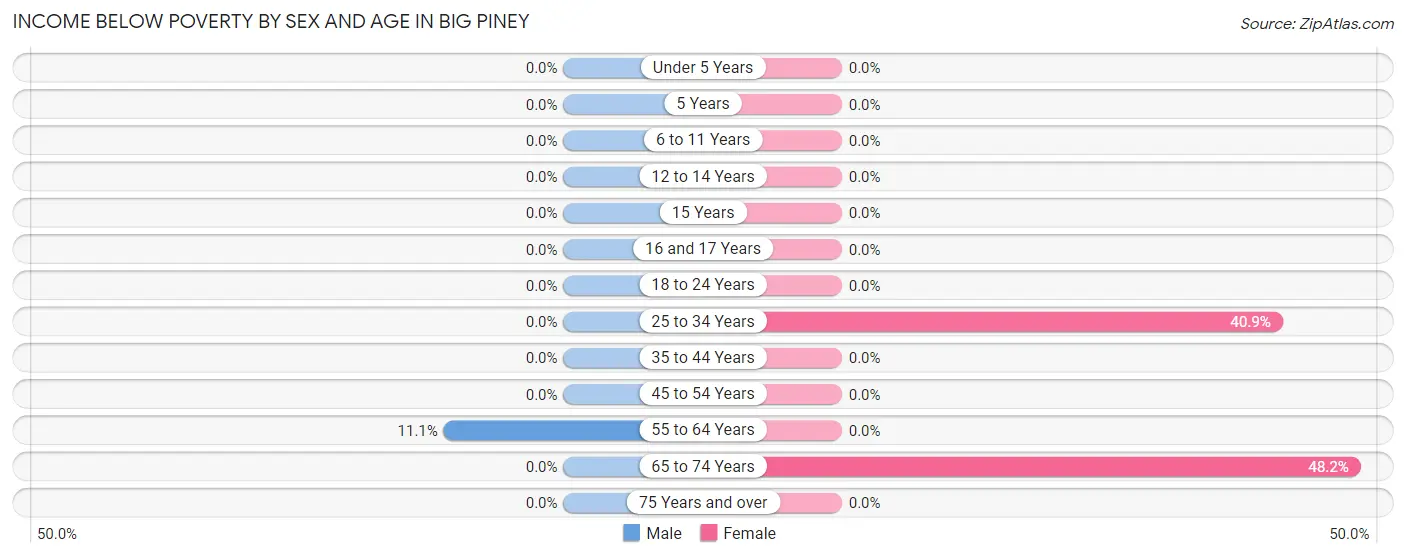
Income Below Poverty by Sex and Age in Big Piney
With 1.2% poverty level for males and 10.7% for females among the residents of Big Piney, 55 to 64 year old males and 65 to 74 year old females are the most vulnerable to poverty, with 3 males (11.1%) and 13 females (48.1%) in their respective age groups living below the poverty level.
| Age Bracket | Male | Female |
| Under 5 Years | 0 (0.0%) | 0 (0.0%) |
| 5 Years | 0 (0.0%) | 0 (0.0%) |
| 6 to 11 Years | 0 (0.0%) | 0 (0.0%) |
| 12 to 14 Years | 0 (0.0%) | 0 (0.0%) |
| 15 Years | 0 (0.0%) | 0 (0.0%) |
| 16 and 17 Years | 0 (0.0%) | 0 (0.0%) |
| 18 to 24 Years | 0 (0.0%) | 0 (0.0%) |
| 25 to 34 Years | 0 (0.0%) | 9 (40.9%) |
| 35 to 44 Years | 0 (0.0%) | 0 (0.0%) |
| 45 to 54 Years | 0 (0.0%) | 0 (0.0%) |
| 55 to 64 Years | 3 (11.1%) | 0 (0.0%) |
| 65 to 74 Years | 0 (0.0%) | 13 (48.1%) |
| 75 Years and over | 0 (0.0%) | 0 (0.0%) |
| Total | 3 (1.2%) | 22 (10.7%) |
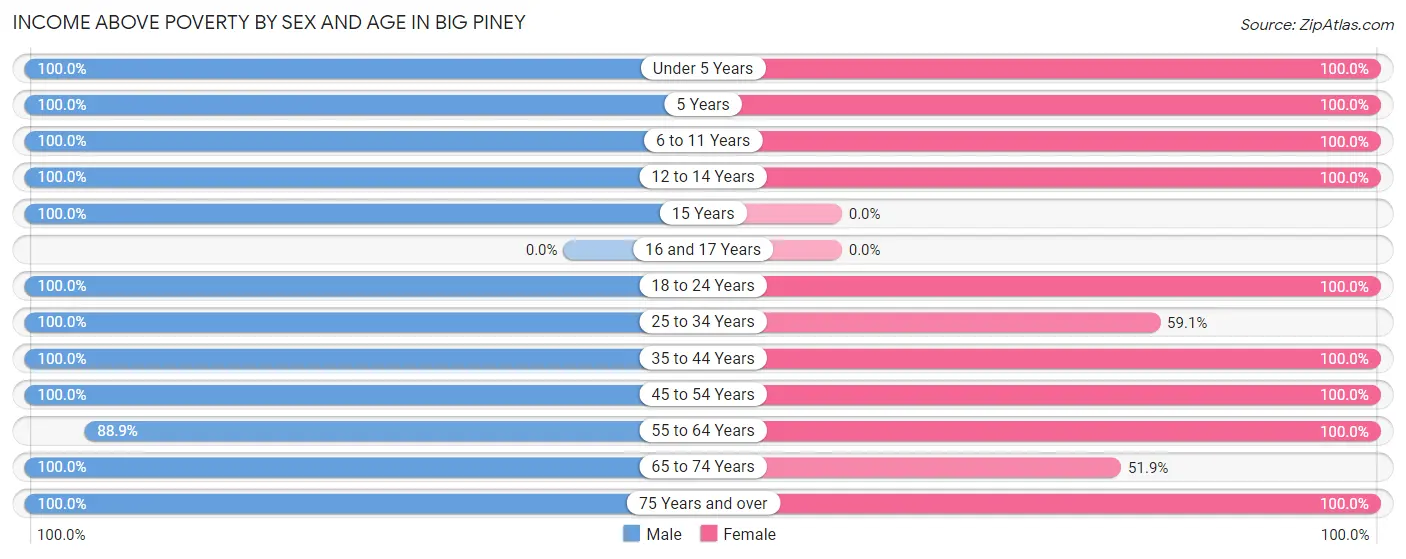
Income Above Poverty by Sex and Age in Big Piney
According to the poverty statistics in Big Piney, males aged under 5 years and females aged under 5 years are the age groups that are most secure financially, with 100.0% of males and 100.0% of females in these age groups living above the poverty line.
| Age Bracket | Male | Female |
| Under 5 Years | 17 (100.0%) | 7 (100.0%) |
| 5 Years | 4 (100.0%) | 11 (100.0%) |
| 6 to 11 Years | 11 (100.0%) | 32 (100.0%) |
| 12 to 14 Years | 16 (100.0%) | 6 (100.0%) |
| 15 Years | 3 (100.0%) | 0 (0.0%) |
| 16 and 17 Years | 0 (0.0%) | 0 (0.0%) |
| 18 to 24 Years | 9 (100.0%) | 13 (100.0%) |
| 25 to 34 Years | 40 (100.0%) | 13 (59.1%) |
| 35 to 44 Years | 17 (100.0%) | 19 (100.0%) |
| 45 to 54 Years | 67 (100.0%) | 22 (100.0%) |
| 55 to 64 Years | 24 (88.9%) | 13 (100.0%) |
| 65 to 74 Years | 13 (100.0%) | 14 (51.8%) |
| 75 Years and over | 21 (100.0%) | 33 (100.0%) |
| Total | 242 (98.8%) | 183 (89.3%) |
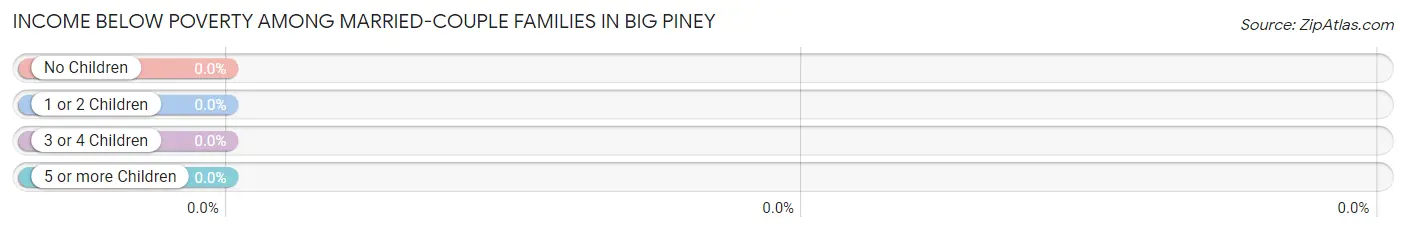
Income Below Poverty Among Married-Couple Families in Big Piney
| Children | Above Poverty | Below Poverty |
| No Children | 22 (100.0%) | 0 (0.0%) |
| 1 or 2 Children | 17 (100.0%) | 0 (0.0%) |
| 3 or 4 Children | 0 (0.0%) | 0 (0.0%) |
| 5 or more Children | 8 (100.0%) | 0 (0.0%) |
| Total | 47 (100.0%) | 0 (0.0%) |
Income Below Poverty Among Single-Parent Households in Big Piney
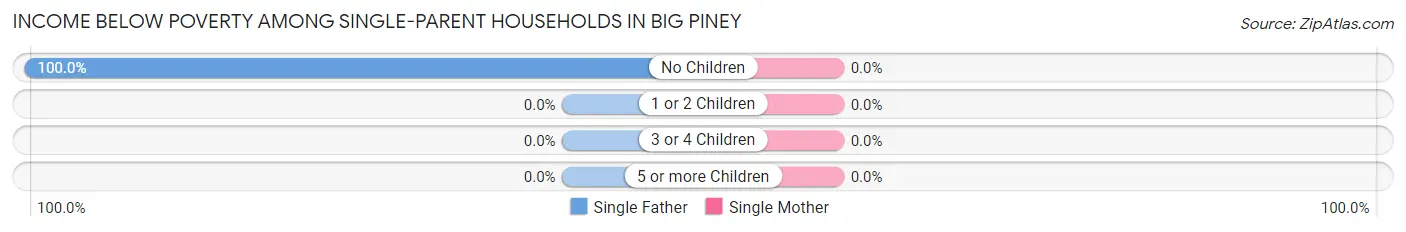
| Children | Single Father | Single Mother |
| No Children | 3 (100.0%) | 0 (0.0%) |
| 1 or 2 Children | 0 (0.0%) | 0 (0.0%) |
| 3 or 4 Children | 0 (0.0%) | 0 (0.0%) |
| 5 or more Children | 0 (0.0%) | 0 (0.0%) |
| Total | 3 (100.0%) | 0 (0.0%) |
Income Below Poverty Among Married-Couple vs Single-Parent Households in Big Piney
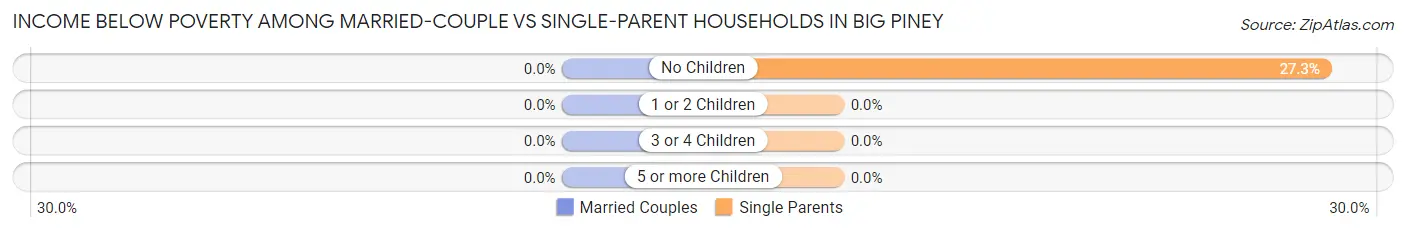
| Children | Married-Couple Families | Single-Parent Households |
| No Children | 0 (0.0%) | 3 (27.3%) |
| 1 or 2 Children | 0 (0.0%) | 0 (0.0%) |
| 3 or 4 Children | 0 (0.0%) | 0 (0.0%) |
| 5 or more Children | 0 (0.0%) | 0 (0.0%) |
| Total | 0 (0.0%) | 3 (13.0%) |
Race in Big Piney
The most populous races in Big Piney are White / Caucasian (434 | 96.4%), Hispanic or Latino (24 | 5.3%), and Two or more Races (8 | 1.8%).
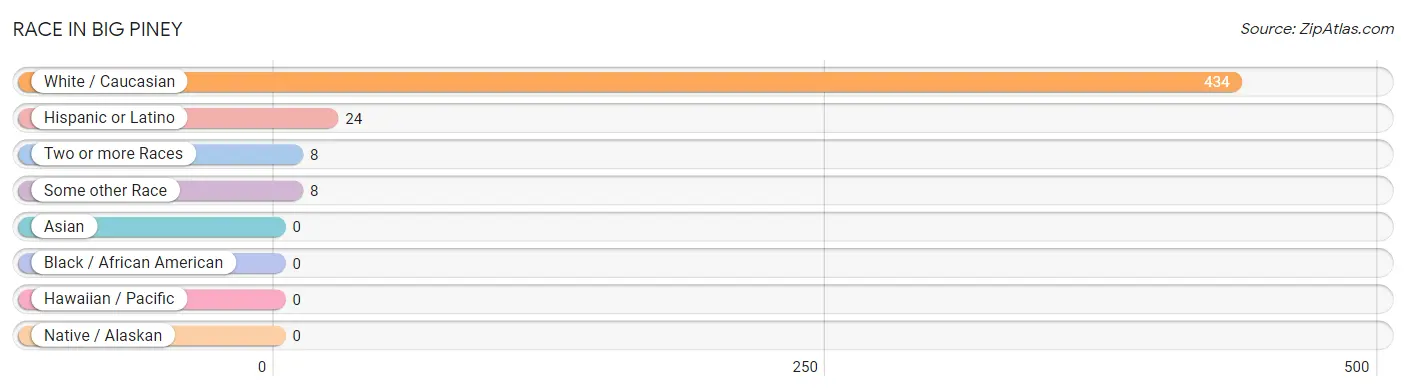
| Race | # Population | % Population |
| Asian | 0 | 0.0% |
| Black / African American | 0 | 0.0% |
| Hawaiian / Pacific | 0 | 0.0% |
| Hispanic or Latino | 24 | 5.3% |
| Native / Alaskan | 0 | 0.0% |
| White / Caucasian | 434 | 96.4% |
| Two or more Races | 8 | 1.8% |
| Some other Race | 8 | 1.8% |
| Total | 450 | 100.0% |
Ancestry in Big Piney
The most populous ancestries reported in Big Piney are English (164 | 36.4%), German (57 | 12.7%), American (47 | 10.4%), Austrian (31 | 6.9%), and European (29 | 6.4%), together accounting for 72.9% of all Big Piney residents.
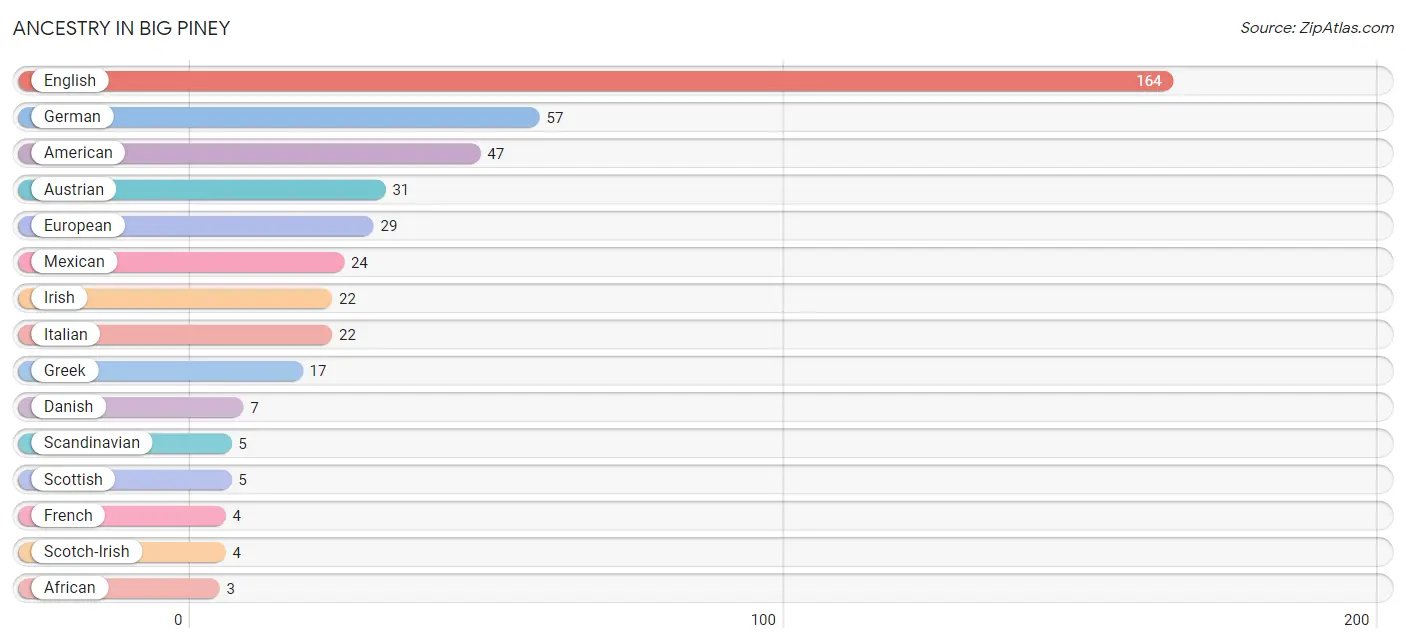
| Ancestry | # Population | % Population |
| African | 3 | 0.7% |
| American | 47 | 10.4% |
| Austrian | 31 | 6.9% |
| Blackfeet | 2 | 0.4% |
| Cherokee | 3 | 0.7% |
| Comanche | 2 | 0.4% |
| Danish | 7 | 1.6% |
| English | 164 | 36.4% |
| European | 29 | 6.4% |
| French | 4 | 0.9% |
| German | 57 | 12.7% |
| Greek | 17 | 3.8% |
| Irish | 22 | 4.9% |
| Italian | 22 | 4.9% |
| Mexican | 24 | 5.3% |
| Polish | 2 | 0.4% |
| Russian | 2 | 0.4% |
| Scandinavian | 5 | 1.1% |
| Scotch-Irish | 4 | 0.9% |
| Scottish | 5 | 1.1% |
| Subsaharan African | 3 | 0.7% |
| Swedish | 3 | 0.7% |
| Welsh | 3 | 0.7% | View All 23 Rows |
Immigrants in Big Piney
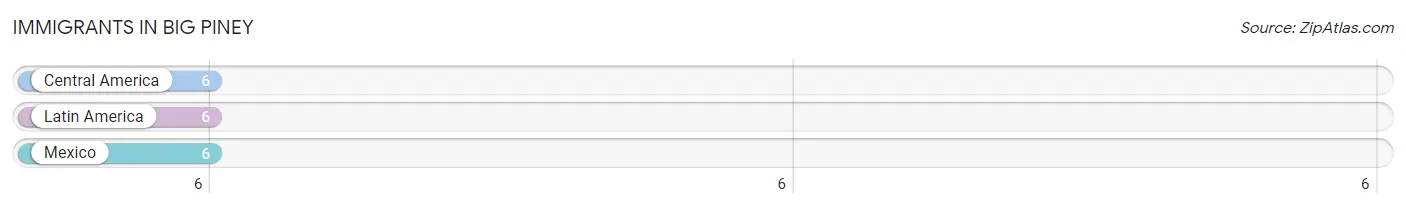
The most numerous immigrant groups reported in Big Piney came from Central America (6 | 1.3%), Latin America (6 | 1.3%), and Mexico (6 | 1.3%), together accounting for 4.0% of all Big Piney residents.
| Immigration Origin | # Population | % Population |
| Central America | 6 | 1.3% |
| Latin America | 6 | 1.3% |
| Mexico | 6 | 1.3% | View All 3 Rows |
Sex and Age in Big Piney
Sex and Age in Big Piney
The most populous age groups in Big Piney are 45 to 49 Years (45 | 18.4%) for men and 85 Years and over (33 | 16.1%) for women.
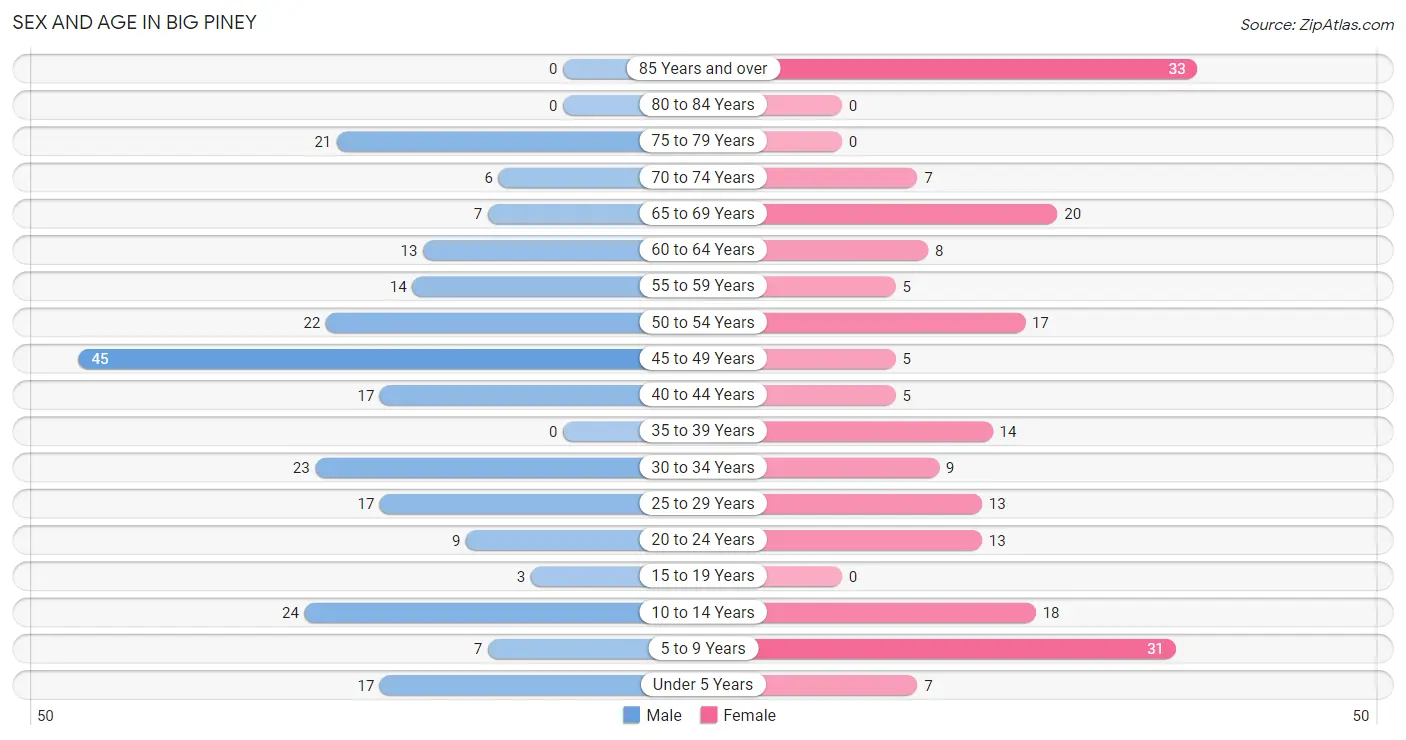
| Age Bracket | Male | Female |
| Under 5 Years | 17 (6.9%) | 7 (3.4%) |
| 5 to 9 Years | 7 (2.9%) | 31 (15.1%) |
| 10 to 14 Years | 24 (9.8%) | 18 (8.8%) |
| 15 to 19 Years | 3 (1.2%) | 0 (0.0%) |
| 20 to 24 Years | 9 (3.7%) | 13 (6.3%) |
| 25 to 29 Years | 17 (6.9%) | 13 (6.3%) |
| 30 to 34 Years | 23 (9.4%) | 9 (4.4%) |
| 35 to 39 Years | 0 (0.0%) | 14 (6.8%) |
| 40 to 44 Years | 17 (6.9%) | 5 (2.4%) |
| 45 to 49 Years | 45 (18.4%) | 5 (2.4%) |
| 50 to 54 Years | 22 (9.0%) | 17 (8.3%) |
| 55 to 59 Years | 14 (5.7%) | 5 (2.4%) |
| 60 to 64 Years | 13 (5.3%) | 8 (3.9%) |
| 65 to 69 Years | 7 (2.9%) | 20 (9.8%) |
| 70 to 74 Years | 6 (2.5%) | 7 (3.4%) |
| 75 to 79 Years | 21 (8.6%) | 0 (0.0%) |
| 80 to 84 Years | 0 (0.0%) | 0 (0.0%) |
| 85 Years and over | 0 (0.0%) | 33 (16.1%) |
| Total | 245 (100.0%) | 205 (100.0%) |
Families and Households in Big Piney
Median Family Size in Big Piney
The median family size in Big Piney is 4.49 persons per family, with single female/mother families (20 | 28.6%) accounting for the largest median family size of 5.5 persons per family. On the other hand, single male/father families (3 | 4.3%) represent the smallest median family size with 4.00 persons per family.
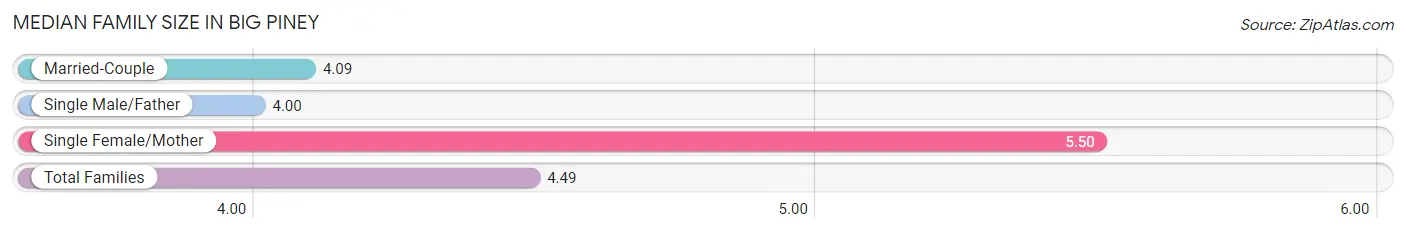
| Family Type | # Families | Family Size |
| Married-Couple | 47 (67.1%) | 4.09 |
| Single Male/Father | 3 (4.3%) | 4.00 |
| Single Female/Mother | 20 (28.6%) | 5.50 |
| Total Families | 70 (100.0%) | 4.49 |
Median Household Size in Big Piney
The median household size in Big Piney is 2.76 persons per household, with single female/mother households (20 | 12.3%) accounting for the largest median household size of 6.2 persons per household. non-family households (93 | 57.1%) represent the smallest median household size with 1.31 persons per household.
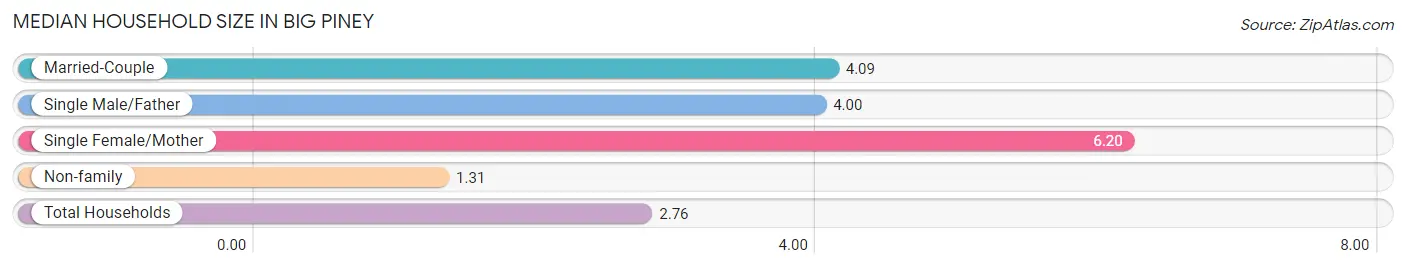
| Household Type | # Households | Household Size |
| Married-Couple | 47 (28.8%) | 4.09 |
| Single Male/Father | 3 (1.8%) | 4.00 |
| Single Female/Mother | 20 (12.3%) | 6.20 |
| Non-family | 93 (57.1%) | 1.31 |
| Total Households | 163 (100.0%) | 2.76 |
Household Size by Marriage Status in Big Piney
Out of a total of 163 households in Big Piney, 70 (42.9%) are family households, while 93 (57.1%) are nonfamily households. The most numerous type of family households are 3-person households, comprising 25, and the most common type of nonfamily households are 1-person households, comprising 81.
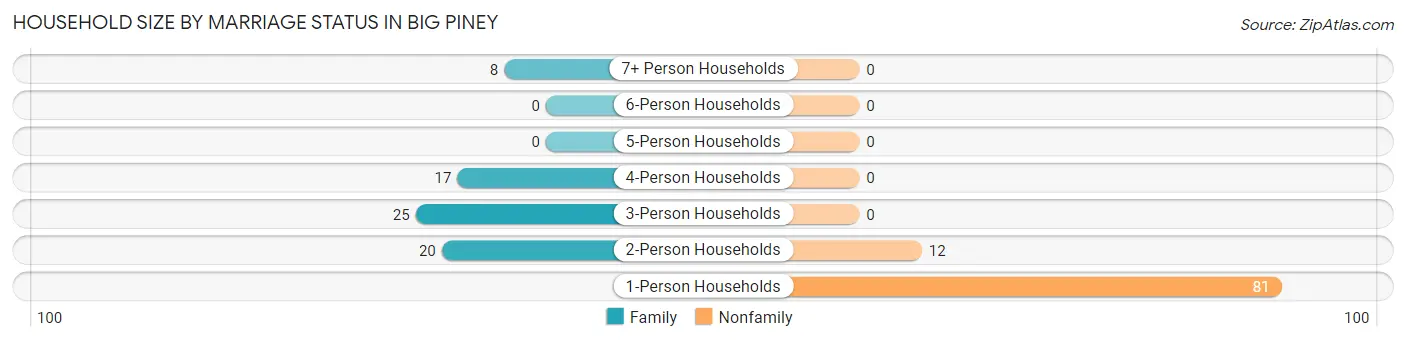
| Household Size | Family Households | Nonfamily Households |
| 1-Person Households | - | 81 (49.7%) |
| 2-Person Households | 20 (12.3%) | 12 (7.4%) |
| 3-Person Households | 25 (15.3%) | 0 (0.0%) |
| 4-Person Households | 17 (10.4%) | 0 (0.0%) |
| 5-Person Households | 0 (0.0%) | 0 (0.0%) |
| 6-Person Households | 0 (0.0%) | 0 (0.0%) |
| 7+ Person Households | 8 (4.9%) | 0 (0.0%) |
| Total | 70 (42.9%) | 93 (57.1%) |
Female Fertility in Big Piney
Fertility by Age in Big Piney
| Age Bracket | Women with Births | Births / 1,000 Women |
| 15 to 19 years | 0 (0.0%) | 0.0 |
| 20 to 34 years | 0 (0.0%) | 0.0 |
| 35 to 50 years | 0 (0.0%) | 0.0 |
| Total | 0 (0.0%) | 0.0 |
Fertility by Age by Marriage Status in Big Piney
| Age Bracket | Married | Unmarried |
| 15 to 19 years | 0 (0.0%) | 0 (0.0%) |
| 20 to 34 years | 0 (0.0%) | 0 (0.0%) |
| 35 to 50 years | 0 (0.0%) | 0 (0.0%) |
| Total | 0 (0.0%) | 0 (0.0%) |
Fertility by Education in Big Piney
| Educational Attainment | Women with Births | Births / 1,000 Women |
| Less than High School | 0 (0.0%) | 0.0 |
| High School Diploma | 0 (0.0%) | 0.0 |
| College or Associate's Degree | 0 (0.0%) | 0.0 |
| Bachelor's Degree | 0 (0.0%) | 0.0 |
| Graduate Degree | 0 (0.0%) | 0.0 |
| Total | 0 (0.0%) | 0.0 |
Fertility by Education by Marriage Status in Big Piney
| Educational Attainment | Married | Unmarried |
| Less than High School | 0 (0.0%) | 0 (0.0%) |
| High School Diploma | 0 (0.0%) | 0 (0.0%) |
| College or Associate's Degree | 0 (0.0%) | 0 (0.0%) |
| Bachelor's Degree | 0 (0.0%) | 0 (0.0%) |
| Graduate Degree | 0 (0.0%) | 0 (0.0%) |
| Total | 0 (0.0%) | 0 (0.0%) |
Employment Characteristics in Big Piney
Employment by Class of Employer in Big Piney
Among the 199 employed individuals in Big Piney, private company employees (124 | 62.3%), local government employees (46 | 23.1%), and state government employees (8 | 4.0%) make up the most common classes of employment.
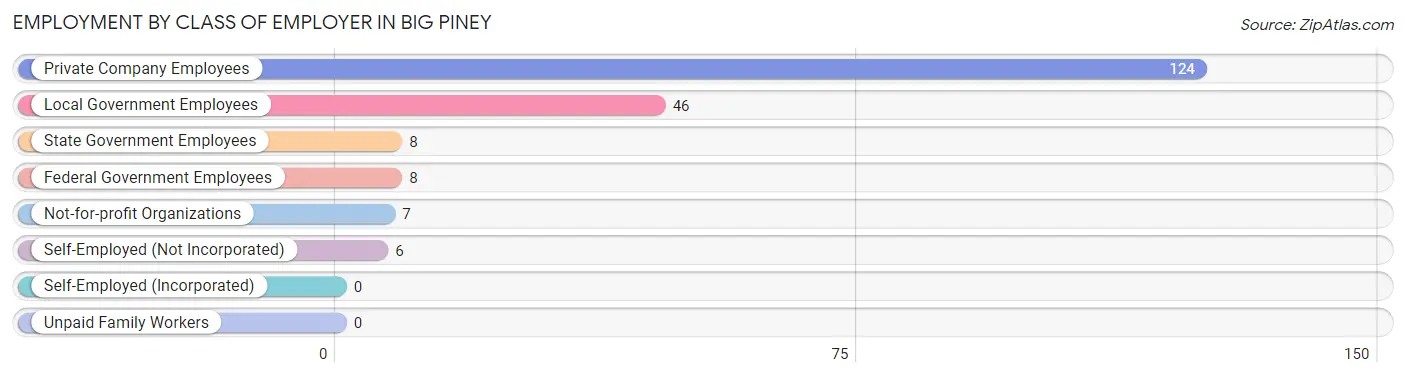
| Employer Class | # Employees | % Employees |
| Private Company Employees | 124 | 62.3% |
| Self-Employed (Incorporated) | 0 | 0.0% |
| Self-Employed (Not Incorporated) | 6 | 3.0% |
| Not-for-profit Organizations | 7 | 3.5% |
| Local Government Employees | 46 | 23.1% |
| State Government Employees | 8 | 4.0% |
| Federal Government Employees | 8 | 4.0% |
| Unpaid Family Workers | 0 | 0.0% |
| Total | 199 | 100.0% |
Employment Status by Age in Big Piney
According to the labor force statistics for Big Piney, out of the total population over 16 years of age (343), 65.0% or 223 individuals are in the labor force, with 7.6% or 17 of them unemployed. The age group with the highest labor force participation rate is 25 to 29 years, with 100.0% or 30 individuals in the labor force. Within the labor force, the 45 to 54 years age range has the highest percentage of unemployed individuals, with 15.7% or 14 of them being unemployed.
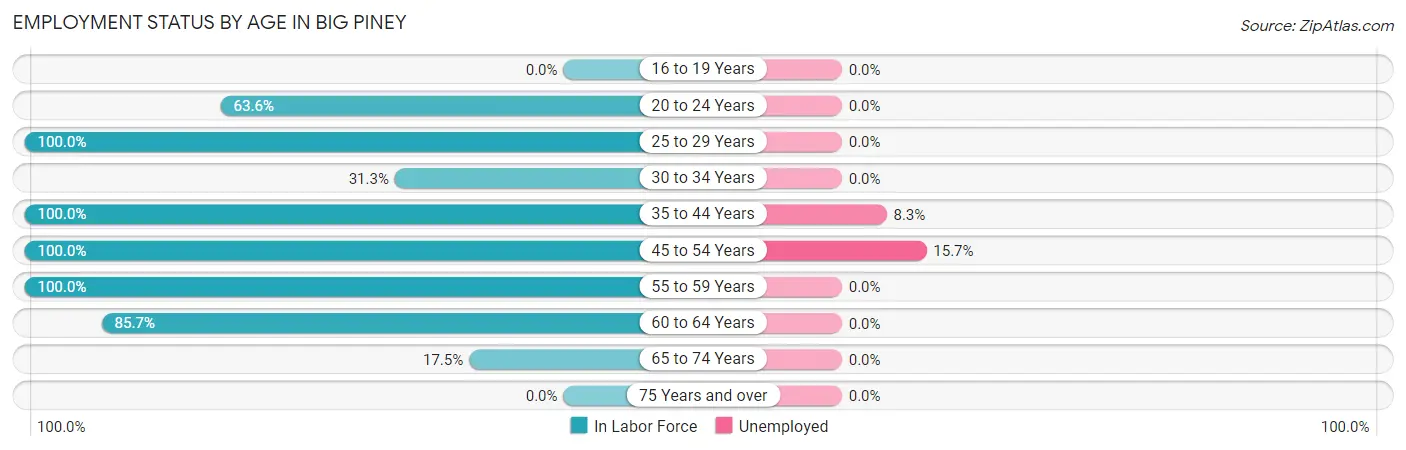
| Age Bracket | In Labor Force | Unemployed |
| 16 to 19 Years | 0 (0.0%) | 0 (0.0%) |
| 20 to 24 Years | 14 (63.6%) | 0 (0.0%) |
| 25 to 29 Years | 30 (100.0%) | 0 (0.0%) |
| 30 to 34 Years | 10 (31.3%) | 0 (0.0%) |
| 35 to 44 Years | 36 (100.0%) | 3 (8.3%) |
| 45 to 54 Years | 89 (100.0%) | 14 (15.7%) |
| 55 to 59 Years | 19 (100.0%) | 0 (0.0%) |
| 60 to 64 Years | 18 (85.7%) | 0 (0.0%) |
| 65 to 74 Years | 7 (17.5%) | 0 (0.0%) |
| 75 Years and over | 0 (0.0%) | 0 (0.0%) |
| Total | 223 (65.0%) | 17 (7.6%) |
Employment Status by Educational Attainment in Big Piney
According to labor force statistics for Big Piney, 89.0% of individuals (202) out of the total population between 25 and 64 years of age (227) are in the labor force, with 8.4% or 17 of them being unemployed. The group with the highest labor force participation rate are those with the educational attainment of less than high school, with 100.0% or 14 individuals in the labor force. Within the labor force, individuals with less than high school education have the highest percentage of unemployment, with 100.0% or 14 of them being unemployed.
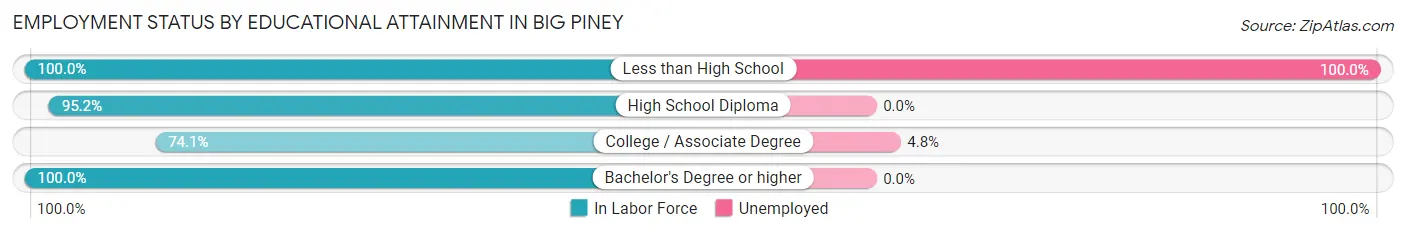
| Educational Attainment | In Labor Force | Unemployed |
| Less than High School | 14 (100.0%) | 14 (100.0%) |
| High School Diploma | 60 (95.2%) | 0 (0.0%) |
| College / Associate Degree | 63 (74.1%) | 4 (4.8%) |
| Bachelor's Degree or higher | 65 (100.0%) | 0 (0.0%) |
| Total | 202 (89.0%) | 19 (8.4%) |
Employment Occupations by Sex in Big Piney
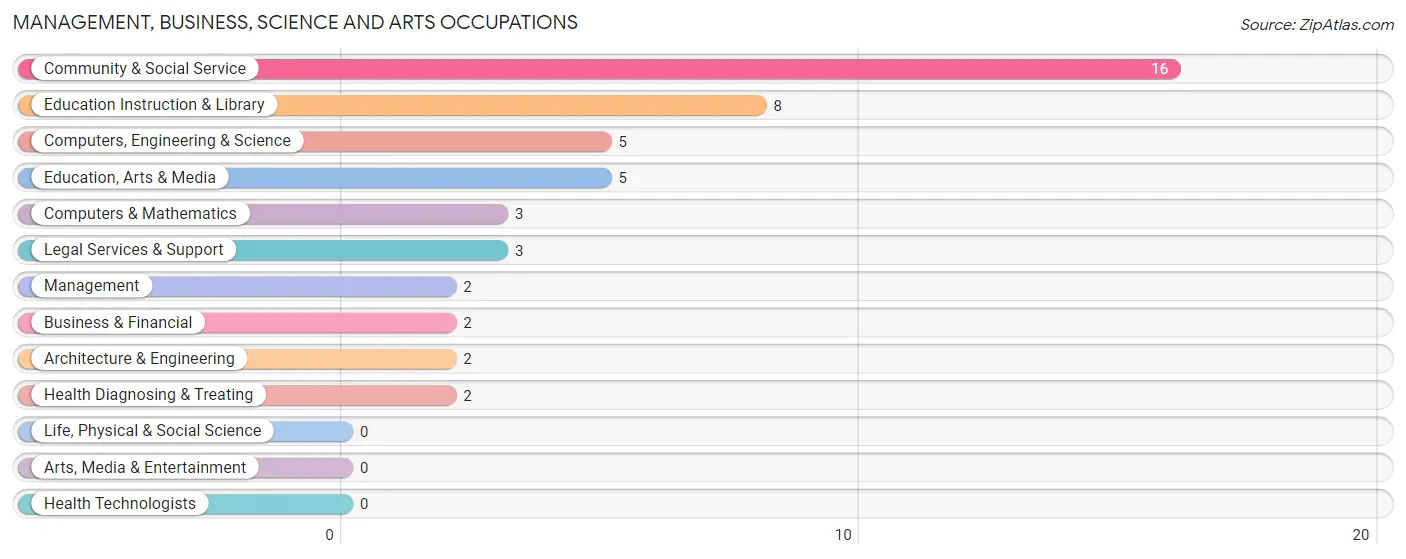
Management, Business, Science and Arts Occupations
The most common Management, Business, Science and Arts occupations in Big Piney are Community & Social Service (16 | 7.8%), Education Instruction & Library (8 | 3.9%), Computers, Engineering & Science (5 | 2.4%), Education, Arts & Media (5 | 2.4%), and Computers & Mathematics (3 | 1.5%).
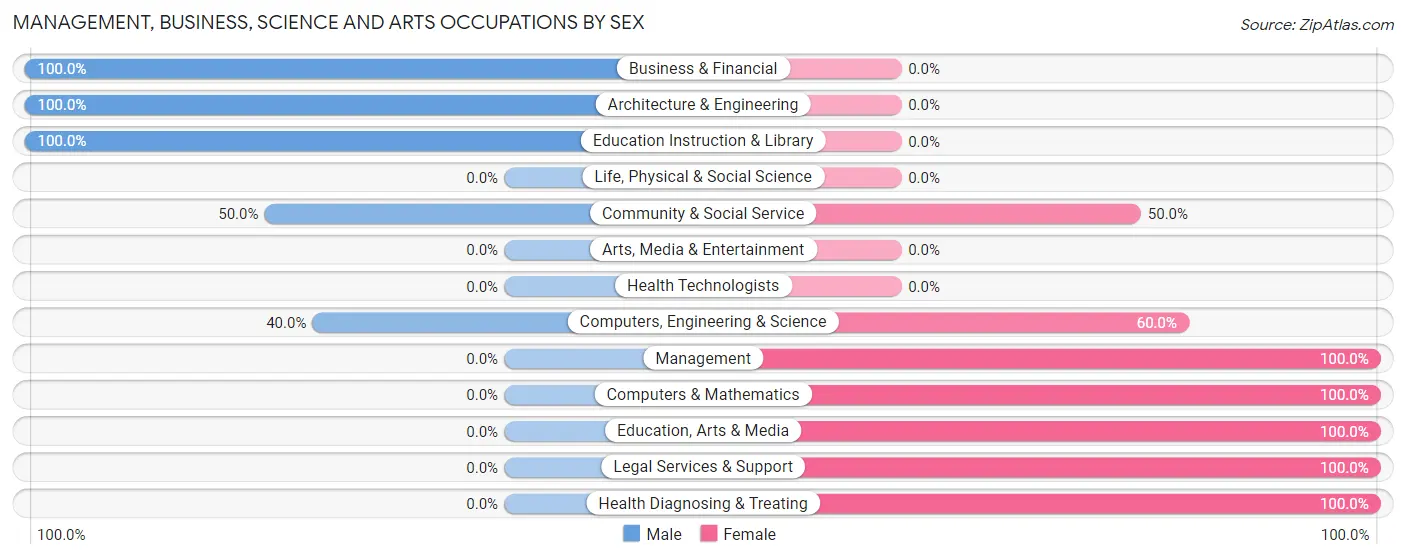
Management, Business, Science and Arts Occupations by Sex
Within the Management, Business, Science and Arts occupations in Big Piney, the most male-oriented occupations are Business & Financial (100.0%), Architecture & Engineering (100.0%), and Education Instruction & Library (100.0%), while the most female-oriented occupations are Management (100.0%), Computers & Mathematics (100.0%), and Education, Arts & Media (100.0%).
| Occupation | Male | Female |
| Management | 0 (0.0%) | 2 (100.0%) |
| Business & Financial | 2 (100.0%) | 0 (0.0%) |
| Computers, Engineering & Science | 2 (40.0%) | 3 (60.0%) |
| Computers & Mathematics | 0 (0.0%) | 3 (100.0%) |
| Architecture & Engineering | 2 (100.0%) | 0 (0.0%) |
| Life, Physical & Social Science | 0 (0.0%) | 0 (0.0%) |
| Community & Social Service | 8 (50.0%) | 8 (50.0%) |
| Education, Arts & Media | 0 (0.0%) | 5 (100.0%) |
| Legal Services & Support | 0 (0.0%) | 3 (100.0%) |
| Education Instruction & Library | 8 (100.0%) | 0 (0.0%) |
| Arts, Media & Entertainment | 0 (0.0%) | 0 (0.0%) |
| Health Diagnosing & Treating | 0 (0.0%) | 2 (100.0%) |
| Health Technologists | 0 (0.0%) | 0 (0.0%) |
| Total (Category) | 12 (44.4%) | 15 (55.6%) |
| Total (Overall) | 122 (59.2%) | 84 (40.8%) |
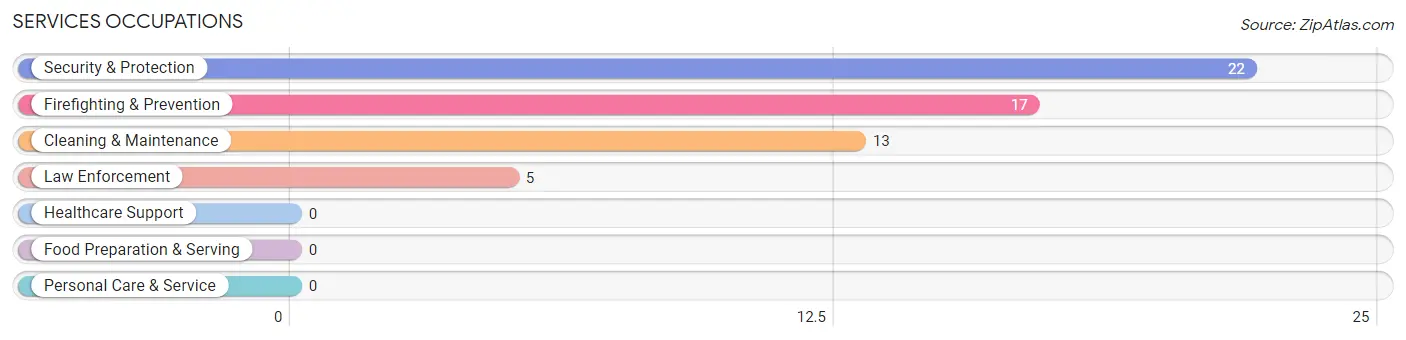
Services Occupations
The most common Services occupations in Big Piney are Security & Protection (22 | 10.7%), Firefighting & Prevention (17 | 8.3%), Cleaning & Maintenance (13 | 6.3%), and Law Enforcement (5 | 2.4%).
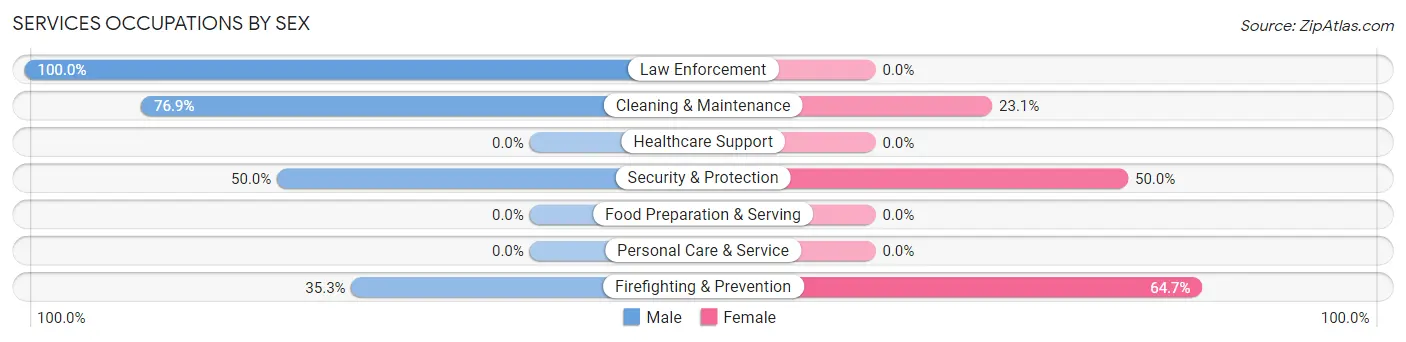
Services Occupations by Sex
Within the Services occupations in Big Piney, the most male-oriented occupations are Law Enforcement (100.0%), Cleaning & Maintenance (76.9%), and Security & Protection (50.0%), while the most female-oriented occupations are Firefighting & Prevention (64.7%), Security & Protection (50.0%), and Cleaning & Maintenance (23.1%).
| Occupation | Male | Female |
| Healthcare Support | 0 (0.0%) | 0 (0.0%) |
| Security & Protection | 11 (50.0%) | 11 (50.0%) |
| Firefighting & Prevention | 6 (35.3%) | 11 (64.7%) |
| Law Enforcement | 5 (100.0%) | 0 (0.0%) |
| Food Preparation & Serving | 0 (0.0%) | 0 (0.0%) |
| Cleaning & Maintenance | 10 (76.9%) | 3 (23.1%) |
| Personal Care & Service | 0 (0.0%) | 0 (0.0%) |
| Total (Category) | 21 (60.0%) | 14 (40.0%) |
| Total (Overall) | 122 (59.2%) | 84 (40.8%) |
Sales and Office Occupations
The most common Sales and Office occupations in Big Piney are Sales & Related (45 | 21.8%), and Office & Administration (29 | 14.1%).
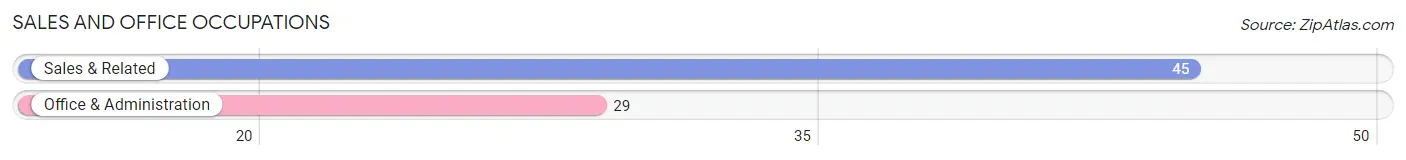
Sales and Office Occupations by Sex
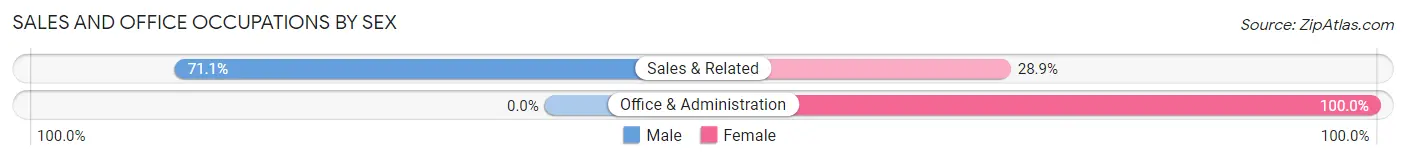
| Occupation | Male | Female |
| Sales & Related | 32 (71.1%) | 13 (28.9%) |
| Office & Administration | 0 (0.0%) | 29 (100.0%) |
| Total (Category) | 32 (43.2%) | 42 (56.8%) |
| Total (Overall) | 122 (59.2%) | 84 (40.8%) |
Natural Resources, Construction and Maintenance Occupations
The most common Natural Resources, Construction and Maintenance occupations in Big Piney are Installation, Maintenance & Repair (12 | 5.8%), Construction & Extraction (11 | 5.3%), and Farming, Fishing & Forestry (4 | 1.9%).
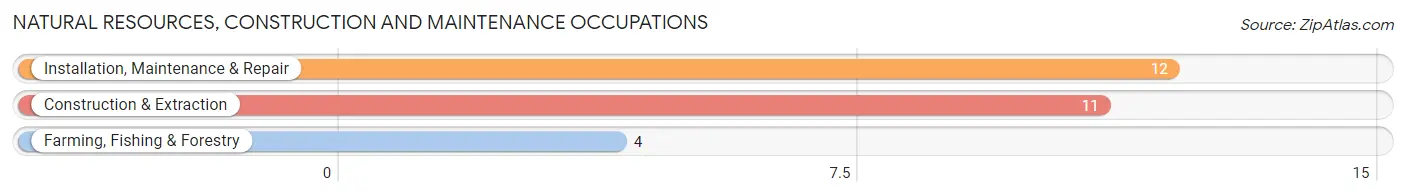
Natural Resources, Construction and Maintenance Occupations by Sex
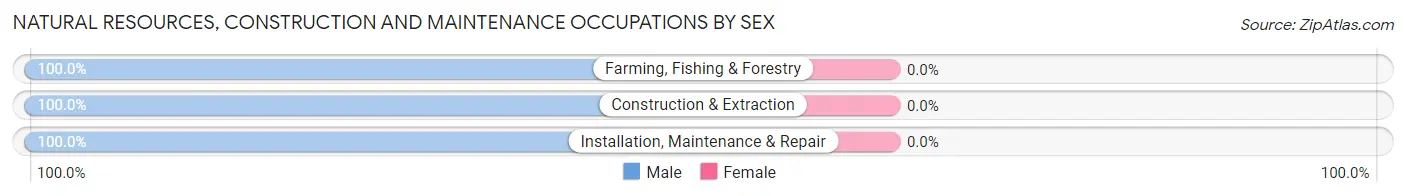
| Occupation | Male | Female |
| Farming, Fishing & Forestry | 4 (100.0%) | 0 (0.0%) |
| Construction & Extraction | 11 (100.0%) | 0 (0.0%) |
| Installation, Maintenance & Repair | 12 (100.0%) | 0 (0.0%) |
| Total (Category) | 27 (100.0%) | 0 (0.0%) |
| Total (Overall) | 122 (59.2%) | 84 (40.8%) |
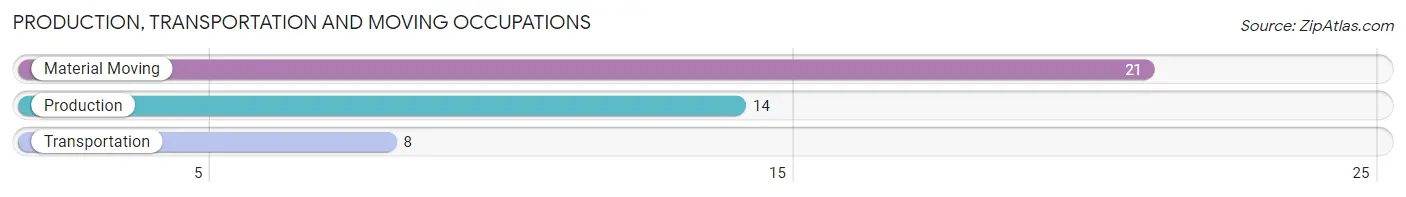
Production, Transportation and Moving Occupations
The most common Production, Transportation and Moving occupations in Big Piney are Material Moving (21 | 10.2%), Production (14 | 6.8%), and Transportation (8 | 3.9%).
Production, Transportation and Moving Occupations by Sex
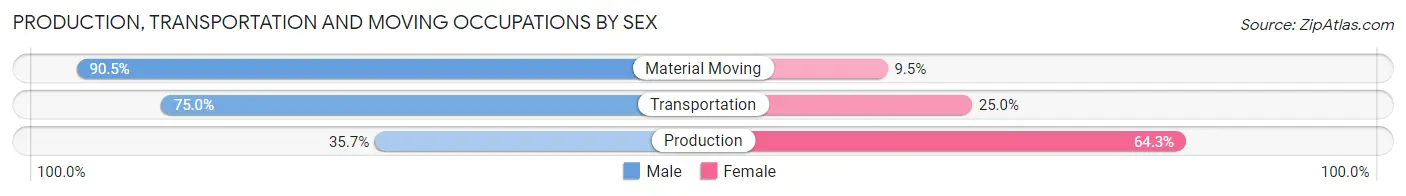
| Occupation | Male | Female |
| Production | 5 (35.7%) | 9 (64.3%) |
| Transportation | 6 (75.0%) | 2 (25.0%) |
| Material Moving | 19 (90.5%) | 2 (9.5%) |
| Total (Category) | 30 (69.8%) | 13 (30.2%) |
| Total (Overall) | 122 (59.2%) | 84 (40.8%) |
Employment Industries by Sex in Big Piney
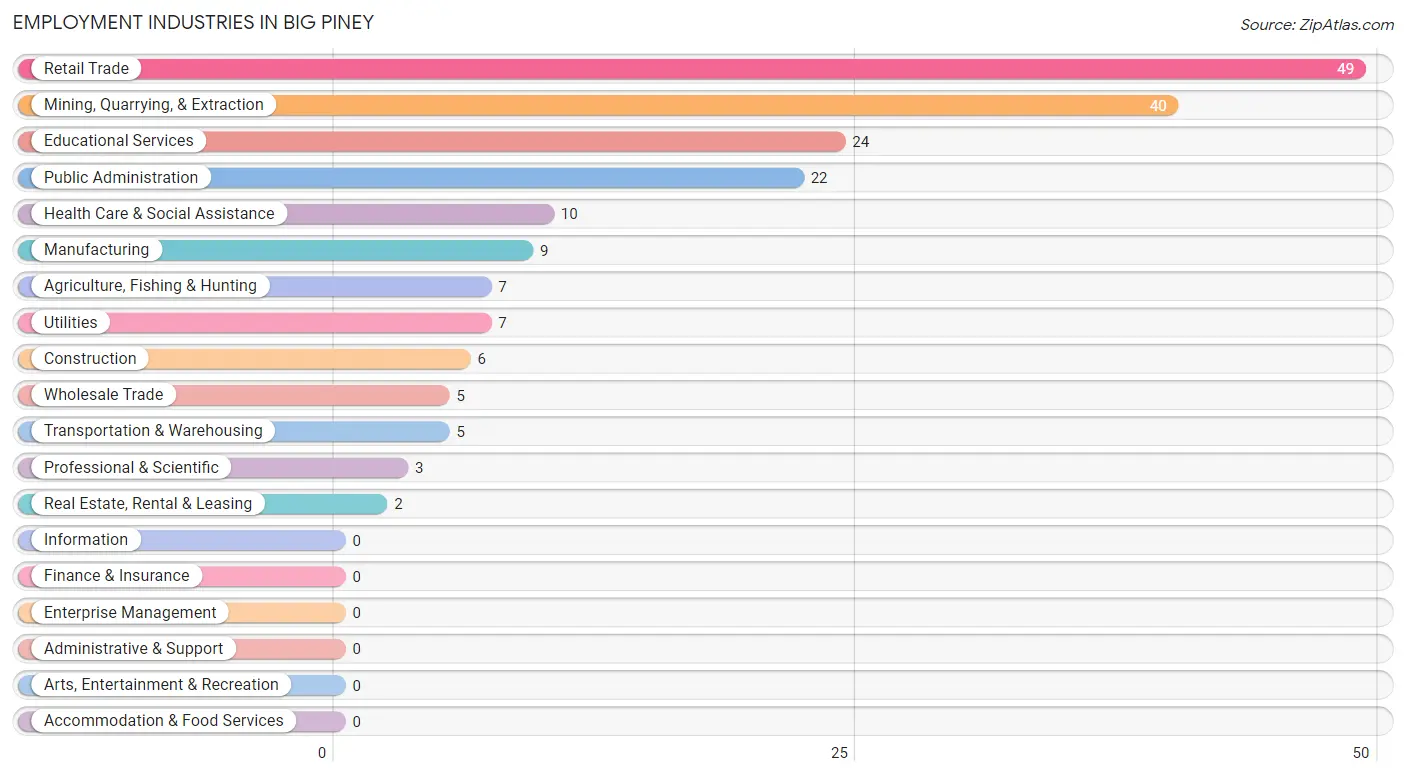
Employment Industries in Big Piney
The major employment industries in Big Piney include Retail Trade (49 | 23.8%), Mining, Quarrying, & Extraction (40 | 19.4%), Educational Services (24 | 11.7%), Public Administration (22 | 10.7%), and Health Care & Social Assistance (10 | 4.9%).
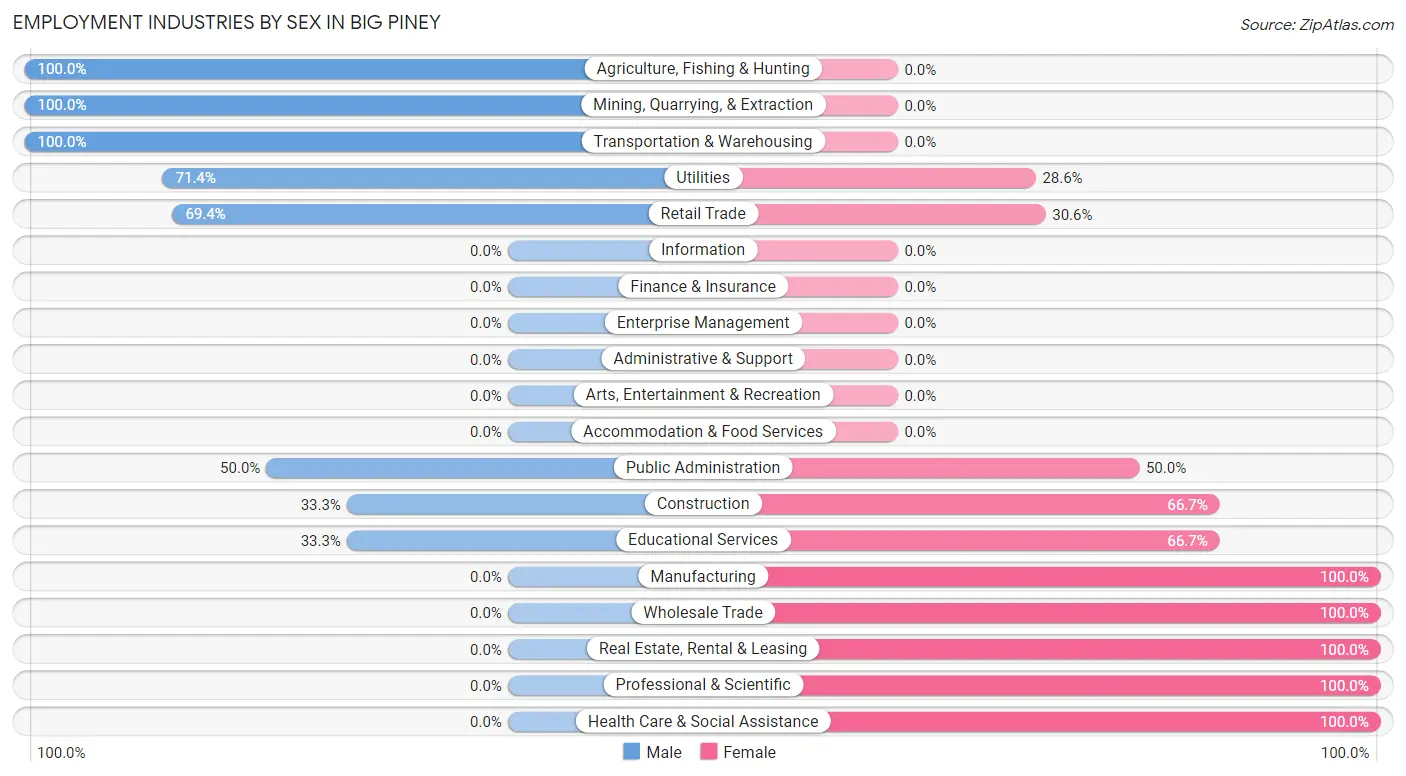
Employment Industries by Sex in Big Piney
The Big Piney industries that see more men than women are Agriculture, Fishing & Hunting (100.0%), Mining, Quarrying, & Extraction (100.0%), and Transportation & Warehousing (100.0%), whereas the industries that tend to have a higher number of women are Manufacturing (100.0%), Wholesale Trade (100.0%), and Real Estate, Rental & Leasing (100.0%).
| Industry | Male | Female |
| Agriculture, Fishing & Hunting | 7 (100.0%) | 0 (0.0%) |
| Mining, Quarrying, & Extraction | 40 (100.0%) | 0 (0.0%) |
| Construction | 2 (33.3%) | 4 (66.7%) |
| Manufacturing | 0 (0.0%) | 9 (100.0%) |
| Wholesale Trade | 0 (0.0%) | 5 (100.0%) |
| Retail Trade | 34 (69.4%) | 15 (30.6%) |
| Transportation & Warehousing | 5 (100.0%) | 0 (0.0%) |
| Utilities | 5 (71.4%) | 2 (28.6%) |
| Information | 0 (0.0%) | 0 (0.0%) |
| Finance & Insurance | 0 (0.0%) | 0 (0.0%) |
| Real Estate, Rental & Leasing | 0 (0.0%) | 2 (100.0%) |
| Professional & Scientific | 0 (0.0%) | 3 (100.0%) |
| Enterprise Management | 0 (0.0%) | 0 (0.0%) |
| Administrative & Support | 0 (0.0%) | 0 (0.0%) |
| Educational Services | 8 (33.3%) | 16 (66.7%) |
| Health Care & Social Assistance | 0 (0.0%) | 10 (100.0%) |
| Arts, Entertainment & Recreation | 0 (0.0%) | 0 (0.0%) |
| Accommodation & Food Services | 0 (0.0%) | 0 (0.0%) |
| Public Administration | 11 (50.0%) | 11 (50.0%) |
| Total | 122 (59.2%) | 84 (40.8%) |
Education in Big Piney
School Enrollment in Big Piney
The most common levels of schooling among the 101 students in Big Piney are middle school (28 | 27.7%), elementary school (27 | 26.7%), and college / undergraduate (26 | 25.7%).
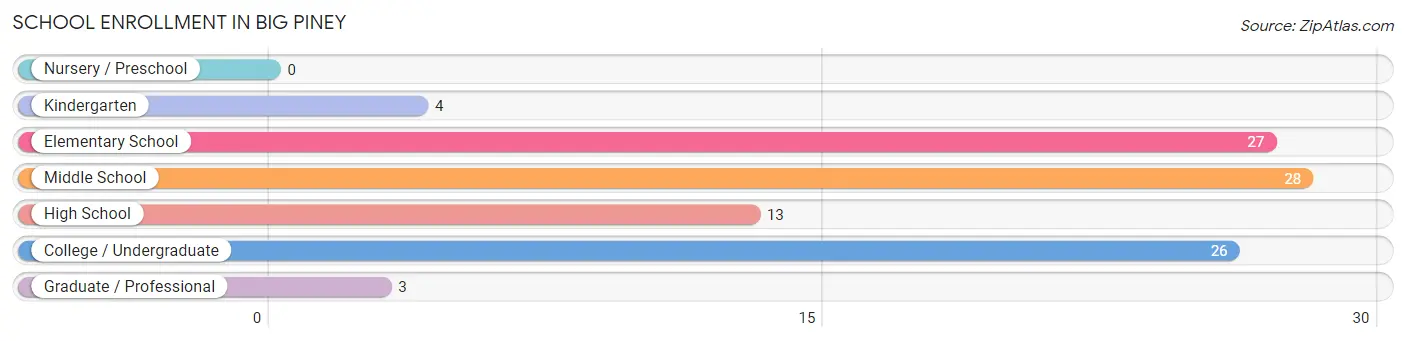
| School Level | # Students | % Students |
| Nursery / Preschool | 0 | 0.0% |
| Kindergarten | 4 | 4.0% |
| Elementary School | 27 | 26.7% |
| Middle School | 28 | 27.7% |
| High School | 13 | 12.9% |
| College / Undergraduate | 26 | 25.7% |
| Graduate / Professional | 3 | 3.0% |
| Total | 101 | 100.0% |
School Enrollment by Age by Funding Source in Big Piney
Out of a total of 101 students who are enrolled in schools in Big Piney, 41 (40.6%) attend a private institution, while the remaining 60 (59.4%) are enrolled in public schools. The age group of 10 to 14 year olds has the highest likelihood of being enrolled in private schools, with 26 (61.9% in the age bracket) enrolled. Conversely, the age group of 15 to 17 year olds has the lowest likelihood of being enrolled in a private school, with 3 (100.0% in the age bracket) attending a public institution.
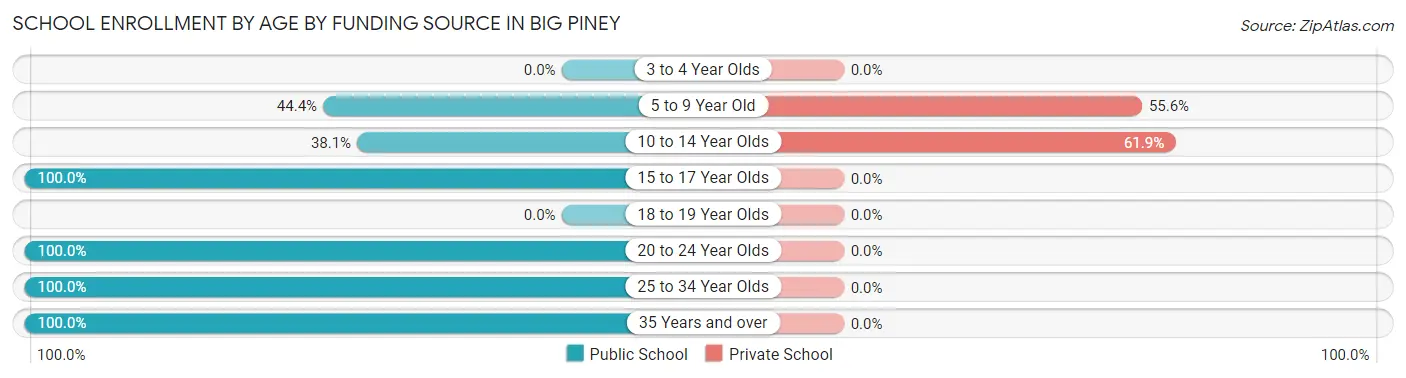
| Age Bracket | Public School | Private School |
| 3 to 4 Year Olds | 0 (0.0%) | 0 (0.0%) |
| 5 to 9 Year Old | 12 (44.4%) | 15 (55.6%) |
| 10 to 14 Year Olds | 16 (38.1%) | 26 (61.9%) |
| 15 to 17 Year Olds | 3 (100.0%) | 0 (0.0%) |
| 18 to 19 Year Olds | 0 (0.0%) | 0 (0.0%) |
| 20 to 24 Year Olds | 8 (100.0%) | 0 (0.0%) |
| 25 to 34 Year Olds | 18 (100.0%) | 0 (0.0%) |
| 35 Years and over | 3 (100.0%) | 0 (0.0%) |
| Total | 60 (59.4%) | 41 (40.6%) |
Educational Attainment by Field of Study in Big Piney
Arts & humanities (38 | 31.1%), education (25 | 20.5%), psychology (14 | 11.5%), computers & mathematics (13 | 10.7%), and science & technology (11 | 9.0%) are the most common fields of study among 122 individuals in Big Piney who have obtained a bachelor's degree or higher.
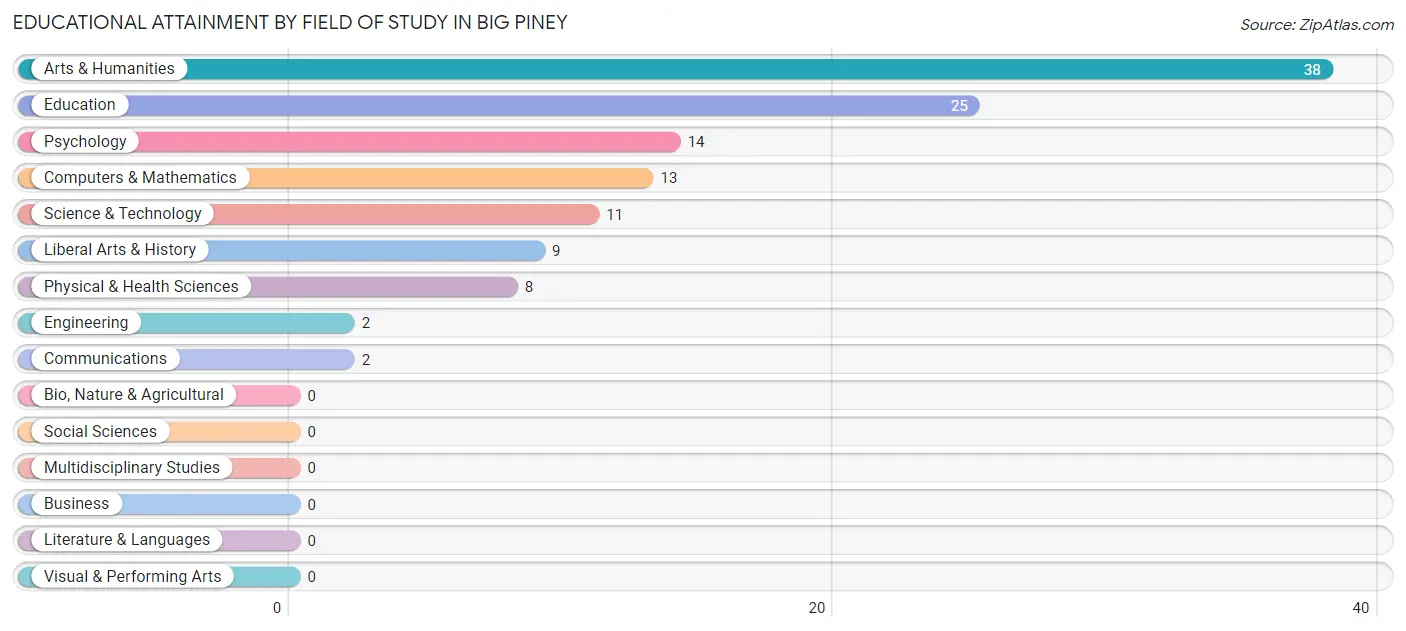
| Field of Study | # Graduates | % Graduates |
| Computers & Mathematics | 13 | 10.7% |
| Bio, Nature & Agricultural | 0 | 0.0% |
| Physical & Health Sciences | 8 | 6.6% |
| Psychology | 14 | 11.5% |
| Social Sciences | 0 | 0.0% |
| Engineering | 2 | 1.6% |
| Multidisciplinary Studies | 0 | 0.0% |
| Science & Technology | 11 | 9.0% |
| Business | 0 | 0.0% |
| Education | 25 | 20.5% |
| Literature & Languages | 0 | 0.0% |
| Liberal Arts & History | 9 | 7.4% |
| Visual & Performing Arts | 0 | 0.0% |
| Communications | 2 | 1.6% |
| Arts & Humanities | 38 | 31.1% |
| Total | 122 | 100.0% |
Transportation & Commute in Big Piney
Vehicle Availability by Sex in Big Piney
The most prevalent vehicle ownership categories in Big Piney are males with 2 vehicles (45, accounting for 39.1%) and females with 2 vehicles (11, making up 53.6%).
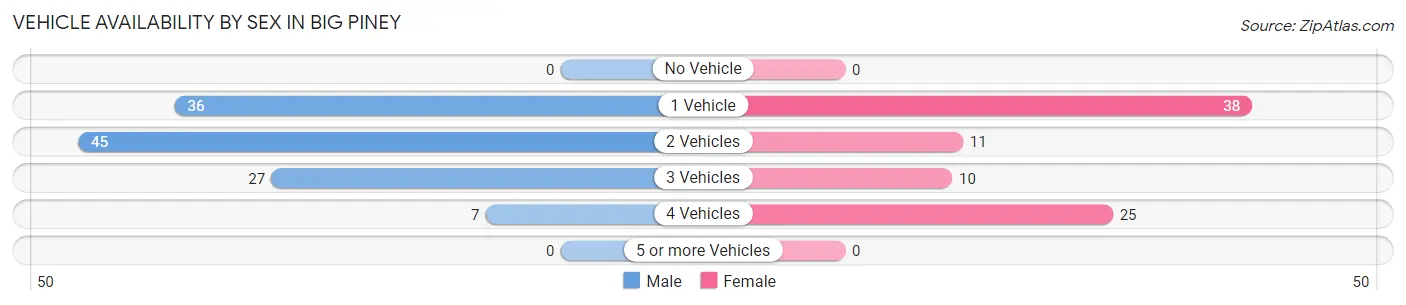
| Vehicles Available | Male | Female |
| No Vehicle | 0 (0.0%) | 0 (0.0%) |
| 1 Vehicle | 36 (31.3%) | 38 (45.2%) |
| 2 Vehicles | 45 (39.1%) | 11 (13.1%) |
| 3 Vehicles | 27 (23.5%) | 10 (11.9%) |
| 4 Vehicles | 7 (6.1%) | 25 (29.8%) |
| 5 or more Vehicles | 0 (0.0%) | 0 (0.0%) |
| Total | 115 (100.0%) | 84 (100.0%) |
Commute Time in Big Piney
The most frequently occuring commute durations in Big Piney are less than 5 minutes (59 commuters, 30.4%), 45 to 59 minutes (37 commuters, 19.1%), and 25 to 29 minutes (28 commuters, 14.4%).
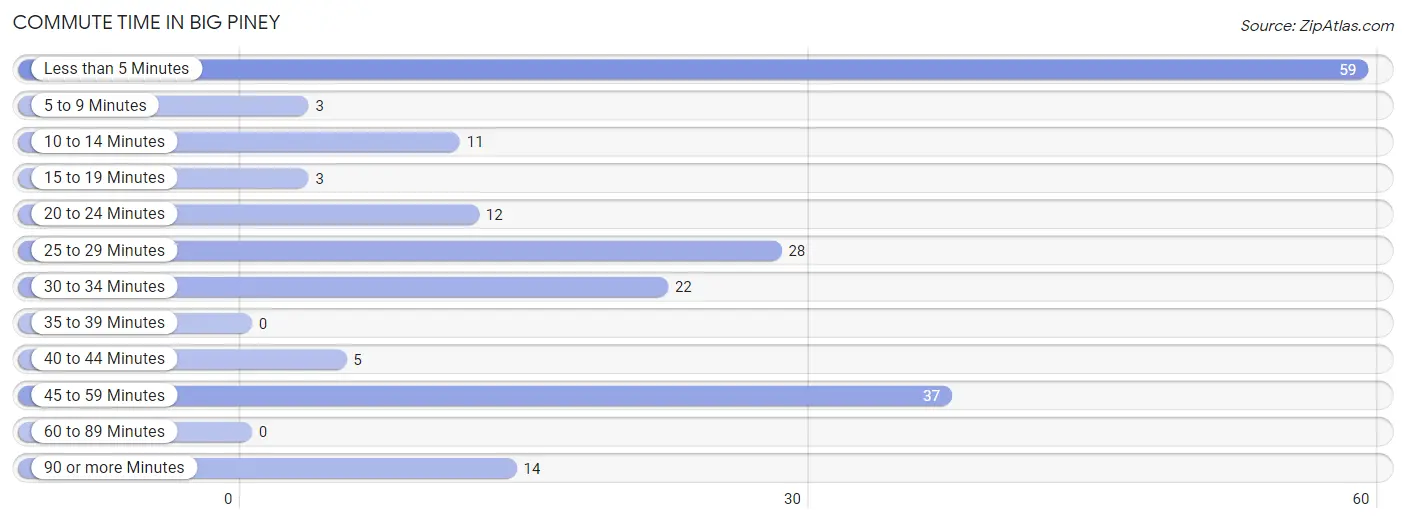
| Commute Time | # Commuters | % Commuters |
| Less than 5 Minutes | 59 | 30.4% |
| 5 to 9 Minutes | 3 | 1.5% |
| 10 to 14 Minutes | 11 | 5.7% |
| 15 to 19 Minutes | 3 | 1.5% |
| 20 to 24 Minutes | 12 | 6.2% |
| 25 to 29 Minutes | 28 | 14.4% |
| 30 to 34 Minutes | 22 | 11.3% |
| 35 to 39 Minutes | 0 | 0.0% |
| 40 to 44 Minutes | 5 | 2.6% |
| 45 to 59 Minutes | 37 | 19.1% |
| 60 to 89 Minutes | 0 | 0.0% |
| 90 or more Minutes | 14 | 7.2% |
Commute Time by Sex in Big Piney
The most common commute times in Big Piney are less than 5 minutes (35 commuters, 31.8%) for males and less than 5 minutes (24 commuters, 28.6%) for females.
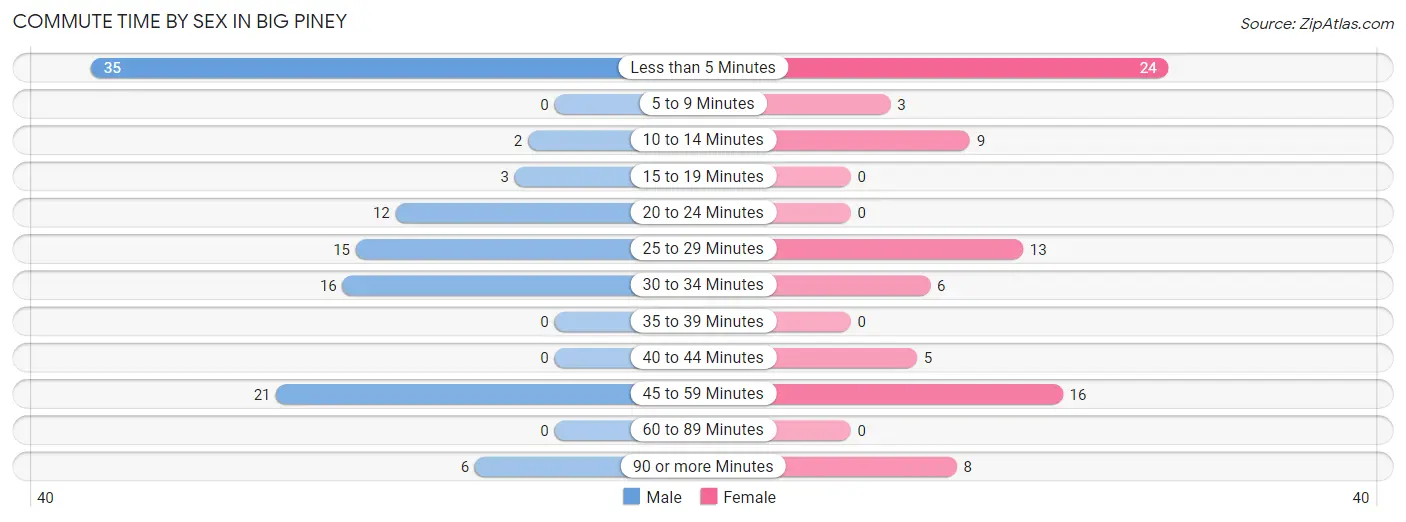
| Commute Time | Male | Female |
| Less than 5 Minutes | 35 (31.8%) | 24 (28.6%) |
| 5 to 9 Minutes | 0 (0.0%) | 3 (3.6%) |
| 10 to 14 Minutes | 2 (1.8%) | 9 (10.7%) |
| 15 to 19 Minutes | 3 (2.7%) | 0 (0.0%) |
| 20 to 24 Minutes | 12 (10.9%) | 0 (0.0%) |
| 25 to 29 Minutes | 15 (13.6%) | 13 (15.5%) |
| 30 to 34 Minutes | 16 (14.5%) | 6 (7.1%) |
| 35 to 39 Minutes | 0 (0.0%) | 0 (0.0%) |
| 40 to 44 Minutes | 0 (0.0%) | 5 (5.9%) |
| 45 to 59 Minutes | 21 (19.1%) | 16 (19.1%) |
| 60 to 89 Minutes | 0 (0.0%) | 0 (0.0%) |
| 90 or more Minutes | 6 (5.4%) | 8 (9.5%) |
Time of Departure to Work by Sex in Big Piney
The most frequent times of departure to work in Big Piney are 12:00 PM to 3:59 PM (31, 28.2%) for males and 7:30 AM to 7:59 AM (20, 23.8%) for females.
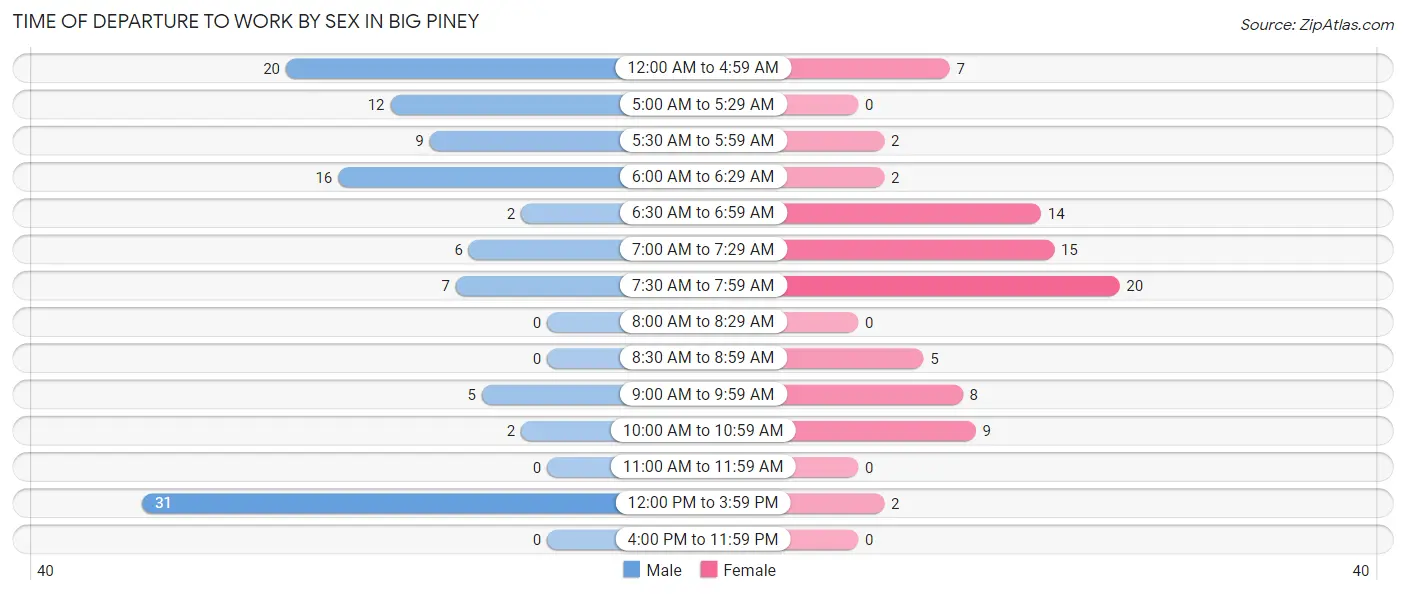
| Time of Departure | Male | Female |
| 12:00 AM to 4:59 AM | 20 (18.2%) | 7 (8.3%) |
| 5:00 AM to 5:29 AM | 12 (10.9%) | 0 (0.0%) |
| 5:30 AM to 5:59 AM | 9 (8.2%) | 2 (2.4%) |
| 6:00 AM to 6:29 AM | 16 (14.5%) | 2 (2.4%) |
| 6:30 AM to 6:59 AM | 2 (1.8%) | 14 (16.7%) |
| 7:00 AM to 7:29 AM | 6 (5.4%) | 15 (17.9%) |
| 7:30 AM to 7:59 AM | 7 (6.4%) | 20 (23.8%) |
| 8:00 AM to 8:29 AM | 0 (0.0%) | 0 (0.0%) |
| 8:30 AM to 8:59 AM | 0 (0.0%) | 5 (5.9%) |
| 9:00 AM to 9:59 AM | 5 (4.5%) | 8 (9.5%) |
| 10:00 AM to 10:59 AM | 2 (1.8%) | 9 (10.7%) |
| 11:00 AM to 11:59 AM | 0 (0.0%) | 0 (0.0%) |
| 12:00 PM to 3:59 PM | 31 (28.2%) | 2 (2.4%) |
| 4:00 PM to 11:59 PM | 0 (0.0%) | 0 (0.0%) |
| Total | 110 (100.0%) | 84 (100.0%) |
Housing Occupancy in Big Piney
Occupancy by Ownership in Big Piney
Of the total 163 dwellings in Big Piney, owner-occupied units account for 90 (55.2%), while renter-occupied units make up 73 (44.8%).
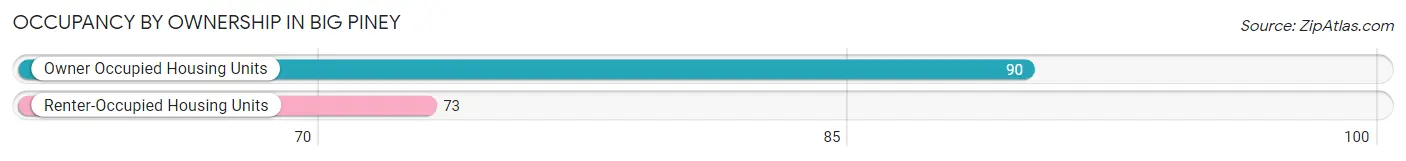
| Occupancy | # Housing Units | % Housing Units |
| Owner Occupied Housing Units | 90 | 55.2% |
| Renter-Occupied Housing Units | 73 | 44.8% |
| Total Occupied Housing Units | 163 | 100.0% |
Occupancy by Household Size in Big Piney
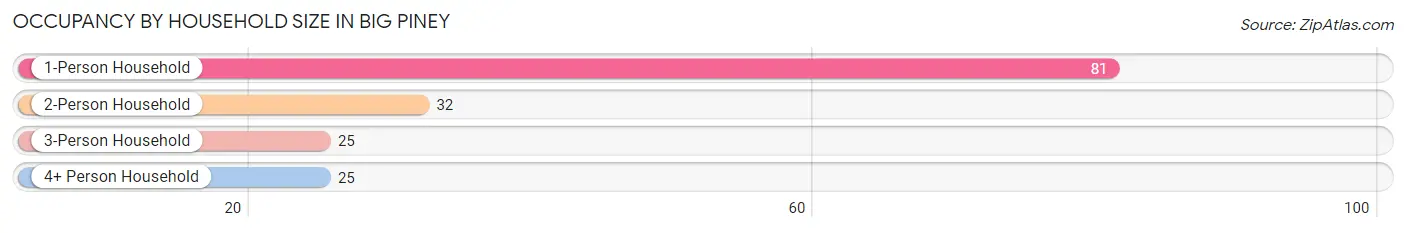
| Household Size | # Housing Units | % Housing Units |
| 1-Person Household | 81 | 49.7% |
| 2-Person Household | 32 | 19.6% |
| 3-Person Household | 25 | 15.3% |
| 4+ Person Household | 25 | 15.3% |
| Total Housing Units | 163 | 100.0% |
Occupancy by Ownership by Household Size in Big Piney
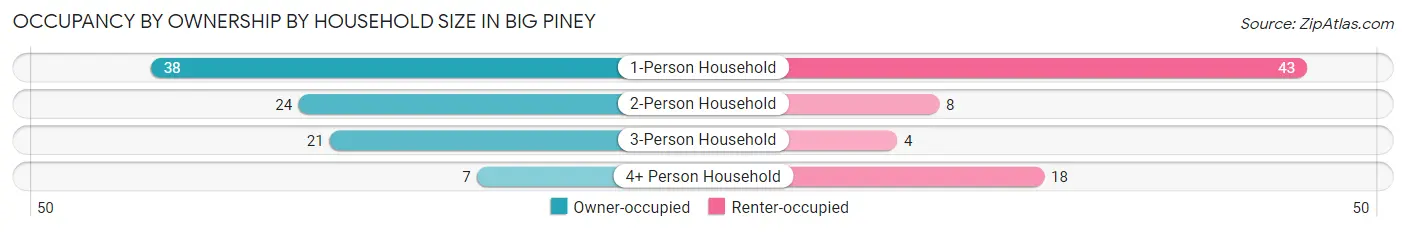
| Household Size | Owner-occupied | Renter-occupied |
| 1-Person Household | 38 (46.9%) | 43 (53.1%) |
| 2-Person Household | 24 (75.0%) | 8 (25.0%) |
| 3-Person Household | 21 (84.0%) | 4 (16.0%) |
| 4+ Person Household | 7 (28.0%) | 18 (72.0%) |
| Total Housing Units | 90 (55.2%) | 73 (44.8%) |
Occupancy by Educational Attainment in Big Piney
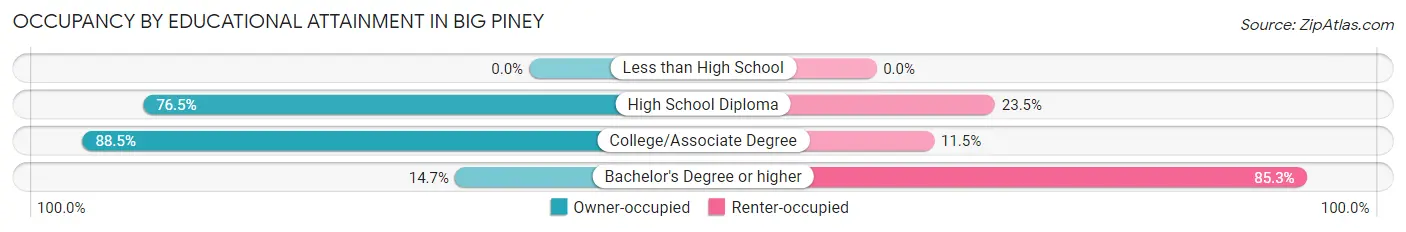
| Household Size | Owner-occupied | Renter-occupied |
| Less than High School | 0 (0.0%) | 0 (0.0%) |
| High School Diploma | 26 (76.5%) | 8 (23.5%) |
| College/Associate Degree | 54 (88.5%) | 7 (11.5%) |
| Bachelor's Degree or higher | 10 (14.7%) | 58 (85.3%) |
Occupancy by Age of Householder in Big Piney
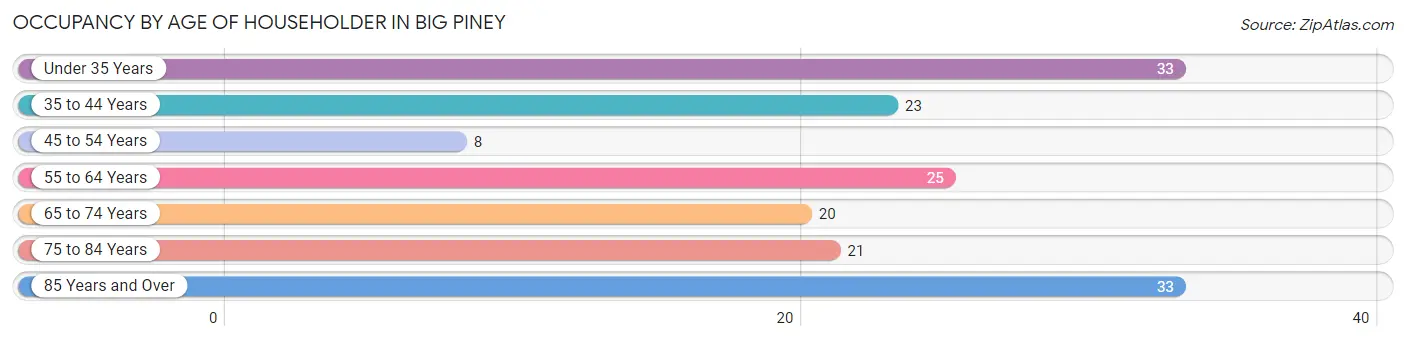
| Age Bracket | # Households | % Households |
| Under 35 Years | 33 | 20.3% |
| 35 to 44 Years | 23 | 14.1% |
| 45 to 54 Years | 8 | 4.9% |
| 55 to 64 Years | 25 | 15.3% |
| 65 to 74 Years | 20 | 12.3% |
| 75 to 84 Years | 21 | 12.9% |
| 85 Years and Over | 33 | 20.3% |
| Total | 163 | 100.0% |
Housing Finances in Big Piney
Median Income by Occupancy in Big Piney
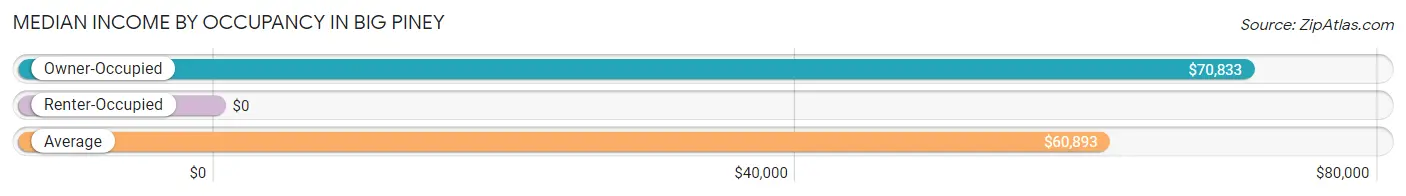
| Occupancy Type | # Households | Median Income |
| Owner-Occupied | 90 (55.2%) | $70,833 |
| Renter-Occupied | 73 (44.8%) | $0 |
| Average | 163 (100.0%) | $60,893 |
Occupancy by Householder Income Bracket in Big Piney
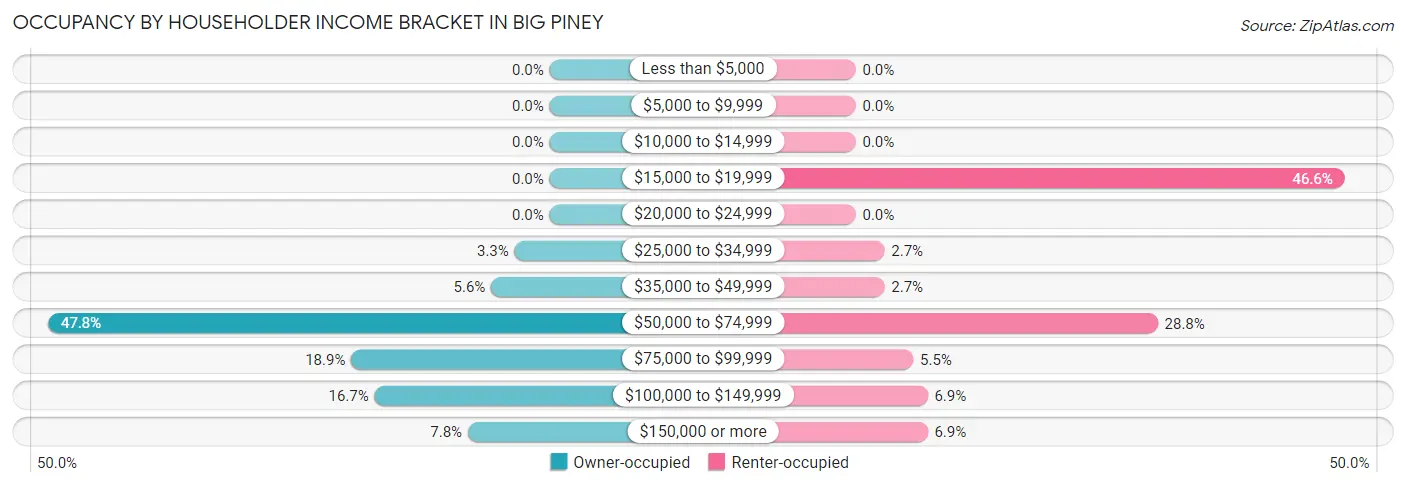
| Income Bracket | Owner-occupied | Renter-occupied |
| Less than $5,000 | 0 (0.0%) | 0 (0.0%) |
| $5,000 to $9,999 | 0 (0.0%) | 0 (0.0%) |
| $10,000 to $14,999 | 0 (0.0%) | 0 (0.0%) |
| $15,000 to $19,999 | 0 (0.0%) | 34 (46.6%) |
| $20,000 to $24,999 | 0 (0.0%) | 0 (0.0%) |
| $25,000 to $34,999 | 3 (3.3%) | 2 (2.7%) |
| $35,000 to $49,999 | 5 (5.6%) | 2 (2.7%) |
| $50,000 to $74,999 | 43 (47.8%) | 21 (28.8%) |
| $75,000 to $99,999 | 17 (18.9%) | 4 (5.5%) |
| $100,000 to $149,999 | 15 (16.7%) | 5 (6.9%) |
| $150,000 or more | 7 (7.8%) | 5 (6.9%) |
| Total | 90 (100.0%) | 73 (100.0%) |
Monthly Housing Cost Tiers in Big Piney
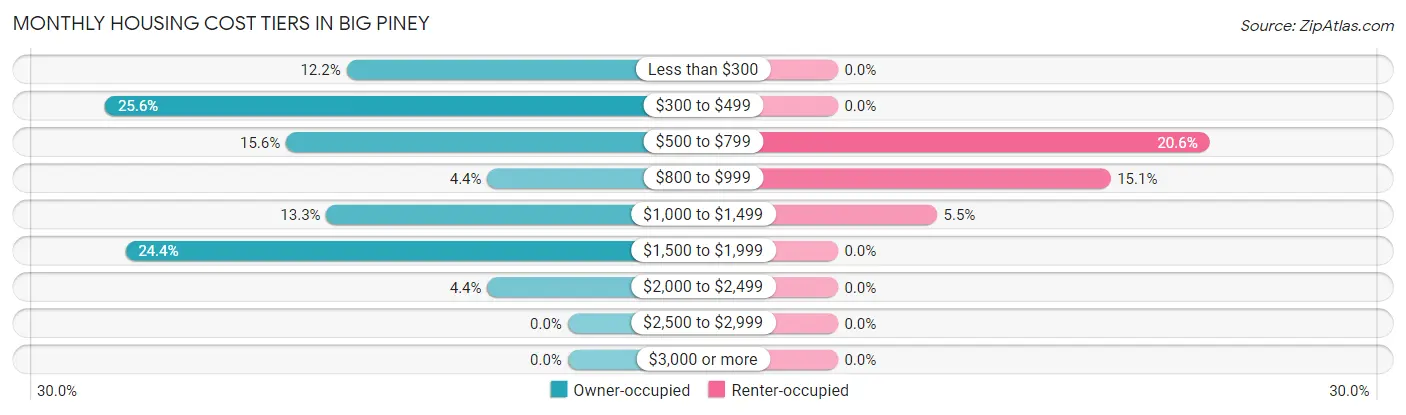
| Monthly Cost | Owner-occupied | Renter-occupied |
| Less than $300 | 11 (12.2%) | 0 (0.0%) |
| $300 to $499 | 23 (25.6%) | 0 (0.0%) |
| $500 to $799 | 14 (15.6%) | 15 (20.5%) |
| $800 to $999 | 4 (4.4%) | 11 (15.1%) |
| $1,000 to $1,499 | 12 (13.3%) | 4 (5.5%) |
| $1,500 to $1,999 | 22 (24.4%) | 0 (0.0%) |
| $2,000 to $2,499 | 4 (4.4%) | 0 (0.0%) |
| $2,500 to $2,999 | 0 (0.0%) | 0 (0.0%) |
| $3,000 or more | 0 (0.0%) | 0 (0.0%) |
| Total | 90 (100.0%) | 73 (100.0%) |
Physical Housing Characteristics in Big Piney
Housing Structures in Big Piney
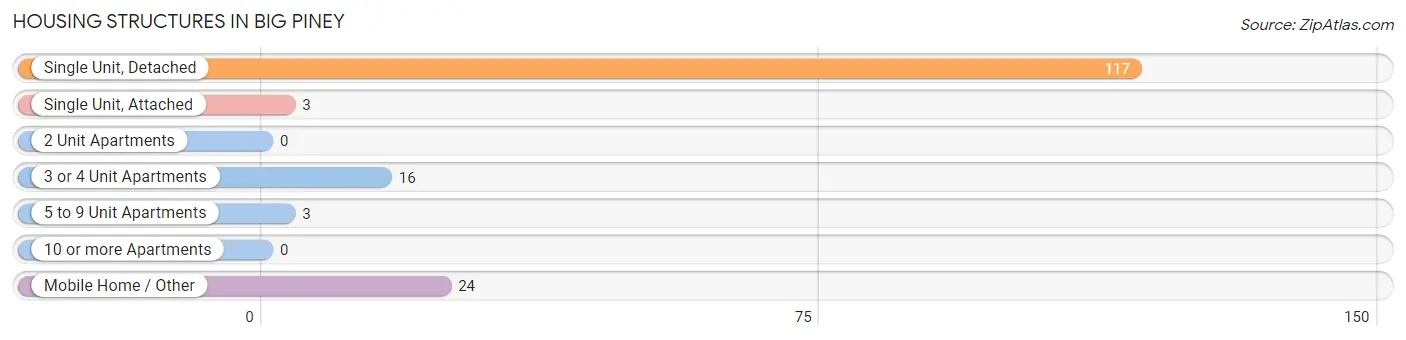
| Structure Type | # Housing Units | % Housing Units |
| Single Unit, Detached | 117 | 71.8% |
| Single Unit, Attached | 3 | 1.8% |
| 2 Unit Apartments | 0 | 0.0% |
| 3 or 4 Unit Apartments | 16 | 9.8% |
| 5 to 9 Unit Apartments | 3 | 1.8% |
| 10 or more Apartments | 0 | 0.0% |
| Mobile Home / Other | 24 | 14.7% |
| Total | 163 | 100.0% |
Housing Structures by Occupancy in Big Piney
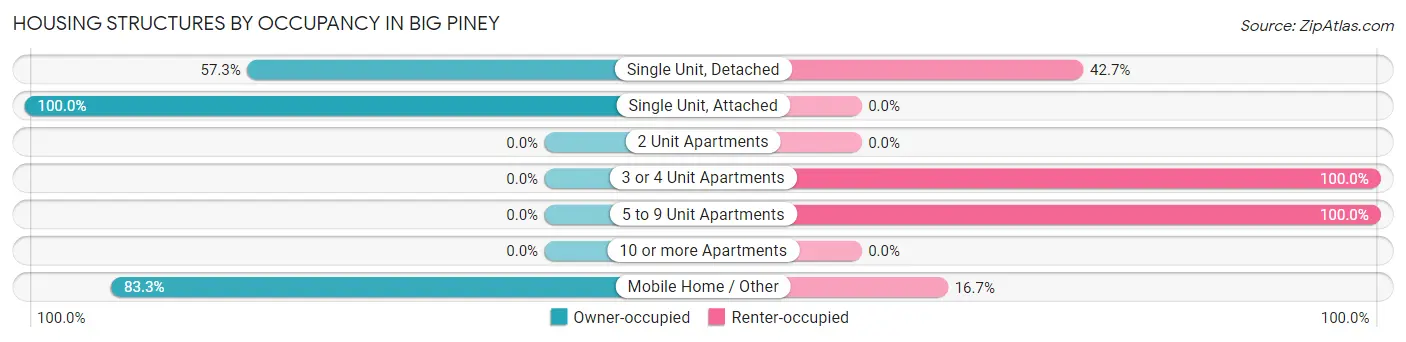
| Structure Type | Owner-occupied | Renter-occupied |
| Single Unit, Detached | 67 (57.3%) | 50 (42.7%) |
| Single Unit, Attached | 3 (100.0%) | 0 (0.0%) |
| 2 Unit Apartments | 0 (0.0%) | 0 (0.0%) |
| 3 or 4 Unit Apartments | 0 (0.0%) | 16 (100.0%) |
| 5 to 9 Unit Apartments | 0 (0.0%) | 3 (100.0%) |
| 10 or more Apartments | 0 (0.0%) | 0 (0.0%) |
| Mobile Home / Other | 20 (83.3%) | 4 (16.7%) |
| Total | 90 (55.2%) | 73 (44.8%) |
Housing Structures by Number of Rooms in Big Piney
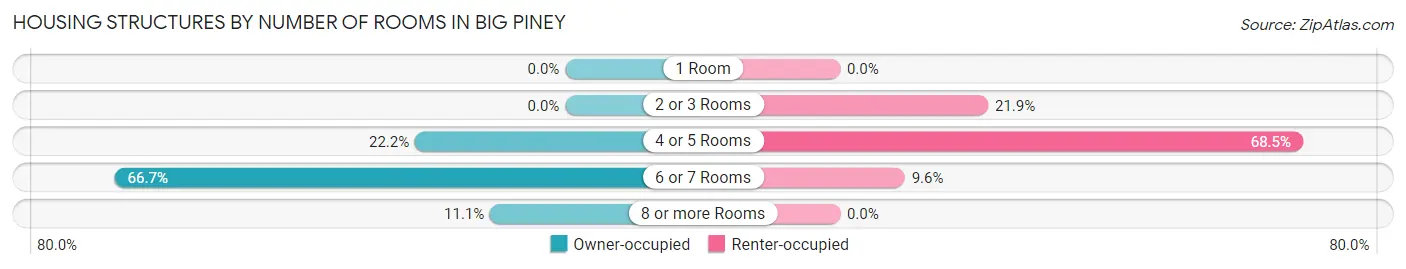
| Number of Rooms | Owner-occupied | Renter-occupied |
| 1 Room | 0 (0.0%) | 0 (0.0%) |
| 2 or 3 Rooms | 0 (0.0%) | 16 (21.9%) |
| 4 or 5 Rooms | 20 (22.2%) | 50 (68.5%) |
| 6 or 7 Rooms | 60 (66.7%) | 7 (9.6%) |
| 8 or more Rooms | 10 (11.1%) | 0 (0.0%) |
| Total | 90 (100.0%) | 73 (100.0%) |
Housing Structure by Heating Type in Big Piney
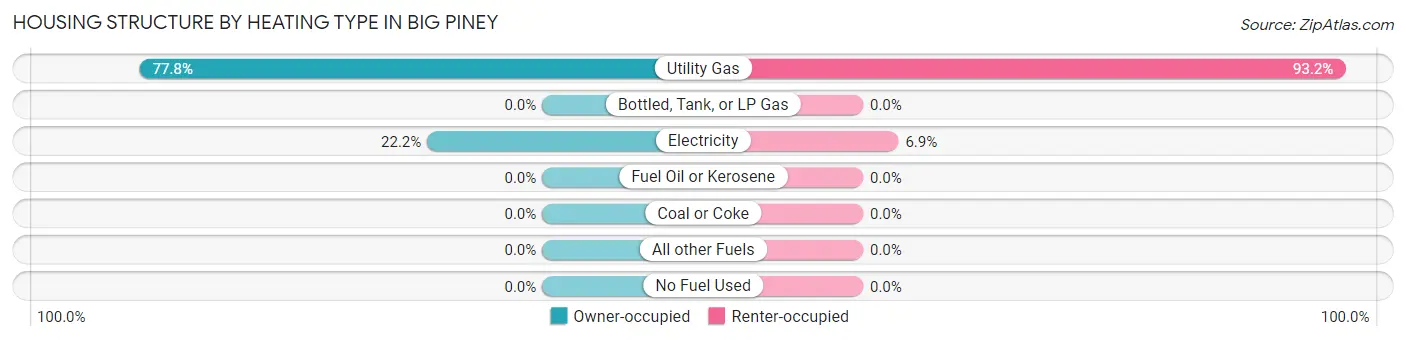
| Heating Type | Owner-occupied | Renter-occupied |
| Utility Gas | 70 (77.8%) | 68 (93.1%) |
| Bottled, Tank, or LP Gas | 0 (0.0%) | 0 (0.0%) |
| Electricity | 20 (22.2%) | 5 (6.9%) |
| Fuel Oil or Kerosene | 0 (0.0%) | 0 (0.0%) |
| Coal or Coke | 0 (0.0%) | 0 (0.0%) |
| All other Fuels | 0 (0.0%) | 0 (0.0%) |
| No Fuel Used | 0 (0.0%) | 0 (0.0%) |
| Total | 90 (100.0%) | 73 (100.0%) |
Household Vehicle Usage in Big Piney
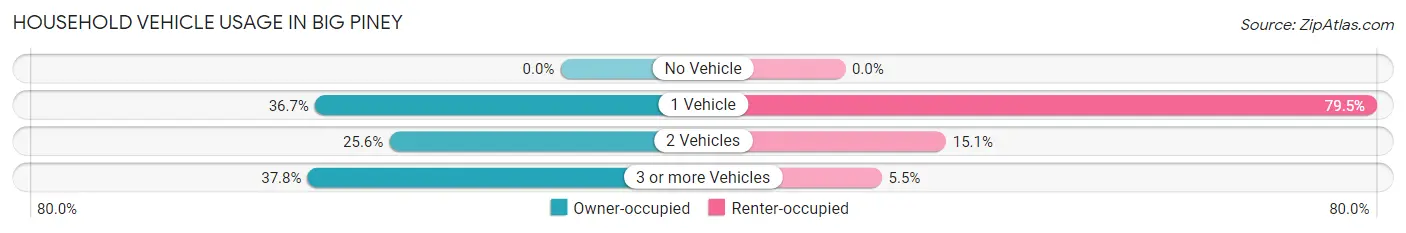
| Vehicles per Household | Owner-occupied | Renter-occupied |
| No Vehicle | 0 (0.0%) | 0 (0.0%) |
| 1 Vehicle | 33 (36.7%) | 58 (79.4%) |
| 2 Vehicles | 23 (25.6%) | 11 (15.1%) |
| 3 or more Vehicles | 34 (37.8%) | 4 (5.5%) |
| Total | 90 (100.0%) | 73 (100.0%) |
Real Estate & Mortgages in Big Piney
Real Estate and Mortgage Overview in Big Piney
| Characteristic | Without Mortgage | With Mortgage |
| Housing Units | 45 | 45 |
| Median Property Value | $161,900 | $271,900 |
| Median Household Income | $64,191 | $5 |
| Monthly Housing Costs | $375 | $0 |
| Real Estate Taxes | $835 | $0 |
Property Value by Mortgage Status in Big Piney
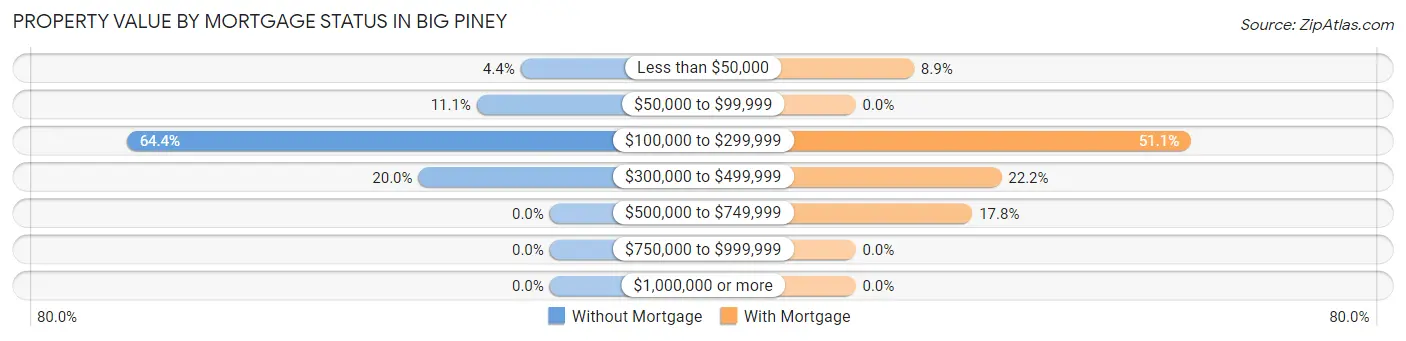
| Property Value | Without Mortgage | With Mortgage |
| Less than $50,000 | 2 (4.4%) | 4 (8.9%) |
| $50,000 to $99,999 | 5 (11.1%) | 0 (0.0%) |
| $100,000 to $299,999 | 29 (64.4%) | 23 (51.1%) |
| $300,000 to $499,999 | 9 (20.0%) | 10 (22.2%) |
| $500,000 to $749,999 | 0 (0.0%) | 8 (17.8%) |
| $750,000 to $999,999 | 0 (0.0%) | 0 (0.0%) |
| $1,000,000 or more | 0 (0.0%) | 0 (0.0%) |
| Total | 45 (100.0%) | 45 (100.0%) |
Household Income by Mortgage Status in Big Piney
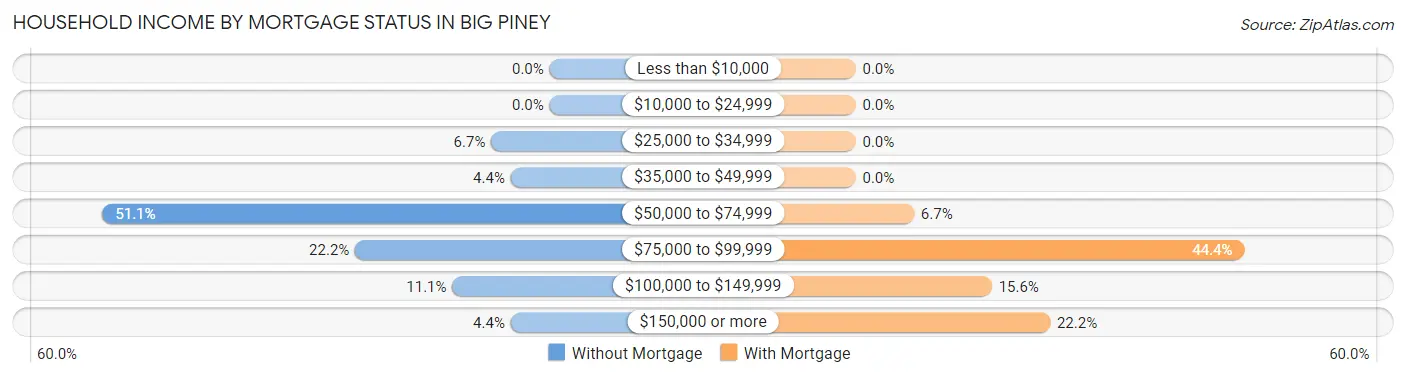
| Household Income | Without Mortgage | With Mortgage |
| Less than $10,000 | 0 (0.0%) | 0 (0.0%) |
| $10,000 to $24,999 | 0 (0.0%) | 0 (0.0%) |
| $25,000 to $34,999 | 3 (6.7%) | 0 (0.0%) |
| $35,000 to $49,999 | 2 (4.4%) | 0 (0.0%) |
| $50,000 to $74,999 | 23 (51.1%) | 3 (6.7%) |
| $75,000 to $99,999 | 10 (22.2%) | 20 (44.4%) |
| $100,000 to $149,999 | 5 (11.1%) | 7 (15.6%) |
| $150,000 or more | 2 (4.4%) | 10 (22.2%) |
| Total | 45 (100.0%) | 45 (100.0%) |
Property Value to Household Income Ratio in Big Piney
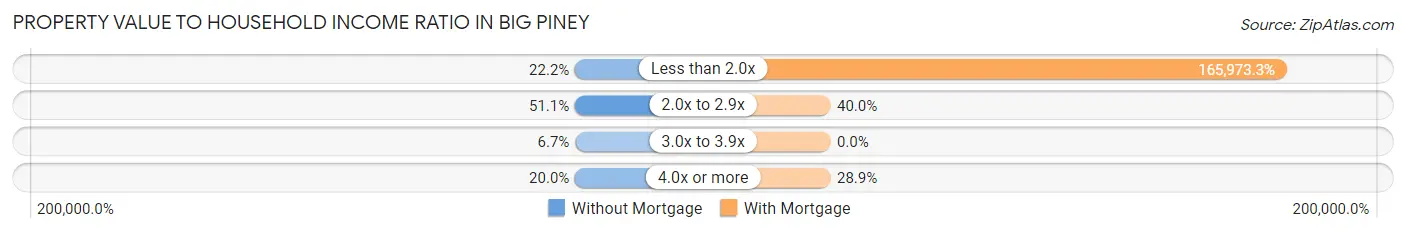
| Value-to-Income Ratio | Without Mortgage | With Mortgage |
| Less than 2.0x | 10 (22.2%) | 74,688 (165,973.3%) |
| 2.0x to 2.9x | 23 (51.1%) | 18 (40.0%) |
| 3.0x to 3.9x | 3 (6.7%) | 0 (0.0%) |
| 4.0x or more | 9 (20.0%) | 13 (28.9%) |
| Total | 45 (100.0%) | 45 (100.0%) |
Real Estate Taxes by Mortgage Status in Big Piney
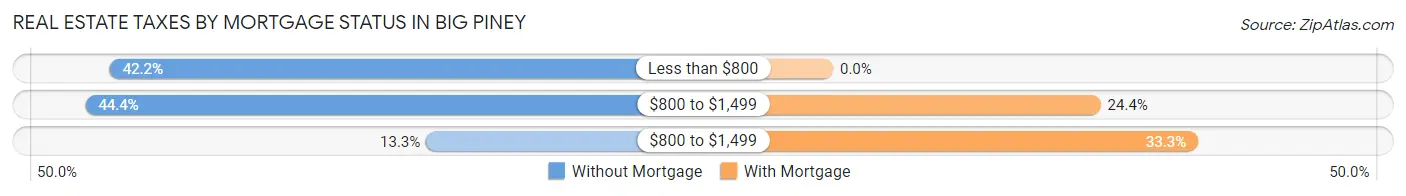
| Property Taxes | Without Mortgage | With Mortgage |
| Less than $800 | 19 (42.2%) | 0 (0.0%) |
| $800 to $1,499 | 20 (44.4%) | 11 (24.4%) |
| $800 to $1,499 | 6 (13.3%) | 15 (33.3%) |
| Total | 45 (100.0%) | 45 (100.0%) |
Health & Disability in Big Piney
Health Insurance Coverage by Age in Big Piney
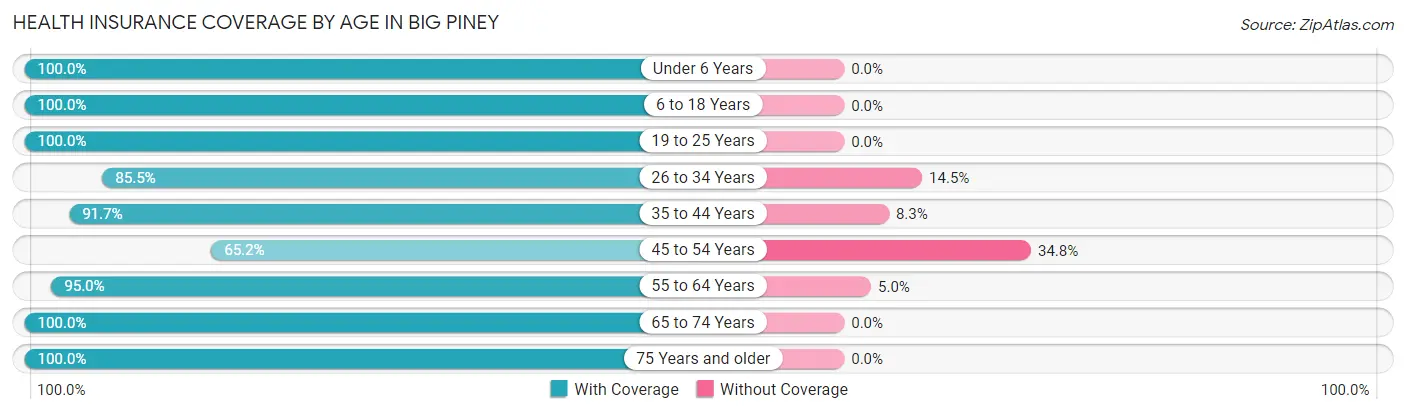
| Age Bracket | With Coverage | Without Coverage |
| Under 6 Years | 39 (100.0%) | 0 (0.0%) |
| 6 to 18 Years | 68 (100.0%) | 0 (0.0%) |
| 19 to 25 Years | 22 (100.0%) | 0 (0.0%) |
| 26 to 34 Years | 53 (85.5%) | 9 (14.5%) |
| 35 to 44 Years | 33 (91.7%) | 3 (8.3%) |
| 45 to 54 Years | 58 (65.2%) | 31 (34.8%) |
| 55 to 64 Years | 38 (95.0%) | 2 (5.0%) |
| 65 to 74 Years | 40 (100.0%) | 0 (0.0%) |
| 75 Years and older | 54 (100.0%) | 0 (0.0%) |
| Total | 405 (90.0%) | 45 (10.0%) |
Health Insurance Coverage by Citizenship Status in Big Piney
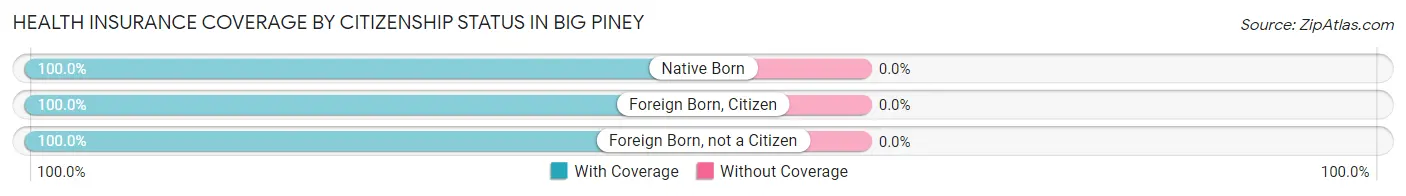
| Citizenship Status | With Coverage | Without Coverage |
| Native Born | 39 (100.0%) | 0 (0.0%) |
| Foreign Born, Citizen | 68 (100.0%) | 0 (0.0%) |
| Foreign Born, not a Citizen | 22 (100.0%) | 0 (0.0%) |
Health Insurance Coverage by Household Income in Big Piney
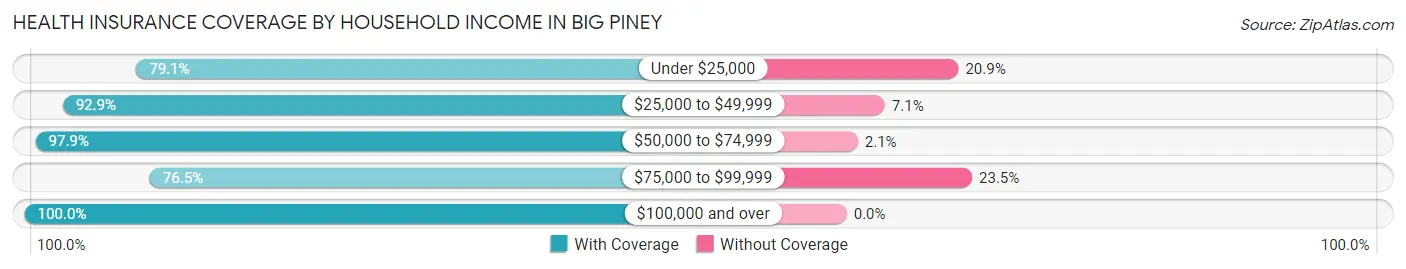
| Household Income | With Coverage | Without Coverage |
| Under $25,000 | 34 (79.1%) | 9 (20.9%) |
| $25,000 to $49,999 | 26 (92.9%) | 2 (7.1%) |
| $50,000 to $74,999 | 142 (97.9%) | 3 (2.1%) |
| $75,000 to $99,999 | 101 (76.5%) | 31 (23.5%) |
| $100,000 and over | 102 (100.0%) | 0 (0.0%) |
Public vs Private Health Insurance Coverage by Age in Big Piney
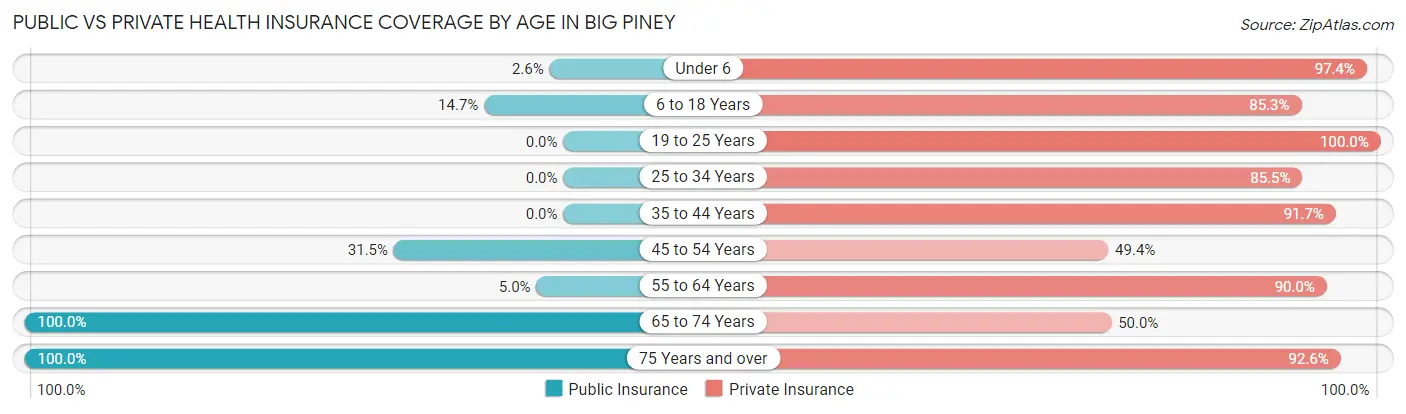
| Age Bracket | Public Insurance | Private Insurance |
| Under 6 | 1 (2.6%) | 38 (97.4%) |
| 6 to 18 Years | 10 (14.7%) | 58 (85.3%) |
| 19 to 25 Years | 0 (0.0%) | 22 (100.0%) |
| 25 to 34 Years | 0 (0.0%) | 53 (85.5%) |
| 35 to 44 Years | 0 (0.0%) | 33 (91.7%) |
| 45 to 54 Years | 28 (31.5%) | 44 (49.4%) |
| 55 to 64 Years | 2 (5.0%) | 36 (90.0%) |
| 65 to 74 Years | 40 (100.0%) | 20 (50.0%) |
| 75 Years and over | 54 (100.0%) | 50 (92.6%) |
| Total | 135 (30.0%) | 354 (78.7%) |
Disability Status by Sex by Age in Big Piney
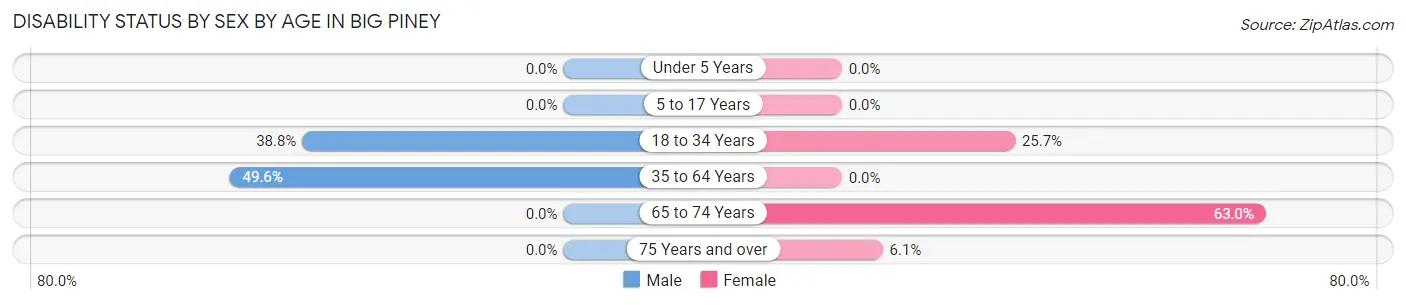
| Age Bracket | Male | Female |
| Under 5 Years | 0 (0.0%) | 0 (0.0%) |
| 5 to 17 Years | 0 (0.0%) | 0 (0.0%) |
| 18 to 34 Years | 19 (38.8%) | 9 (25.7%) |
| 35 to 64 Years | 55 (49.5%) | 0 (0.0%) |
| 65 to 74 Years | 0 (0.0%) | 17 (63.0%) |
| 75 Years and over | 0 (0.0%) | 2 (6.1%) |
Disability Class by Sex by Age in Big Piney
Disability Class: Hearing Difficulty
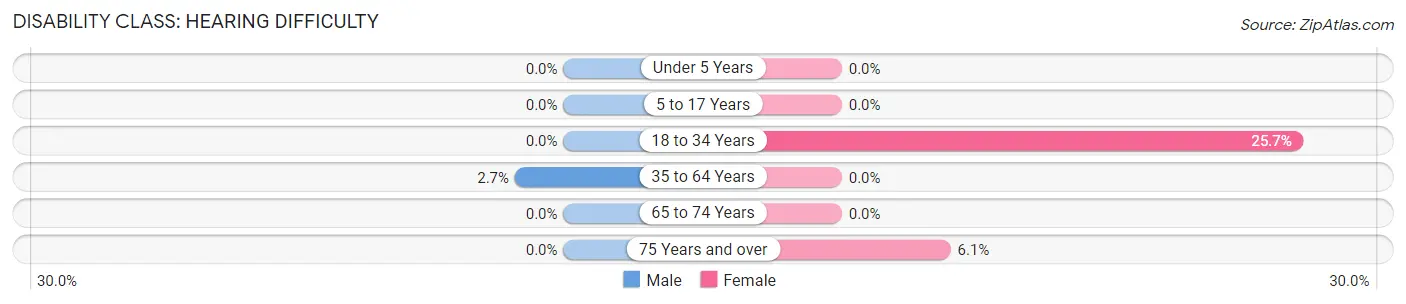
| Age Bracket | Male | Female |
| Under 5 Years | 0 (0.0%) | 0 (0.0%) |
| 5 to 17 Years | 0 (0.0%) | 0 (0.0%) |
| 18 to 34 Years | 0 (0.0%) | 9 (25.7%) |
| 35 to 64 Years | 3 (2.7%) | 0 (0.0%) |
| 65 to 74 Years | 0 (0.0%) | 0 (0.0%) |
| 75 Years and over | 0 (0.0%) | 2 (6.1%) |
Disability Class: Vision Difficulty
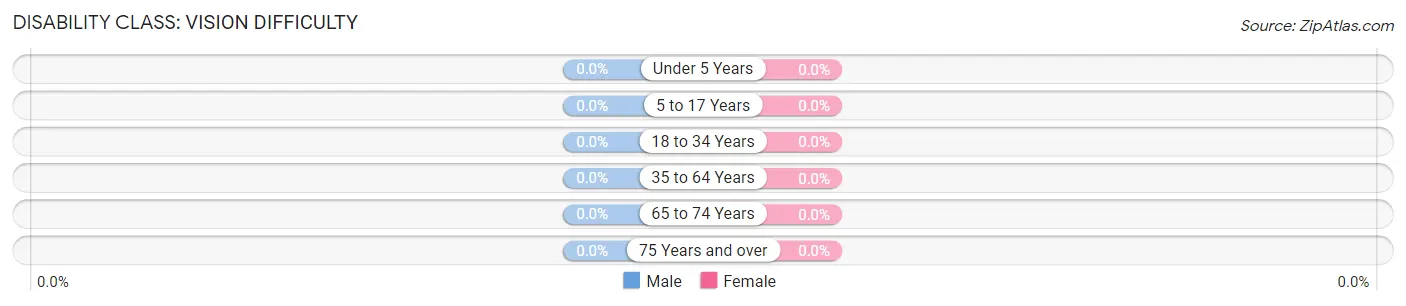
| Age Bracket | Male | Female |
| Under 5 Years | 0 (0.0%) | 0 (0.0%) |
| 5 to 17 Years | 0 (0.0%) | 0 (0.0%) |
| 18 to 34 Years | 0 (0.0%) | 0 (0.0%) |
| 35 to 64 Years | 0 (0.0%) | 0 (0.0%) |
| 65 to 74 Years | 0 (0.0%) | 0 (0.0%) |
| 75 Years and over | 0 (0.0%) | 0 (0.0%) |
Disability Class: Cognitive Difficulty
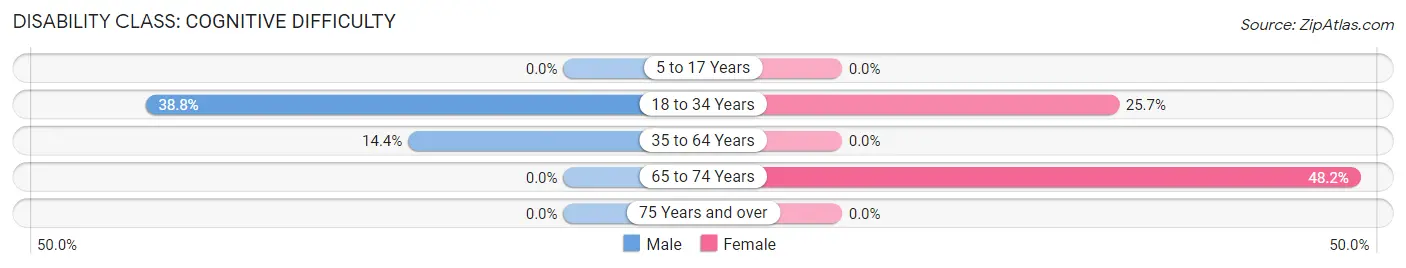
| Age Bracket | Male | Female |
| 5 to 17 Years | 0 (0.0%) | 0 (0.0%) |
| 18 to 34 Years | 19 (38.8%) | 9 (25.7%) |
| 35 to 64 Years | 16 (14.4%) | 0 (0.0%) |
| 65 to 74 Years | 0 (0.0%) | 13 (48.1%) |
| 75 Years and over | 0 (0.0%) | 0 (0.0%) |
Disability Class: Ambulatory Difficulty
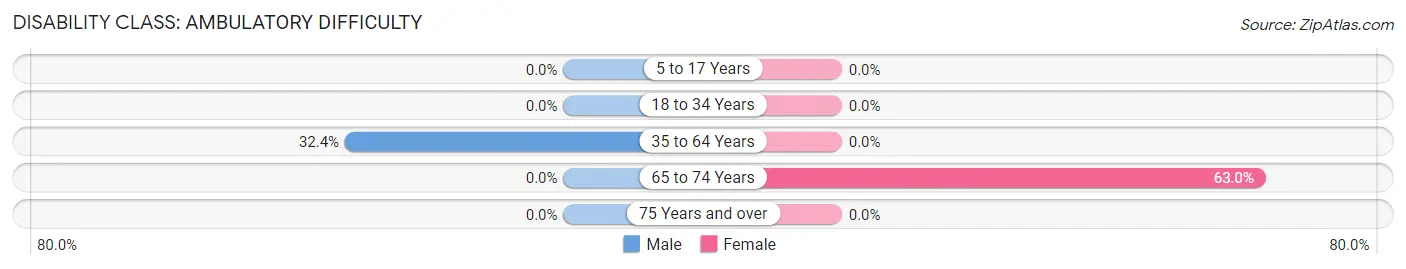
| Age Bracket | Male | Female |
| 5 to 17 Years | 0 (0.0%) | 0 (0.0%) |
| 18 to 34 Years | 0 (0.0%) | 0 (0.0%) |
| 35 to 64 Years | 36 (32.4%) | 0 (0.0%) |
| 65 to 74 Years | 0 (0.0%) | 17 (63.0%) |
| 75 Years and over | 0 (0.0%) | 0 (0.0%) |
Disability Class: Self-Care Difficulty
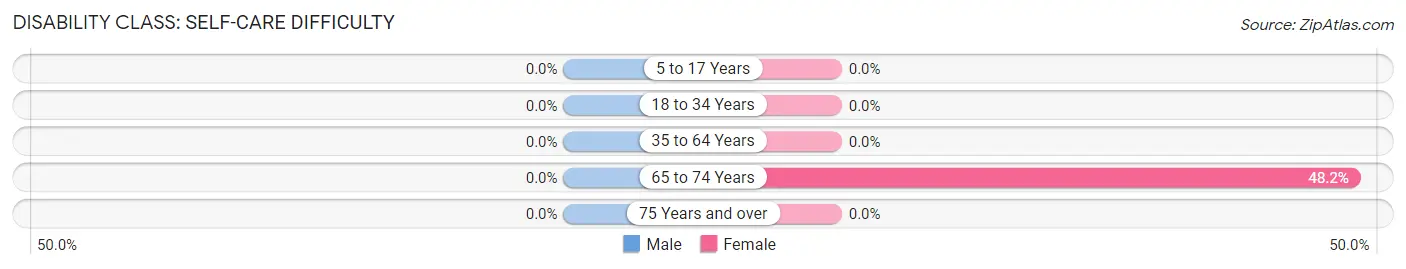
| Age Bracket | Male | Female |
| 5 to 17 Years | 0 (0.0%) | 0 (0.0%) |
| 18 to 34 Years | 0 (0.0%) | 0 (0.0%) |
| 35 to 64 Years | 0 (0.0%) | 0 (0.0%) |
| 65 to 74 Years | 0 (0.0%) | 13 (48.1%) |
| 75 Years and over | 0 (0.0%) | 0 (0.0%) |
Technology Access in Big Piney
Computing Device Access in Big Piney
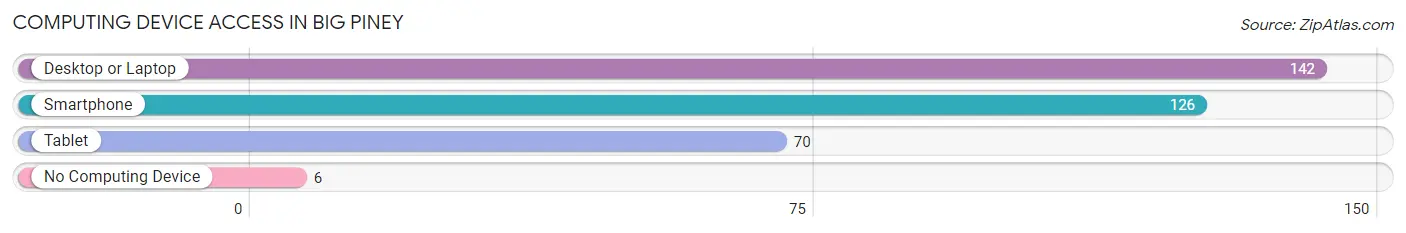
| Device Type | # Households | % Households |
| Desktop or Laptop | 142 | 87.1% |
| Smartphone | 126 | 77.3% |
| Tablet | 70 | 42.9% |
| No Computing Device | 6 | 3.7% |
| Total | 163 | 100.0% |
Internet Access in Big Piney
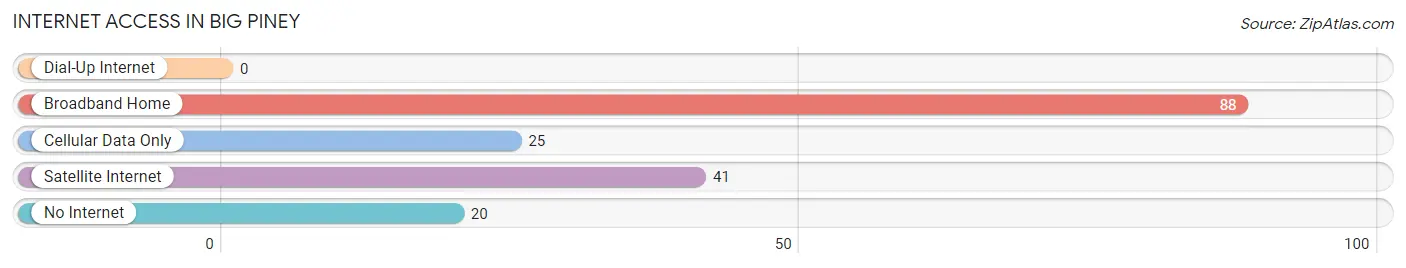
| Internet Type | # Households | % Households |
| Dial-Up Internet | 0 | 0.0% |
| Broadband Home | 88 | 54.0% |
| Cellular Data Only | 25 | 15.3% |
| Satellite Internet | 41 | 25.2% |
| No Internet | 20 | 12.3% |
| Total | 163 | 100.0% |
Big Piney Summary
Big Piney, Wyoming is a small town located in Sublette County in the western part of the state. It is situated in the foothills of the Wind River Mountains, and is the county seat of Sublette County. The town was founded in 1879 and has a population of approximately 1,000 people.
History
Big Piney was founded in 1879 by a group of settlers from the nearby town of Pinedale. The settlers were looking for a place to settle and raise their families, and they chose the area around Big Piney because of its abundance of natural resources. The town was named after the nearby Big Piney River, which was named after the large pine trees that grew along its banks.
The town quickly grew and became an important center for the local ranching and farming industry. In the early 1900s, the town was home to several businesses, including a hotel, a general store, a blacksmith shop, and a saloon.
In the 1920s, the town began to experience a decline in population as many of the local ranchers and farmers moved away. However, the town was able to remain a viable community due to its proximity to the nearby oil fields. In the 1950s, the town experienced a resurgence in population as the oil industry began to boom.
Geography
Big Piney is located in the western part of Wyoming, in Sublette County. It is situated in the foothills of the Wind River Mountains, and is approximately 30 miles south of the Wyoming-Idaho border. The town is located at an elevation of 6,400 feet, and is surrounded by the Bridger-Teton National Forest.
The town is located in a semi-arid climate, with hot summers and cold winters. The average annual temperature is approximately 45 degrees Fahrenheit, and the average annual precipitation is approximately 12 inches.
Economy
The economy of Big Piney is largely based on the oil and gas industry. The town is home to several oil and gas companies, and the local economy is heavily dependent on the industry. In addition to the oil and gas industry, the town is also home to several small businesses, including restaurants, retail stores, and a few small manufacturing companies.
The town is also home to a large number of ranches and farms, which provide employment for many of the town’s residents. The local economy is also supported by tourism, as the town is a popular destination for outdoor enthusiasts.
Demographics
As of the 2010 census, the population of Big Piney was 1,000 people. The racial makeup of the town was 95.2% White, 0.7% Native American, 0.2% Asian, 0.1% Pacific Islander, 0.1% from other races, and 3.7% from two or more races. The median household income was $45,000, and the median family income was $50,000.
The town is home to a large number of retirees, as well as a large number of young families. The town is also home to a large number of seasonal workers, as the oil and gas industry provides employment for many of the town’s residents.
Conclusion
Big Piney, Wyoming is a small town located in Sublette County in the western part of the state. It was founded in 1879 and has a population of approximately 1,000 people. The town is situated in the foothills of the Wind River Mountains, and is the county seat of Sublette County. The economy of Big Piney is largely based on the oil and gas industry, and the town is also home to several small businesses, ranches, and farms. The town is home to a large number of retirees, as well as a large number of young families and seasonal workers.
Common Questions
What is Per Capita Income in Big Piney?
Per Capita income in Big Piney is $32,136.
What is the Median Family Income in Big Piney?
Median Family Income in Big Piney is $74,375.
What is the Median Household income in Big Piney?
Median Household Income in Big Piney is $60,893.
What is Inequality or Gini Index in Big Piney?
Inequality or Gini Index in Big Piney is 0.35.
What is the Total Population of Big Piney?
Total Population of Big Piney is 450.
What is the Total Male Population of Big Piney?
Total Male Population of Big Piney is 245.
What is the Total Female Population of Big Piney?
Total Female Population of Big Piney is 205.
What is the Ratio of Males per 100 Females in Big Piney?
There are 119.51 Males per 100 Females in Big Piney.
What is the Ratio of Females per 100 Males in Big Piney?
There are 83.67 Females per 100 Males in Big Piney.
What is the Median Population Age in Big Piney?
Median Population Age in Big Piney is 43.5 Years.
What is the Average Family Size in Big Piney
Average Family Size in Big Piney is 4.5 People.
What is the Average Household Size in Big Piney
Average Household Size in Big Piney is 2.8 People.
How Large is the Labor Force in Big Piney?
There are 223 People in the Labor Forcein in Big Piney.
What is the Percentage of People in the Labor Force in Big Piney?
65.0% of People are in the Labor Force in Big Piney.
What is the Unemployment Rate in Big Piney?
Unemployment Rate in Big Piney is 7.6%.