Afton, WY Map & Demographics
Afton Map
Afton Overview
$30,930
PER CAPITA INCOME
$79,813
AVG FAMILY INCOME
$52,273
AVG HOUSEHOLD INCOME
17.1%
WAGE / INCOME GAP [ % ]
82.9¢/ $1
WAGE / INCOME GAP [ $ ]
0.44
INEQUALITY / GINI INDEX
2,303
TOTAL POPULATION
958
MALE POPULATION
1,345
FEMALE POPULATION
71.23
MALES / 100 FEMALES
140.40
FEMALES / 100 MALES
35.3
MEDIAN AGE
3.2
AVG FAMILY SIZE
2.4
AVG HOUSEHOLD SIZE
1,333
LABOR FORCE [ PEOPLE ]
74.4%
PERCENT IN LABOR FORCE
6.3%
UNEMPLOYMENT RATE
Afton Zip Codes
Afton Area Codes
Income in Afton
Income Overview in Afton
Per Capita Income in Afton is $30,930, while median incomes of families and households are $79,813 and $52,273 respectively.
| Characteristic | Number | Measure |
| Per Capita Income | 2,303 | $30,930 |
| Median Family Income | 559 | $79,813 |
| Mean Family Income | 559 | $97,309 |
| Median Household Income | 930 | $52,273 |
| Mean Household Income | 930 | $75,025 |
| Income Deficit | 559 | $0 |
| Wage / Income Gap (%) | 2,303 | 17.10% |
| Wage / Income Gap ($) | 2,303 | 82.90¢ per $1 |
| Gini / Inequality Index | 2,303 | 0.44 |
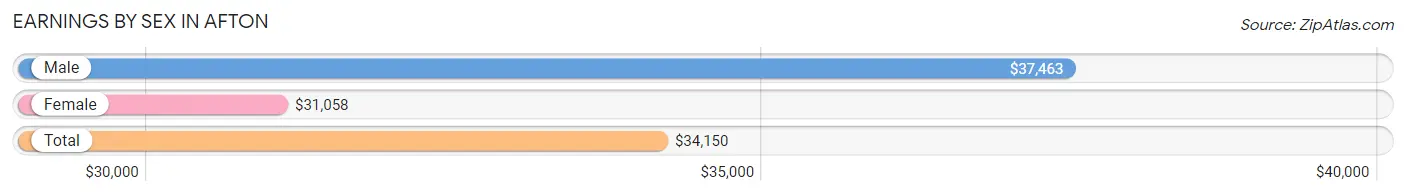
Earnings by Sex in Afton
Average Earnings in Afton are $34,150, $37,463 for men and $31,058 for women, a difference of 17.1%.
| Sex | Number | Average Earnings |
| Male | 501 (38.1%) | $37,463 |
| Female | 815 (61.9%) | $31,058 |
| Total | 1,316 (100.0%) | $34,150 |
Earnings by Sex by Income Bracket in Afton
The most common earnings brackets in Afton are $100,000+ for men (82 | 16.4%) and $40,000 to $44,999 for women (143 | 17.5%).
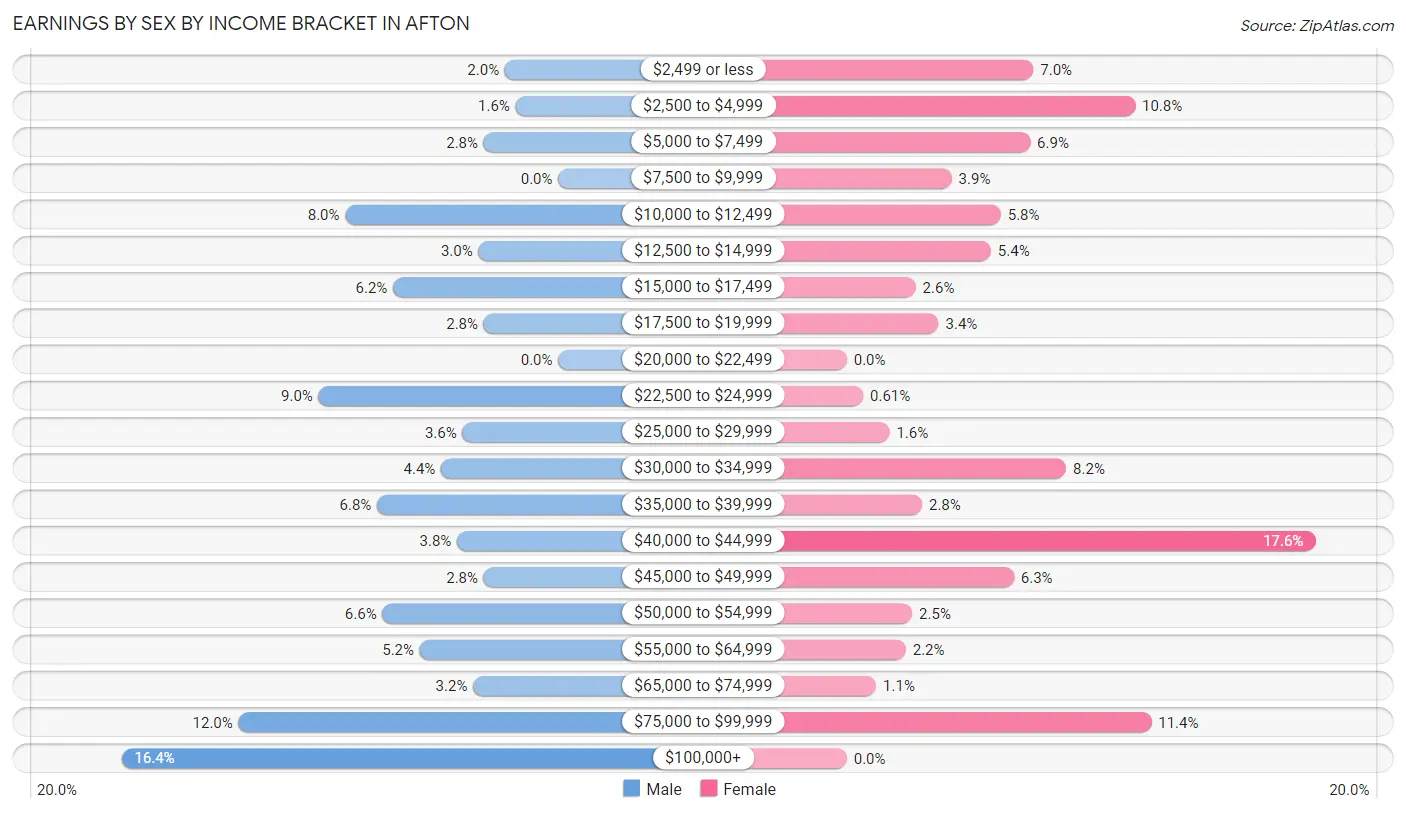
| Income | Male | Female |
| $2,499 or less | 10 (2.0%) | 57 (7.0%) |
| $2,500 to $4,999 | 8 (1.6%) | 88 (10.8%) |
| $5,000 to $7,499 | 14 (2.8%) | 56 (6.9%) |
| $7,500 to $9,999 | 0 (0.0%) | 32 (3.9%) |
| $10,000 to $12,499 | 40 (8.0%) | 47 (5.8%) |
| $12,500 to $14,999 | 15 (3.0%) | 44 (5.4%) |
| $15,000 to $17,499 | 31 (6.2%) | 21 (2.6%) |
| $17,500 to $19,999 | 14 (2.8%) | 28 (3.4%) |
| $20,000 to $22,499 | 0 (0.0%) | 0 (0.0%) |
| $22,500 to $24,999 | 45 (9.0%) | 5 (0.6%) |
| $25,000 to $29,999 | 18 (3.6%) | 13 (1.6%) |
| $30,000 to $34,999 | 22 (4.4%) | 67 (8.2%) |
| $35,000 to $39,999 | 34 (6.8%) | 23 (2.8%) |
| $40,000 to $44,999 | 19 (3.8%) | 143 (17.5%) |
| $45,000 to $49,999 | 14 (2.8%) | 51 (6.3%) |
| $50,000 to $54,999 | 33 (6.6%) | 20 (2.5%) |
| $55,000 to $64,999 | 26 (5.2%) | 18 (2.2%) |
| $65,000 to $74,999 | 16 (3.2%) | 9 (1.1%) |
| $75,000 to $99,999 | 60 (12.0%) | 93 (11.4%) |
| $100,000+ | 82 (16.4%) | 0 (0.0%) |
| Total | 501 (100.0%) | 815 (100.0%) |
Earnings by Sex by Educational Attainment in Afton
Average earnings in Afton are $51,912 for men and $42,717 for women, a difference of 17.7%. Men with an educational attainment of bachelor's degree enjoy the highest average annual earnings of $78,167, while those with less than high school education earn the least with $23,958. Women with an educational attainment of graduate degree earn the most with the average annual earnings of $81,250, while those with college or associate's degree education have the smallest earnings of $42,589.
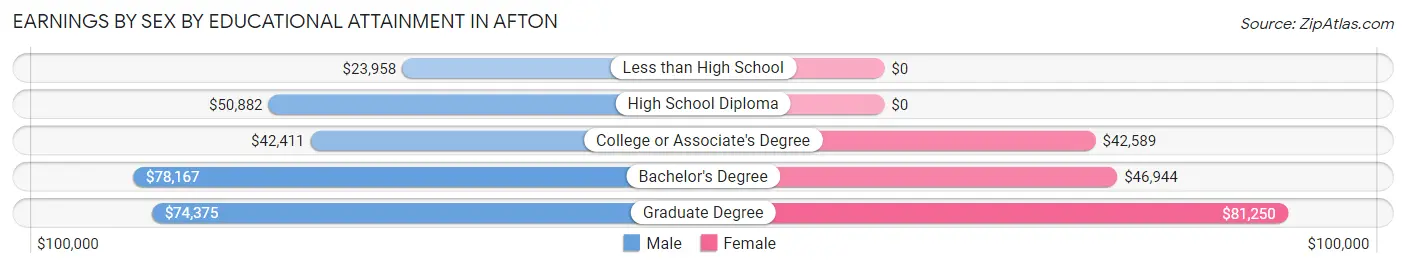
| Educational Attainment | Male Income | Female Income |
| Less than High School | $23,958 | $0 |
| High School Diploma | $50,882 | $0 |
| College or Associate's Degree | $42,411 | $42,589 |
| Bachelor's Degree | $78,167 | $46,944 |
| Graduate Degree | $74,375 | $81,250 |
| Total | $51,912 | $42,717 |
Family Income in Afton
Family Income Brackets in Afton
According to the Afton family income data, there are 126 families falling into the $75,000 to $99,999 income range, which is the most common income bracket and makes up 22.5% of all families. Conversely, the $25,000 to $34,999 income bracket is the least frequent group with only 16 families (2.9%) belonging to this category.
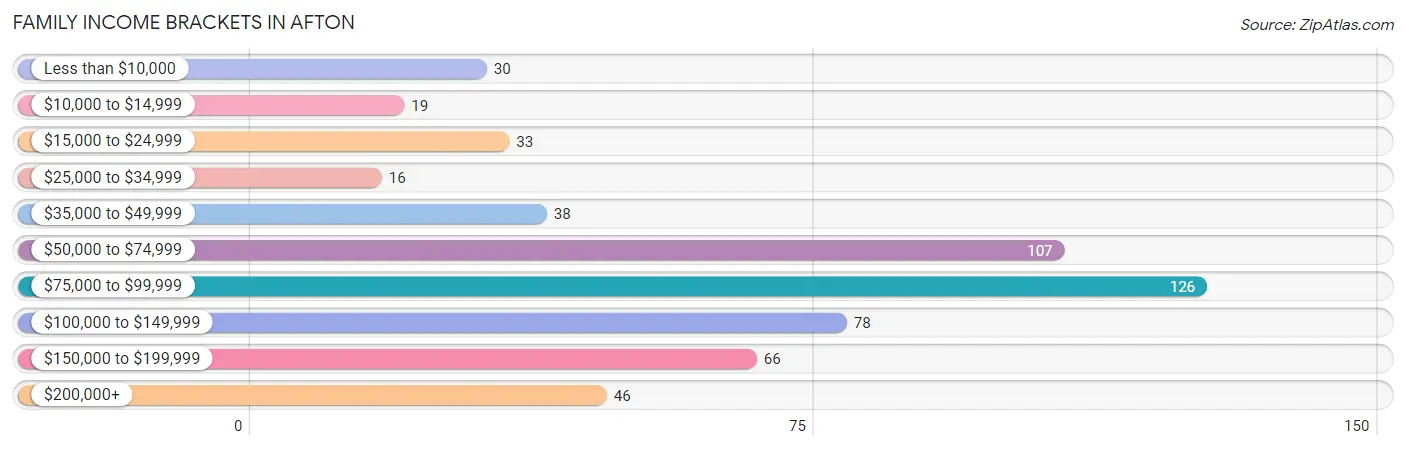
| Income Bracket | # Families | % Families |
| Less than $10,000 | 30 | 5.4% |
| $10,000 to $14,999 | 19 | 3.4% |
| $15,000 to $24,999 | 33 | 5.9% |
| $25,000 to $34,999 | 16 | 2.9% |
| $35,000 to $49,999 | 38 | 6.8% |
| $50,000 to $74,999 | 107 | 19.1% |
| $75,000 to $99,999 | 126 | 22.5% |
| $100,000 to $149,999 | 78 | 14.0% |
| $150,000 to $199,999 | 66 | 11.8% |
| $200,000+ | 46 | 8.2% |
Family Income by Famaliy Size in Afton
6-person families (33 | 5.9%) account for the highest median family income in Afton with $85,156 per family, while 2-person families (328 | 58.7%) have the highest median income of $39,297 per family member.
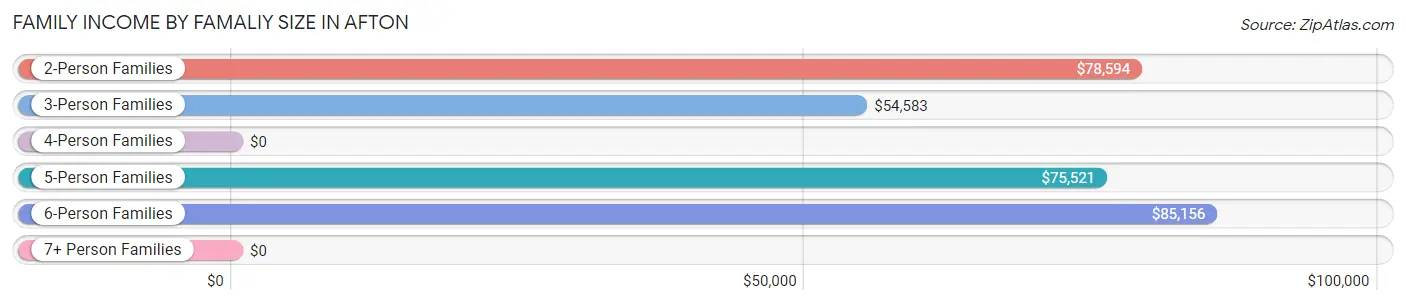
| Income Bracket | # Families | Median Income |
| 2-Person Families | 328 (58.7%) | $78,594 |
| 3-Person Families | 66 (11.8%) | $54,583 |
| 4-Person Families | 74 (13.2%) | $0 |
| 5-Person Families | 49 (8.8%) | $75,521 |
| 6-Person Families | 33 (5.9%) | $85,156 |
| 7+ Person Families | 9 (1.6%) | $0 |
| Total | 559 (100.0%) | $79,813 |
Family Income by Number of Earners in Afton
The median family income in Afton is $79,813, with families comprising 2 earners (225) having the highest median family income of $121,477, while families with 1 earner (178) have the lowest median family income of $41,406, accounting for 40.3% and 31.8% of families, respectively.
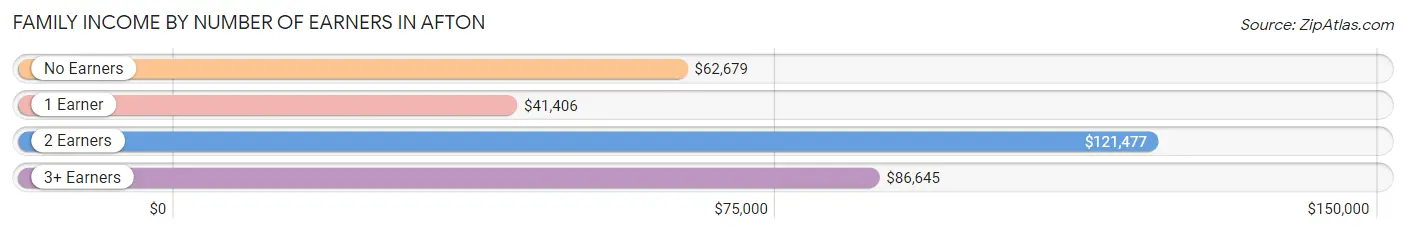
| Number of Earners | # Families | Median Income |
| No Earners | 83 (14.8%) | $62,679 |
| 1 Earner | 178 (31.8%) | $41,406 |
| 2 Earners | 225 (40.3%) | $121,477 |
| 3+ Earners | 73 (13.1%) | $86,645 |
| Total | 559 (100.0%) | $79,813 |
Household Income in Afton
Household Income Brackets in Afton
With 219 households falling in the category, the $35,000 to $49,999 income range is the most frequent in Afton, accounting for 23.5% of all households. In contrast, only 34 households (3.7%) fall into the $10,000 to $14,999 income bracket, making it the least populous group.
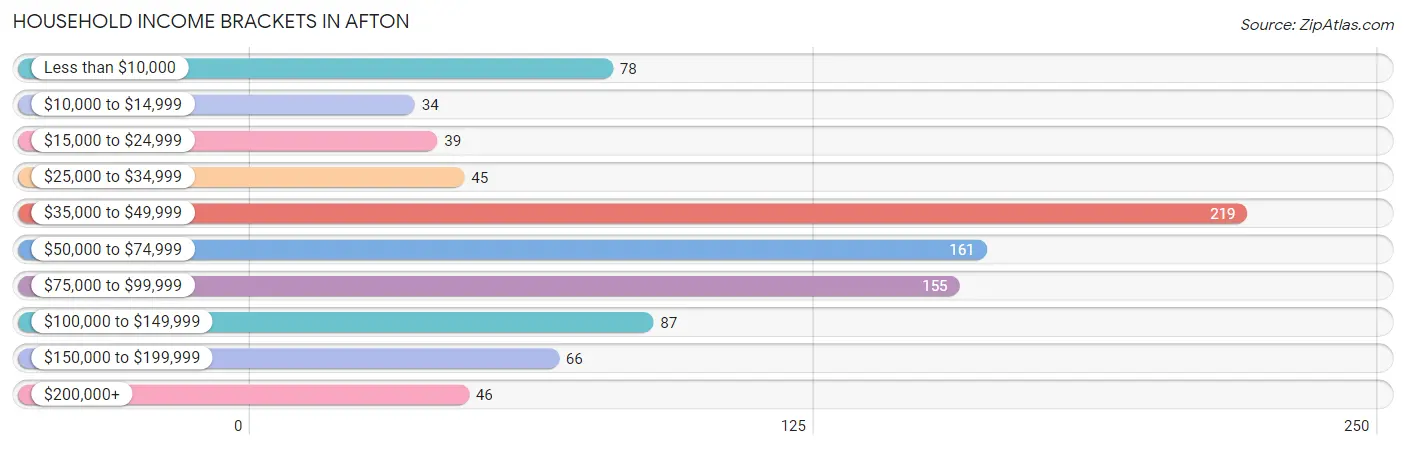
| Income Bracket | # Households | % Households |
| Less than $10,000 | 78 | 8.4% |
| $10,000 to $14,999 | 34 | 3.7% |
| $15,000 to $24,999 | 39 | 4.2% |
| $25,000 to $34,999 | 45 | 4.8% |
| $35,000 to $49,999 | 219 | 23.5% |
| $50,000 to $74,999 | 161 | 17.3% |
| $75,000 to $99,999 | 155 | 16.7% |
| $100,000 to $149,999 | 87 | 9.4% |
| $150,000 to $199,999 | 66 | 7.1% |
| $200,000+ | 46 | 4.9% |
Household Income by Householder Age in Afton
The median household income in Afton is $52,273, with the highest median household income of $59,231 found in the 25 to 44 years age bracket for the primary householder. A total of 248 households (26.7%) fall into this category. Meanwhile, the 15 to 24 years age bracket for the primary householder has the lowest median household income of $46,058, with 60 households (6.5%) in this group.
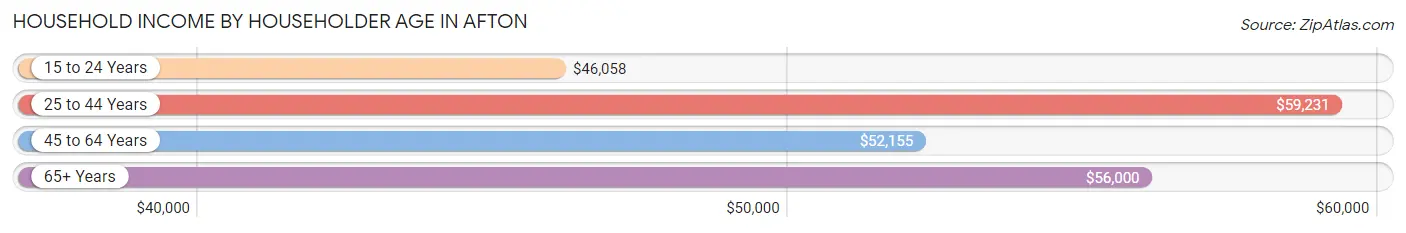
| Income Bracket | # Households | Median Income |
| 15 to 24 Years | 60 (6.5%) | $46,058 |
| 25 to 44 Years | 248 (26.7%) | $59,231 |
| 45 to 64 Years | 354 (38.1%) | $52,155 |
| 65+ Years | 268 (28.8%) | $56,000 |
| Total | 930 (100.0%) | $52,273 |
Poverty in Afton
Income Below Poverty by Sex and Age in Afton
With 10.0% poverty level for males and 19.8% for females among the residents of Afton, under 5 year old males and 5 year old females are the most vulnerable to poverty, with 31 males (23.0%) and 5 females (100.0%) in their respective age groups living below the poverty level.
| Age Bracket | Male | Female |
| Under 5 Years | 31 (23.0%) | 6 (6.1%) |
| 5 Years | 0 (0.0%) | 5 (100.0%) |
| 6 to 11 Years | 1 (1.7%) | 74 (55.2%) |
| 12 to 14 Years | 4 (11.1%) | 0 (0.0%) |
| 15 Years | 0 (0.0%) | 0 (0.0%) |
| 16 and 17 Years | 4 (11.4%) | 9 (33.3%) |
| 18 to 24 Years | 18 (17.1%) | 25 (13.1%) |
| 25 to 34 Years | 22 (21.1%) | 68 (40.2%) |
| 35 to 44 Years | 5 (5.9%) | 19 (31.7%) |
| 45 to 54 Years | 0 (0.0%) | 0 (0.0%) |
| 55 to 64 Years | 0 (0.0%) | 30 (13.1%) |
| 65 to 74 Years | 1 (1.0%) | 0 (0.0%) |
| 75 Years and over | 8 (10.5%) | 25 (21.7%) |
| Total | 94 (10.0%) | 261 (19.8%) |
Income Above Poverty by Sex and Age in Afton
According to the poverty statistics in Afton, males aged 5 years and females aged 12 to 14 years are the age groups that are most secure financially, with 100.0% of males and 100.0% of females in these age groups living above the poverty line.
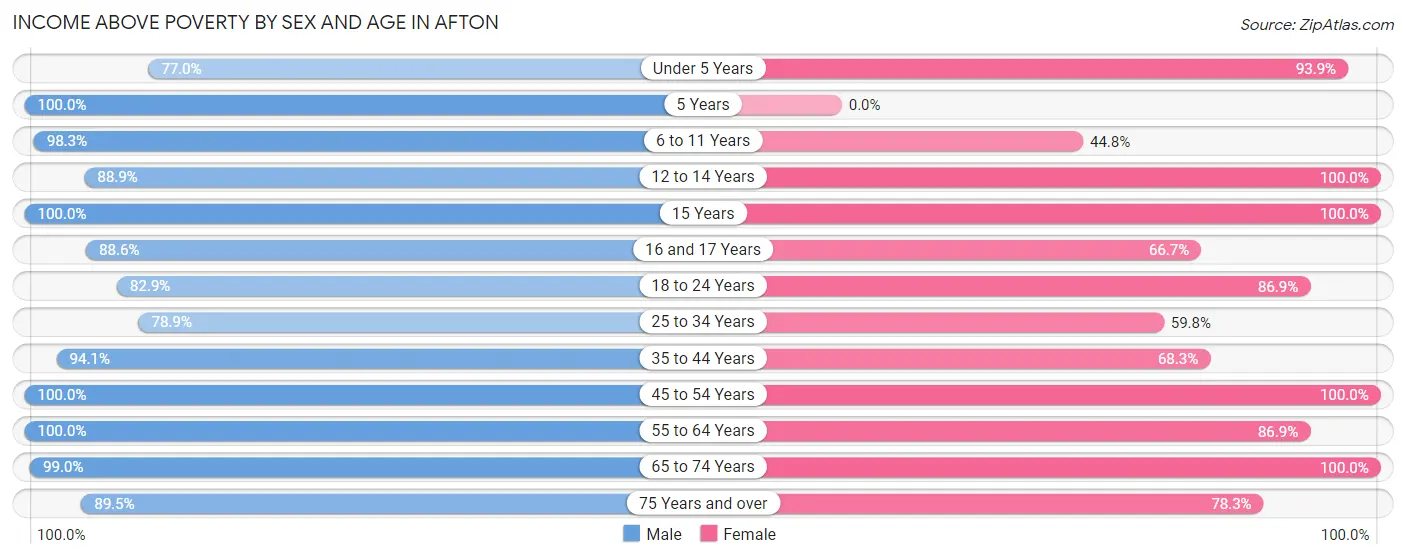
| Age Bracket | Male | Female |
| Under 5 Years | 104 (77.0%) | 93 (93.9%) |
| 5 Years | 13 (100.0%) | 0 (0.0%) |
| 6 to 11 Years | 57 (98.3%) | 60 (44.8%) |
| 12 to 14 Years | 32 (88.9%) | 7 (100.0%) |
| 15 Years | 9 (100.0%) | 16 (100.0%) |
| 16 and 17 Years | 31 (88.6%) | 18 (66.7%) |
| 18 to 24 Years | 87 (82.9%) | 166 (86.9%) |
| 25 to 34 Years | 82 (78.8%) | 101 (59.8%) |
| 35 to 44 Years | 79 (94.1%) | 41 (68.3%) |
| 45 to 54 Years | 107 (100.0%) | 130 (100.0%) |
| 55 to 64 Years | 82 (100.0%) | 199 (86.9%) |
| 65 to 74 Years | 96 (99.0%) | 139 (100.0%) |
| 75 Years and over | 68 (89.5%) | 90 (78.3%) |
| Total | 847 (90.0%) | 1,060 (80.2%) |
Income Below Poverty Among Married-Couple Families in Afton
The poverty statistics for married-couple families in Afton show that 5.5% or 23 of the total 417 families live below the poverty line. Families with 1 or 2 children have the highest poverty rate of 14.5%, comprising of 12 families. On the other hand, families with 5 or more children have the lowest poverty rate of 0.0%, which includes 0 families.
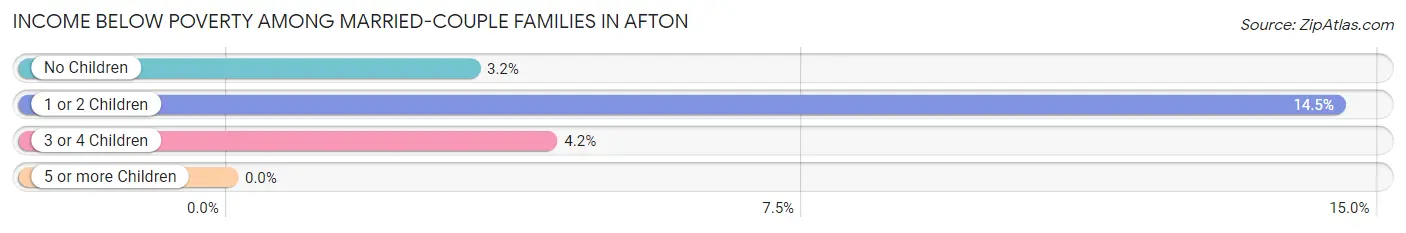
| Children | Above Poverty | Below Poverty |
| No Children | 245 (96.8%) | 8 (3.2%) |
| 1 or 2 Children | 71 (85.5%) | 12 (14.5%) |
| 3 or 4 Children | 69 (95.8%) | 3 (4.2%) |
| 5 or more Children | 9 (100.0%) | 0 (0.0%) |
| Total | 394 (94.5%) | 23 (5.5%) |
Income Below Poverty Among Single-Parent Households in Afton
According to the poverty data in Afton, 14.3% or 6 single-father households and 34.0% or 34 single-mother households are living below the poverty line. Among single-father households, those with 1 or 2 children have the highest poverty rate, with 6 households (30.0%) experiencing poverty. Likewise, among single-mother households, those with 3 or 4 children have the highest poverty rate, with 3 households (100.0%) falling below the poverty line.
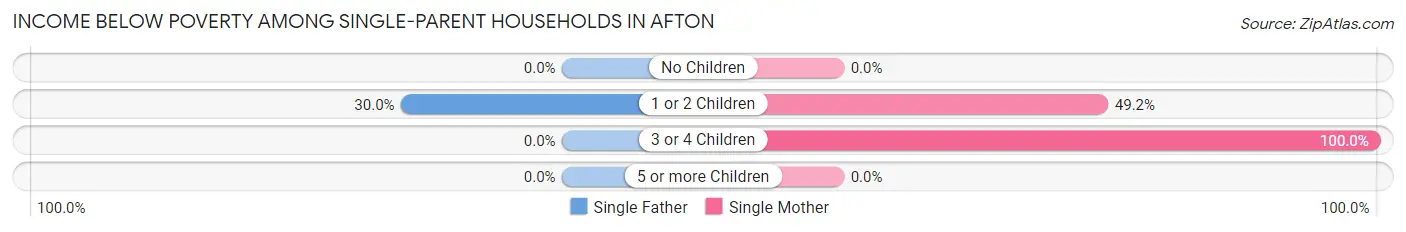
| Children | Single Father | Single Mother |
| No Children | 0 (0.0%) | 0 (0.0%) |
| 1 or 2 Children | 6 (30.0%) | 31 (49.2%) |
| 3 or 4 Children | 0 (0.0%) | 3 (100.0%) |
| 5 or more Children | 0 (0.0%) | 0 (0.0%) |
| Total | 6 (14.3%) | 34 (34.0%) |
Income Below Poverty Among Married-Couple vs Single-Parent Households in Afton
The poverty data for Afton shows that 23 of the married-couple family households (5.5%) and 40 of the single-parent households (28.2%) are living below the poverty level. Within the married-couple family households, those with 1 or 2 children have the highest poverty rate, with 12 households (14.5%) falling below the poverty line. Among the single-parent households, those with 3 or 4 children have the highest poverty rate, with 3 household (100.0%) living below poverty.
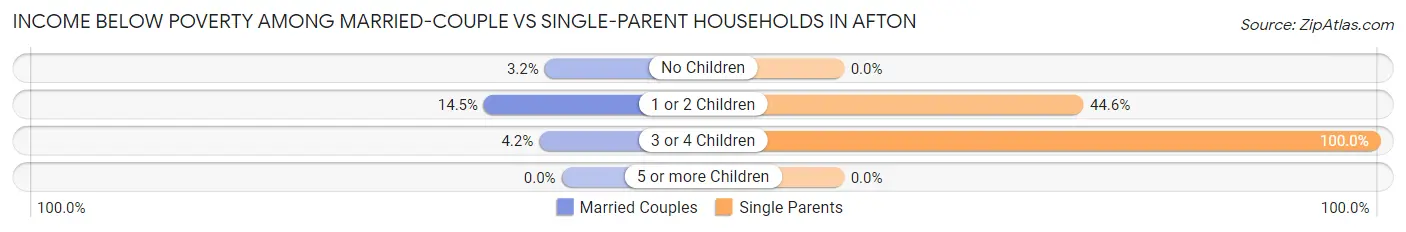
| Children | Married-Couple Families | Single-Parent Households |
| No Children | 8 (3.2%) | 0 (0.0%) |
| 1 or 2 Children | 12 (14.5%) | 37 (44.6%) |
| 3 or 4 Children | 3 (4.2%) | 3 (100.0%) |
| 5 or more Children | 0 (0.0%) | 0 (0.0%) |
| Total | 23 (5.5%) | 40 (28.2%) |
Race in Afton
The most populous races in Afton are White / Caucasian (2,037 | 88.4%), Hispanic or Latino (256 | 11.1%), and Two or more Races (225 | 9.8%).
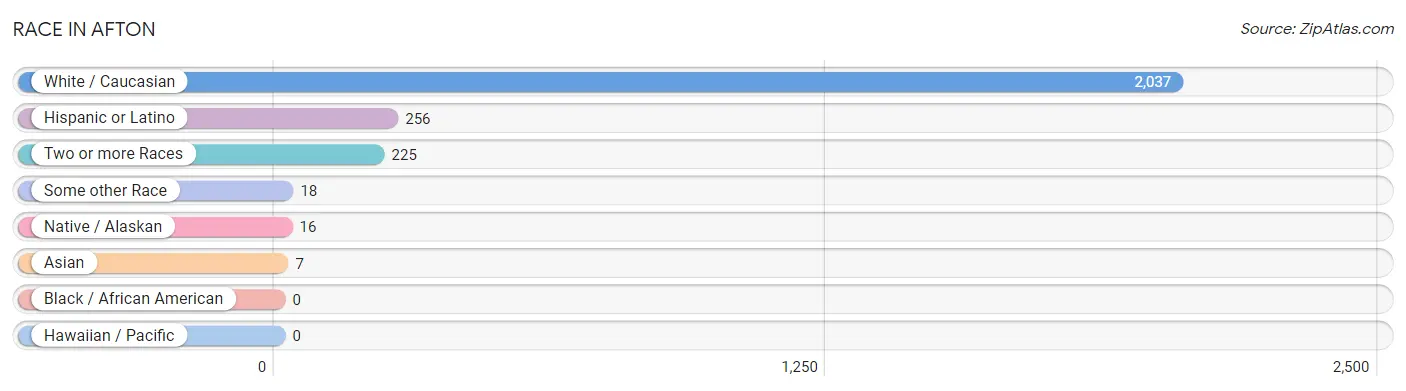
| Race | # Population | % Population |
| Asian | 7 | 0.3% |
| Black / African American | 0 | 0.0% |
| Hawaiian / Pacific | 0 | 0.0% |
| Hispanic or Latino | 256 | 11.1% |
| Native / Alaskan | 16 | 0.7% |
| White / Caucasian | 2,037 | 88.4% |
| Two or more Races | 225 | 9.8% |
| Some other Race | 18 | 0.8% |
| Total | 2,303 | 100.0% |
Ancestry in Afton
The most populous ancestries reported in Afton are English (929 | 40.3%), German (577 | 25.1%), Irish (298 | 12.9%), Mexican (171 | 7.4%), and Scotch-Irish (147 | 6.4%), together accounting for 92.1% of all Afton residents.
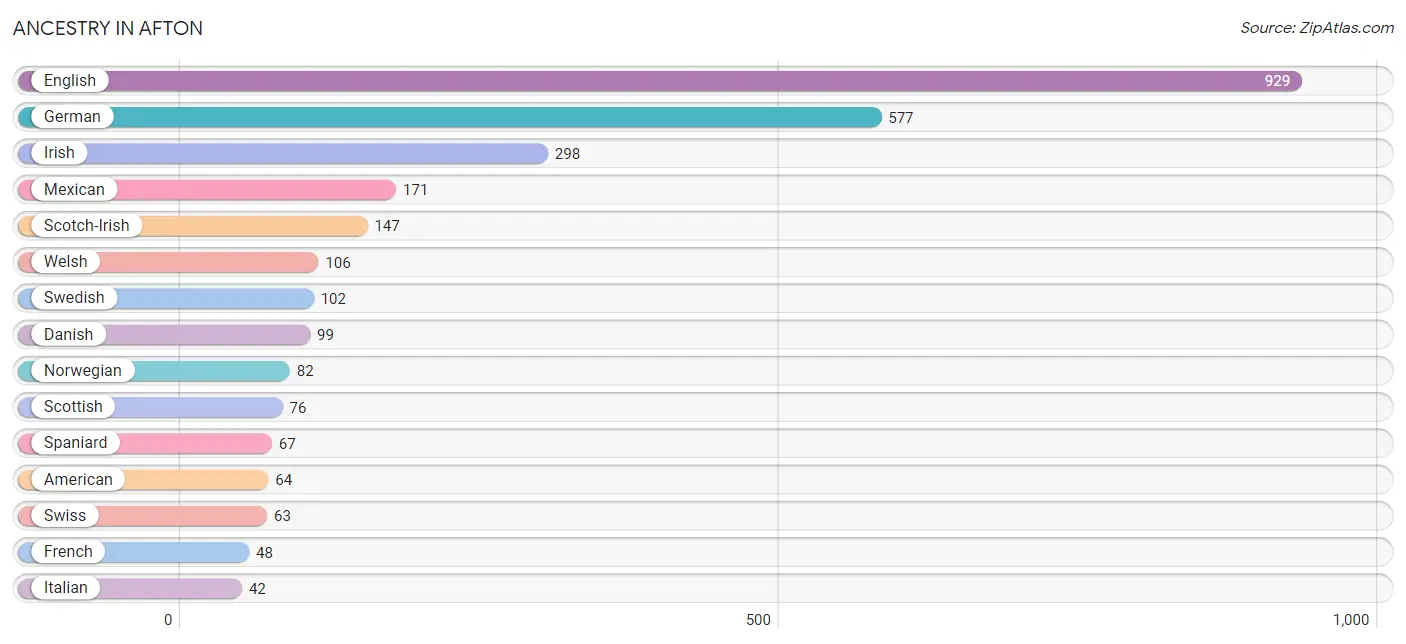
| Ancestry | # Population | % Population |
| American | 64 | 2.8% |
| Apache | 7 | 0.3% |
| Bhutanese | 5 | 0.2% |
| British | 10 | 0.4% |
| Cherokee | 16 | 0.7% |
| Danish | 99 | 4.3% |
| Dutch | 5 | 0.2% |
| English | 929 | 40.3% |
| European | 32 | 1.4% |
| French | 48 | 2.1% |
| French Canadian | 39 | 1.7% |
| German | 577 | 25.1% |
| Hungarian | 14 | 0.6% |
| Irish | 298 | 12.9% |
| Italian | 42 | 1.8% |
| Korean | 35 | 1.5% |
| Mexican | 171 | 7.4% |
| Navajo | 7 | 0.3% |
| Norwegian | 82 | 3.6% |
| Polish | 12 | 0.5% |
| Scotch-Irish | 147 | 6.4% |
| Scottish | 76 | 3.3% |
| Shoshone | 15 | 0.6% |
| Spaniard | 67 | 2.9% |
| Spanish | 18 | 0.8% |
| Swedish | 102 | 4.4% |
| Swiss | 63 | 2.7% |
| Ute | 12 | 0.5% |
| Welsh | 106 | 4.6% | View All 29 Rows |
Immigrants in Afton
The most numerous immigrant groups reported in Afton came from Europe (34 | 1.5%), Northern Europe (34 | 1.5%), England (19 | 0.8%), Central America (17 | 0.7%), and Latin America (17 | 0.7%), together accounting for 5.3% of all Afton residents.
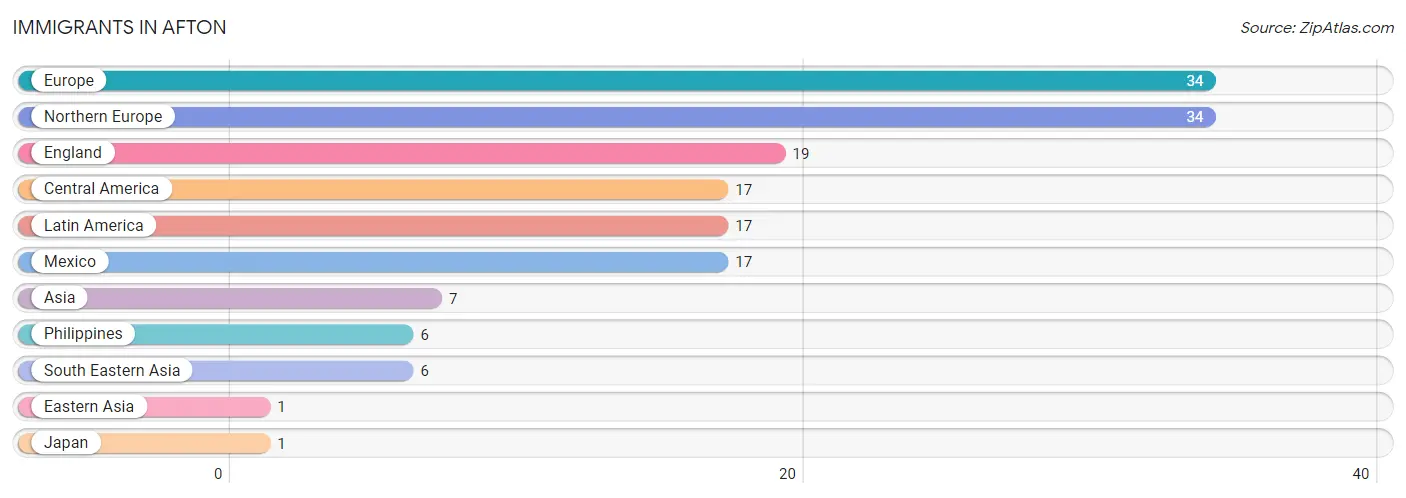
| Immigration Origin | # Population | % Population |
| Asia | 7 | 0.3% |
| Central America | 17 | 0.7% |
| Eastern Asia | 1 | 0.0% |
| England | 19 | 0.8% |
| Europe | 34 | 1.5% |
| Japan | 1 | 0.0% |
| Latin America | 17 | 0.7% |
| Mexico | 17 | 0.7% |
| Northern Europe | 34 | 1.5% |
| Philippines | 6 | 0.3% |
| South Eastern Asia | 6 | 0.3% | View All 11 Rows |
Sex and Age in Afton
Sex and Age in Afton
The most populous age groups in Afton are Under 5 Years (135 | 14.1%) for men and 55 to 59 Years (180 | 13.4%) for women.
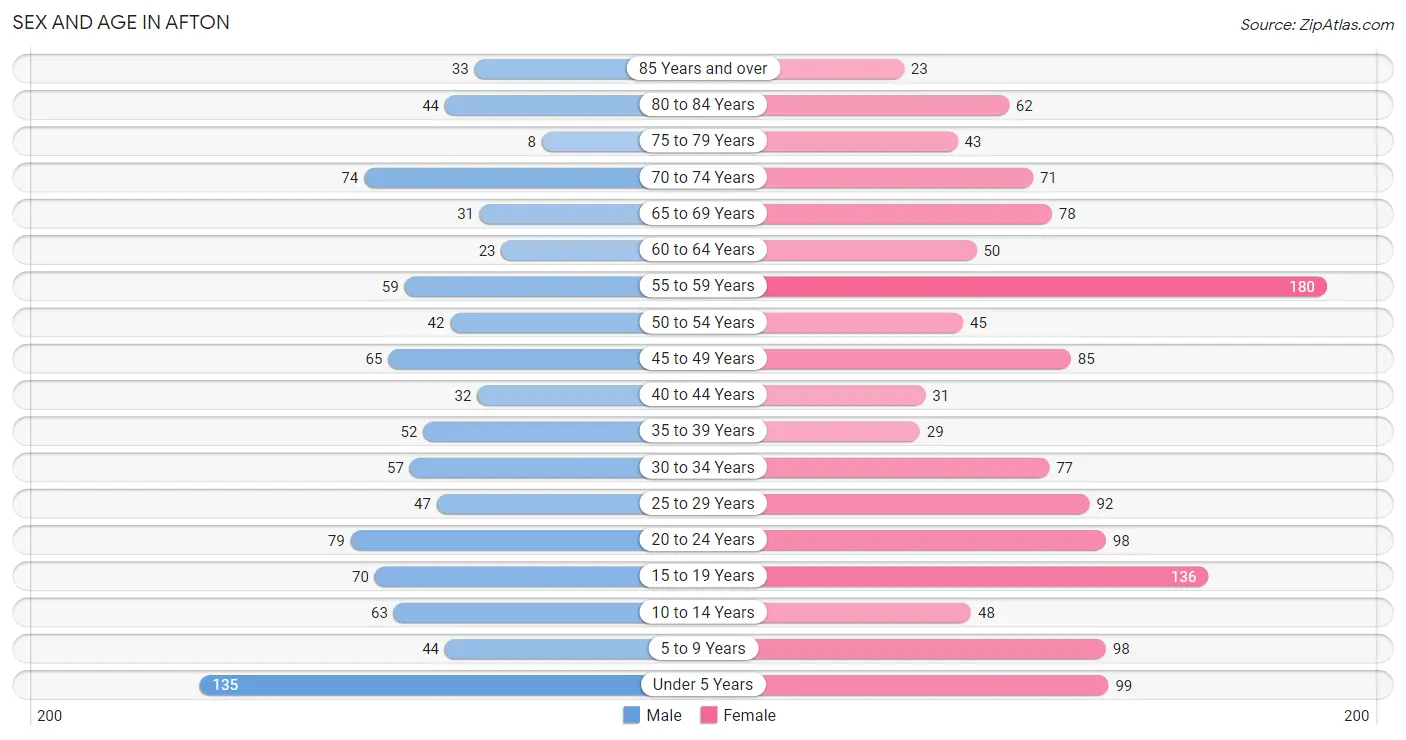
| Age Bracket | Male | Female |
| Under 5 Years | 135 (14.1%) | 99 (7.4%) |
| 5 to 9 Years | 44 (4.6%) | 98 (7.3%) |
| 10 to 14 Years | 63 (6.6%) | 48 (3.6%) |
| 15 to 19 Years | 70 (7.3%) | 136 (10.1%) |
| 20 to 24 Years | 79 (8.3%) | 98 (7.3%) |
| 25 to 29 Years | 47 (4.9%) | 92 (6.8%) |
| 30 to 34 Years | 57 (5.9%) | 77 (5.7%) |
| 35 to 39 Years | 52 (5.4%) | 29 (2.2%) |
| 40 to 44 Years | 32 (3.3%) | 31 (2.3%) |
| 45 to 49 Years | 65 (6.8%) | 85 (6.3%) |
| 50 to 54 Years | 42 (4.4%) | 45 (3.4%) |
| 55 to 59 Years | 59 (6.2%) | 180 (13.4%) |
| 60 to 64 Years | 23 (2.4%) | 50 (3.7%) |
| 65 to 69 Years | 31 (3.2%) | 78 (5.8%) |
| 70 to 74 Years | 74 (7.7%) | 71 (5.3%) |
| 75 to 79 Years | 8 (0.8%) | 43 (3.2%) |
| 80 to 84 Years | 44 (4.6%) | 62 (4.6%) |
| 85 Years and over | 33 (3.4%) | 23 (1.7%) |
| Total | 958 (100.0%) | 1,345 (100.0%) |
Families and Households in Afton
Median Family Size in Afton
The median family size in Afton is 3.21 persons per family, with single male/father families (42 | 7.5%) accounting for the largest median family size of 3.45 persons per family. On the other hand, single female/mother families (100 | 17.9%) represent the smallest median family size with 2.47 persons per family.
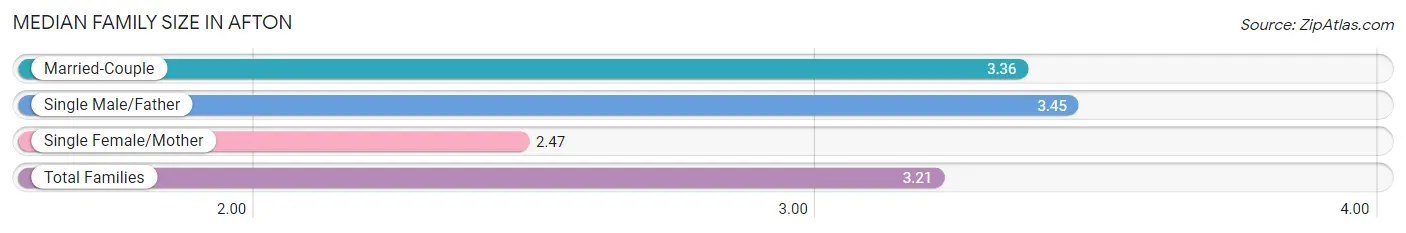
| Family Type | # Families | Family Size |
| Married-Couple | 417 (74.6%) | 3.36 |
| Single Male/Father | 42 (7.5%) | 3.45 |
| Single Female/Mother | 100 (17.9%) | 2.47 |
| Total Families | 559 (100.0%) | 3.21 |
Median Household Size in Afton
The median household size in Afton is 2.43 persons per household, with single male/father households (42 | 4.5%) accounting for the largest median household size of 3.86 persons per household. non-family households (371 | 39.9%) represent the smallest median household size with 1.10 persons per household.
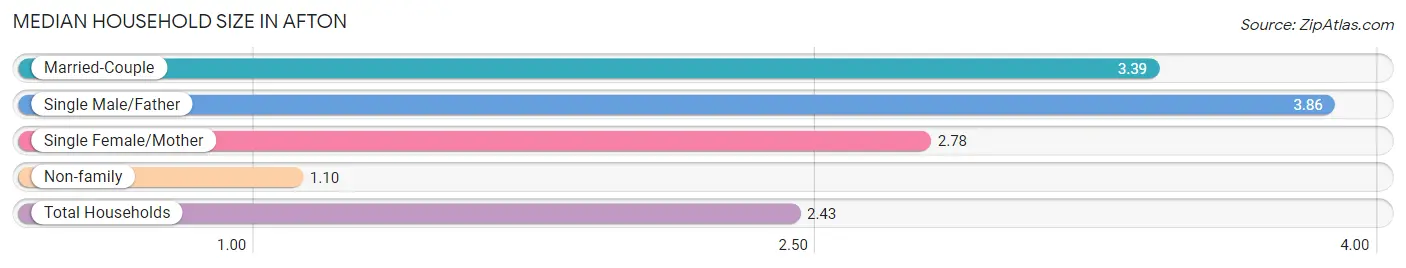
| Household Type | # Households | Household Size |
| Married-Couple | 417 (44.8%) | 3.39 |
| Single Male/Father | 42 (4.5%) | 3.86 |
| Single Female/Mother | 100 (10.7%) | 2.78 |
| Non-family | 371 (39.9%) | 1.10 |
| Total Households | 930 (100.0%) | 2.43 |
Household Size by Marriage Status in Afton
Out of a total of 930 households in Afton, 559 (60.1%) are family households, while 371 (39.9%) are nonfamily households. The most numerous type of family households are 2-person households, comprising 298, and the most common type of nonfamily households are 1-person households, comprising 328.
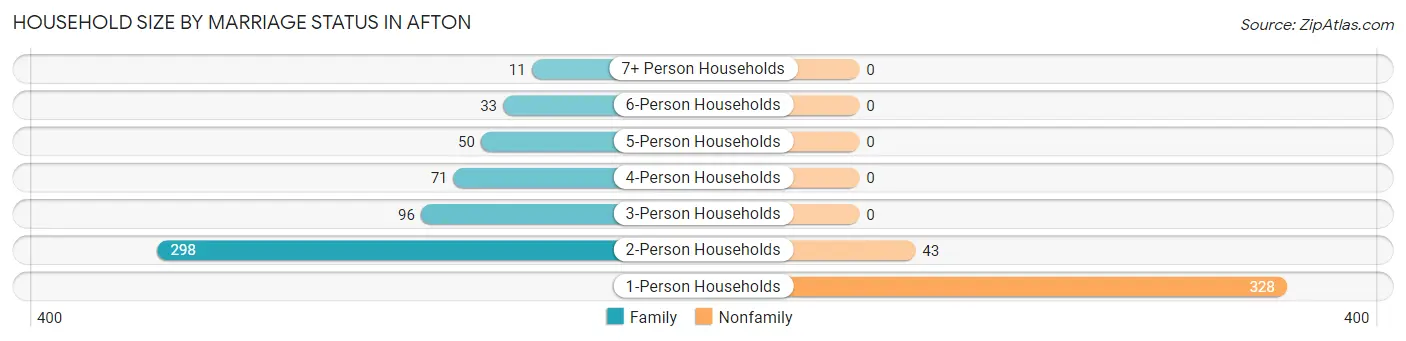
| Household Size | Family Households | Nonfamily Households |
| 1-Person Households | - | 328 (35.3%) |
| 2-Person Households | 298 (32.0%) | 43 (4.6%) |
| 3-Person Households | 96 (10.3%) | 0 (0.0%) |
| 4-Person Households | 71 (7.6%) | 0 (0.0%) |
| 5-Person Households | 50 (5.4%) | 0 (0.0%) |
| 6-Person Households | 33 (3.5%) | 0 (0.0%) |
| 7+ Person Households | 11 (1.2%) | 0 (0.0%) |
| Total | 559 (60.1%) | 371 (39.9%) |
Female Fertility in Afton
Fertility by Age in Afton
Average fertility rate in Afton is 128.0 births per 1,000 women. Women in the age bracket of 15 to 19 years have the highest fertility rate with 191.0 births per 1,000 women. Women in the age bracket of 20 to 34 years acount for 50.0% of all women with births.
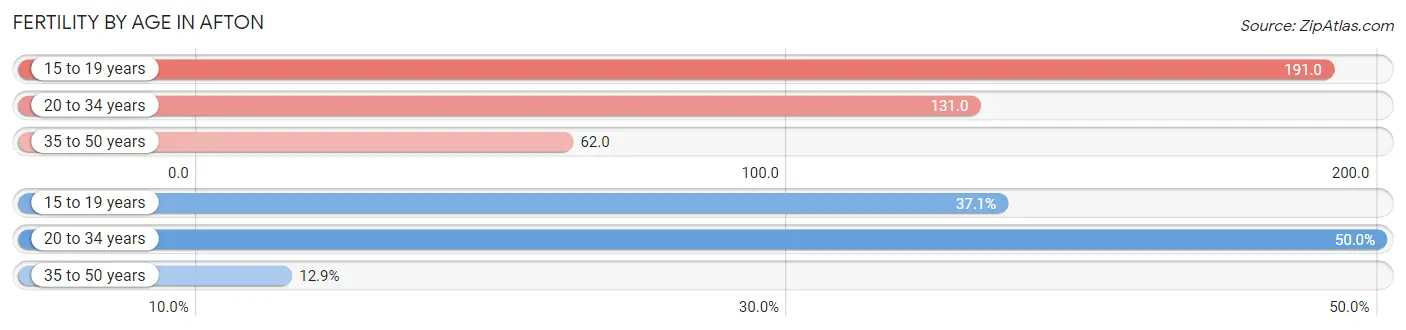
| Age Bracket | Women with Births | Births / 1,000 Women |
| 15 to 19 years | 26 (37.1%) | 191.0 |
| 20 to 34 years | 35 (50.0%) | 131.0 |
| 35 to 50 years | 9 (12.9%) | 62.0 |
| Total | 70 (100.0%) | 128.0 |
Fertility by Age by Marriage Status in Afton
38.6% of women with births (70) in Afton are married. The highest percentage of unmarried women with births falls into 15 to 19 years age bracket with 100.0% of them unmarried at the time of birth, while the lowest percentage of unmarried women with births belong to 35 to 50 years age bracket with 0.0% of them unmarried.
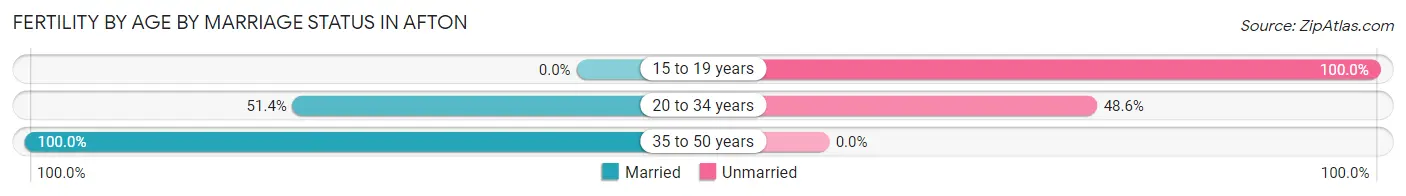
| Age Bracket | Married | Unmarried |
| 15 to 19 years | 0 (0.0%) | 26 (100.0%) |
| 20 to 34 years | 18 (51.4%) | 17 (48.6%) |
| 35 to 50 years | 9 (100.0%) | 0 (0.0%) |
| Total | 27 (38.6%) | 43 (61.4%) |
Fertility by Education in Afton
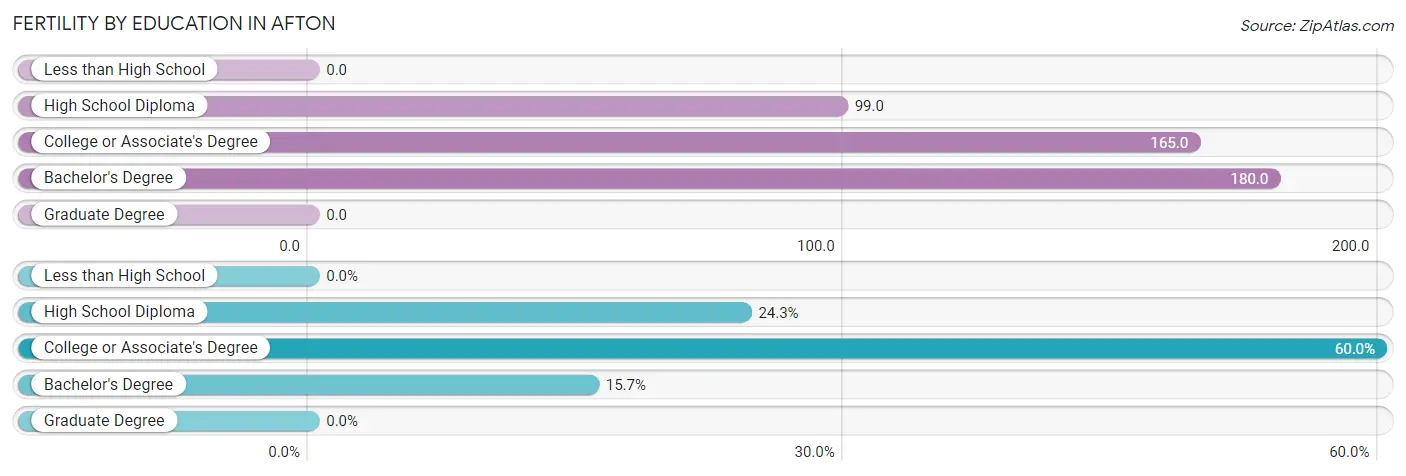
| Educational Attainment | Women with Births | Births / 1,000 Women |
| Less than High School | 0 (0.0%) | 0.0 |
| High School Diploma | 17 (24.3%) | 99.0 |
| College or Associate's Degree | 42 (60.0%) | 165.0 |
| Bachelor's Degree | 11 (15.7%) | 180.0 |
| Graduate Degree | 0 (0.0%) | 0.0 |
| Total | 70 (100.0%) | 128.0 |
Fertility by Education by Marriage Status in Afton
61.4% of women with births in Afton are unmarried. Women with the educational attainment of bachelor's degree are most likely to be married with 100.0% of them married at childbirth, while women with the educational attainment of high school diploma are least likely to be married with 100.0% of them unmarried at childbirth.
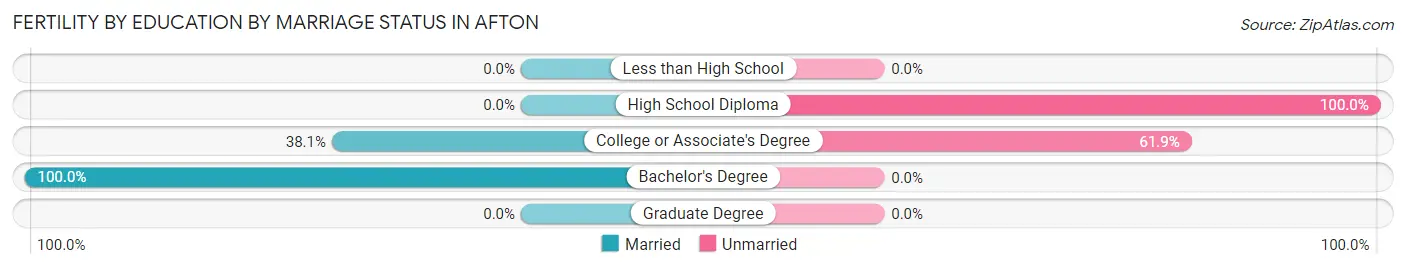
| Educational Attainment | Married | Unmarried |
| Less than High School | 0 (0.0%) | 0 (0.0%) |
| High School Diploma | 0 (0.0%) | 17 (100.0%) |
| College or Associate's Degree | 16 (38.1%) | 26 (61.9%) |
| Bachelor's Degree | 11 (100.0%) | 0 (0.0%) |
| Graduate Degree | 0 (0.0%) | 0 (0.0%) |
| Total | 27 (38.6%) | 43 (61.4%) |
Employment Characteristics in Afton
Employment by Class of Employer in Afton
Among the 1,230 employed individuals in Afton, private company employees (703 | 57.2%), local government employees (208 | 16.9%), and self-employed (not incorporated) (148 | 12.0%) make up the most common classes of employment.
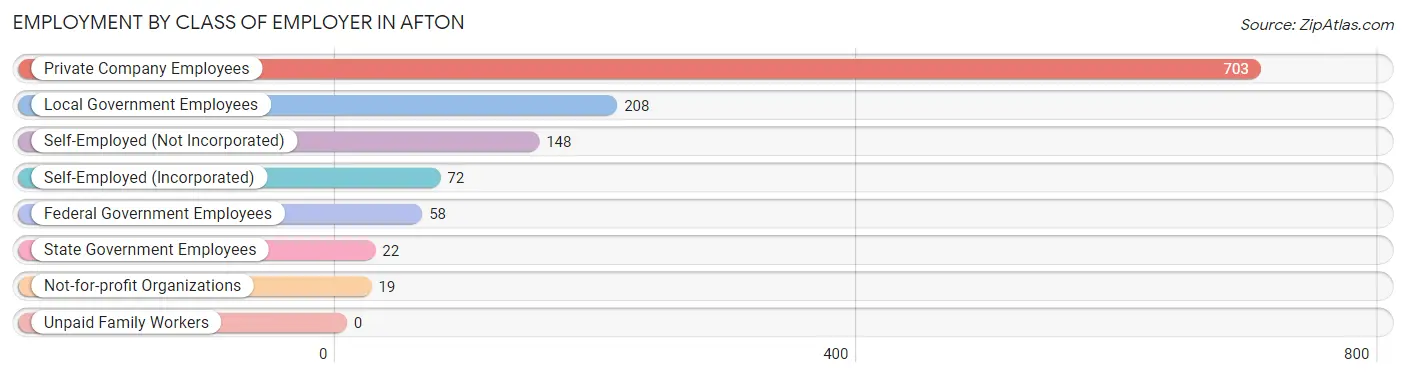
| Employer Class | # Employees | % Employees |
| Private Company Employees | 703 | 57.2% |
| Self-Employed (Incorporated) | 72 | 5.9% |
| Self-Employed (Not Incorporated) | 148 | 12.0% |
| Not-for-profit Organizations | 19 | 1.5% |
| Local Government Employees | 208 | 16.9% |
| State Government Employees | 22 | 1.8% |
| Federal Government Employees | 58 | 4.7% |
| Unpaid Family Workers | 0 | 0.0% |
| Total | 1,230 | 100.0% |
Employment Status by Age in Afton
According to the labor force statistics for Afton, out of the total population over 16 years of age (1,791), 74.4% or 1,333 individuals are in the labor force, with 6.3% or 84 of them unemployed. The age group with the highest labor force participation rate is 35 to 44 years, with 100.0% or 144 individuals in the labor force. Within the labor force, the 20 to 24 years age range has the highest percentage of unemployed individuals, with 33.7% or 57 of them being unemployed.
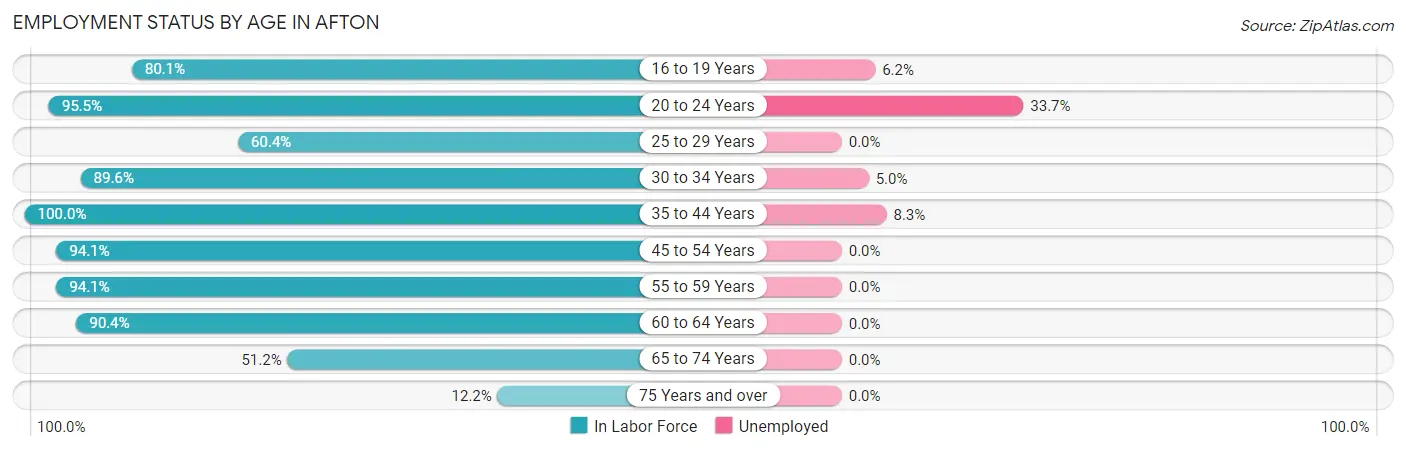
| Age Bracket | In Labor Force | Unemployed |
| 16 to 19 Years | 145 (80.1%) | 9 (6.2%) |
| 20 to 24 Years | 169 (95.5%) | 57 (33.7%) |
| 25 to 29 Years | 84 (60.4%) | 0 (0.0%) |
| 30 to 34 Years | 120 (89.6%) | 6 (5.0%) |
| 35 to 44 Years | 144 (100.0%) | 12 (8.3%) |
| 45 to 54 Years | 223 (94.1%) | 0 (0.0%) |
| 55 to 59 Years | 225 (94.1%) | 0 (0.0%) |
| 60 to 64 Years | 66 (90.4%) | 0 (0.0%) |
| 65 to 74 Years | 130 (51.2%) | 0 (0.0%) |
| 75 Years and over | 26 (12.2%) | 0 (0.0%) |
| Total | 1,333 (74.4%) | 84 (6.3%) |
Employment Status by Educational Attainment in Afton
According to labor force statistics for Afton, 89.2% of individuals (862) out of the total population between 25 and 64 years of age (966) are in the labor force, with 2.1% or 18 of them being unemployed. The group with the highest labor force participation rate are those with the educational attainment of bachelor's degree or higher, with 96.5% or 220 individuals in the labor force. Within the labor force, individuals with high school diploma education have the highest percentage of unemployment, with 8.6% or 18 of them being unemployed.
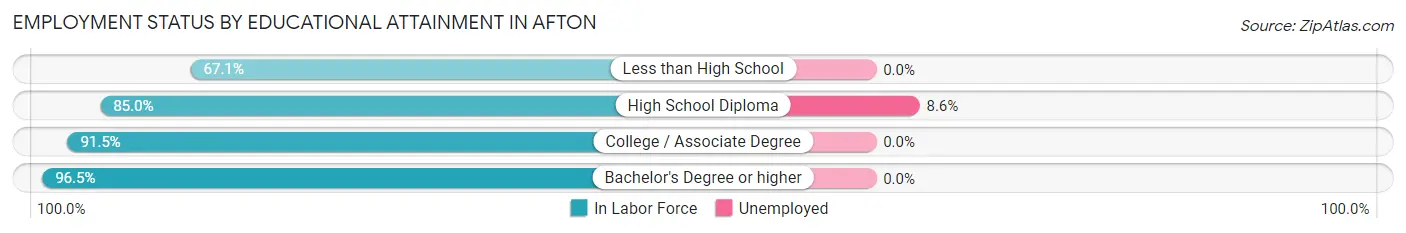
| Educational Attainment | In Labor Force | Unemployed |
| Less than High School | 47 (67.1%) | 0 (0.0%) |
| High School Diploma | 209 (85.0%) | 21 (8.6%) |
| College / Associate Degree | 386 (91.5%) | 0 (0.0%) |
| Bachelor's Degree or higher | 220 (96.5%) | 0 (0.0%) |
| Total | 862 (89.2%) | 20 (2.1%) |
Employment Occupations by Sex in Afton
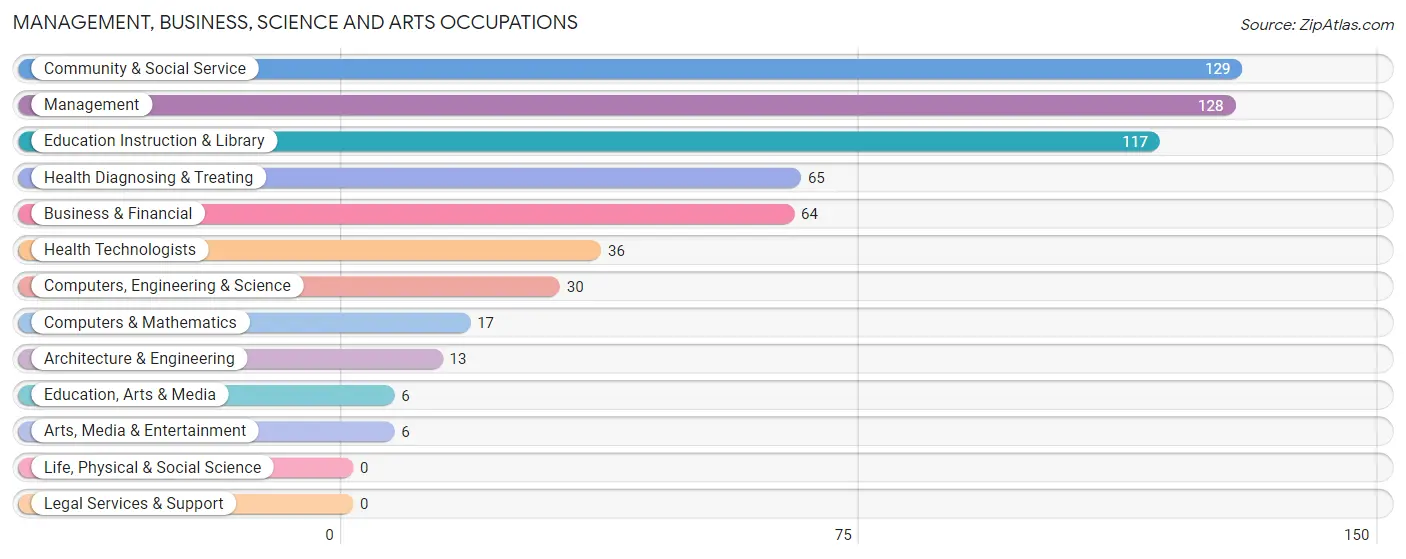
Management, Business, Science and Arts Occupations
The most common Management, Business, Science and Arts occupations in Afton are Community & Social Service (129 | 10.3%), Management (128 | 10.3%), Education Instruction & Library (117 | 9.4%), Health Diagnosing & Treating (65 | 5.2%), and Business & Financial (64 | 5.1%).
Management, Business, Science and Arts Occupations by Sex
Within the Management, Business, Science and Arts occupations in Afton, the most male-oriented occupations are Education, Arts & Media (100.0%), Management (71.1%), and Computers & Mathematics (64.7%), while the most female-oriented occupations are Business & Financial (100.0%), Architecture & Engineering (100.0%), and Arts, Media & Entertainment (100.0%).
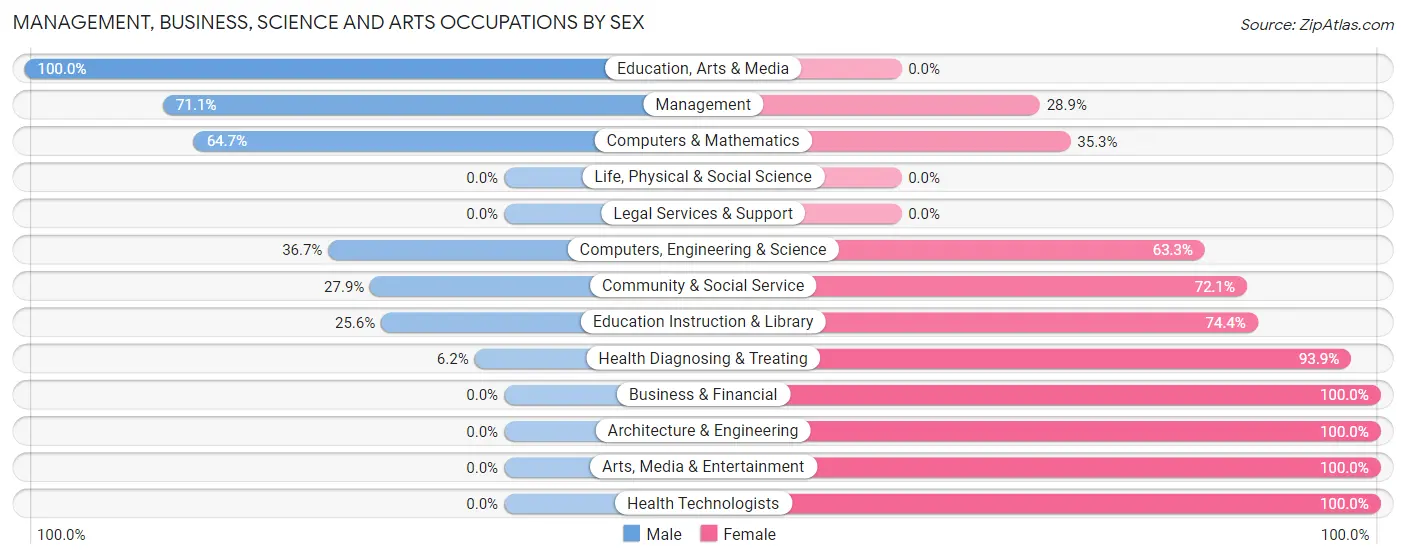
| Occupation | Male | Female |
| Management | 91 (71.1%) | 37 (28.9%) |
| Business & Financial | 0 (0.0%) | 64 (100.0%) |
| Computers, Engineering & Science | 11 (36.7%) | 19 (63.3%) |
| Computers & Mathematics | 11 (64.7%) | 6 (35.3%) |
| Architecture & Engineering | 0 (0.0%) | 13 (100.0%) |
| Life, Physical & Social Science | 0 (0.0%) | 0 (0.0%) |
| Community & Social Service | 36 (27.9%) | 93 (72.1%) |
| Education, Arts & Media | 6 (100.0%) | 0 (0.0%) |
| Legal Services & Support | 0 (0.0%) | 0 (0.0%) |
| Education Instruction & Library | 30 (25.6%) | 87 (74.4%) |
| Arts, Media & Entertainment | 0 (0.0%) | 6 (100.0%) |
| Health Diagnosing & Treating | 4 (6.1%) | 61 (93.9%) |
| Health Technologists | 0 (0.0%) | 36 (100.0%) |
| Total (Category) | 142 (34.1%) | 274 (65.9%) |
| Total (Overall) | 458 (36.7%) | 790 (63.3%) |
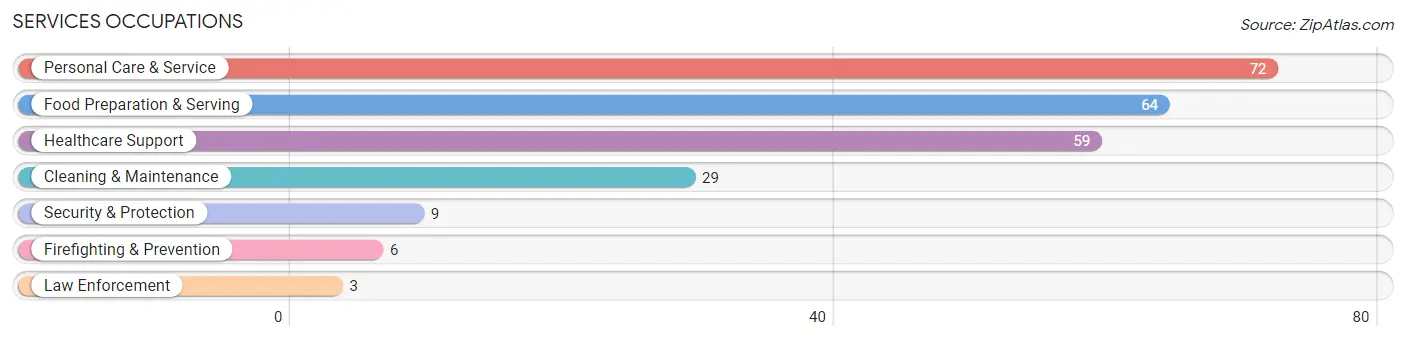
Services Occupations
The most common Services occupations in Afton are Personal Care & Service (72 | 5.8%), Food Preparation & Serving (64 | 5.1%), Healthcare Support (59 | 4.7%), Cleaning & Maintenance (29 | 2.3%), and Security & Protection (9 | 0.7%).
Services Occupations by Sex
Within the Services occupations in Afton, the most male-oriented occupations are Food Preparation & Serving (54.7%), and Cleaning & Maintenance (13.8%), while the most female-oriented occupations are Healthcare Support (100.0%), Security & Protection (100.0%), and Firefighting & Prevention (100.0%).
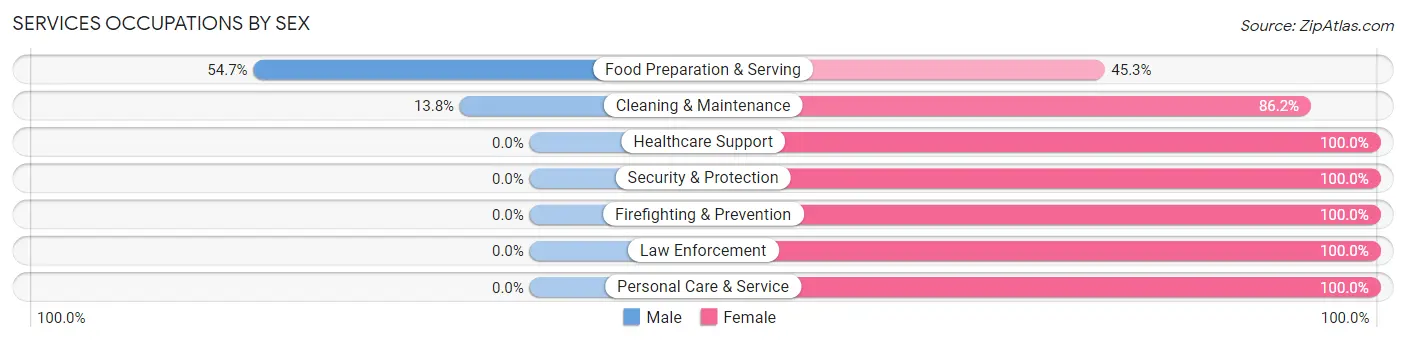
| Occupation | Male | Female |
| Healthcare Support | 0 (0.0%) | 59 (100.0%) |
| Security & Protection | 0 (0.0%) | 9 (100.0%) |
| Firefighting & Prevention | 0 (0.0%) | 6 (100.0%) |
| Law Enforcement | 0 (0.0%) | 3 (100.0%) |
| Food Preparation & Serving | 35 (54.7%) | 29 (45.3%) |
| Cleaning & Maintenance | 4 (13.8%) | 25 (86.2%) |
| Personal Care & Service | 0 (0.0%) | 72 (100.0%) |
| Total (Category) | 39 (16.7%) | 194 (83.3%) |
| Total (Overall) | 458 (36.7%) | 790 (63.3%) |
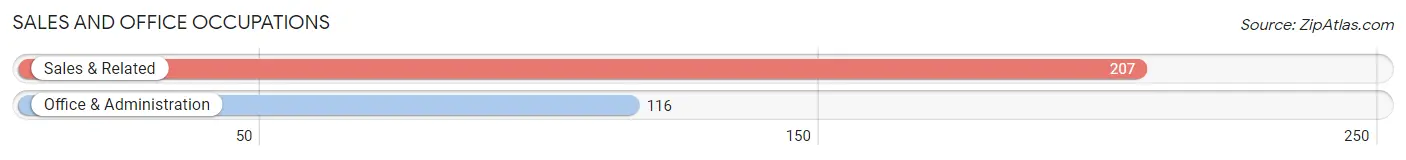
Sales and Office Occupations
The most common Sales and Office occupations in Afton are Sales & Related (207 | 16.6%), and Office & Administration (116 | 9.3%).
Sales and Office Occupations by Sex
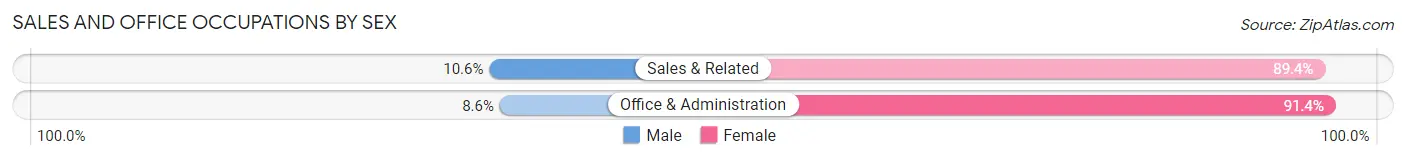
| Occupation | Male | Female |
| Sales & Related | 22 (10.6%) | 185 (89.4%) |
| Office & Administration | 10 (8.6%) | 106 (91.4%) |
| Total (Category) | 32 (9.9%) | 291 (90.1%) |
| Total (Overall) | 458 (36.7%) | 790 (63.3%) |
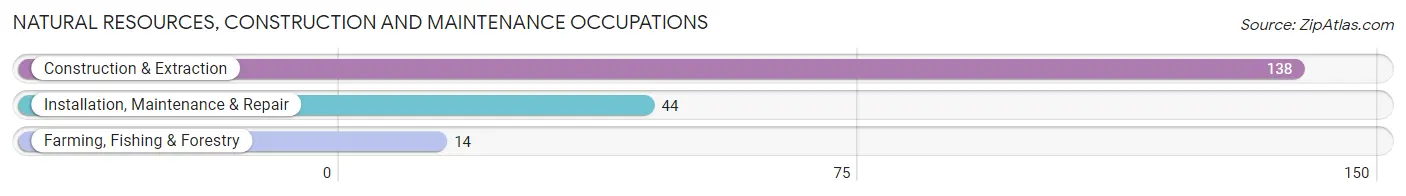
Natural Resources, Construction and Maintenance Occupations
The most common Natural Resources, Construction and Maintenance occupations in Afton are Construction & Extraction (138 | 11.1%), Installation, Maintenance & Repair (44 | 3.5%), and Farming, Fishing & Forestry (14 | 1.1%).
Natural Resources, Construction and Maintenance Occupations by Sex
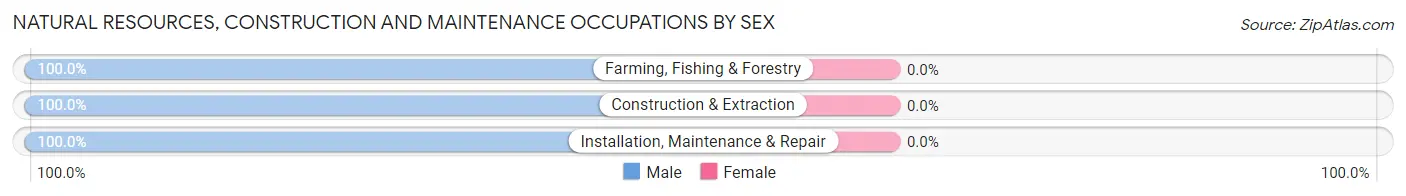
| Occupation | Male | Female |
| Farming, Fishing & Forestry | 14 (100.0%) | 0 (0.0%) |
| Construction & Extraction | 138 (100.0%) | 0 (0.0%) |
| Installation, Maintenance & Repair | 44 (100.0%) | 0 (0.0%) |
| Total (Category) | 196 (100.0%) | 0 (0.0%) |
| Total (Overall) | 458 (36.7%) | 790 (63.3%) |
Production, Transportation and Moving Occupations
The most common Production, Transportation and Moving occupations in Afton are Production (38 | 3.0%), Transportation (28 | 2.2%), and Material Moving (14 | 1.1%).
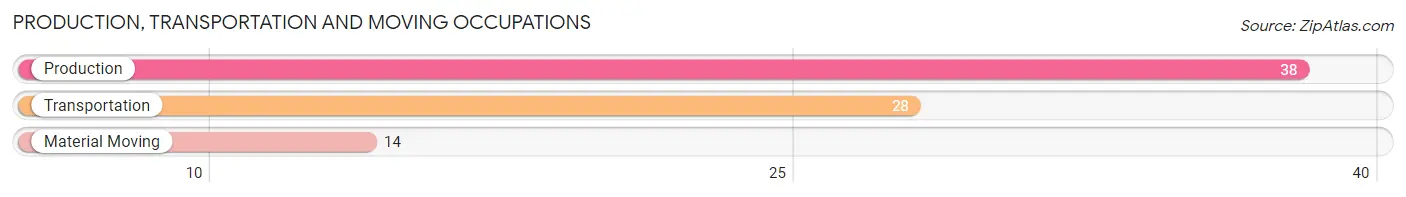
Production, Transportation and Moving Occupations by Sex
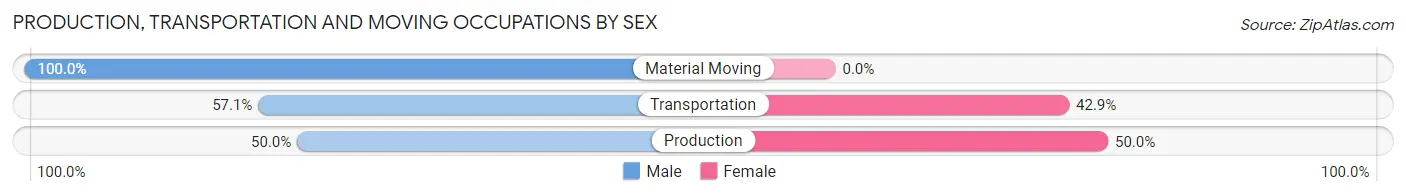
| Occupation | Male | Female |
| Production | 19 (50.0%) | 19 (50.0%) |
| Transportation | 16 (57.1%) | 12 (42.9%) |
| Material Moving | 14 (100.0%) | 0 (0.0%) |
| Total (Category) | 49 (61.3%) | 31 (38.8%) |
| Total (Overall) | 458 (36.7%) | 790 (63.3%) |
Employment Industries by Sex in Afton
Employment Industries in Afton
The major employment industries in Afton include Retail Trade (187 | 15.0%), Educational Services (174 | 13.9%), Manufacturing (170 | 13.6%), Construction (154 | 12.3%), and Health Care & Social Assistance (128 | 10.3%).
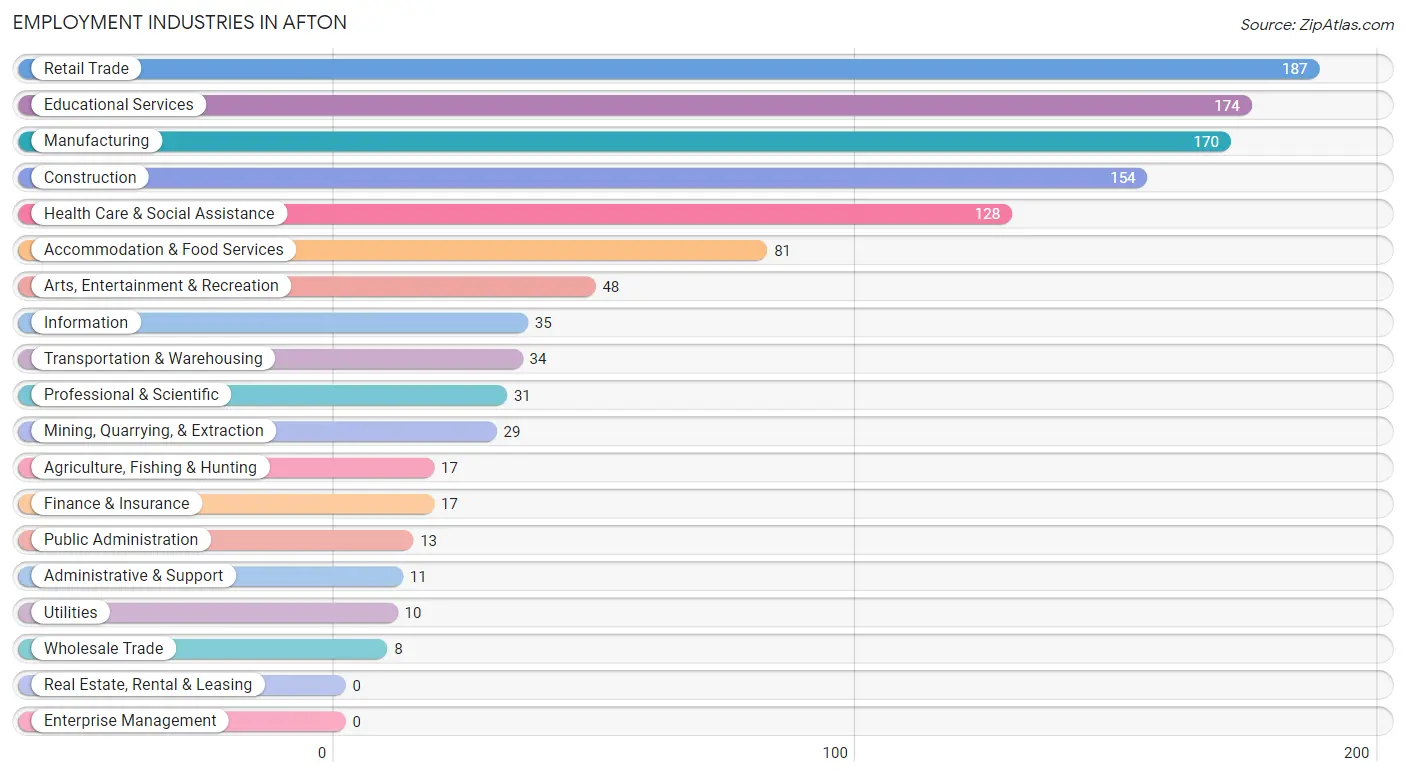
Employment Industries by Sex in Afton
The Afton industries that see more men than women are Mining, Quarrying, & Extraction (100.0%), Construction (100.0%), and Utilities (100.0%), whereas the industries that tend to have a higher number of women are Wholesale Trade (100.0%), Finance & Insurance (100.0%), and Administrative & Support (100.0%).
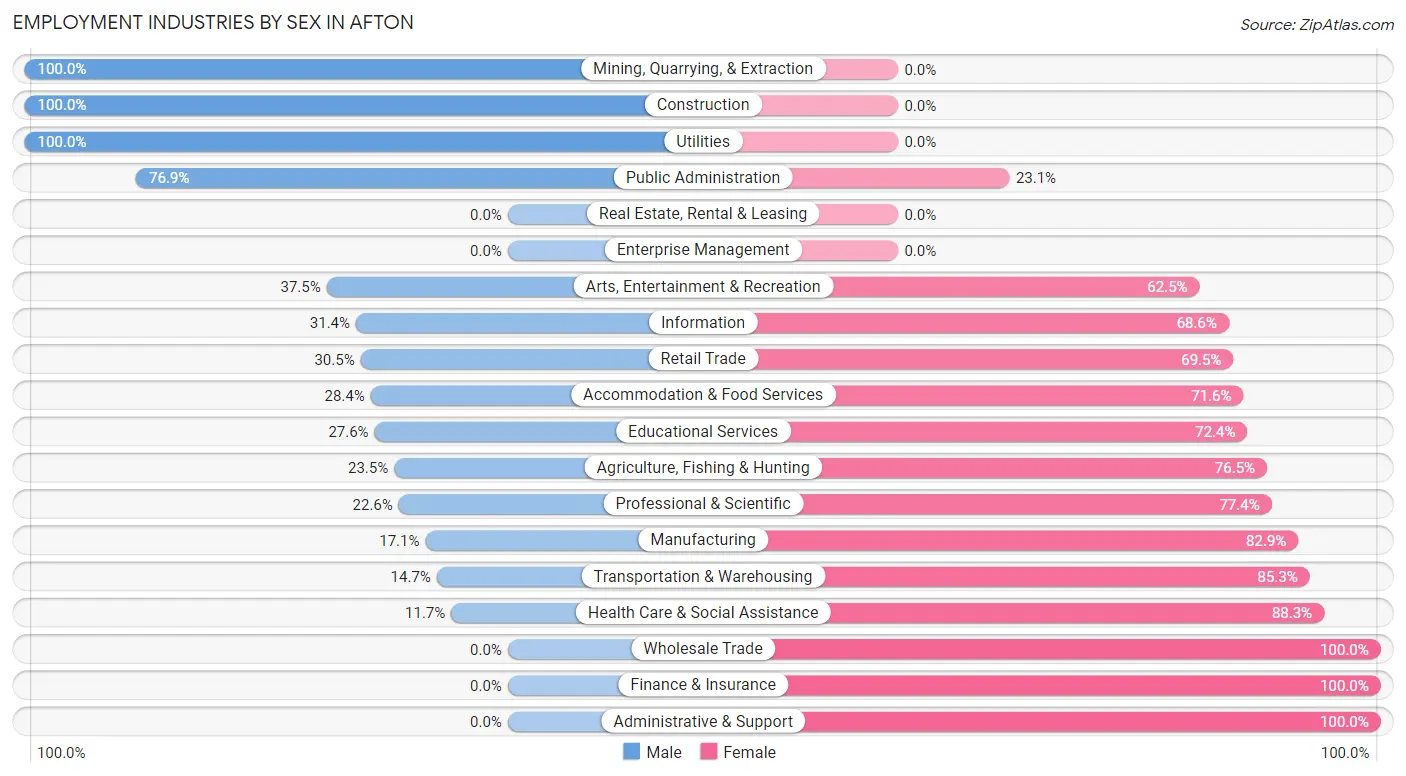
| Industry | Male | Female |
| Agriculture, Fishing & Hunting | 4 (23.5%) | 13 (76.5%) |
| Mining, Quarrying, & Extraction | 29 (100.0%) | 0 (0.0%) |
| Construction | 154 (100.0%) | 0 (0.0%) |
| Manufacturing | 29 (17.1%) | 141 (82.9%) |
| Wholesale Trade | 0 (0.0%) | 8 (100.0%) |
| Retail Trade | 57 (30.5%) | 130 (69.5%) |
| Transportation & Warehousing | 5 (14.7%) | 29 (85.3%) |
| Utilities | 10 (100.0%) | 0 (0.0%) |
| Information | 11 (31.4%) | 24 (68.6%) |
| Finance & Insurance | 0 (0.0%) | 17 (100.0%) |
| Real Estate, Rental & Leasing | 0 (0.0%) | 0 (0.0%) |
| Professional & Scientific | 7 (22.6%) | 24 (77.4%) |
| Enterprise Management | 0 (0.0%) | 0 (0.0%) |
| Administrative & Support | 0 (0.0%) | 11 (100.0%) |
| Educational Services | 48 (27.6%) | 126 (72.4%) |
| Health Care & Social Assistance | 15 (11.7%) | 113 (88.3%) |
| Arts, Entertainment & Recreation | 18 (37.5%) | 30 (62.5%) |
| Accommodation & Food Services | 23 (28.4%) | 58 (71.6%) |
| Public Administration | 10 (76.9%) | 3 (23.1%) |
| Total | 458 (36.7%) | 790 (63.3%) |
Education in Afton
School Enrollment in Afton
The most common levels of schooling among the 499 students in Afton are high school (146 | 29.3%), elementary school (142 | 28.5%), and college / undergraduate (78 | 15.6%).
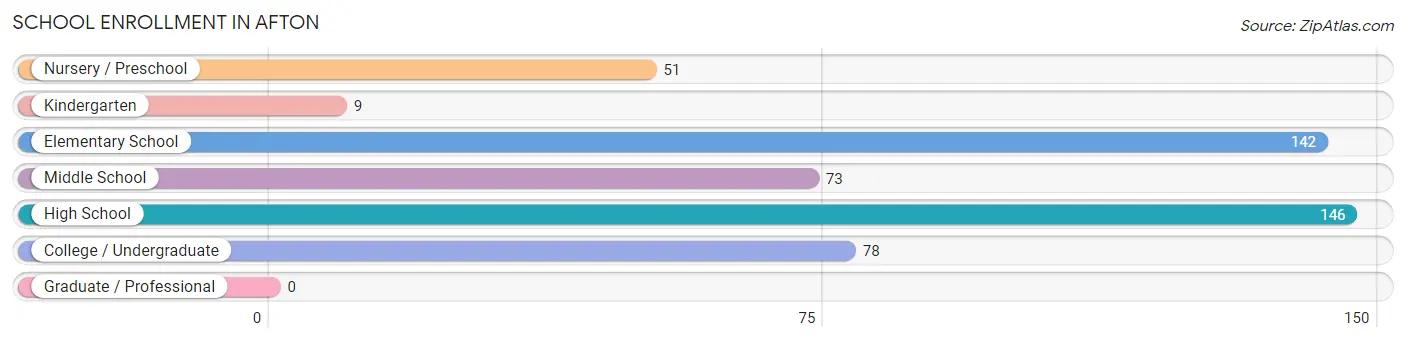
| School Level | # Students | % Students |
| Nursery / Preschool | 51 | 10.2% |
| Kindergarten | 9 | 1.8% |
| Elementary School | 142 | 28.5% |
| Middle School | 73 | 14.6% |
| High School | 146 | 29.3% |
| College / Undergraduate | 78 | 15.6% |
| Graduate / Professional | 0 | 0.0% |
| Total | 499 | 100.0% |
School Enrollment by Age by Funding Source in Afton
Out of a total of 499 students who are enrolled in schools in Afton, 21 (4.2%) attend a private institution, while the remaining 478 (95.8%) are enrolled in public schools. The age group of 35 years and over has the highest likelihood of being enrolled in private schools, with 12 (100.0% in the age bracket) enrolled. Conversely, the age group of 3 to 4 year olds has the lowest likelihood of being enrolled in a private school, with 40 (100.0% in the age bracket) attending a public institution.
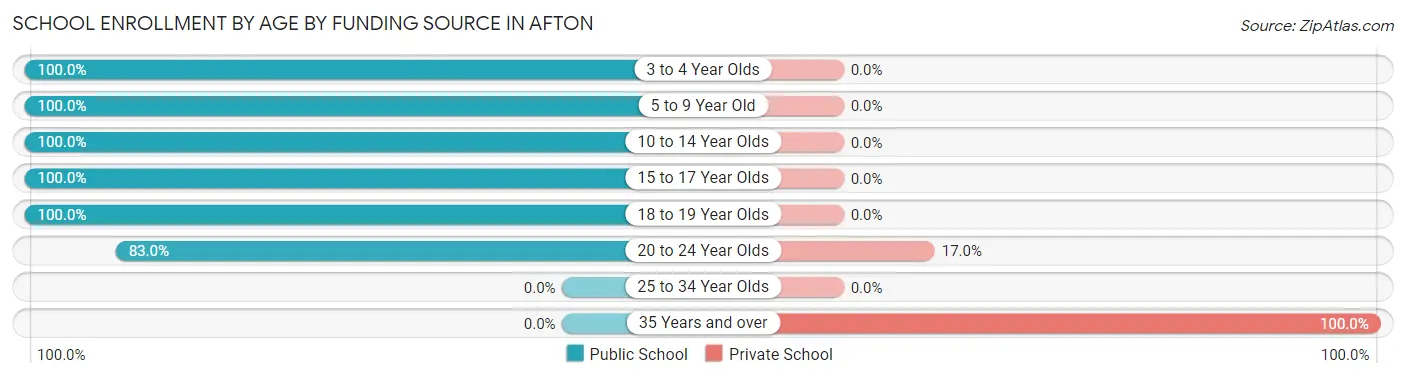
| Age Bracket | Public School | Private School |
| 3 to 4 Year Olds | 40 (100.0%) | 0 (0.0%) |
| 5 to 9 Year Old | 139 (100.0%) | 0 (0.0%) |
| 10 to 14 Year Olds | 111 (100.0%) | 0 (0.0%) |
| 15 to 17 Year Olds | 87 (100.0%) | 0 (0.0%) |
| 18 to 19 Year Olds | 57 (100.0%) | 0 (0.0%) |
| 20 to 24 Year Olds | 44 (83.0%) | 9 (17.0%) |
| 25 to 34 Year Olds | 0 (0.0%) | 0 (0.0%) |
| 35 Years and over | 0 (0.0%) | 12 (100.0%) |
| Total | 478 (95.8%) | 21 (4.2%) |
Educational Attainment by Field of Study in Afton
Education (97 | 29.4%), bio, nature & agricultural (73 | 22.1%), business (50 | 15.1%), physical & health sciences (27 | 8.2%), and science & technology (26 | 7.9%) are the most common fields of study among 330 individuals in Afton who have obtained a bachelor's degree or higher.
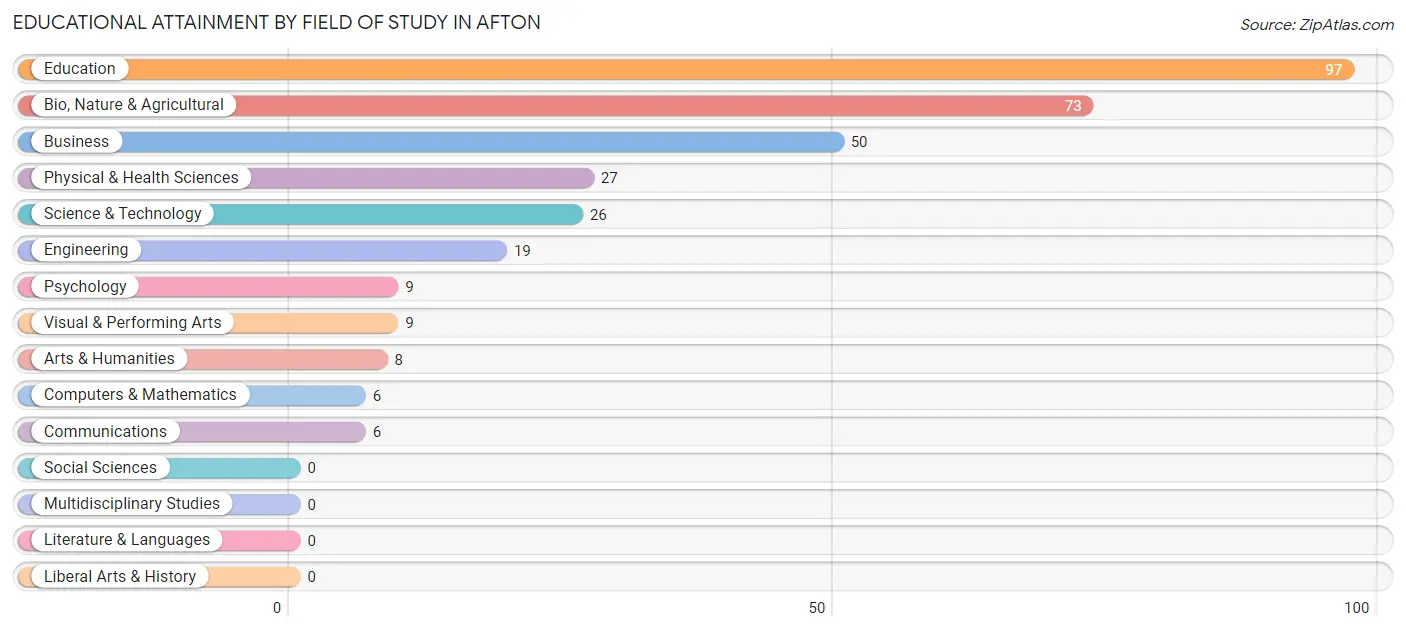
| Field of Study | # Graduates | % Graduates |
| Computers & Mathematics | 6 | 1.8% |
| Bio, Nature & Agricultural | 73 | 22.1% |
| Physical & Health Sciences | 27 | 8.2% |
| Psychology | 9 | 2.7% |
| Social Sciences | 0 | 0.0% |
| Engineering | 19 | 5.8% |
| Multidisciplinary Studies | 0 | 0.0% |
| Science & Technology | 26 | 7.9% |
| Business | 50 | 15.1% |
| Education | 97 | 29.4% |
| Literature & Languages | 0 | 0.0% |
| Liberal Arts & History | 0 | 0.0% |
| Visual & Performing Arts | 9 | 2.7% |
| Communications | 6 | 1.8% |
| Arts & Humanities | 8 | 2.4% |
| Total | 330 | 100.0% |
Transportation & Commute in Afton
Vehicle Availability by Sex in Afton
The most prevalent vehicle ownership categories in Afton are males with 2 vehicles (196, accounting for 44.1%) and females with 2 vehicles (303, making up 24.9%).
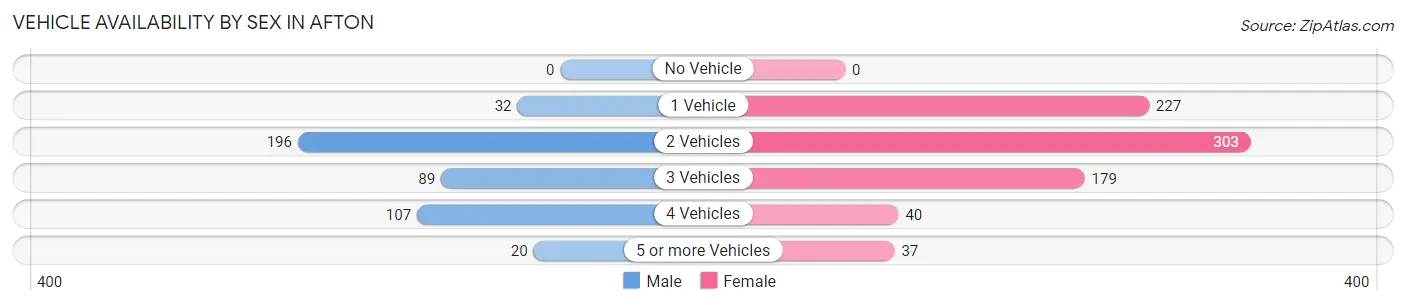
| Vehicles Available | Male | Female |
| No Vehicle | 0 (0.0%) | 0 (0.0%) |
| 1 Vehicle | 32 (7.2%) | 227 (28.9%) |
| 2 Vehicles | 196 (44.1%) | 303 (38.6%) |
| 3 Vehicles | 89 (20.1%) | 179 (22.8%) |
| 4 Vehicles | 107 (24.1%) | 40 (5.1%) |
| 5 or more Vehicles | 20 (4.5%) | 37 (4.7%) |
| Total | 444 (100.0%) | 786 (100.0%) |
Commute Time in Afton
The most frequently occuring commute durations in Afton are 5 to 9 minutes (528 commuters, 43.9%), less than 5 minutes (306 commuters, 25.4%), and 10 to 14 minutes (83 commuters, 6.9%).
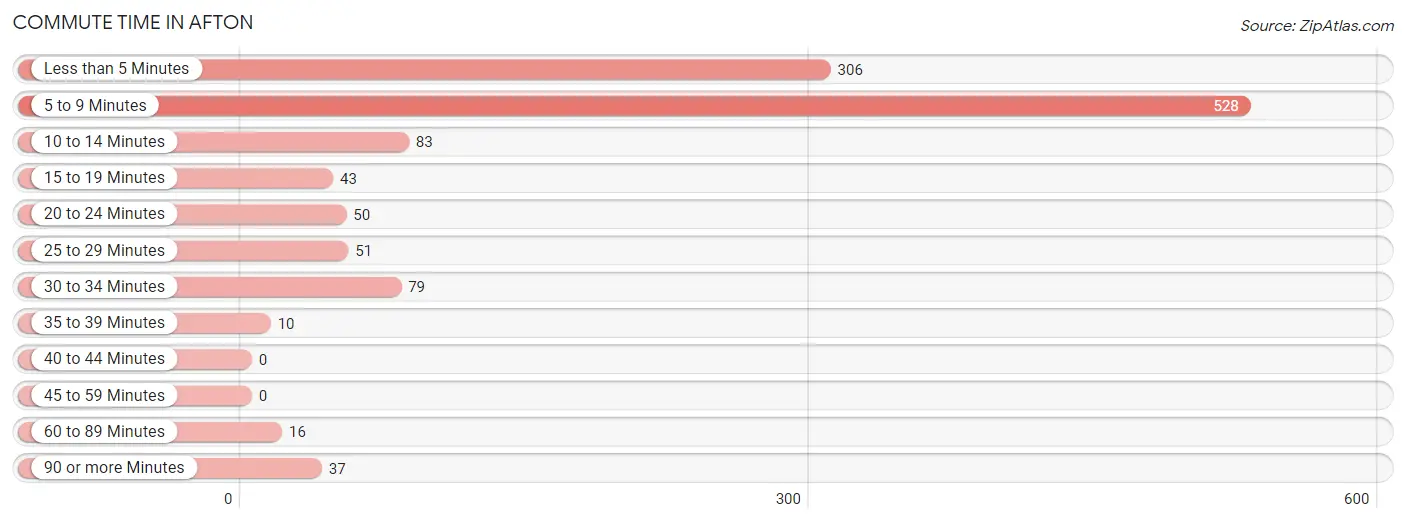
| Commute Time | # Commuters | % Commuters |
| Less than 5 Minutes | 306 | 25.4% |
| 5 to 9 Minutes | 528 | 43.9% |
| 10 to 14 Minutes | 83 | 6.9% |
| 15 to 19 Minutes | 43 | 3.6% |
| 20 to 24 Minutes | 50 | 4.2% |
| 25 to 29 Minutes | 51 | 4.2% |
| 30 to 34 Minutes | 79 | 6.6% |
| 35 to 39 Minutes | 10 | 0.8% |
| 40 to 44 Minutes | 0 | 0.0% |
| 45 to 59 Minutes | 0 | 0.0% |
| 60 to 89 Minutes | 16 | 1.3% |
| 90 or more Minutes | 37 | 3.1% |
Commute Time by Sex in Afton
The most common commute times in Afton are less than 5 minutes (148 commuters, 34.3%) for males and 5 to 9 minutes (435 commuters, 56.4%) for females.
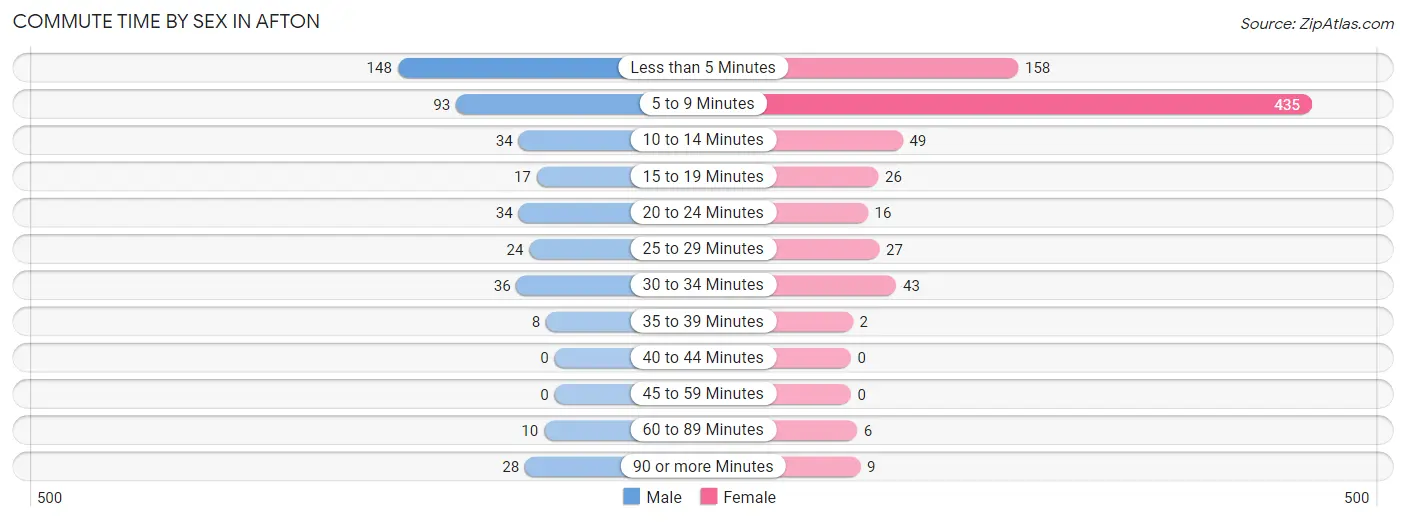
| Commute Time | Male | Female |
| Less than 5 Minutes | 148 (34.3%) | 158 (20.5%) |
| 5 to 9 Minutes | 93 (21.5%) | 435 (56.4%) |
| 10 to 14 Minutes | 34 (7.9%) | 49 (6.4%) |
| 15 to 19 Minutes | 17 (3.9%) | 26 (3.4%) |
| 20 to 24 Minutes | 34 (7.9%) | 16 (2.1%) |
| 25 to 29 Minutes | 24 (5.6%) | 27 (3.5%) |
| 30 to 34 Minutes | 36 (8.3%) | 43 (5.6%) |
| 35 to 39 Minutes | 8 (1.8%) | 2 (0.3%) |
| 40 to 44 Minutes | 0 (0.0%) | 0 (0.0%) |
| 45 to 59 Minutes | 0 (0.0%) | 0 (0.0%) |
| 60 to 89 Minutes | 10 (2.3%) | 6 (0.8%) |
| 90 or more Minutes | 28 (6.5%) | 9 (1.2%) |
Time of Departure to Work by Sex in Afton
The most frequent times of departure to work in Afton are 7:30 AM to 7:59 AM (106, 24.5%) for males and 7:00 AM to 7:29 AM (196, 25.4%) for females.
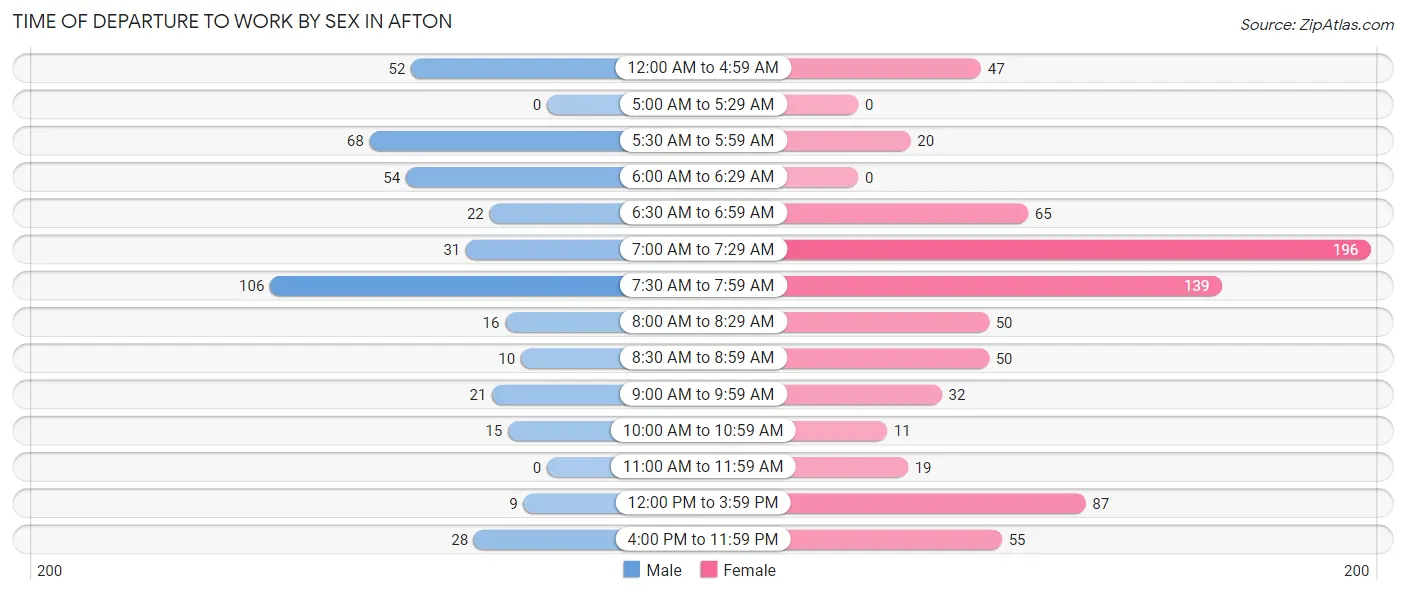
| Time of Departure | Male | Female |
| 12:00 AM to 4:59 AM | 52 (12.0%) | 47 (6.1%) |
| 5:00 AM to 5:29 AM | 0 (0.0%) | 0 (0.0%) |
| 5:30 AM to 5:59 AM | 68 (15.7%) | 20 (2.6%) |
| 6:00 AM to 6:29 AM | 54 (12.5%) | 0 (0.0%) |
| 6:30 AM to 6:59 AM | 22 (5.1%) | 65 (8.4%) |
| 7:00 AM to 7:29 AM | 31 (7.2%) | 196 (25.4%) |
| 7:30 AM to 7:59 AM | 106 (24.5%) | 139 (18.0%) |
| 8:00 AM to 8:29 AM | 16 (3.7%) | 50 (6.5%) |
| 8:30 AM to 8:59 AM | 10 (2.3%) | 50 (6.5%) |
| 9:00 AM to 9:59 AM | 21 (4.9%) | 32 (4.2%) |
| 10:00 AM to 10:59 AM | 15 (3.5%) | 11 (1.4%) |
| 11:00 AM to 11:59 AM | 0 (0.0%) | 19 (2.5%) |
| 12:00 PM to 3:59 PM | 9 (2.1%) | 87 (11.3%) |
| 4:00 PM to 11:59 PM | 28 (6.5%) | 55 (7.1%) |
| Total | 432 (100.0%) | 771 (100.0%) |
Housing Occupancy in Afton
Occupancy by Ownership in Afton
Of the total 930 dwellings in Afton, owner-occupied units account for 537 (57.7%), while renter-occupied units make up 393 (42.3%).
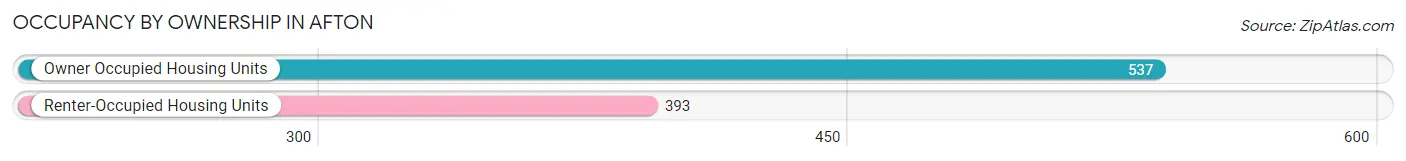
| Occupancy | # Housing Units | % Housing Units |
| Owner Occupied Housing Units | 537 | 57.7% |
| Renter-Occupied Housing Units | 393 | 42.3% |
| Total Occupied Housing Units | 930 | 100.0% |
Occupancy by Household Size in Afton
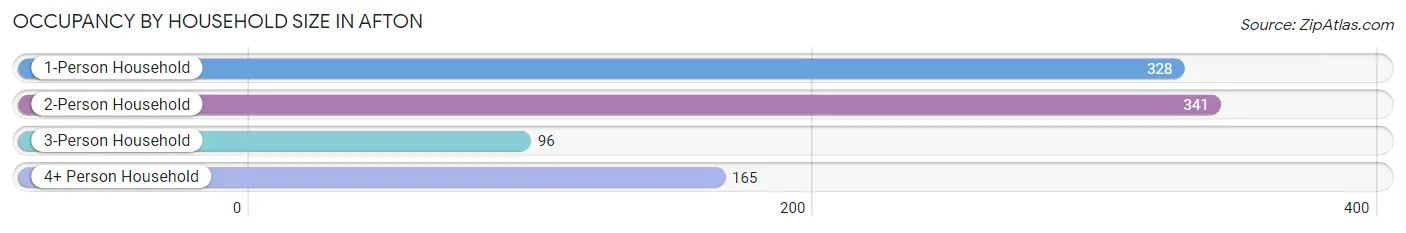
| Household Size | # Housing Units | % Housing Units |
| 1-Person Household | 328 | 35.3% |
| 2-Person Household | 341 | 36.7% |
| 3-Person Household | 96 | 10.3% |
| 4+ Person Household | 165 | 17.7% |
| Total Housing Units | 930 | 100.0% |
Occupancy by Ownership by Household Size in Afton
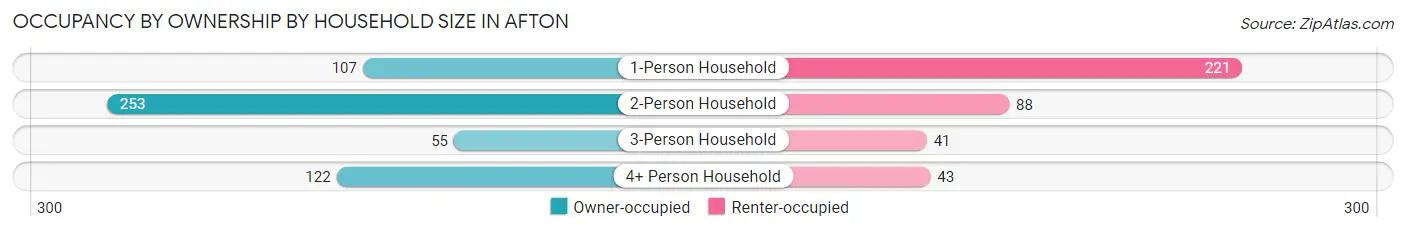
| Household Size | Owner-occupied | Renter-occupied |
| 1-Person Household | 107 (32.6%) | 221 (67.4%) |
| 2-Person Household | 253 (74.2%) | 88 (25.8%) |
| 3-Person Household | 55 (57.3%) | 41 (42.7%) |
| 4+ Person Household | 122 (73.9%) | 43 (26.1%) |
| Total Housing Units | 537 (57.7%) | 393 (42.3%) |
Occupancy by Educational Attainment in Afton
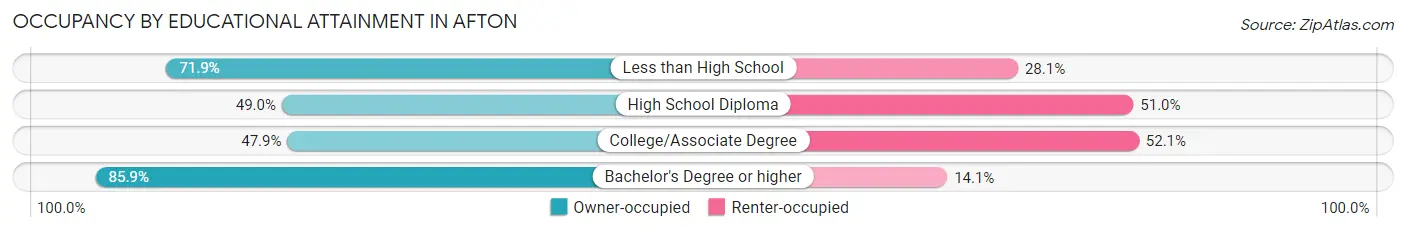
| Household Size | Owner-occupied | Renter-occupied |
| Less than High School | 23 (71.9%) | 9 (28.1%) |
| High School Diploma | 124 (49.0%) | 129 (51.0%) |
| College/Associate Degree | 207 (47.9%) | 225 (52.1%) |
| Bachelor's Degree or higher | 183 (85.9%) | 30 (14.1%) |
Occupancy by Age of Householder in Afton
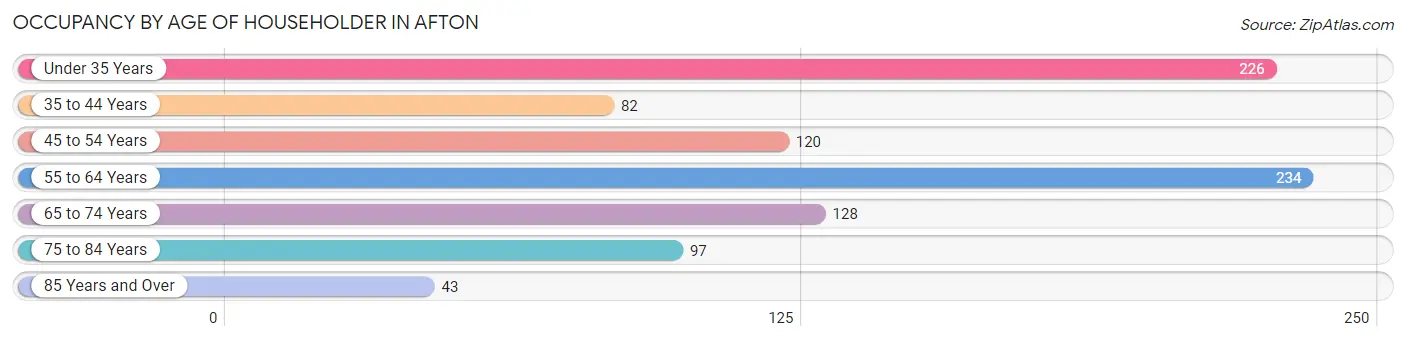
| Age Bracket | # Households | % Households |
| Under 35 Years | 226 | 24.3% |
| 35 to 44 Years | 82 | 8.8% |
| 45 to 54 Years | 120 | 12.9% |
| 55 to 64 Years | 234 | 25.2% |
| 65 to 74 Years | 128 | 13.8% |
| 75 to 84 Years | 97 | 10.4% |
| 85 Years and Over | 43 | 4.6% |
| Total | 930 | 100.0% |
Housing Finances in Afton
Median Income by Occupancy in Afton
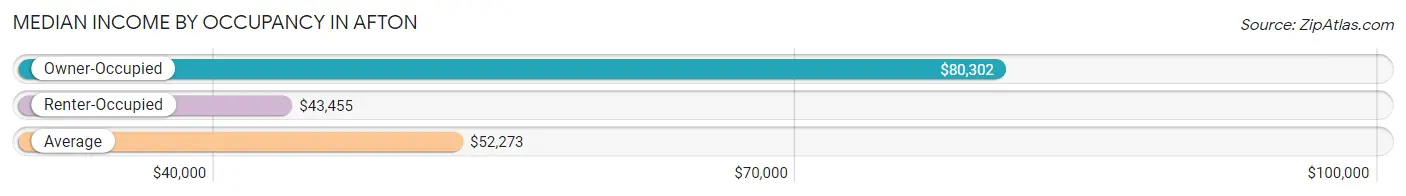
| Occupancy Type | # Households | Median Income |
| Owner-Occupied | 537 (57.7%) | $80,302 |
| Renter-Occupied | 393 (42.3%) | $43,455 |
| Average | 930 (100.0%) | $52,273 |
Occupancy by Householder Income Bracket in Afton
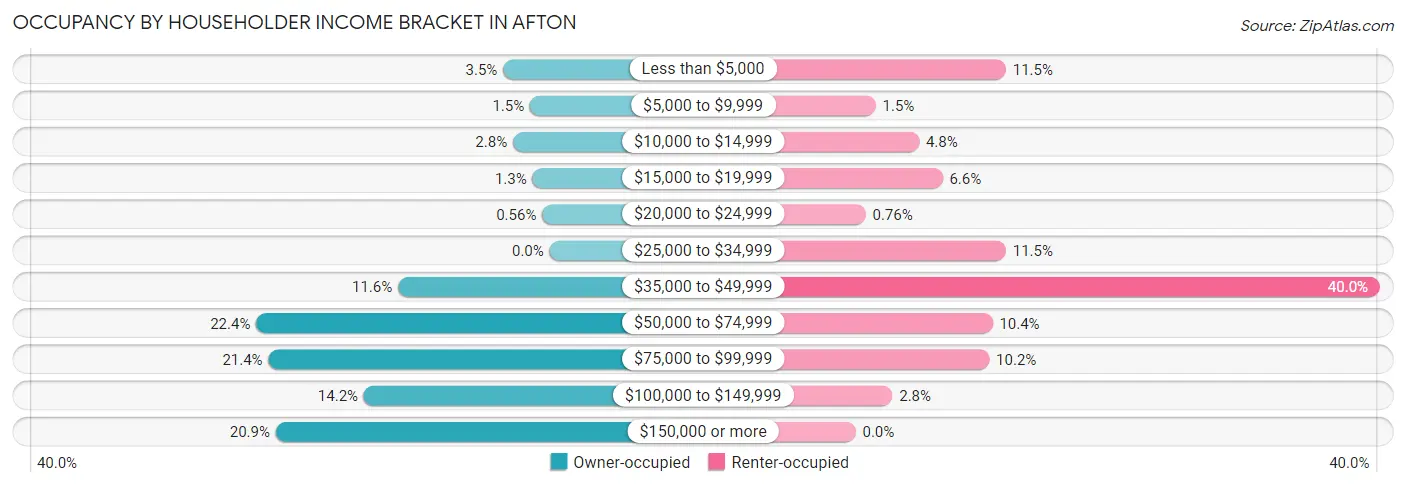
| Income Bracket | Owner-occupied | Renter-occupied |
| Less than $5,000 | 19 (3.5%) | 45 (11.5%) |
| $5,000 to $9,999 | 8 (1.5%) | 6 (1.5%) |
| $10,000 to $14,999 | 15 (2.8%) | 19 (4.8%) |
| $15,000 to $19,999 | 7 (1.3%) | 26 (6.6%) |
| $20,000 to $24,999 | 3 (0.6%) | 3 (0.8%) |
| $25,000 to $34,999 | 0 (0.0%) | 45 (11.5%) |
| $35,000 to $49,999 | 62 (11.6%) | 157 (40.0%) |
| $50,000 to $74,999 | 120 (22.4%) | 41 (10.4%) |
| $75,000 to $99,999 | 115 (21.4%) | 40 (10.2%) |
| $100,000 to $149,999 | 76 (14.1%) | 11 (2.8%) |
| $150,000 or more | 112 (20.9%) | 0 (0.0%) |
| Total | 537 (100.0%) | 393 (100.0%) |
Monthly Housing Cost Tiers in Afton
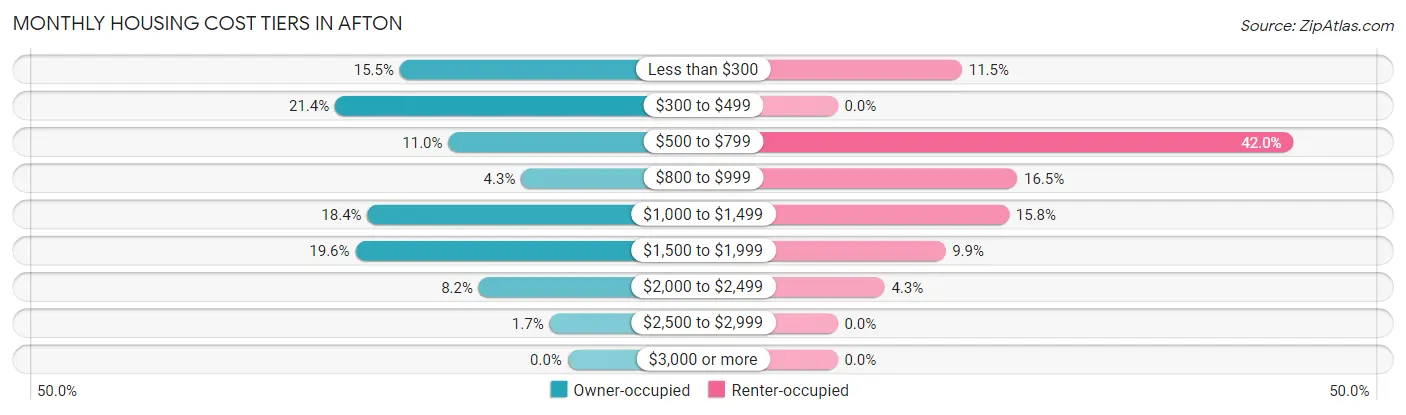
| Monthly Cost | Owner-occupied | Renter-occupied |
| Less than $300 | 83 (15.5%) | 45 (11.5%) |
| $300 to $499 | 115 (21.4%) | 0 (0.0%) |
| $500 to $799 | 59 (11.0%) | 165 (42.0%) |
| $800 to $999 | 23 (4.3%) | 65 (16.5%) |
| $1,000 to $1,499 | 99 (18.4%) | 62 (15.8%) |
| $1,500 to $1,999 | 105 (19.6%) | 39 (9.9%) |
| $2,000 to $2,499 | 44 (8.2%) | 17 (4.3%) |
| $2,500 to $2,999 | 9 (1.7%) | 0 (0.0%) |
| $3,000 or more | 0 (0.0%) | 0 (0.0%) |
| Total | 537 (100.0%) | 393 (100.0%) |
Physical Housing Characteristics in Afton
Housing Structures in Afton
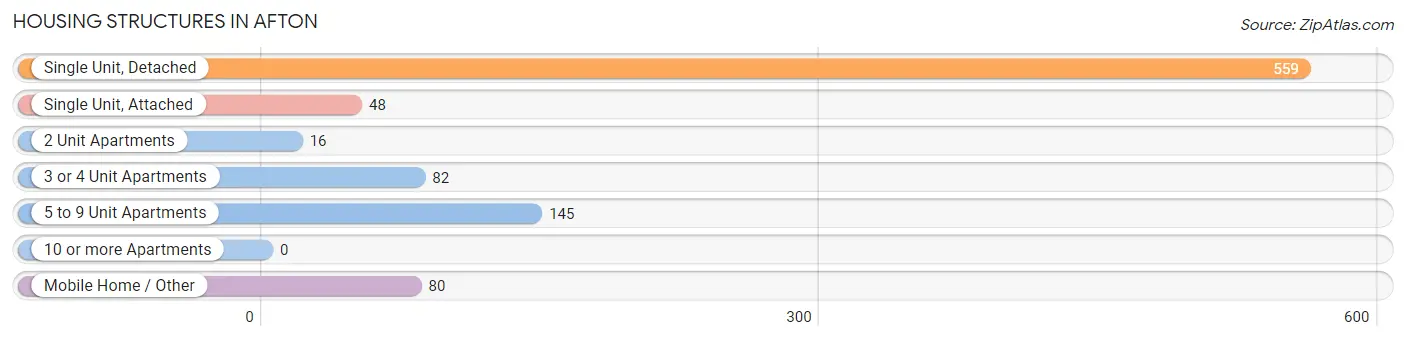
| Structure Type | # Housing Units | % Housing Units |
| Single Unit, Detached | 559 | 60.1% |
| Single Unit, Attached | 48 | 5.2% |
| 2 Unit Apartments | 16 | 1.7% |
| 3 or 4 Unit Apartments | 82 | 8.8% |
| 5 to 9 Unit Apartments | 145 | 15.6% |
| 10 or more Apartments | 0 | 0.0% |
| Mobile Home / Other | 80 | 8.6% |
| Total | 930 | 100.0% |
Housing Structures by Occupancy in Afton
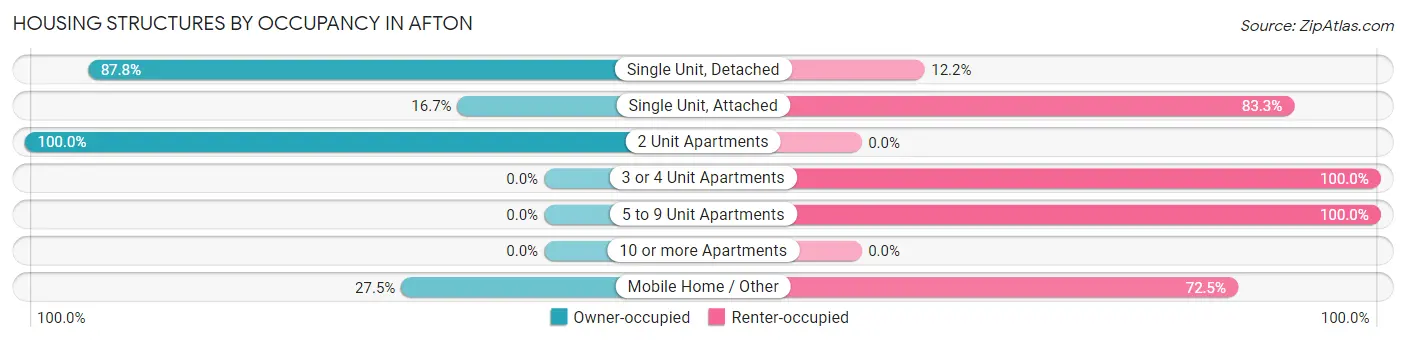
| Structure Type | Owner-occupied | Renter-occupied |
| Single Unit, Detached | 491 (87.8%) | 68 (12.2%) |
| Single Unit, Attached | 8 (16.7%) | 40 (83.3%) |
| 2 Unit Apartments | 16 (100.0%) | 0 (0.0%) |
| 3 or 4 Unit Apartments | 0 (0.0%) | 82 (100.0%) |
| 5 to 9 Unit Apartments | 0 (0.0%) | 145 (100.0%) |
| 10 or more Apartments | 0 (0.0%) | 0 (0.0%) |
| Mobile Home / Other | 22 (27.5%) | 58 (72.5%) |
| Total | 537 (57.7%) | 393 (42.3%) |
Housing Structures by Number of Rooms in Afton
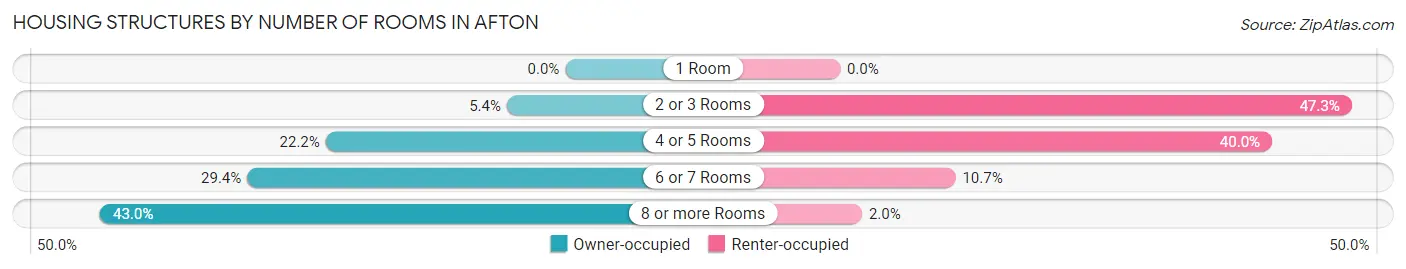
| Number of Rooms | Owner-occupied | Renter-occupied |
| 1 Room | 0 (0.0%) | 0 (0.0%) |
| 2 or 3 Rooms | 29 (5.4%) | 186 (47.3%) |
| 4 or 5 Rooms | 119 (22.2%) | 157 (40.0%) |
| 6 or 7 Rooms | 158 (29.4%) | 42 (10.7%) |
| 8 or more Rooms | 231 (43.0%) | 8 (2.0%) |
| Total | 537 (100.0%) | 393 (100.0%) |
Housing Structure by Heating Type in Afton
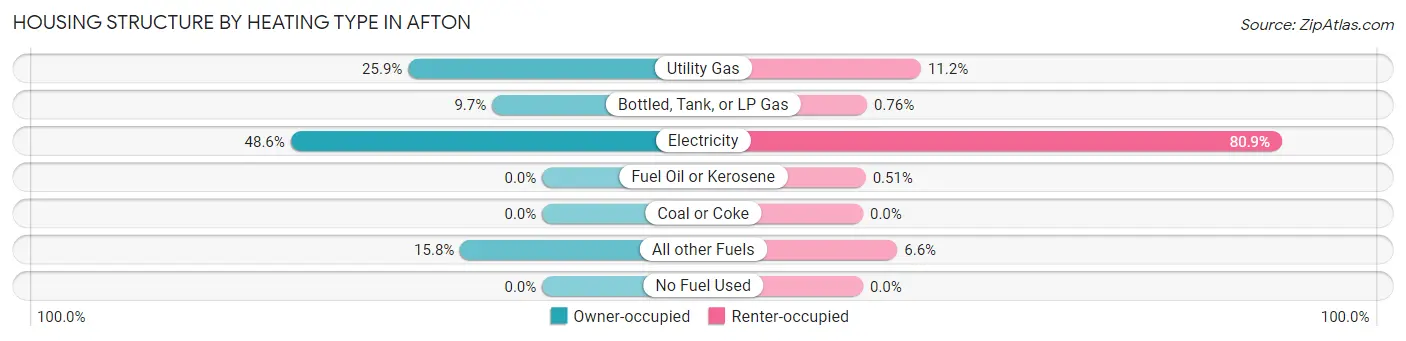
| Heating Type | Owner-occupied | Renter-occupied |
| Utility Gas | 139 (25.9%) | 44 (11.2%) |
| Bottled, Tank, or LP Gas | 52 (9.7%) | 3 (0.8%) |
| Electricity | 261 (48.6%) | 318 (80.9%) |
| Fuel Oil or Kerosene | 0 (0.0%) | 2 (0.5%) |
| Coal or Coke | 0 (0.0%) | 0 (0.0%) |
| All other Fuels | 85 (15.8%) | 26 (6.6%) |
| No Fuel Used | 0 (0.0%) | 0 (0.0%) |
| Total | 537 (100.0%) | 393 (100.0%) |
Household Vehicle Usage in Afton
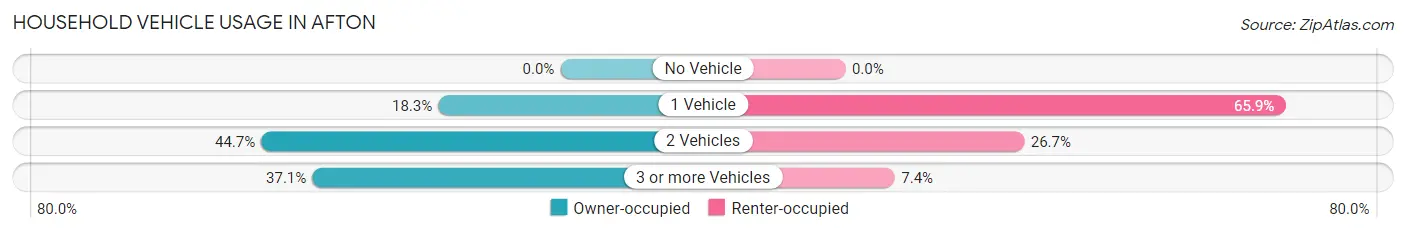
| Vehicles per Household | Owner-occupied | Renter-occupied |
| No Vehicle | 0 (0.0%) | 0 (0.0%) |
| 1 Vehicle | 98 (18.2%) | 259 (65.9%) |
| 2 Vehicles | 240 (44.7%) | 105 (26.7%) |
| 3 or more Vehicles | 199 (37.1%) | 29 (7.4%) |
| Total | 537 (100.0%) | 393 (100.0%) |
Real Estate & Mortgages in Afton
Real Estate and Mortgage Overview in Afton
| Characteristic | Without Mortgage | With Mortgage |
| Housing Units | 261 | 276 |
| Median Property Value | $280,200 | $322,500 |
| Median Household Income | $69,861 | $57 |
| Monthly Housing Costs | $410 | $0 |
| Real Estate Taxes | $1,295 | $18 |
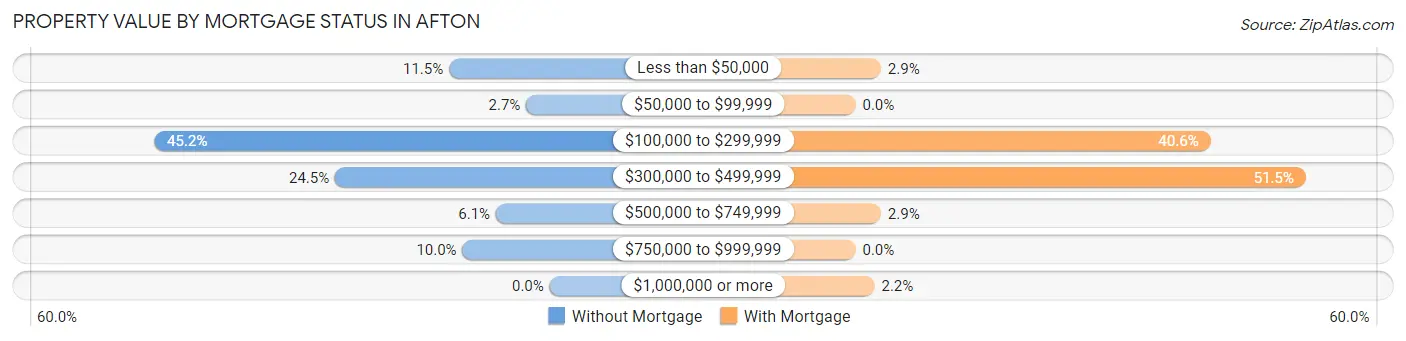
Property Value by Mortgage Status in Afton
| Property Value | Without Mortgage | With Mortgage |
| Less than $50,000 | 30 (11.5%) | 8 (2.9%) |
| $50,000 to $99,999 | 7 (2.7%) | 0 (0.0%) |
| $100,000 to $299,999 | 118 (45.2%) | 112 (40.6%) |
| $300,000 to $499,999 | 64 (24.5%) | 142 (51.4%) |
| $500,000 to $749,999 | 16 (6.1%) | 8 (2.9%) |
| $750,000 to $999,999 | 26 (10.0%) | 0 (0.0%) |
| $1,000,000 or more | 0 (0.0%) | 6 (2.2%) |
| Total | 261 (100.0%) | 276 (100.0%) |
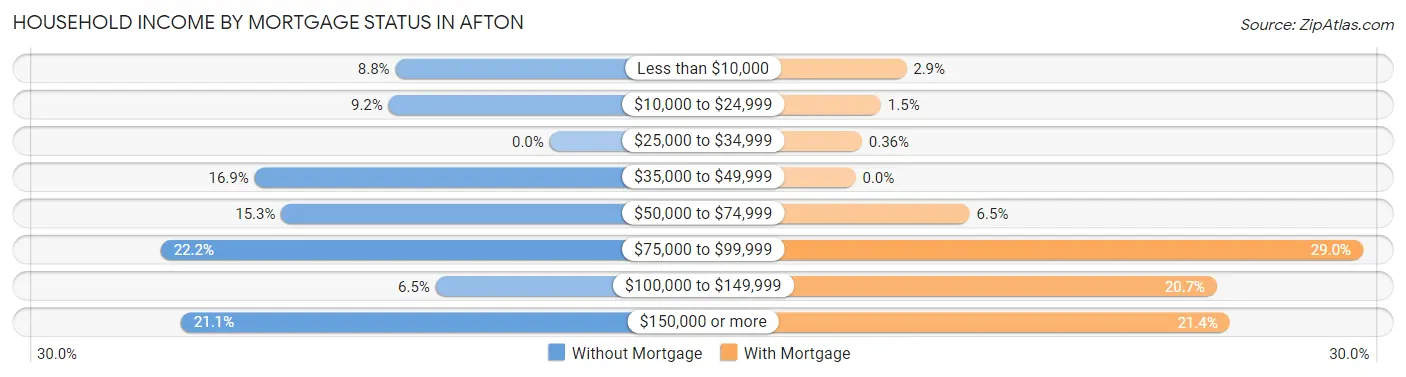
Household Income by Mortgage Status in Afton
| Household Income | Without Mortgage | With Mortgage |
| Less than $10,000 | 23 (8.8%) | 8 (2.9%) |
| $10,000 to $24,999 | 24 (9.2%) | 4 (1.5%) |
| $25,000 to $34,999 | 0 (0.0%) | 1 (0.4%) |
| $35,000 to $49,999 | 44 (16.9%) | 0 (0.0%) |
| $50,000 to $74,999 | 40 (15.3%) | 18 (6.5%) |
| $75,000 to $99,999 | 58 (22.2%) | 80 (29.0%) |
| $100,000 to $149,999 | 17 (6.5%) | 57 (20.6%) |
| $150,000 or more | 55 (21.1%) | 59 (21.4%) |
| Total | 261 (100.0%) | 276 (100.0%) |
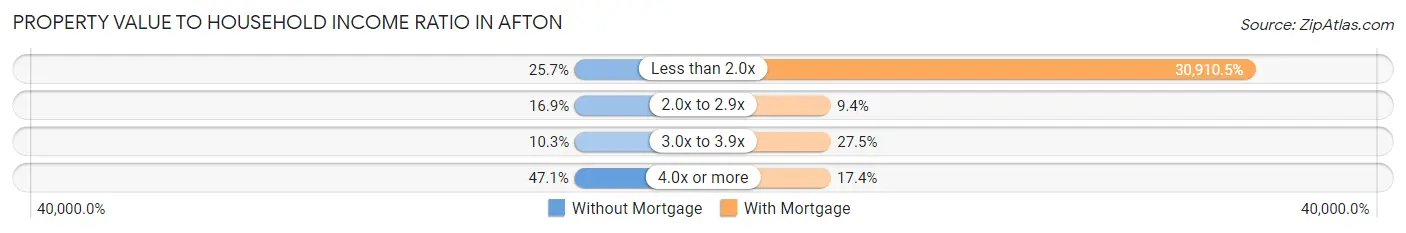
Property Value to Household Income Ratio in Afton
| Value-to-Income Ratio | Without Mortgage | With Mortgage |
| Less than 2.0x | 67 (25.7%) | 85,313 (30,910.5%) |
| 2.0x to 2.9x | 44 (16.9%) | 26 (9.4%) |
| 3.0x to 3.9x | 27 (10.3%) | 76 (27.5%) |
| 4.0x or more | 123 (47.1%) | 48 (17.4%) |
| Total | 261 (100.0%) | 276 (100.0%) |
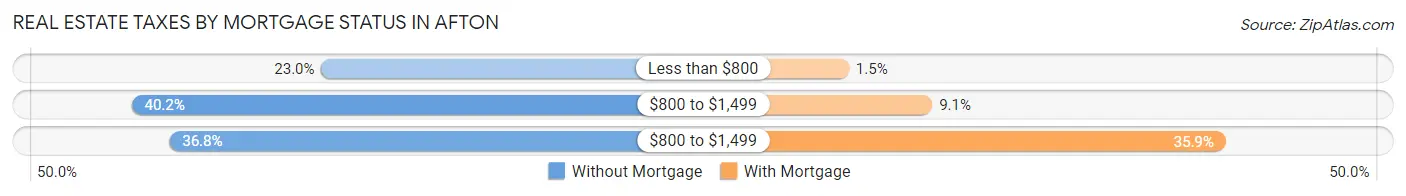
Real Estate Taxes by Mortgage Status in Afton
| Property Taxes | Without Mortgage | With Mortgage |
| Less than $800 | 60 (23.0%) | 4 (1.5%) |
| $800 to $1,499 | 105 (40.2%) | 25 (9.1%) |
| $800 to $1,499 | 96 (36.8%) | 99 (35.9%) |
| Total | 261 (100.0%) | 276 (100.0%) |
Health & Disability in Afton
Health Insurance Coverage by Age in Afton
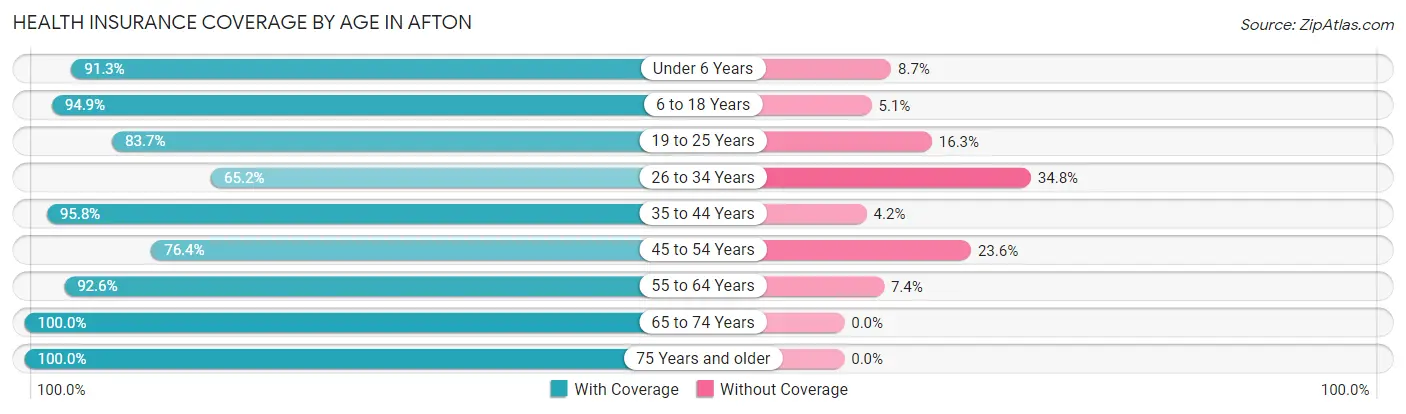
| Age Bracket | With Coverage | Without Coverage |
| Under 6 Years | 230 (91.3%) | 22 (8.7%) |
| 6 to 18 Years | 354 (94.9%) | 19 (5.1%) |
| 19 to 25 Years | 205 (83.7%) | 40 (16.3%) |
| 26 to 34 Years | 178 (65.2%) | 95 (34.8%) |
| 35 to 44 Years | 138 (95.8%) | 6 (4.2%) |
| 45 to 54 Years | 181 (76.4%) | 56 (23.6%) |
| 55 to 64 Years | 288 (92.6%) | 23 (7.4%) |
| 65 to 74 Years | 236 (100.0%) | 0 (0.0%) |
| 75 Years and older | 191 (100.0%) | 0 (0.0%) |
| Total | 2,001 (88.5%) | 261 (11.5%) |
Health Insurance Coverage by Citizenship Status in Afton
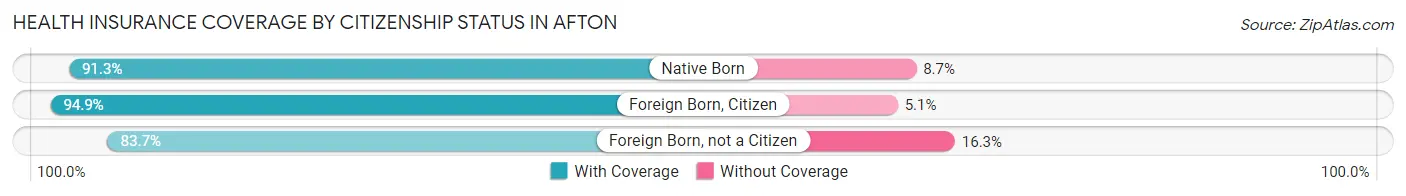
| Citizenship Status | With Coverage | Without Coverage |
| Native Born | 230 (91.3%) | 22 (8.7%) |
| Foreign Born, Citizen | 354 (94.9%) | 19 (5.1%) |
| Foreign Born, not a Citizen | 205 (83.7%) | 40 (16.3%) |
Health Insurance Coverage by Household Income in Afton
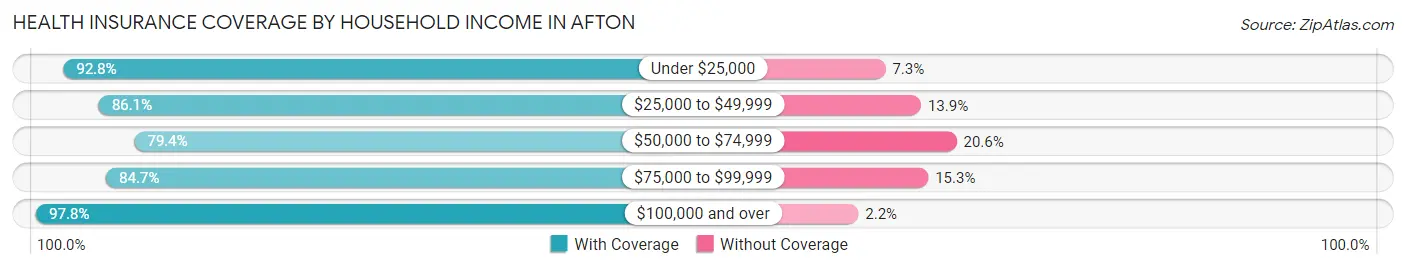
| Household Income | With Coverage | Without Coverage |
| Under $25,000 | 256 (92.7%) | 20 (7.2%) |
| $25,000 to $49,999 | 353 (86.1%) | 57 (13.9%) |
| $50,000 to $74,999 | 340 (79.4%) | 88 (20.6%) |
| $75,000 to $99,999 | 461 (84.7%) | 83 (15.3%) |
| $100,000 and over | 590 (97.8%) | 13 (2.2%) |
Public vs Private Health Insurance Coverage by Age in Afton
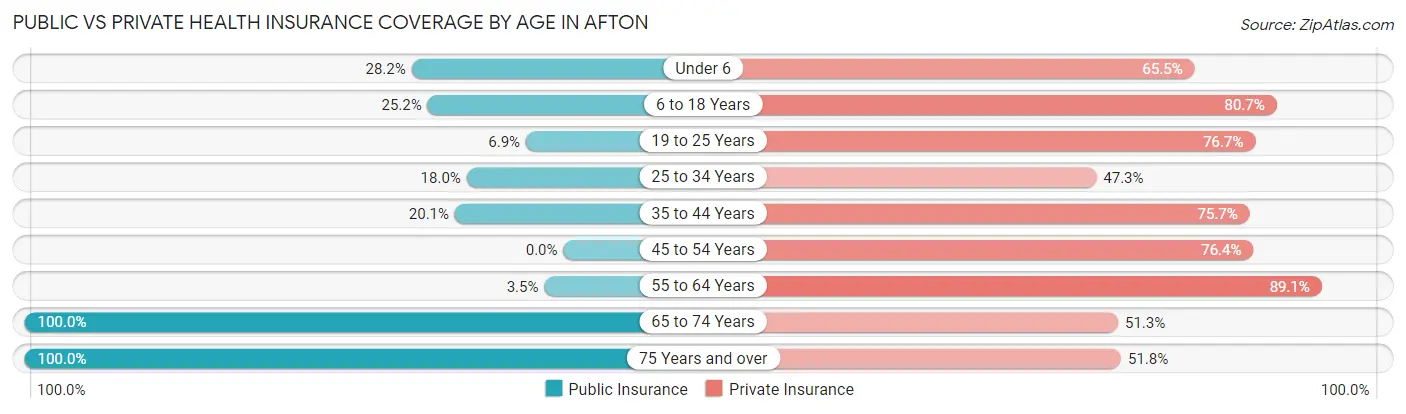
| Age Bracket | Public Insurance | Private Insurance |
| Under 6 | 71 (28.2%) | 165 (65.5%) |
| 6 to 18 Years | 94 (25.2%) | 301 (80.7%) |
| 19 to 25 Years | 17 (6.9%) | 188 (76.7%) |
| 25 to 34 Years | 49 (17.9%) | 129 (47.2%) |
| 35 to 44 Years | 29 (20.1%) | 109 (75.7%) |
| 45 to 54 Years | 0 (0.0%) | 181 (76.4%) |
| 55 to 64 Years | 11 (3.5%) | 277 (89.1%) |
| 65 to 74 Years | 236 (100.0%) | 121 (51.3%) |
| 75 Years and over | 191 (100.0%) | 99 (51.8%) |
| Total | 698 (30.9%) | 1,570 (69.4%) |
Disability Status by Sex by Age in Afton
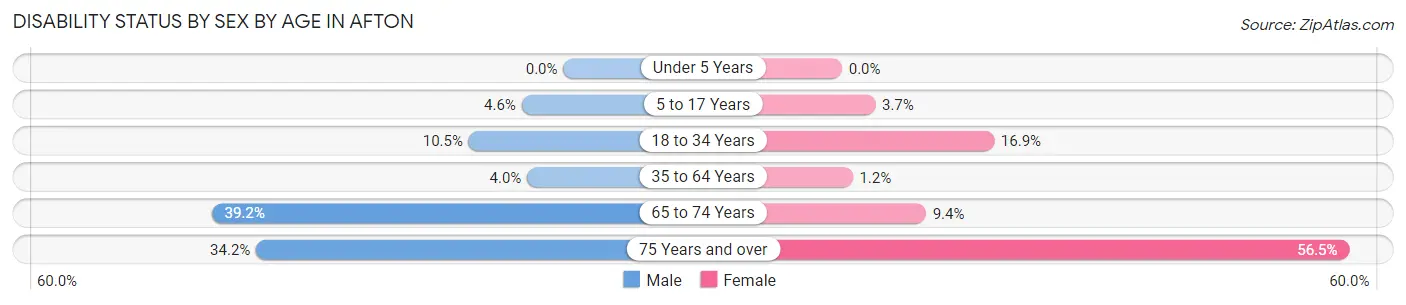
| Age Bracket | Male | Female |
| Under 5 Years | 0 (0.0%) | 0 (0.0%) |
| 5 to 17 Years | 7 (4.6%) | 7 (3.7%) |
| 18 to 34 Years | 22 (10.5%) | 61 (16.9%) |
| 35 to 64 Years | 11 (4.0%) | 5 (1.2%) |
| 65 to 74 Years | 38 (39.2%) | 13 (9.3%) |
| 75 Years and over | 26 (34.2%) | 65 (56.5%) |
Disability Class by Sex by Age in Afton
Disability Class: Hearing Difficulty
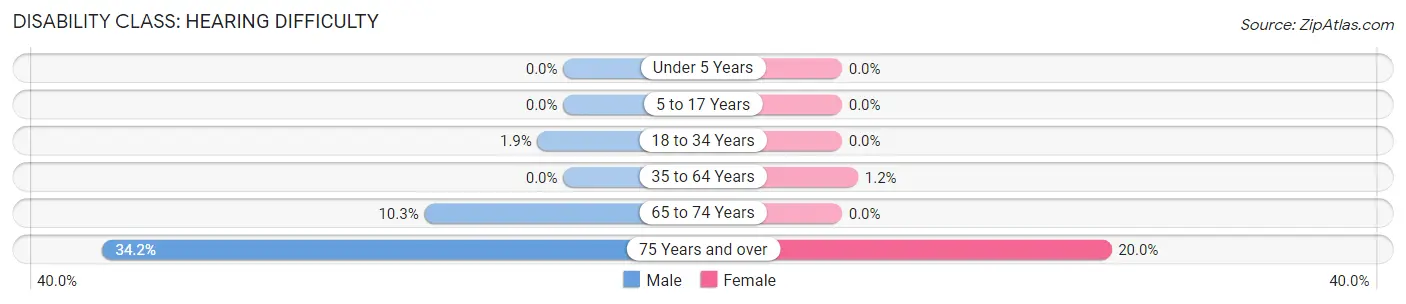
| Age Bracket | Male | Female |
| Under 5 Years | 0 (0.0%) | 0 (0.0%) |
| 5 to 17 Years | 0 (0.0%) | 0 (0.0%) |
| 18 to 34 Years | 4 (1.9%) | 0 (0.0%) |
| 35 to 64 Years | 0 (0.0%) | 5 (1.2%) |
| 65 to 74 Years | 10 (10.3%) | 0 (0.0%) |
| 75 Years and over | 26 (34.2%) | 23 (20.0%) |
Disability Class: Vision Difficulty
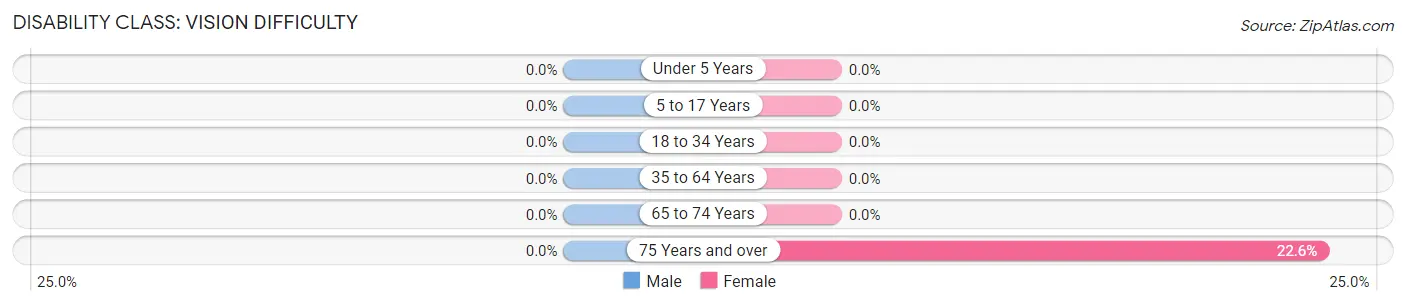
| Age Bracket | Male | Female |
| Under 5 Years | 0 (0.0%) | 0 (0.0%) |
| 5 to 17 Years | 0 (0.0%) | 0 (0.0%) |
| 18 to 34 Years | 0 (0.0%) | 0 (0.0%) |
| 35 to 64 Years | 0 (0.0%) | 0 (0.0%) |
| 65 to 74 Years | 0 (0.0%) | 0 (0.0%) |
| 75 Years and over | 0 (0.0%) | 26 (22.6%) |
Disability Class: Cognitive Difficulty
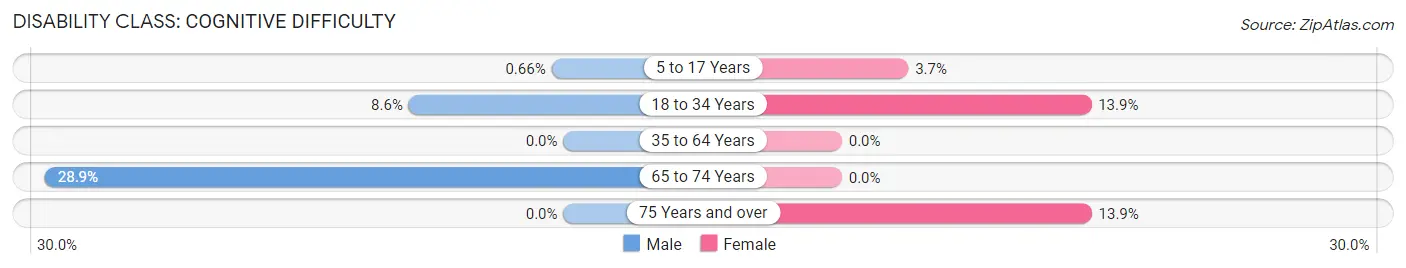
| Age Bracket | Male | Female |
| 5 to 17 Years | 1 (0.7%) | 7 (3.7%) |
| 18 to 34 Years | 18 (8.6%) | 50 (13.9%) |
| 35 to 64 Years | 0 (0.0%) | 0 (0.0%) |
| 65 to 74 Years | 28 (28.9%) | 0 (0.0%) |
| 75 Years and over | 0 (0.0%) | 16 (13.9%) |
Disability Class: Ambulatory Difficulty
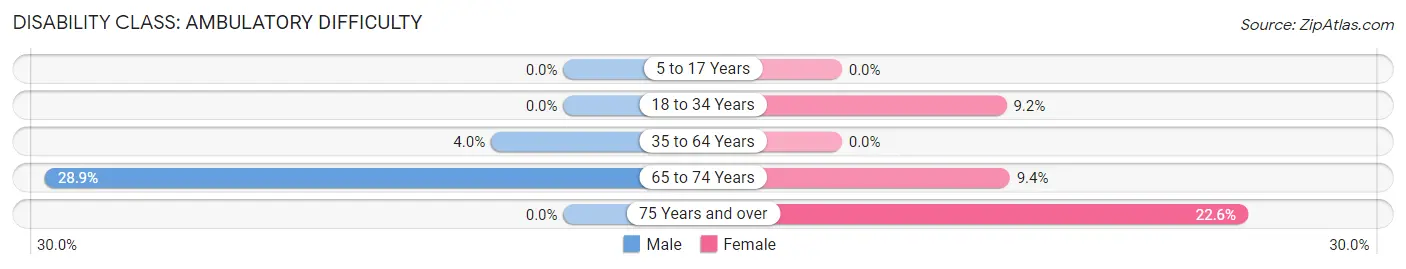
| Age Bracket | Male | Female |
| 5 to 17 Years | 0 (0.0%) | 0 (0.0%) |
| 18 to 34 Years | 0 (0.0%) | 33 (9.2%) |
| 35 to 64 Years | 11 (4.0%) | 0 (0.0%) |
| 65 to 74 Years | 28 (28.9%) | 13 (9.3%) |
| 75 Years and over | 0 (0.0%) | 26 (22.6%) |
Disability Class: Self-Care Difficulty
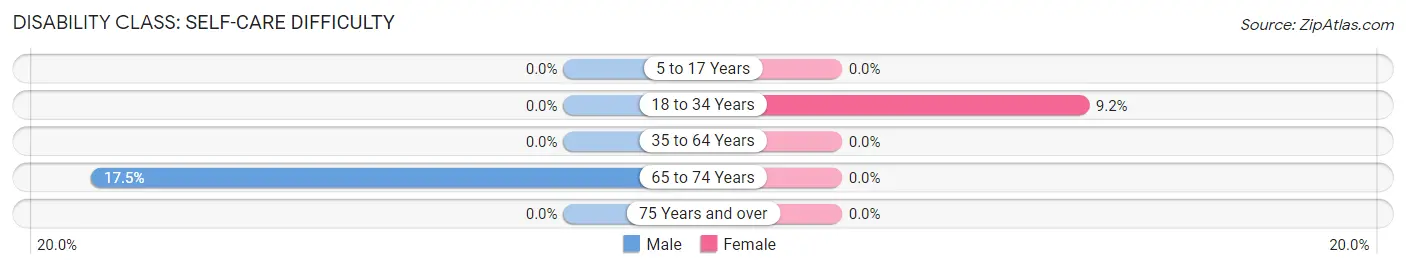
| Age Bracket | Male | Female |
| 5 to 17 Years | 0 (0.0%) | 0 (0.0%) |
| 18 to 34 Years | 0 (0.0%) | 33 (9.2%) |
| 35 to 64 Years | 0 (0.0%) | 0 (0.0%) |
| 65 to 74 Years | 17 (17.5%) | 0 (0.0%) |
| 75 Years and over | 0 (0.0%) | 0 (0.0%) |
Technology Access in Afton
Computing Device Access in Afton
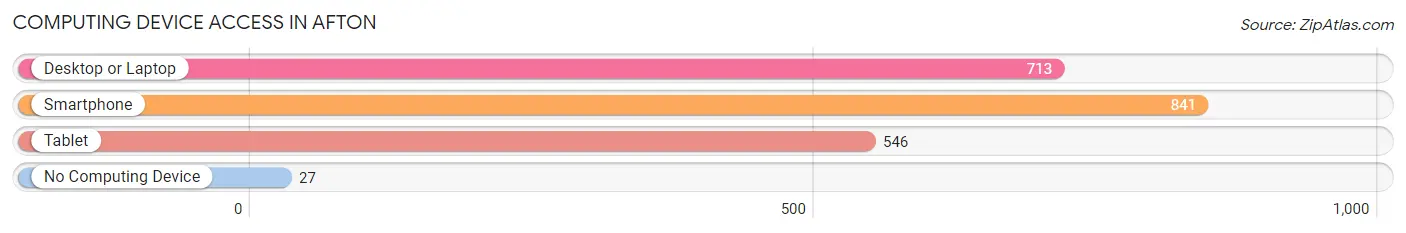
| Device Type | # Households | % Households |
| Desktop or Laptop | 713 | 76.7% |
| Smartphone | 841 | 90.4% |
| Tablet | 546 | 58.7% |
| No Computing Device | 27 | 2.9% |
| Total | 930 | 100.0% |
Internet Access in Afton
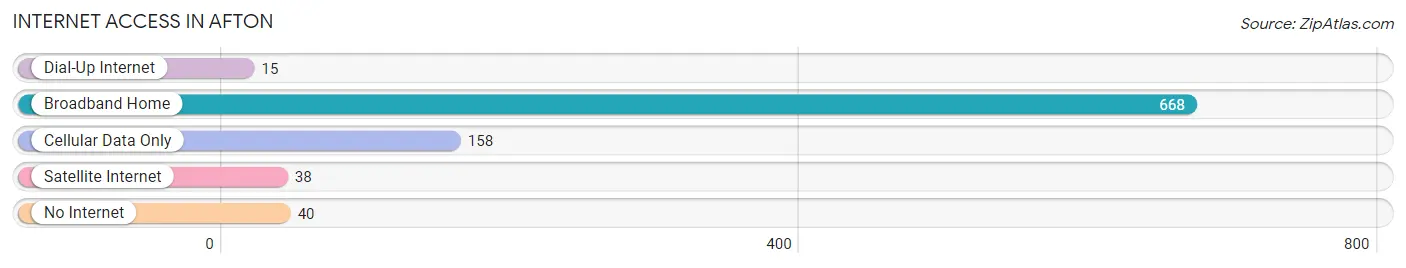
| Internet Type | # Households | % Households |
| Dial-Up Internet | 15 | 1.6% |
| Broadband Home | 668 | 71.8% |
| Cellular Data Only | 158 | 17.0% |
| Satellite Internet | 38 | 4.1% |
| No Internet | 40 | 4.3% |
| Total | 930 | 100.0% |
Afton Summary
Afton, Wyoming is a small town located in the southwestern corner of the state, near the Utah border. It is the county seat of Lincoln County and is situated in the Star Valley, a narrow valley surrounded by the Salt River Range to the east and the Wyoming Range to the west. The town is located at the confluence of the Salt and Greys Rivers, and is the largest town in the valley.
History
The area around Afton was first settled in the late 1800s by Mormon pioneers. The town was originally known as Star Valley Ranch, and was established in 1884. The town was renamed Afton in 1887, after the poem “Afton Water” by Robert Burns. The town was incorporated in 1901, and the first post office was established in 1902.
The town grew rapidly in the early 1900s, and by 1910, the population had grown to over 1,000. The town was a major center for the timber industry, and the local sawmill was the largest in the state. The town also had a thriving agricultural industry, and was home to several large farms.
In the 1920s, the town began to decline as the timber industry moved away and the agricultural industry declined. The population dropped to just over 500 by 1930. The town began to recover in the 1940s, and the population grew to over 1,000 by 1950.
Geography
Afton is located in the Star Valley, a narrow valley surrounded by the Salt River Range to the east and the Wyoming Range to the west. The town is situated at the confluence of the Salt and Greys Rivers. The town is located at an elevation of 6,000 feet, and the surrounding area is mostly mountainous.
The climate in Afton is semi-arid, with hot summers and cold winters. The average annual temperature is 44°F, and the average annual precipitation is 12 inches.
Economy
The economy of Afton is largely based on tourism and agriculture. The town is a popular destination for outdoor recreation, and is home to several ski resorts. The local agricultural industry is centered around cattle ranching and hay production.
The town is also home to several manufacturing companies, including a furniture factory and a wood products plant. The town is also home to several retail stores, restaurants, and other businesses.
Demographics
As of the 2010 census, the population of Afton was 1,911. The racial makeup of the town was 95.3% White, 0.3% African American, 0.7% Native American, 0.3% Asian, 0.1% Pacific Islander, 1.2% from other races, and 2.3% from two or more races. Hispanic or Latino of any race were 4.2% of the population.
The median household income in Afton was $41,250, and the median family income was $48,750. The per capita income was $20,945. About 11.2% of families and 14.2% of the population were below the poverty line, including 17.2% of those under age 18 and 8.3% of those age 65 or over.
Common Questions
What is Per Capita Income in Afton?
Per Capita income in Afton is $30,930.
What is the Median Family Income in Afton?
Median Family Income in Afton is $79,813.
What is the Median Household income in Afton?
Median Household Income in Afton is $52,273.
What is Income or Wage Gap in Afton?
Income or Wage Gap in Afton is 17.1%.
Women in Afton earn 82.9 cents for every dollar earned by a man.
What is Inequality or Gini Index in Afton?
Inequality or Gini Index in Afton is 0.44.
What is the Total Population of Afton?
Total Population of Afton is 2,303.
What is the Total Male Population of Afton?
Total Male Population of Afton is 958.
What is the Total Female Population of Afton?
Total Female Population of Afton is 1,345.
What is the Ratio of Males per 100 Females in Afton?
There are 71.23 Males per 100 Females in Afton.
What is the Ratio of Females per 100 Males in Afton?
There are 140.40 Females per 100 Males in Afton.
What is the Median Population Age in Afton?
Median Population Age in Afton is 35.3 Years.
What is the Average Family Size in Afton
Average Family Size in Afton is 3.2 People.
What is the Average Household Size in Afton
Average Household Size in Afton is 2.4 People.
How Large is the Labor Force in Afton?
There are 1,333 People in the Labor Forcein in Afton.
What is the Percentage of People in the Labor Force in Afton?
74.4% of People are in the Labor Force in Afton.
What is the Unemployment Rate in Afton?
Unemployment Rate in Afton is 6.3%.