Zip Codes with the Highest Percentage of Population with a Degree in Communications in Kenosha, WI

RELATED REPORTS & OPTIONS

Communications
Population
Families and Households
Female Fertility
Female Fertility (Unmarried)
Race (Community Size)
Race (Percentage)
Ancestry (Community Size)
AfricanAlbanianAmericanApacheArabArgentineanArmenianAustralianAustrianBangladeshiBelgianBhutaneseBlackfeetBritishBurmeseCajunCanadianCentral AmericanCentral American IndianCherokeeChickasawChineseChippewaChoctawColombianCroatianCubanCzechCzechoslovakianDanishDominicanDutchEastern EuropeanEnglishEuropeanFinnishFrenchFrench CanadianGermanGreekGuatemalanHaitianHonduranHungarianIcelanderIndian (Asian)IranianIrishIroquoisItalianJamaicanKoreanLatvianLebaneseLithuanianLuxembourgerMacedonianMenomineeMexicanMexican American IndianNative HawaiianNicaraguanNigerianNorthern EuropeanNorwegianPalestinianPanamanianPennsylvania GermanPeruvianPolishPortuguesePuerto RicanRomanianRussianScandinavianScotch-IrishScottishSerbianSiouxSlavicSlovakSloveneSouth AmericanSpaniardSpanishSri LankanSubsaharan AfricanSwedishSwissThaiUkrainianWelshYugoslavian
Ancestry (Percentage)
AfricanAlbanianAmericanApacheArabArgentineanArmenianAustralianAustrianBangladeshiBelgianBhutaneseBlackfeetBritishBurmeseCajunCanadianCentral AmericanCentral American IndianCherokeeChickasawChineseChippewaChoctawColombianCroatianCubanCzechCzechoslovakianDanishDominicanDutchEastern EuropeanEnglishEuropeanFinnishFrenchFrench CanadianGermanGreekGuatemalanHaitianHonduranHungarianIcelanderIndian (Asian)IranianIrishIroquoisItalianJamaicanKoreanLatvianLebaneseLithuanianLuxembourgerMacedonianMenomineeMexicanMexican American IndianNative HawaiianNicaraguanNigerianNorthern EuropeanNorwegianPalestinianPanamanianPennsylvania GermanPeruvianPolishPortuguesePuerto RicanRomanianRussianScandinavianScotch-IrishScottishSerbianSiouxSlavicSlovakSloveneSouth AmericanSpaniardSpanishSri LankanSubsaharan AfricanSwedishSwissThaiUkrainianWelshYugoslavian
Immigrant Origin (Total)
Immigrant Origin (Percentage)
Income
Income (Families)
Income (Households)
Poverty
Poverty (Families)
Unemployment
Employment Occupations
Employment Industries
Employer Class
Commute Time
Commute Means
School Enrollment
Education by Degree Field
Occupancy
Finances
Physical Characteristics
Kenosha
Compare Zip Codes
Comparison Subject

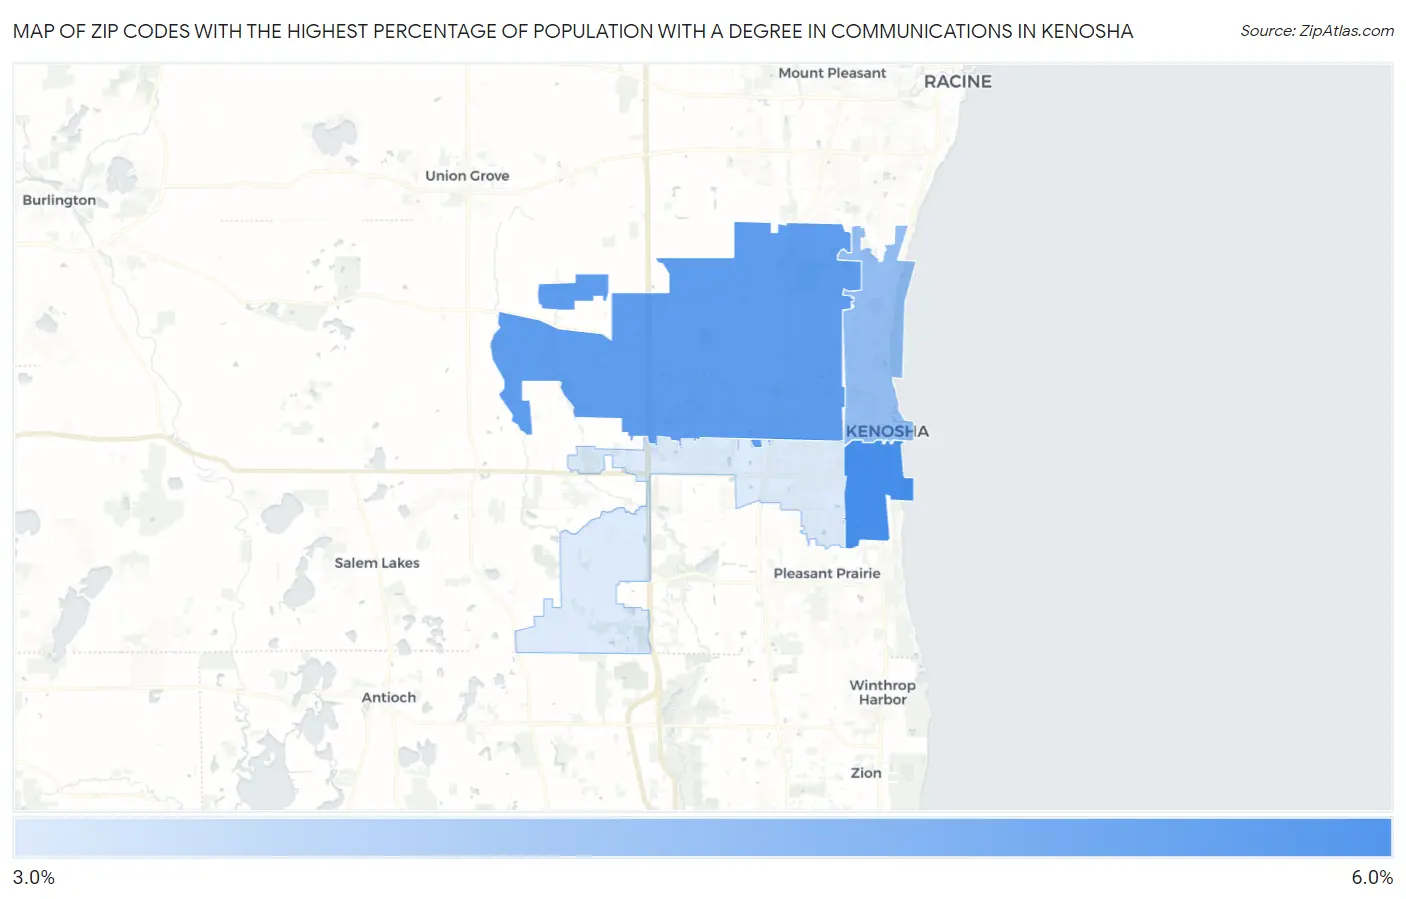
Map of Zip Codes with the Highest Percentage of Population with a Degree in Communications in Kenosha

0.0%
6.0%
Zip Codes with the Highest Percentage of Population with a Degree in Communications in Kenosha Map

Zip Codes with the Highest Percentage of Population with a Degree in Communications in Kenosha, WI

Zip Code % Graduates vs State vs National
1.531435.7%4.4%(+1.34)#1124.1%(+1.57)#4,254
2.531445.3%4.4%(+0.960)#1364.1%(+1.20)#4,973
3.531404.5%4.4%(+0.128)#2074.1%(+0.363)#6,963
4.531423.4%4.4%(-1.00)#3214.1%(-0.765)#10,809

Common Questions

What are the Top 3 Zip Codes with the Highest Percentage of Population with a Degree in Communications in Kenosha, WI?
Top 3 Zip Codes with the Highest Percentage of Population with a Degree in Communications in Kenosha, WI are:
#1
5.7%
#2
5.3%
#3
4.5%
What zip code has the Highest Percentage of Population with a Degree in Communications in Kenosha, WI?
53143 has the Highest Percentage of Population with a Degree in Communications in Kenosha, WI with 5.7%.
What is the Percentage of Population with a Degree in Communications in Kenosha, WI?
Percentage of Population with a Degree in Communications in Kenosha is 4.7%.
What is the Percentage of Population with a Degree in Communications in Wisconsin?
Percentage of Population with a Degree in Communications in Wisconsin is 4.4%.
What is the Percentage of Population with a Degree in Communications in the United States?
Percentage of Population with a Degree in Communications in the United States is 4.1%.