Zip Codes with the Most Immigrants from Korea in Silverdale, WA
On this page
RELATED REPORTS & OPTIONS
Korea
Population
Highest PopulationHighest Population DensityLowest Population DensityMale / Female RatioFemale / Male RatioOldest PopulationOldest Population | MaleOldest Population | FemaleYoungest PopulationYoungest Population | MaleYoungest Population | Female
Families and Households
Largest Family SizeLargest Household SizeMost Single MothersFewest Single MothersSmallest Family SizeSmallest Household Size
Female Fertility
Highest Birth Rate | All WomenHighest Birth Rate | Below PovertyHighest Birth Rate | Public IncomeHighest Birth Rate | In Labor ForceLowest Birth Rate | All WomenLowest Birth Rate | Below PovertyLowest Birth Rate | Public IncomeLowest Birth Rate | In Labor Force
Race (Community Size)
Race (Percentage)
Ancestry (Community Size)
AfricanAmericanBhutaneseBurmeseCanadianCentral AmericanCherokeeColombianCubanCzechDanishDutchEnglishEuropeanFinnishFrenchGermanGreekGuamanian / ChamorroGuatemalanHungarianIndian (Asian)IranianIrishItalianJamaicanKoreanMexicanNative HawaiianNorthern EuropeanNorwegianPakistaniPolishPuerto RicanRussianSamoanScandinavianScotch-IrishScottishSouth AmericanSpaniardSpanishSri LankanSubsaharan AfricanSwedishSwissUkrainianWelsh
Ancestry (Percentage)
AfricanAmericanBhutaneseBurmeseCanadianCentral AmericanCherokeeColombianCubanCzechDanishDutchEnglishEuropeanFinnishFrenchGermanGreekGuamanian / ChamorroGuatemalanHungarianIndian (Asian)IranianIrishItalianJamaicanKoreanMexicanNative HawaiianNorthern EuropeanNorwegianPakistaniPolishPuerto RicanRussianSamoanScandinavianScotch-IrishScottishSouth AmericanSpaniardSpanishSri LankanSubsaharan AfricanSwedishSwissUkrainianWelsh
Immigrant Origin (Total)
AfricaAsiaCanadaCaribbeanCentral AmericaEastern AsiaEuropeJamaicaJapanKoreaLatin AmericaMexicoPhilippinesSouth Central AsiaSouth Eastern AsiaSouthern EuropeSpain
Immigrant Origin (Percentage)
AfricaAsiaCanadaCaribbeanCentral AmericaEastern AsiaEuropeJamaicaJapanKoreaLatin AmericaMexicoPhilippinesSouth Central AsiaSouth Eastern AsiaSouthern EuropeSpain
Income
Highest Per Capita IncomeHighest Earnings | MaleHighest Earnings | FemaleHighest Wage/Income Gap ($)Highest Wage/Income Gap (%)Highest Inequality / Gini IndexLowest Per Capita IncomeLowest Earnings | MaleLowest Earnings | FemaleLowest Wage/Income Gap ($)Lowest Wage/Income Gap (%)Lowest Inequality / Gini Index
Income (Families)
Highest Family IncomeLowest Family IncomeFamily Income | $0-10kFamily Income | $100k+Family Income | $200k+
Income (Households)
Highest Household IncomeLowest Household IncomeHousehold Income | $0-10kHousehold Income | $200k+Household Income | $100k+
Poverty
Highest PovertyHighest Poverty | MaleHighest Poverty | FemaleHighest Poverty | Female 18-24Highest Poverty | Female 25-34Highest Poverty | Child 0-5Highest Poverty | Child 0-16Highest Poverty | Boys 0-16Highest Poverty | Girls 0-16Lowest PovertyLowest Poverty | MaleLowest Poverty | FemaleLowest Poverty | Child 0-5Lowest Poverty | Child 0-16Lowest Poverty | Boys 0-16Lowest Poverty | Girls 0-16
Poverty (Families)
Highest Family PovertyHighest Poverty | Married CoupleHighest Poverty | Single FemaleHighest Poverty | Single MotherLowest Family PovertyLowest Poverty | Married CoupleLowest Poverty | Single FemaleLowest Poverty | Single Mother
Unemployment
Highest UnemploymentHighest Unemployment | FemaleHighest Unemployment | Youth < 25Lowest UnemploymentLowest Unemployment | FemaleLowest Unemployment | Youth < 25
Employment Occupations
Arts, Media & EntertainmentBusiness & FinancialCleaning & MaintenanceCommunity & Social Service Computer & MathematicsComputer, Engineering & ScienceConstruction & ExtractionEducation Instruction & LibraryFood Preparation & ServingHealth Diagnosing & TreatingHealth TechnologistsHealthcare SupportInstallation, Maintenance & RepairLegal Services & SupportManagementOffice & AdministrationPersonal Care and ServiceProductionSales & Related
Employment Industries
Accommodation & Food ServicesAgriculture, Fishing & HuntingArts, Entertainment & RecreationConstructionEducational ServicesFinance & InsuranceHealth Care & Social AssistanceManufacturingProfessional & Scientific ServicesPublic AdministrationRetail TradeTransportation & WarehousingWholesale Trade
Employer Class
Private Company EmployeesSelf-Employed / IncorporatedNot-for-profit OrganizationsLocal Government EmployeesFederal Government Employees
Commute Time
Longest CommuteLongest Commute | MaleLongest Commute | FemaleShortest CommuteShortest Commute | MaleShortest Commute | Female
Commute Means
School Enrollment
In Private SchoolNursery / PreschoolKindergartenElementary SchoolMiddle SchoolHigh SchoolCollegeUniversity
Education by Degree Field
Computers and MathematicsBio, Nature & AgriculturalPhysical and Health SciencesPsychologySocial SciencesMultidisciplinary StudiesScience and EngineeringBusinessEducationLiterature and LanguagesLiberal Arts and HistoryVisual and Performing ArtsArts and Humanities
Occupancy
Finances
Highest Median Housing CostsHighest Renter Housing CostsHighest Housing Costs / IncomeLowest Median Housing CostsLowest Renter Housing CostsLowest Housing Costs / Income
Physical Characteristics
Silverdale
States
AlabamaAlaskaArizonaArkansasCaliforniaColoradoConnecticutDelawareDistrict Of ColumbiaFloridaGeorgiaHawaiiIdahoIllinoisIndianaIowaKansasKentuckyLouisianaMaineMarylandMassachusettsMichiganMinnesotaMississippiMissouriMontanaNebraskaNevadaNew HampshireNew JerseyNew MexicoNew YorkNorth CarolinaNorth DakotaOhioOklahomaOregonPennsylvaniaPuerto RicoRhode IslandSouth CarolinaSouth DakotaTennesseeTexasUtahVermontVirginiaWashingtonWest VirginiaWisconsinWyoming
Washington Cities
Compare Zip Codes
Comparison Subject
Compare StatesCompare CitiesCompare Zip Codes
Map of Zip Codes with the Most Immigrants from Korea in Silverdale
15
26
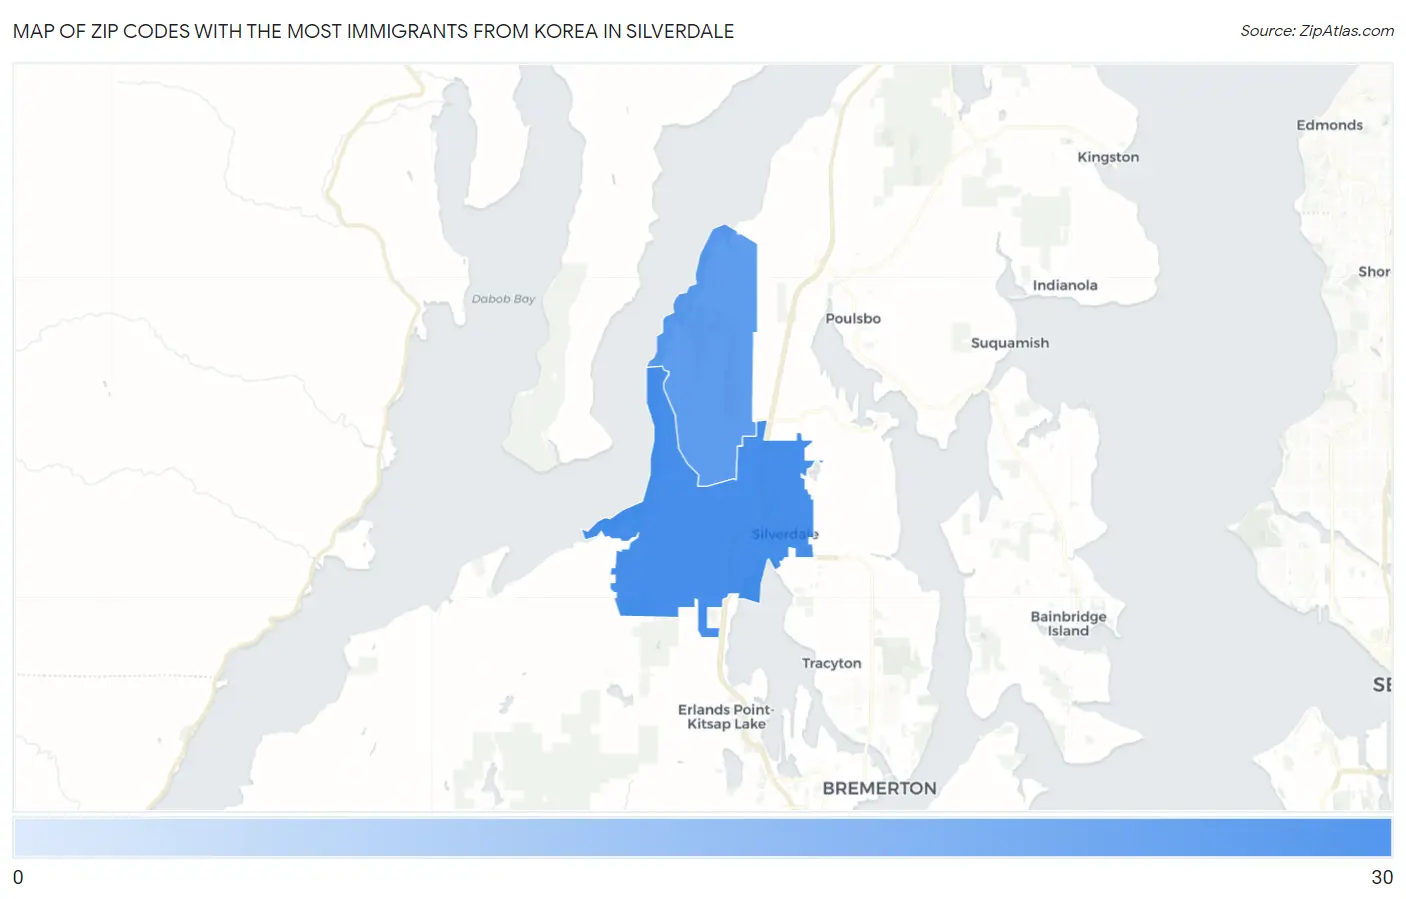
Zip Codes with the Most Immigrants from Korea in Silverdale, WA
| Zip Code | Korea | vs State | vs National | |
| 1. | 98383 | 26 | 48,886(0.05%)#179 | 1,034,299(0.00%)#5,124 |
| 2. | 98315 | 15 | 48,886(0.03%)#211 | 1,034,299(0.00%)#6,375 |
1
Common Questions
What are the Top Zip Codes with the Most Immigrants from Korea in Silverdale, WA?
Top Zip Codes with the Most Immigrants from Korea in Silverdale, WA are:
What zip code has the Most Immigrants from Korea in Silverdale, WA?
98383 has the Most Immigrants from Korea in Silverdale, WA with 26.
What is the Total Immigrants from Korea in Silverdale, WA?
Total Immigrants from Korea in Silverdale is 49.
What is the Total Immigrants from Korea in Washington?
Total Immigrants from Korea in Washington is 48,886.
What is the Total Immigrants from Korea in the United States?
Total Immigrants from Korea in the United States is 1,034,299.