Zip Codes with the Highest Percentage of Population Employed in Transportation & Warehousing in Kirkland, WA
RELATED REPORTS & OPTIONS
Transportation & Warehousing
Kirkland
Compare Zip Codes
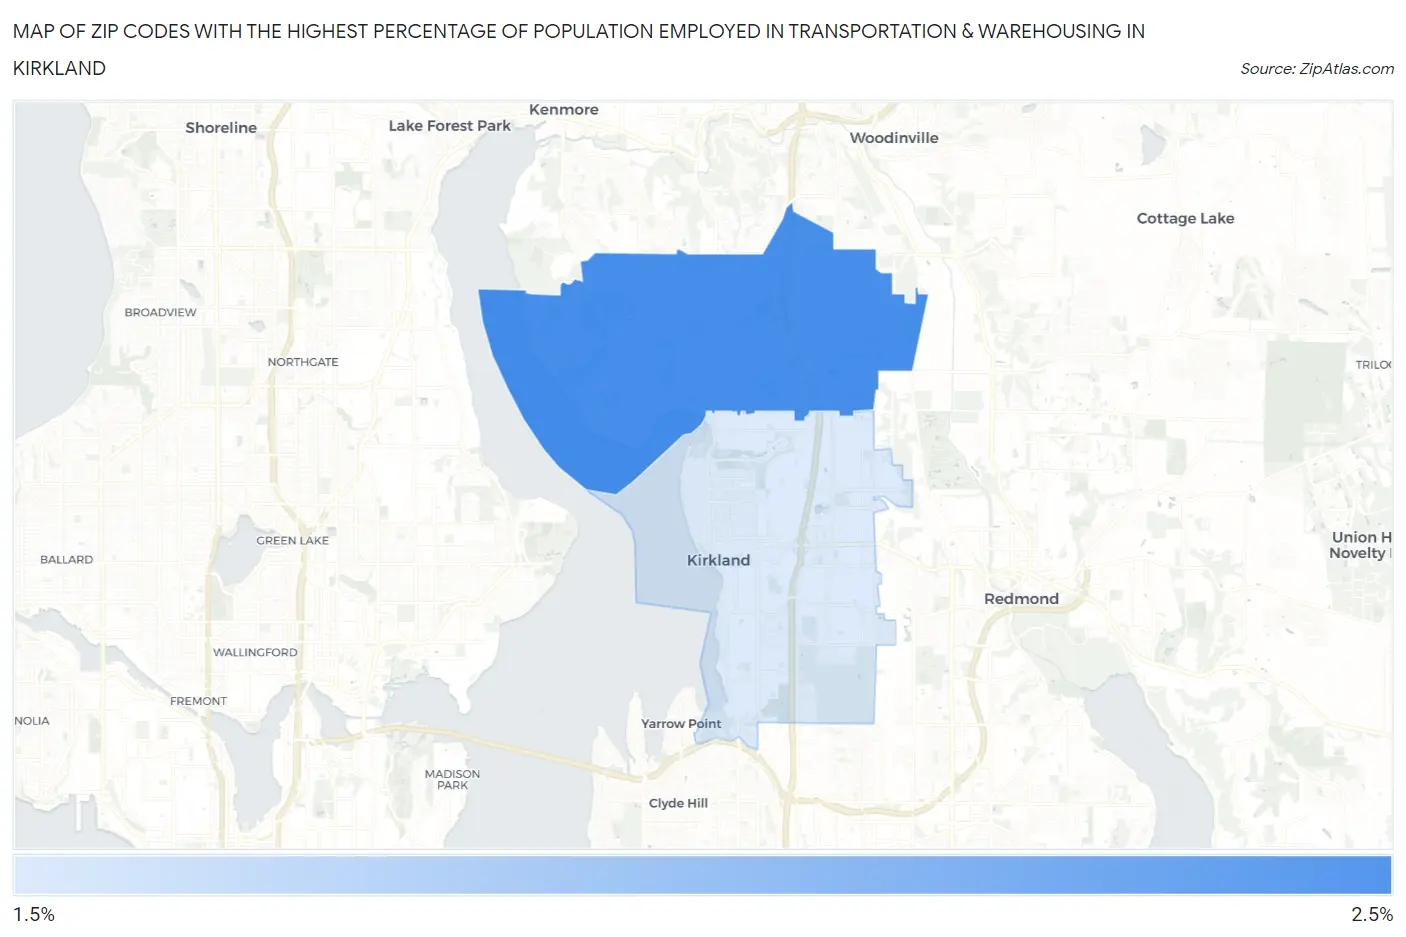
Map of Zip Codes with the Highest Percentage of Population Employed in Transportation & Warehousing in Kirkland
0.0%
2.5%
Zip Codes with the Highest Percentage of Population Employed in Transportation & Warehousing in Kirkland, WA
| Zip Code | % Employed | vs State | vs National | |
| 1. | 98034 | 2.2% | 4.9%(-2.73)#435 | 4.9%(-2.76)#23,618 |
| 2. | 98033 | 2.0% | 4.9%(-2.87)#445 | 4.9%(-2.91)#24,142 |
1
Common Questions
What are the Top Zip Codes with the Highest Percentage of Population Employed in Transportation & Warehousing in Kirkland, WA?
Top Zip Codes with the Highest Percentage of Population Employed in Transportation & Warehousing in Kirkland, WA are:
What zip code has the Highest Percentage of Population Employed in Transportation & Warehousing in Kirkland, WA?
98034 has the Highest Percentage of Population Employed in Transportation & Warehousing in Kirkland, WA with 2.2%.
What is the Percentage of Population Employed in Transportation & Warehousing in Kirkland, WA?
Percentage of Population Employed in Transportation & Warehousing in Kirkland is 2.1%.
What is the Percentage of Population Employed in Transportation & Warehousing in Washington?
Percentage of Population Employed in Transportation & Warehousing in Washington is 4.9%.
What is the Percentage of Population Employed in Transportation & Warehousing in the United States?
Percentage of Population Employed in Transportation & Warehousing in the United States is 4.9%.