Zip Codes with the Highest Percentage of Population Employed in Arts, Entertainment & Recreation in Burlington, VT
RELATED REPORTS & OPTIONS
Arts, Entertainment & Recreation
Burlington
Compare Zip Codes
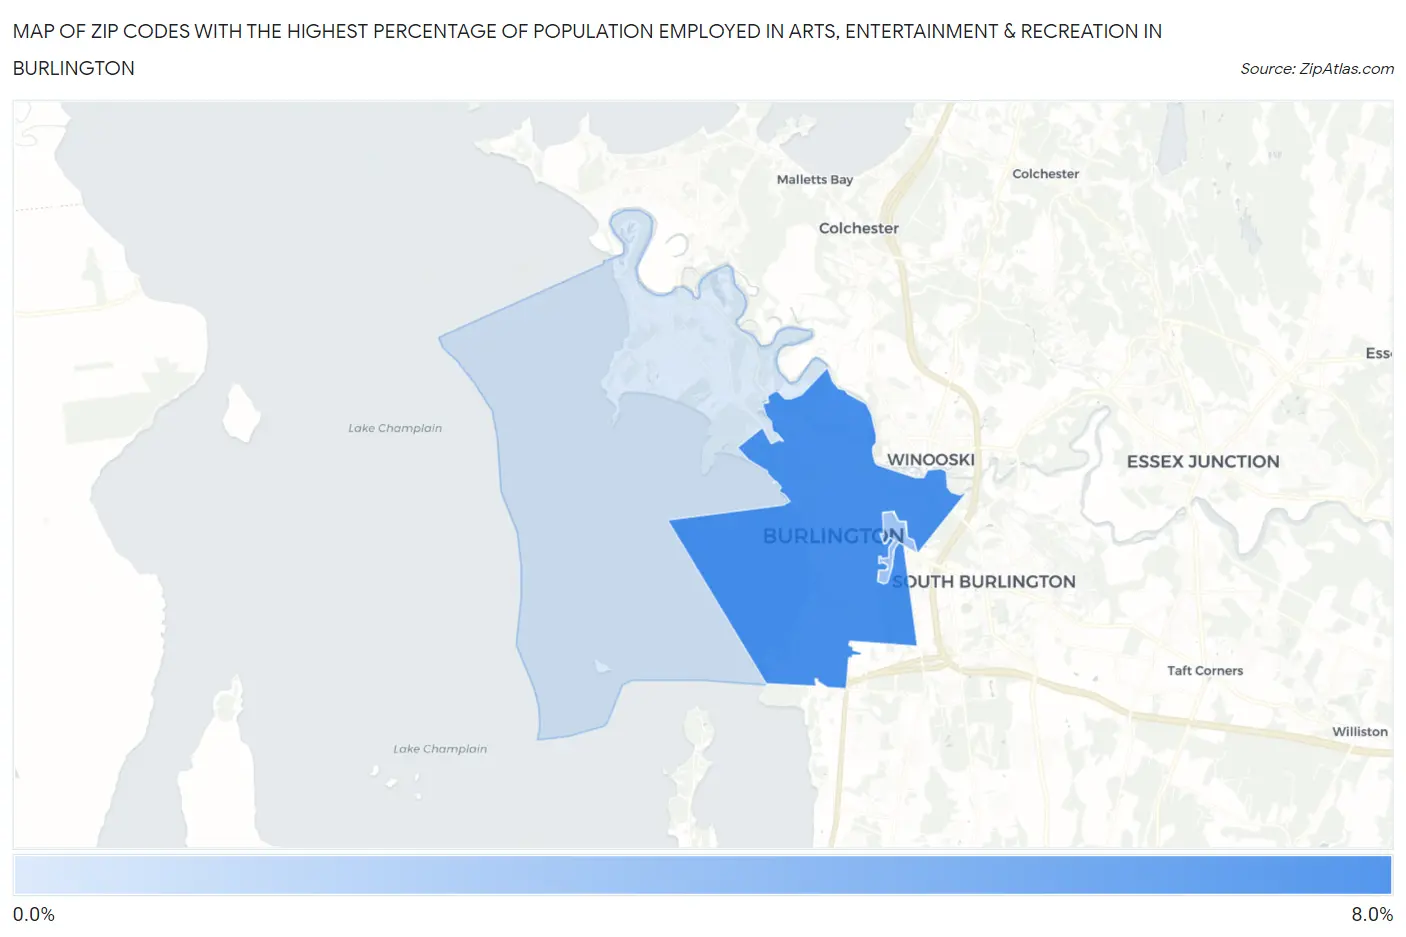
Map of Zip Codes with the Highest Percentage of Population Employed in Arts, Entertainment & Recreation in Burlington
1.3%
6.1%
Zip Codes with the Highest Percentage of Population Employed in Arts, Entertainment & Recreation in Burlington, VT
| Zip Code | % Employed | vs State | vs National | |
| 1. | 05401 | 6.1% | 2.8%(+3.30)#31 | 2.1%(+4.00)#1,659 |
| 2. | 05405 | 3.2% | 2.8%(+0.372)#77 | 2.1%(+1.08)#4,908 |
| 3. | 05408 | 1.3% | 2.8%(-1.49)#144 | 2.1%(-0.786)#14,739 |
1
Common Questions
What are the Top Zip Codes with the Highest Percentage of Population Employed in Arts, Entertainment & Recreation in Burlington, VT?
Top Zip Codes with the Highest Percentage of Population Employed in Arts, Entertainment & Recreation in Burlington, VT are:
What zip code has the Highest Percentage of Population Employed in Arts, Entertainment & Recreation in Burlington, VT?
05401 has the Highest Percentage of Population Employed in Arts, Entertainment & Recreation in Burlington, VT with 6.1%.
What is the Percentage of Population Employed in Arts, Entertainment & Recreation in Burlington, VT?
Percentage of Population Employed in Arts, Entertainment & Recreation in Burlington is 4.9%.
What is the Percentage of Population Employed in Arts, Entertainment & Recreation in Vermont?
Percentage of Population Employed in Arts, Entertainment & Recreation in Vermont is 2.8%.
What is the Percentage of Population Employed in Arts, Entertainment & Recreation in the United States?
Percentage of Population Employed in Arts, Entertainment & Recreation in the United States is 2.1%.