Zip Codes with the Highest Percentage of Population Employed in Arts, Entertainment & Recreation in Virginia
RELATED REPORTS & OPTIONS
Arts, Entertainment & Recreation
Virginia
Compare Zip Codes
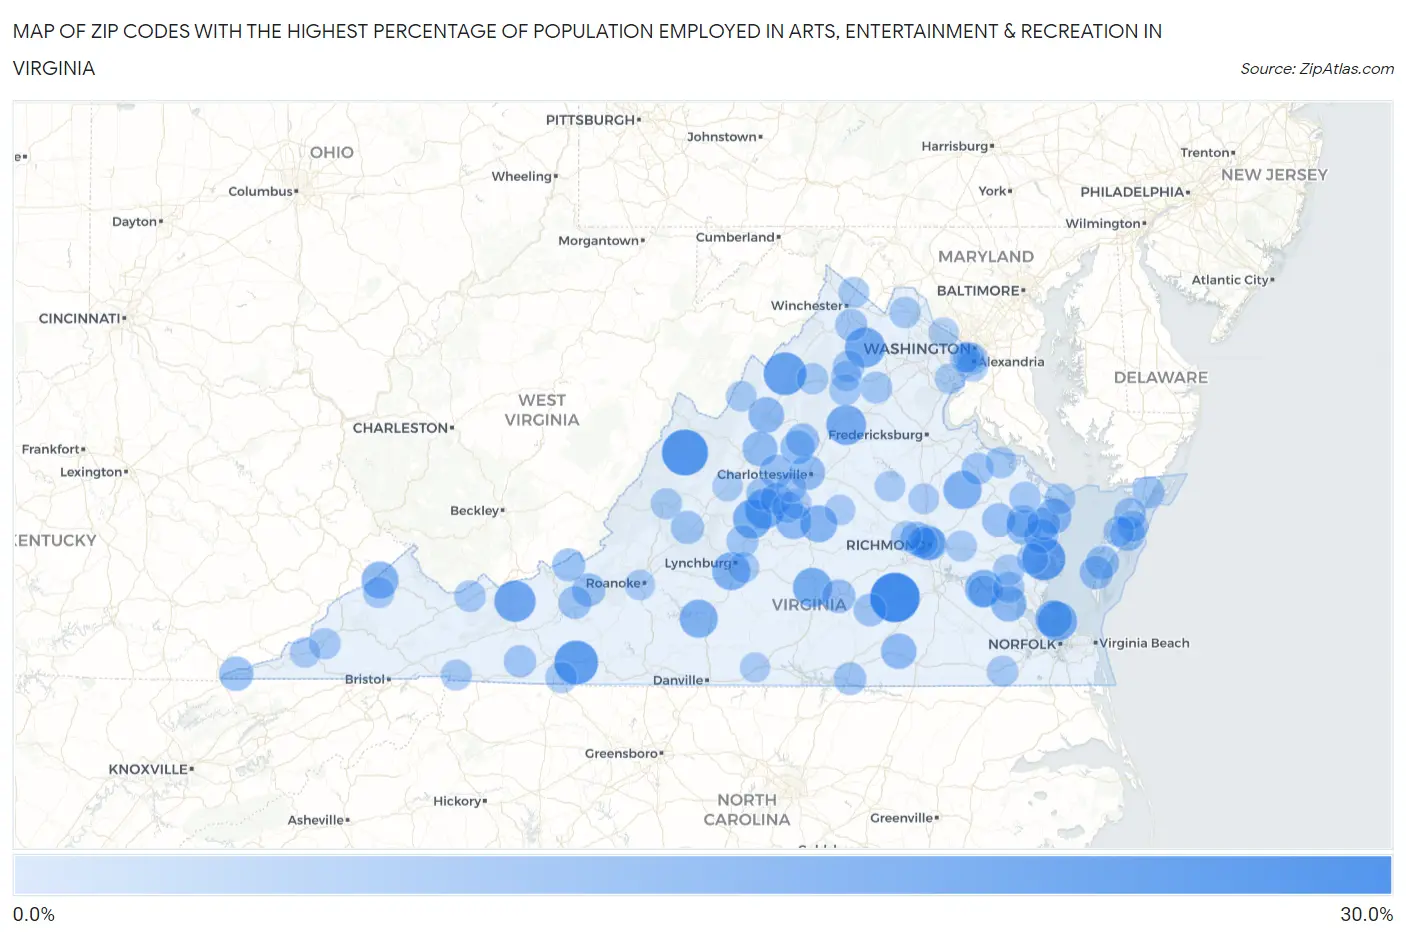
Map of Zip Codes with the Highest Percentage of Population Employed in Arts, Entertainment & Recreation in Virginia
0.0%
30.0%
Zip Codes with the Highest Percentage of Population Employed in Arts, Entertainment & Recreation in Virginia
| Zip Code | % Employed | vs State | vs National | |
| 1. | 23850 | 26.6% | 1.9%(+24.7)#1 | 2.1%(+24.5)#106 |
| 2. | 24487 | 22.4% | 1.9%(+20.5)#2 | 2.1%(+20.3)#144 |
| 3. | 24352 | 19.5% | 1.9%(+17.7)#3 | 2.1%(+17.4)#192 |
| 4. | 23128 | 18.8% | 1.9%(+17.0)#4 | 2.1%(+16.8)#212 |
| 5. | 22847 | 18.3% | 1.9%(+16.4)#5 | 2.1%(+16.2)#225 |
| 6. | 24315 | 16.4% | 1.9%(+14.6)#6 | 2.1%(+14.4)#271 |
| 7. | 22643 | 15.3% | 1.9%(+13.4)#7 | 2.1%(+13.2)#324 |
| 8. | 22949 | 15.0% | 1.9%(+13.1)#8 | 2.1%(+12.9)#332 |
| 9. | 22730 | 14.8% | 1.9%(+12.9)#9 | 2.1%(+12.7)#346 |
| 10. | 23943 | 14.0% | 1.9%(+12.1)#10 | 2.1%(+11.9)#389 |
| 11. | 23651 | 14.0% | 1.9%(+12.1)#11 | 2.1%(+11.9)#392 |
| 12. | 22964 | 13.9% | 1.9%(+12.1)#12 | 2.1%(+11.9)#395 |
| 13. | 23126 | 12.8% | 1.9%(+11.0)#13 | 2.1%(+10.7)#464 |
| 14. | 24139 | 12.7% | 1.9%(+10.8)#14 | 2.1%(+10.6)#472 |
| 15. | 24515 | 12.6% | 1.9%(+10.7)#15 | 2.1%(+10.5)#478 |
| 16. | 23899 | 12.1% | 1.9%(+10.2)#16 | 2.1%(+10.0)#502 |
| 17. | 23004 | 11.4% | 1.9%(+9.59)#17 | 2.1%(+9.36)#554 |
| 18. | 23668 | 11.3% | 1.9%(+9.48)#18 | 2.1%(+9.25)#568 |
| 19. | 24607 | 11.3% | 1.9%(+9.42)#19 | 2.1%(+9.19)#574 |
| 20. | 24562 | 10.0% | 1.9%(+8.15)#20 | 2.1%(+7.92)#700 |
| 21. | 22807 | 9.8% | 1.9%(+7.96)#21 | 2.1%(+7.73)#732 |
| 22. | 23883 | 9.7% | 1.9%(+7.87)#22 | 2.1%(+7.64)#742 |
| 23. | 22482 | 9.6% | 1.9%(+7.76)#23 | 2.1%(+7.53)#765 |
| 24. | 23856 | 9.5% | 1.9%(+7.68)#24 | 2.1%(+7.45)#774 |
| 25. | 22904 | 9.1% | 1.9%(+7.22)#25 | 2.1%(+6.99)#842 |
| 26. | 24437 | 8.9% | 1.9%(+7.10)#26 | 2.1%(+6.87)#862 |
| 27. | 23284 | 8.8% | 1.9%(+6.96)#27 | 2.1%(+6.73)#887 |
| 28. | 23175 | 8.5% | 1.9%(+6.63)#28 | 2.1%(+6.40)#944 |
| 29. | 23480 | 8.4% | 1.9%(+6.58)#29 | 2.1%(+6.35)#959 |
| 30. | 23169 | 8.4% | 1.9%(+6.51)#30 | 2.1%(+6.28)#972 |
| 31. | 24248 | 8.2% | 1.9%(+6.37)#31 | 2.1%(+6.14)#998 |
| 32. | 22940 | 7.9% | 1.9%(+6.08)#32 | 2.1%(+5.85)#1,078 |
| 33. | 23173 | 7.7% | 1.9%(+5.86)#33 | 2.1%(+5.63)#1,128 |
| 34. | 23922 | 7.5% | 1.9%(+5.64)#34 | 2.1%(+5.41)#1,179 |
| 35. | 23085 | 7.2% | 1.9%(+5.37)#35 | 2.1%(+5.14)#1,258 |
| 36. | 22943 | 7.2% | 1.9%(+5.34)#36 | 2.1%(+5.11)#1,268 |
| 37. | 23405 | 7.2% | 1.9%(+5.32)#37 | 2.1%(+5.09)#1,277 |
| 38. | 23298 | 7.1% | 1.9%(+5.29)#38 | 2.1%(+5.06)#1,288 |
| 39. | 22935 | 7.1% | 1.9%(+5.26)#39 | 2.1%(+5.03)#1,300 |
| 40. | 23347 | 7.1% | 1.9%(+5.23)#40 | 2.1%(+4.99)#1,309 |
| 41. | 24061 | 6.9% | 1.9%(+5.08)#41 | 2.1%(+4.85)#1,355 |
| 42. | 24578 | 6.8% | 1.9%(+4.99)#42 | 2.1%(+4.76)#1,379 |
| 43. | 24150 | 6.7% | 1.9%(+4.90)#43 | 2.1%(+4.67)#1,404 |
| 44. | 24142 | 6.6% | 1.9%(+4.77)#44 | 2.1%(+4.54)#1,450 |
| 45. | 22576 | 6.6% | 1.9%(+4.72)#45 | 2.1%(+4.48)#1,467 |
| 46. | 23824 | 6.4% | 1.9%(+4.51)#46 | 2.1%(+4.27)#1,558 |
| 47. | 23919 | 6.3% | 1.9%(+4.47)#47 | 2.1%(+4.23)#1,575 |
| 48. | 22958 | 6.0% | 1.9%(+4.18)#48 | 2.1%(+3.95)#1,683 |
| 49. | 24330 | 5.9% | 1.9%(+4.00)#49 | 2.1%(+3.77)#1,778 |
| 50. | 22438 | 5.8% | 1.9%(+3.96)#50 | 2.1%(+3.72)#1,804 |
| 51. | 24595 | 5.7% | 1.9%(+3.88)#51 | 2.1%(+3.65)#1,832 |
| 52. | 22663 | 5.7% | 1.9%(+3.88)#52 | 2.1%(+3.64)#1,838 |
| 53. | 23303 | 5.7% | 1.9%(+3.85)#53 | 2.1%(+3.62)#1,860 |
| 54. | 23180 | 5.6% | 1.9%(+3.79)#54 | 2.1%(+3.56)#1,889 |
| 55. | 23357 | 5.6% | 1.9%(+3.72)#55 | 2.1%(+3.49)#1,923 |
| 56. | 22938 | 5.5% | 1.9%(+3.64)#56 | 2.1%(+3.40)#1,974 |
| 57. | 22724 | 5.5% | 1.9%(+3.63)#57 | 2.1%(+3.39)#1,981 |
| 58. | 23881 | 5.3% | 1.9%(+3.43)#58 | 2.1%(+3.19)#2,092 |
| 59. | 22627 | 5.1% | 1.9%(+3.28)#59 | 2.1%(+3.05)#2,192 |
| 60. | 24630 | 5.0% | 1.9%(+3.15)#60 | 2.1%(+2.91)#2,291 |
| 61. | 22520 | 4.9% | 1.9%(+3.07)#61 | 2.1%(+2.84)#2,339 |
| 62. | 24317 | 4.9% | 1.9%(+3.07)#62 | 2.1%(+2.84)#2,341 |
| 63. | 22460 | 4.9% | 1.9%(+3.06)#63 | 2.1%(+2.83)#2,351 |
| 64. | 20158 | 4.8% | 1.9%(+2.99)#64 | 2.1%(+2.76)#2,403 |
| 65. | 23221 | 4.8% | 1.9%(+2.95)#65 | 2.1%(+2.71)#2,444 |
| 66. | 23185 | 4.8% | 1.9%(+2.93)#66 | 2.1%(+2.70)#2,458 |
| 67. | 23188 | 4.8% | 1.9%(+2.91)#67 | 2.1%(+2.68)#2,476 |
| 68. | 22749 | 4.7% | 1.9%(+2.88)#68 | 2.1%(+2.65)#2,507 |
| 69. | 22835 | 4.7% | 1.9%(+2.86)#69 | 2.1%(+2.63)#2,512 |
| 70. | 24256 | 4.7% | 1.9%(+2.83)#70 | 2.1%(+2.60)#2,550 |
| 71. | 23301 | 4.6% | 1.9%(+2.79)#71 | 2.1%(+2.56)#2,588 |
| 72. | 23141 | 4.6% | 1.9%(+2.74)#72 | 2.1%(+2.50)#2,641 |
| 73. | 22969 | 4.6% | 1.9%(+2.73)#73 | 2.1%(+2.50)#2,646 |
| 74. | 24219 | 4.5% | 1.9%(+2.69)#74 | 2.1%(+2.46)#2,691 |
| 75. | 23061 | 4.5% | 1.9%(+2.63)#75 | 2.1%(+2.40)#2,766 |
| 76. | 22301 | 4.5% | 1.9%(+2.62)#76 | 2.1%(+2.38)#2,778 |
| 77. | 23437 | 4.4% | 1.9%(+2.57)#77 | 2.1%(+2.33)#2,828 |
| 78. | 24292 | 4.4% | 1.9%(+2.53)#78 | 2.1%(+2.30)#2,868 |
| 79. | 22307 | 4.3% | 1.9%(+2.45)#79 | 2.1%(+2.22)#2,960 |
| 80. | 24422 | 4.3% | 1.9%(+2.45)#80 | 2.1%(+2.22)#2,961 |
| 81. | 22539 | 4.3% | 1.9%(+2.42)#81 | 2.1%(+2.18)#3,002 |
| 82. | 24504 | 4.3% | 1.9%(+2.41)#82 | 2.1%(+2.18)#3,004 |
| 83. | 22624 | 4.2% | 1.9%(+2.39)#83 | 2.1%(+2.16)#3,024 |
| 84. | 22302 | 4.2% | 1.9%(+2.33)#84 | 2.1%(+2.10)#3,107 |
| 85. | 23401 | 4.2% | 1.9%(+2.32)#85 | 2.1%(+2.08)#3,125 |
| 86. | 23055 | 3.9% | 1.9%(+2.07)#86 | 2.1%(+1.84)#3,449 |
| 87. | 23024 | 3.9% | 1.9%(+2.07)#87 | 2.1%(+1.84)#3,454 |
| 88. | 22937 | 3.9% | 1.9%(+2.05)#88 | 2.1%(+1.81)#3,489 |
| 89. | 23047 | 3.9% | 1.9%(+2.04)#89 | 2.1%(+1.81)#3,496 |
| 90. | 22125 | 3.9% | 1.9%(+2.04)#90 | 2.1%(+1.81)#3,503 |
| 91. | 22959 | 3.9% | 1.9%(+2.00)#91 | 2.1%(+1.77)#3,543 |
| 92. | 22831 | 3.8% | 1.9%(+1.96)#92 | 2.1%(+1.72)#3,622 |
| 93. | 22747 | 3.8% | 1.9%(+1.94)#93 | 2.1%(+1.71)#3,648 |
| 94. | 24243 | 3.8% | 1.9%(+1.91)#94 | 2.1%(+1.68)#3,689 |
| 95. | 24015 | 3.7% | 1.9%(+1.84)#95 | 2.1%(+1.61)#3,790 |
| 96. | 23238 | 3.7% | 1.9%(+1.83)#96 | 2.1%(+1.59)#3,811 |
| 97. | 22311 | 3.6% | 1.9%(+1.75)#97 | 2.1%(+1.52)#3,953 |
| 98. | 24472 | 3.5% | 1.9%(+1.66)#98 | 2.1%(+1.43)#4,096 |
| 99. | 24592 | 3.5% | 1.9%(+1.63)#99 | 2.1%(+1.39)#4,182 |
| 100. | 22066 | 3.4% | 1.9%(+1.59)#100 | 2.1%(+1.35)#4,265 |
Common Questions
What are the Top 10 Zip Codes with the Highest Percentage of Population Employed in Arts, Entertainment & Recreation in Virginia?
Top 10 Zip Codes with the Highest Percentage of Population Employed in Arts, Entertainment & Recreation in Virginia are:
What zip code has the Highest Percentage of Population Employed in Arts, Entertainment & Recreation in Virginia?
23850 has the Highest Percentage of Population Employed in Arts, Entertainment & Recreation in Virginia with 26.6%.
What is the Percentage of Population Employed in Arts, Entertainment & Recreation in the State of Virginia?
Percentage of Population Employed in Arts, Entertainment & Recreation in Virginia is 1.9%.
What is the Percentage of Population Employed in Arts, Entertainment & Recreation in the United States?
Percentage of Population Employed in Arts, Entertainment & Recreation in the United States is 2.1%.