Zip Codes with the Highest Percentage of Population Employed in Agriculture, Fishing & Hunting in Reston, VA

RELATED REPORTS & OPTIONS

Agriculture, Fishing & Hunting
Population
Families and Households
Female Fertility
Female Fertility (Unmarried)
Race (Community Size)
Race (Percentage)
Ancestry (Community Size)
AfghanAfricanAmericanArabArgentineanArmenianAustralianAustrianBelgianBhutaneseBolivianBrazilianBritishBulgarianBurmeseCajunCanadianCentral AmericanCherokeeChileanColombianCosta RicanCroatianCubanCzechDanishDominicanDutchEastern EuropeanEcuadorianEgyptianEnglishEstonianEthiopianEuropeanFilipinoFinnishFrenchFrench CanadianGermanGreekGuatemalanHaitianHonduranHungarianIndian (Asian)IndonesianIranianIraqiIrishItalianJamaicanKenyanKoreanLatvianLebaneseLithuanianLuxembourgerMalaysianMexicanMexican American IndianMoroccanNicaraguanNorthern EuropeanNorwegianPakistaniPalestinianPanamanianParaguayanPeruvianPolishPortuguesePuerto RicanRomanianRussianSalvadoranScandinavianScotch-IrishScottishSerbianSlavicSlovakSloveneSouth AfricanSouth AmericanSouth American IndianSpaniardSpanishSri LankanSubsaharan AfricanSudaneseSwedishSwissSyrianThaiTurkishUkrainianVenezuelanVietnameseWelshWest Indian
Ancestry (Percentage)
AfghanAfricanAmericanArabArgentineanArmenianAustralianAustrianBelgianBhutaneseBolivianBrazilianBritishBulgarianBurmeseCajunCanadianCentral AmericanCherokeeChileanColombianCosta RicanCroatianCubanCzechDanishDominicanDutchEastern EuropeanEcuadorianEgyptianEnglishEstonianEthiopianEuropeanFilipinoFinnishFrenchFrench CanadianGermanGreekGuatemalanHaitianHonduranHungarianIndian (Asian)IndonesianIranianIraqiIrishItalianJamaicanKenyanKoreanLatvianLebaneseLithuanianLuxembourgerMalaysianMexicanMexican American IndianMoroccanNicaraguanNorthern EuropeanNorwegianPakistaniPalestinianPanamanianParaguayanPeruvianPolishPortuguesePuerto RicanRomanianRussianSalvadoranScandinavianScotch-IrishScottishSerbianSlavicSlovakSloveneSouth AfricanSouth AmericanSouth American IndianSpaniardSpanishSri LankanSubsaharan AfricanSudaneseSwedishSwissSyrianThaiTurkishUkrainianVenezuelanVietnameseWelshWest Indian
Immigrant Origin (Total)
Immigrant Origin (Percentage)
Income
Income (Families)
Income (Households)
Poverty
Poverty (Families)
Unemployment
Employment Occupations
Employment Industries
Employer Class
Commute Time
Commute Means
School Enrollment
Education by Degree Field
Occupancy
Finances
Physical Characteristics
Reston
Compare Zip Codes
Comparison Subject

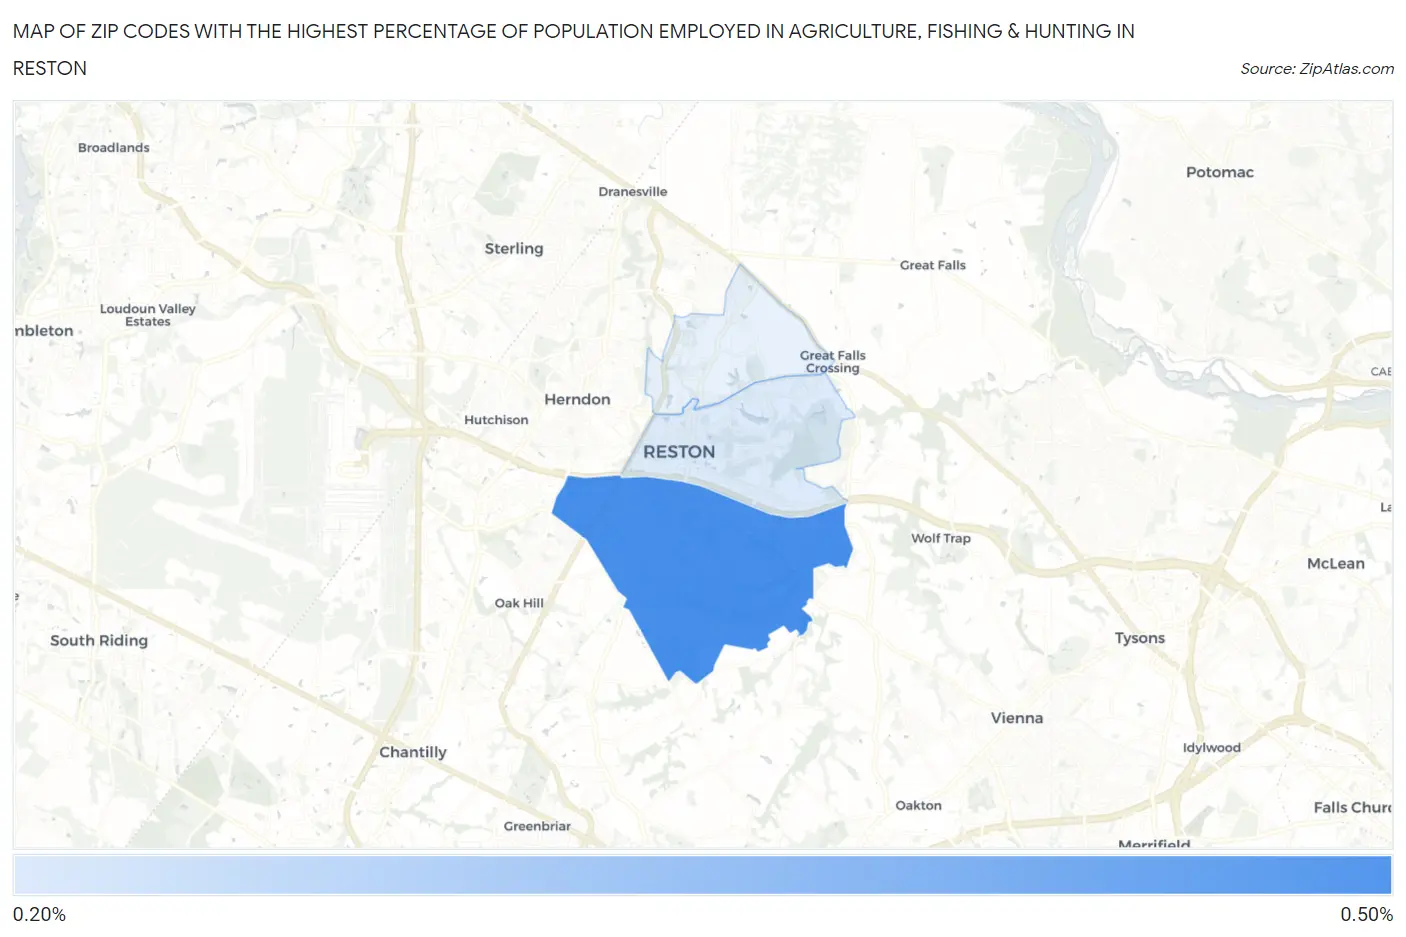
Map of Zip Codes with the Highest Percentage of Population Employed in Agriculture, Fishing & Hunting in Reston

0.0%
0.50%
Zip Codes with the Highest Percentage of Population Employed in Agriculture, Fishing & Hunting in Reston Map

Zip Codes with the Highest Percentage of Population Employed in Agriculture, Fishing & Hunting in Reston, VA

Zip Code % Employed vs State vs National
1.201910.45%0.69%(-0.233)#4151.2%(-0.746)#19,667
2.201900.24%0.69%(-0.443)#4721.2%(-0.956)#21,842

Common Questions

What are the Top Zip Codes with the Highest Percentage of Population Employed in Agriculture, Fishing & Hunting in Reston, VA?
Top Zip Codes with the Highest Percentage of Population Employed in Agriculture, Fishing & Hunting in Reston, VA are:
#1
0.45%
#2
0.24%
#3
0.0%
What zip code has the Highest Percentage of Population Employed in Agriculture, Fishing & Hunting in Reston, VA?
20191 has the Highest Percentage of Population Employed in Agriculture, Fishing & Hunting in Reston, VA with 0.45%.
What is the Percentage of Population Employed in Agriculture, Fishing & Hunting in Reston, VA?
Percentage of Population Employed in Agriculture, Fishing & Hunting in Reston is 0.29%.
What is the Percentage of Population Employed in Agriculture, Fishing & Hunting in Virginia?
Percentage of Population Employed in Agriculture, Fishing & Hunting in Virginia is 0.69%.
What is the Percentage of Population Employed in Agriculture, Fishing & Hunting in the United States?
Percentage of Population Employed in Agriculture, Fishing & Hunting in the United States is 1.2%.