Zip Codes with the Highest Percentage of Population Employed in Health Care & Social Assistance in Herndon, VA
RELATED REPORTS & OPTIONS
Health Care & Social Assistance
Herndon
Compare Zip Codes
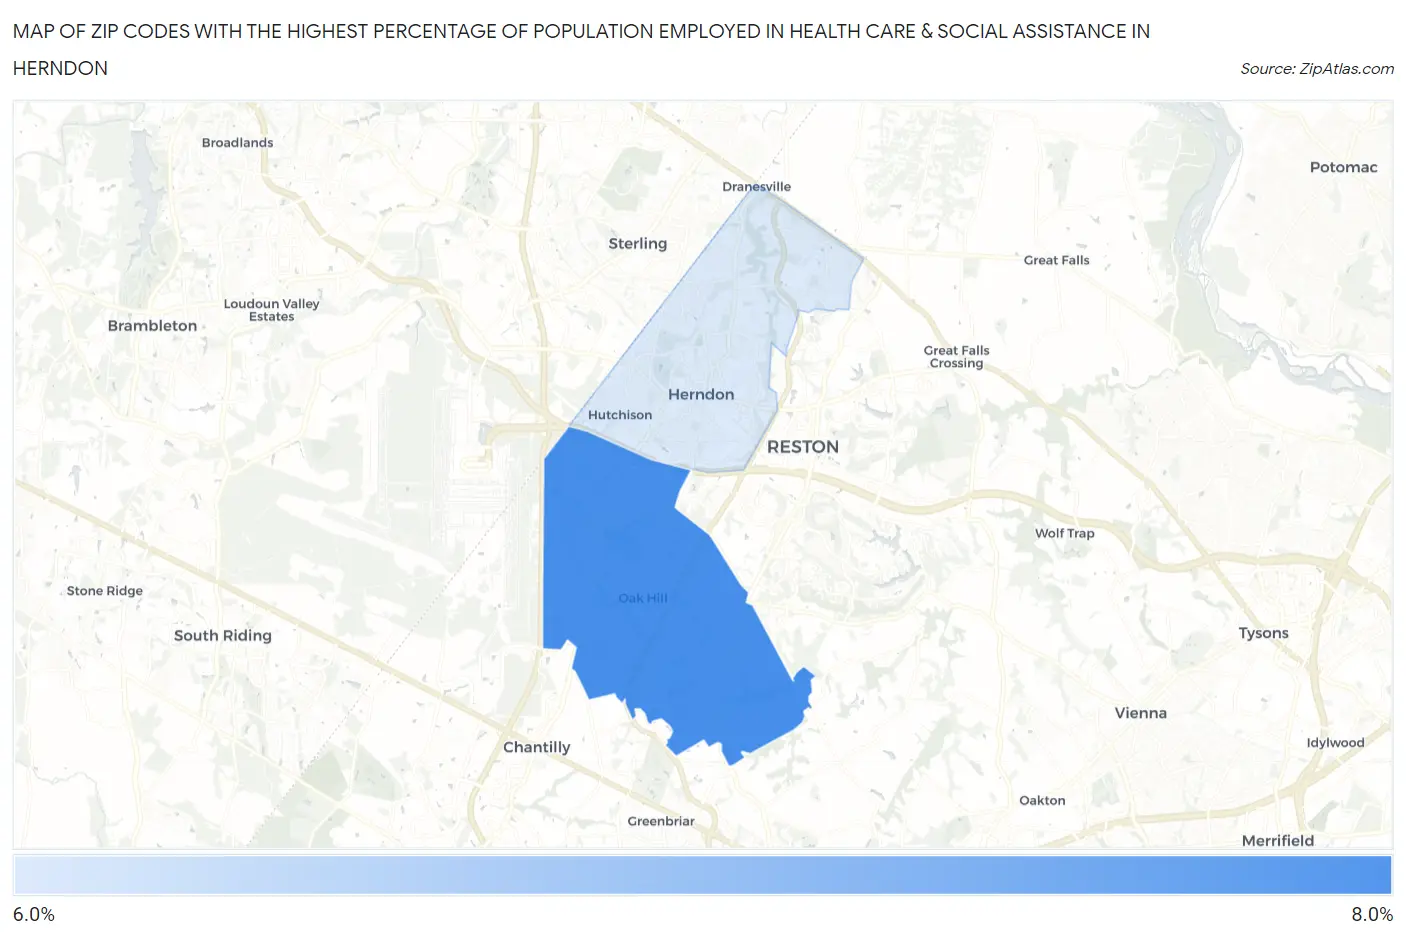
Map of Zip Codes with the Highest Percentage of Population Employed in Health Care & Social Assistance in Herndon
6.8%
7.2%
Zip Codes with the Highest Percentage of Population Employed in Health Care & Social Assistance in Herndon, VA
| Zip Code | % Employed | vs State | vs National | |
| 1. | 20171 | 7.2% | 12.3%(-5.07)#703 | 13.9%(-6.71)#27,275 |
| 2. | 20170 | 6.8% | 12.3%(-5.50)#713 | 13.9%(-7.15)#27,688 |
1
Common Questions
What are the Top Zip Codes with the Highest Percentage of Population Employed in Health Care & Social Assistance in Herndon, VA?
Top Zip Codes with the Highest Percentage of Population Employed in Health Care & Social Assistance in Herndon, VA are:
What zip code has the Highest Percentage of Population Employed in Health Care & Social Assistance in Herndon, VA?
20171 has the Highest Percentage of Population Employed in Health Care & Social Assistance in Herndon, VA with 7.2%.
What is the Percentage of Population Employed in Health Care & Social Assistance in Herndon, VA?
Percentage of Population Employed in Health Care & Social Assistance in Herndon is 5.8%.
What is the Percentage of Population Employed in Health Care & Social Assistance in Virginia?
Percentage of Population Employed in Health Care & Social Assistance in Virginia is 12.3%.
What is the Percentage of Population Employed in Health Care & Social Assistance in the United States?
Percentage of Population Employed in Health Care & Social Assistance in the United States is 13.9%.