Zip Codes with the Highest Percentage of Population Employed in Farming, Fishing & Forestry in Herndon, VA
RELATED REPORTS & OPTIONS
Select to Compare
Select to Compare
Compare Zip Codes
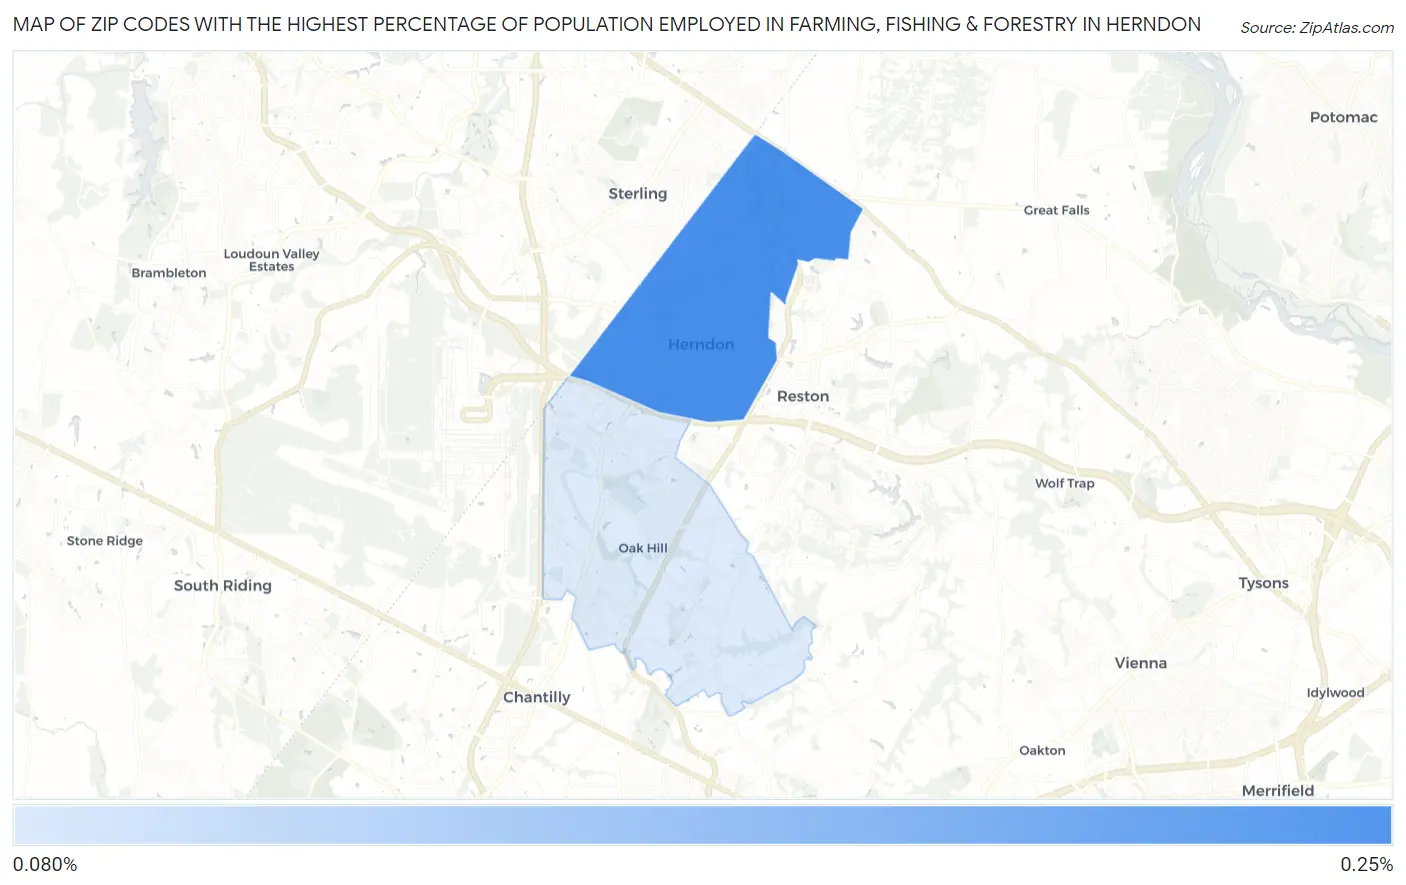
Map of Zip Codes with the Highest Percentage of Population Employed in Farming, Fishing & Forestry in Herndon
17,976,931,348,623,157,081,452,742,373,170,435,679,807,056,752,584,499,659,891,747,680,315,726,078,002,853,876,058,955,863,276,687,817,154,045,895,351,438,246,423,432,132,688,946,418,276,846,754,670,353,751,698,604,991,057,655,128,207,624,549,009,038,932,894,407,586,850,845,513,394,230,458,323,690,322,294,816,580,855,933,212,334,827,479,782,620,414,472,316,873,817,718,091,929,988,125,040,402,618,412,485,836,800.0%
-17,976,931,348,623,157,081,452,742,373,170,435,679,807,056,752,584,499,659,891,747,680,315,726,078,002,853,876,058,955,863,276,687,817,154,045,895,351,438,246,423,432,132,688,946,418,276,846,754,670,353,751,698,604,991,057,655,128,207,624,549,009,038,932,894,407,586,850,845,513,394,230,458,323,690,322,294,816,580,855,933,212,334,827,479,782,620,414,472,316,873,817,718,091,929,988,125,040,402,618,412,485,836,800.00000%
Zip Codes with the Highest Percentage of Population Employed in Farming, Fishing & Forestry in Herndon, VA
| Zip Code | % Employed | vs State | vs National |
1
Common Questions
What are the Top Zip Codes with the Highest Percentage of Population Employed in Farming, Fishing & Forestry in Herndon, VA?
Top Zip Codes with the Highest Percentage of Population Employed in Farming, Fishing & Forestry in Herndon, VA are:
What zip code has the Highest Percentage of Population Employed in Farming, Fishing & Forestry in Herndon, VA?
20171 has the Highest Percentage of Population Employed in Farming, Fishing & Forestry in Herndon, VA with 0.0%.