Zip Codes with the Highest Percentage of Population Employed in Arts, Entertainment & Recreation in Richardson, TX
RELATED REPORTS & OPTIONS
Arts, Entertainment & Recreation
Richardson
Compare Zip Codes
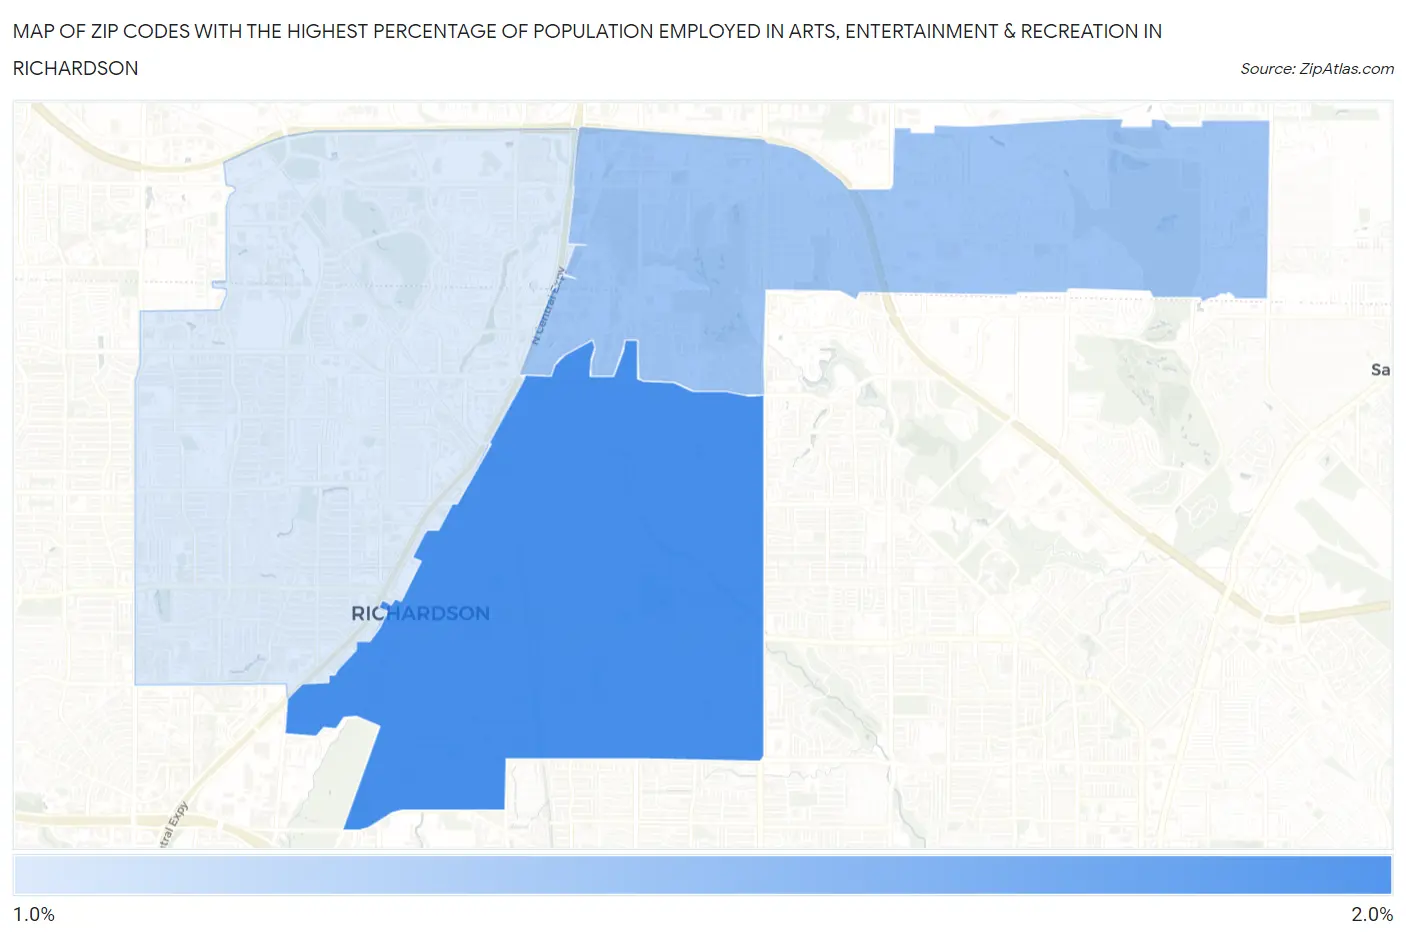
Map of Zip Codes with the Highest Percentage of Population Employed in Arts, Entertainment & Recreation in Richardson
0.0%
2.0%
Zip Codes with the Highest Percentage of Population Employed in Arts, Entertainment & Recreation in Richardson, TX
| Zip Code | % Employed | vs State | vs National | |
| 1. | 75081 | 1.7% | 1.5%(+0.205)#479 | 2.1%(-0.415)#11,960 |
| 2. | 75082 | 1.4% | 1.5%(-0.018)#586 | 2.1%(-0.638)#13,646 |
| 3. | 75080 | 1.3% | 1.5%(-0.181)#676 | 2.1%(-0.801)#14,854 |
1
Common Questions
What are the Top Zip Codes with the Highest Percentage of Population Employed in Arts, Entertainment & Recreation in Richardson, TX?
Top Zip Codes with the Highest Percentage of Population Employed in Arts, Entertainment & Recreation in Richardson, TX are:
What zip code has the Highest Percentage of Population Employed in Arts, Entertainment & Recreation in Richardson, TX?
75081 has the Highest Percentage of Population Employed in Arts, Entertainment & Recreation in Richardson, TX with 1.7%.
What is the Percentage of Population Employed in Arts, Entertainment & Recreation in Richardson, TX?
Percentage of Population Employed in Arts, Entertainment & Recreation in Richardson is 1.4%.
What is the Percentage of Population Employed in Arts, Entertainment & Recreation in Texas?
Percentage of Population Employed in Arts, Entertainment & Recreation in Texas is 1.5%.
What is the Percentage of Population Employed in Arts, Entertainment & Recreation in the United States?
Percentage of Population Employed in Arts, Entertainment & Recreation in the United States is 2.1%.