Zip Codes with the Highest Percentage of Households With One or more Vehicles in Lancaster, TX
RELATED REPORTS & OPTIONS
Households with 1 or more Cars
Lancaster
Compare Zip Codes
Map of Zip Codes with the Highest Percentage of Households With One or more Vehicles in Lancaster
96.0%
96.5%
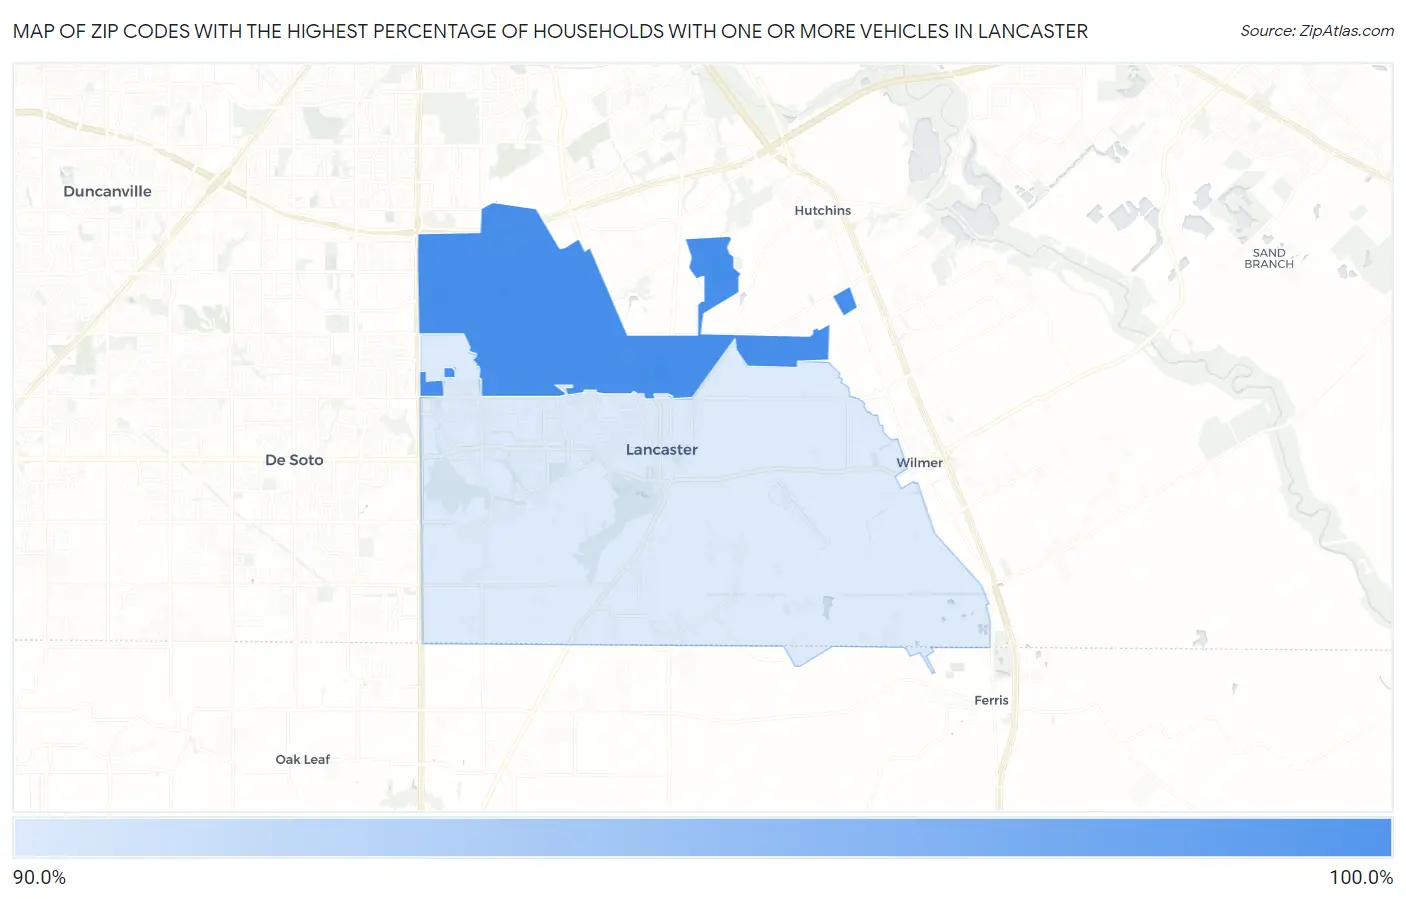
Zip Codes with the Highest Percentage of Households With One or more Vehicles in Lancaster, TX
| Zip Code | Housholds With 1+ Cars | vs State | vs National | |
| 1. | 75134 | 96.5% | 94.8%(+1.70)#949 | 91.7%(+4.80)#15,284 |
| 2. | 75146 | 96.0% | 94.8%(+1.20)#1,039 | 91.7%(+4.30)#16,896 |
1
Common Questions
What are the Top Zip Codes with the Highest Percentage of Households With One or more Vehicles in Lancaster, TX?
Top Zip Codes with the Highest Percentage of Households With One or more Vehicles in Lancaster, TX are:
What zip code has the Highest Percentage of Households With One or more Vehicles in Lancaster, TX?
75134 has the Highest Percentage of Households With One or more Vehicles in Lancaster, TX with 96.5%.
What is the Percentage of Households With One or more Vehicles in Lancaster, TX?
Percentage of Households With One or more Vehicles in Lancaster is 95.8%.
What is the Percentage of Households With One or more Vehicles in Texas?
Percentage of Households With One or more Vehicles in Texas is 94.8%.
What is the Percentage of Households With One or more Vehicles in the United States?
Percentage of Households With One or more Vehicles in the United States is 91.7%.