Zip Codes with the Lowest Percentage of Renter-Occupied Units in Lancaster, TX
RELATED REPORTS & OPTIONS
Lowest Renter-Occupied
Lancaster
Compare Zip Codes
Map of Zip Codes with the Lowest Percentage of Renter-Occupied Units in Lancaster
41.5%
25.1%
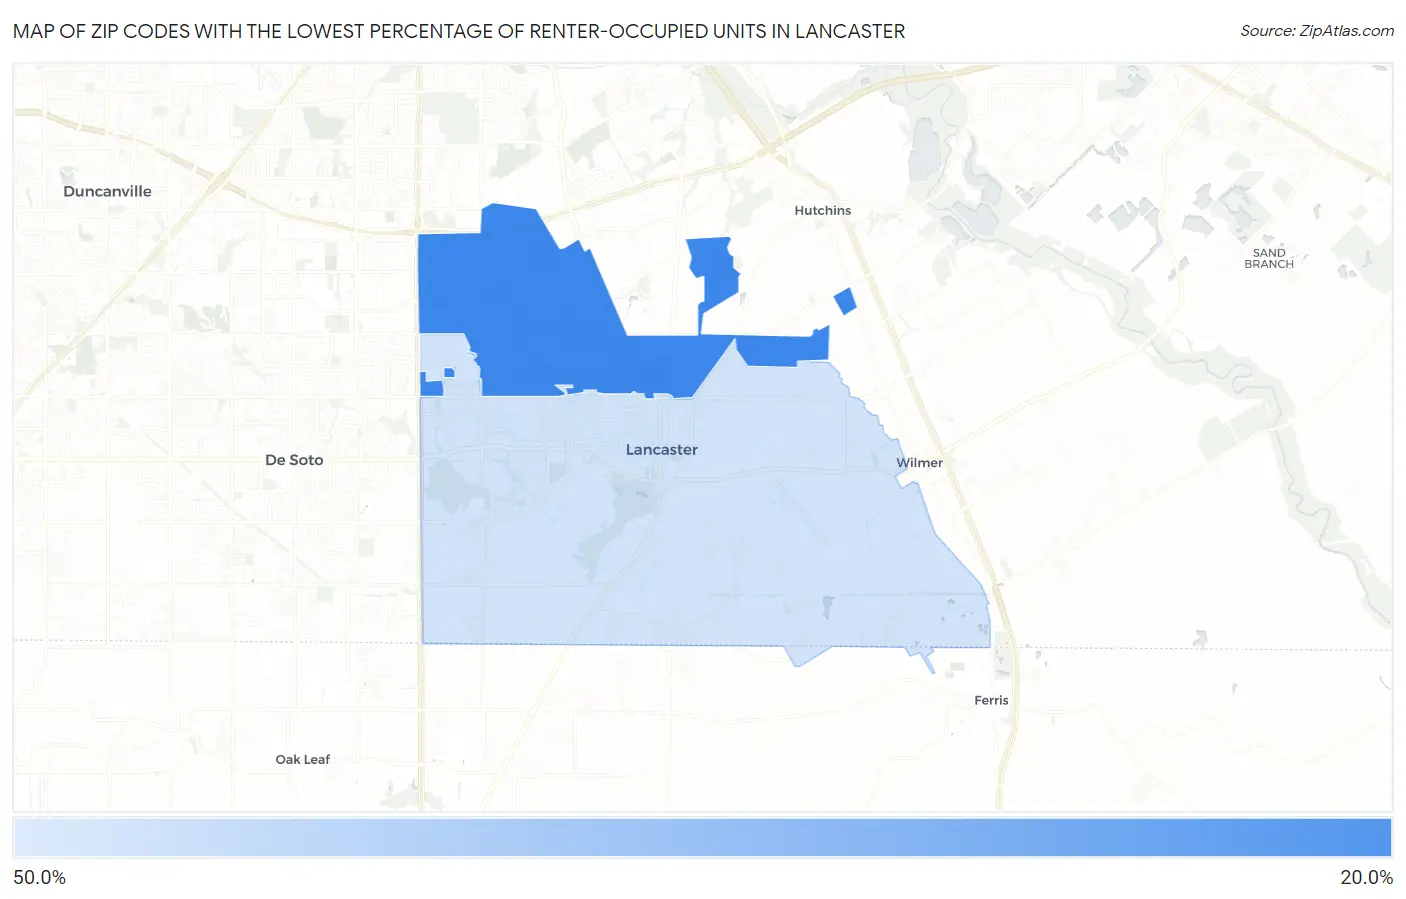
Zip Codes with the Lowest Percentage of Renter-Occupied Units in Lancaster, TX
| Zip Code | % Renter-Occupied | vs State | vs National | |
| 1. | 75134 | 25.1% | 37.6%(-12.5)#824 | 35.2%(-10.1)#17,595 |
| 2. | 75146 | 41.5% | 37.6%(+3.92)#1,387 | 35.2%(+6.34)#26,149 |
1
Common Questions
What are the Top Zip Codes with the Lowest Percentage of Renter-Occupied Units in Lancaster, TX?
Top Zip Codes with the Lowest Percentage of Renter-Occupied Units in Lancaster, TX are:
What zip code has the Lowest Percentage of Renter-Occupied Units in Lancaster, TX?
75134 has the Lowest Percentage of Renter-Occupied Units in Lancaster, TX with 25.1%.
What is the Percentage of Renter-Occupied Units in Lancaster, TX?
Percentage of Renter-Occupied Units in Lancaster is 35.9%.
What is the Percentage of Renter-Occupied Units in Texas?
Percentage of Renter-Occupied Units in Texas is 37.6%.
What is the Percentage of Renter-Occupied Units in the United States?
Percentage of Renter-Occupied Units in the United States is 35.2%.