Zip Codes with the Highest Percentage of Population Employed in Agriculture, Fishing & Hunting in Granbury, TX
RELATED REPORTS & OPTIONS
Agriculture, Fishing & Hunting
Granbury
Compare Zip Codes
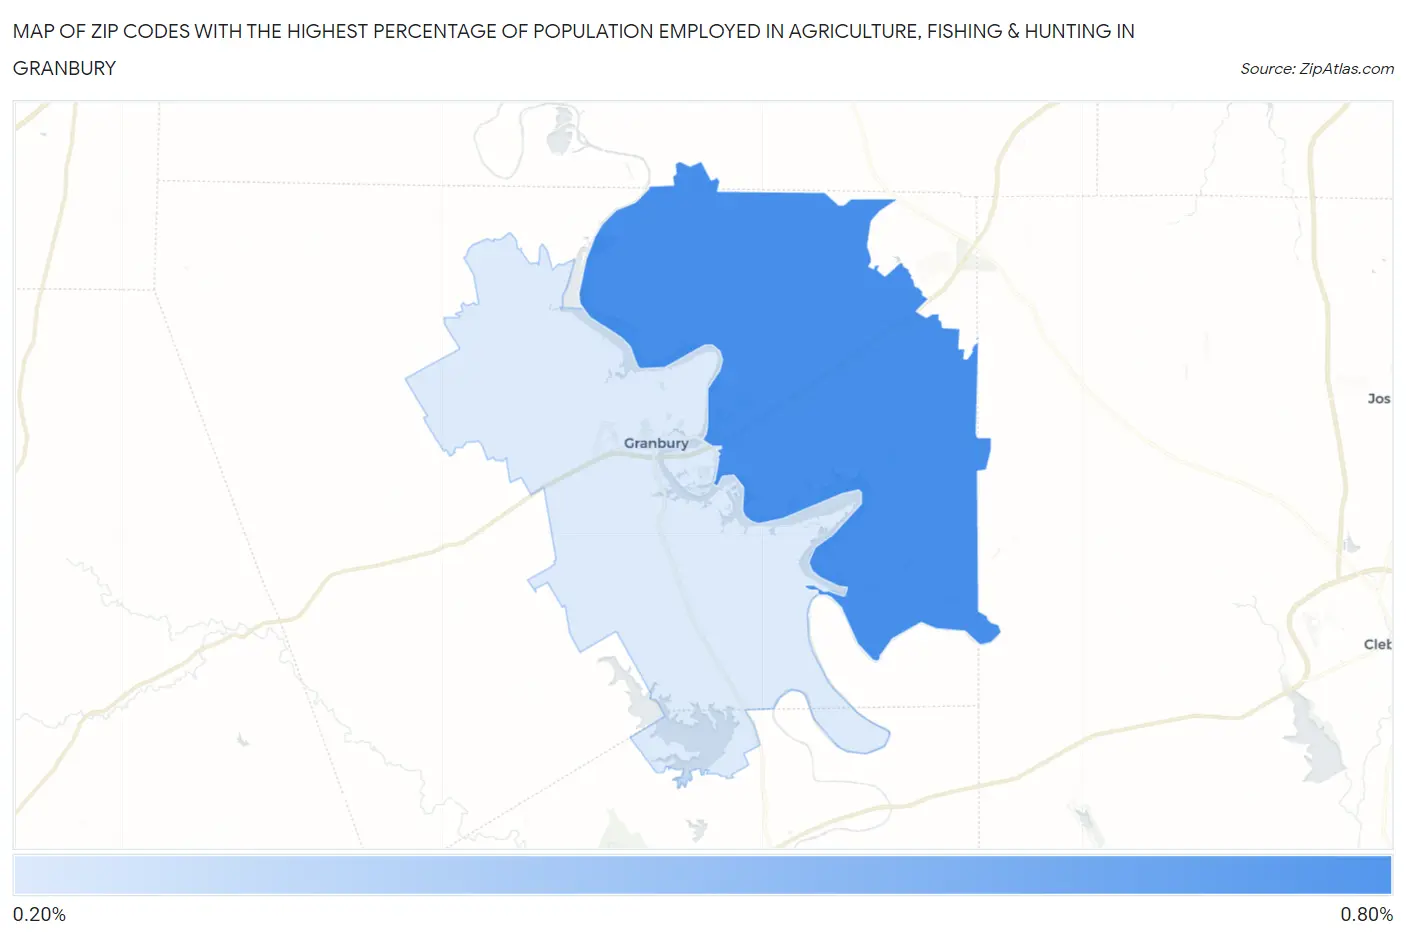
Map of Zip Codes with the Highest Percentage of Population Employed in Agriculture, Fishing & Hunting in Granbury
0.0%
0.80%
Zip Codes with the Highest Percentage of Population Employed in Agriculture, Fishing & Hunting in Granbury, TX
| Zip Code | % Employed | vs State | vs National | |
| 1. | 76049 | 0.63% | 0.75%(-0.123)#979 | 1.2%(-0.571)#18,280 |
| 2. | 76048 | 0.25% | 0.75%(-0.505)#1,191 | 1.2%(-0.953)#21,799 |
1
Common Questions
What are the Top Zip Codes with the Highest Percentage of Population Employed in Agriculture, Fishing & Hunting in Granbury, TX?
Top Zip Codes with the Highest Percentage of Population Employed in Agriculture, Fishing & Hunting in Granbury, TX are:
What zip code has the Highest Percentage of Population Employed in Agriculture, Fishing & Hunting in Granbury, TX?
76049 has the Highest Percentage of Population Employed in Agriculture, Fishing & Hunting in Granbury, TX with 0.63%.
What is the Percentage of Population Employed in Agriculture, Fishing & Hunting in Texas?
Percentage of Population Employed in Agriculture, Fishing & Hunting in Texas is 0.75%.
What is the Percentage of Population Employed in Agriculture, Fishing & Hunting in the United States?
Percentage of Population Employed in Agriculture, Fishing & Hunting in the United States is 1.2%.