Zip Codes with the Highest Percentage of Spanish Population in Gatesville, TX
RELATED REPORTS & OPTIONS
Spanish
Gatesville
Compare Zip Codes
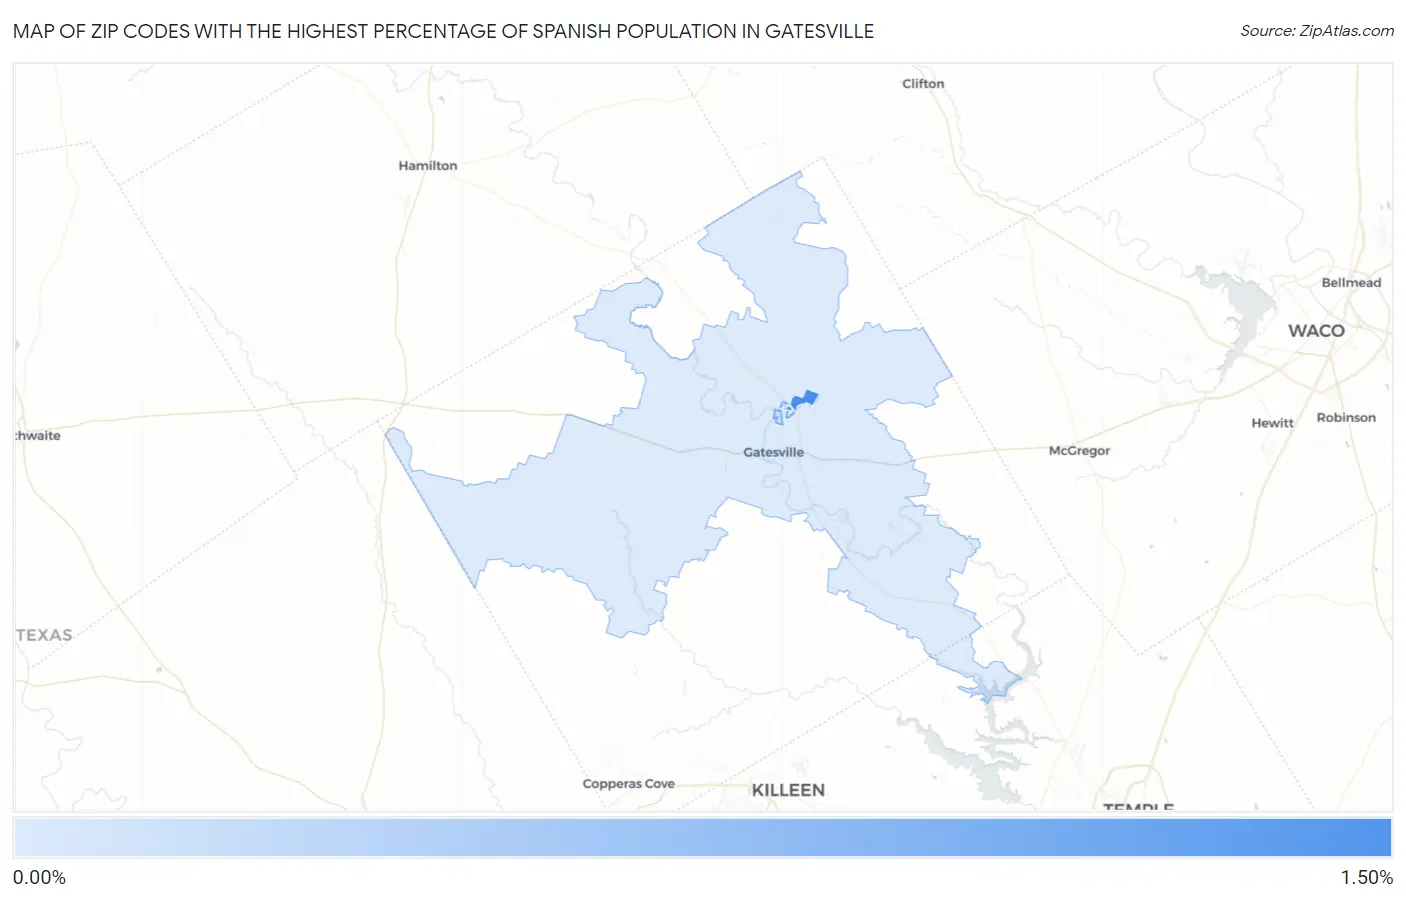
Map of Zip Codes with the Highest Percentage of Spanish Population in Gatesville
0.088%
1.28%
Zip Codes with the Highest Percentage of Spanish Population in Gatesville, TX
| Zip Code | Spanish | vs State | vs National | |
| 1. | 76597 | 1.28% | 0.25%(+1.04)#56 | 0.23%(+1.05)#904 |
| 2. | 76596 | 1.09% | 0.25%(+0.849)#72 | 0.23%(+0.859)#1,101 |
| 3. | 76598 | 0.45% | 0.25%(+0.209)#251 | 0.23%(+0.220)#2,882 |
| 4. | 76599 | 0.23% | 0.25%(-0.018)#459 | 0.23%(-0.008)#5,012 |
| 5. | 76528 | 0.088% | 0.25%(-0.157)#722 | 0.23%(-0.147)#7,794 |
1
Common Questions
What are the Top 3 Zip Codes with the Highest Percentage of Spanish Population in Gatesville, TX?
Top 3 Zip Codes with the Highest Percentage of Spanish Population in Gatesville, TX are:
What zip code has the Highest Percentage of Spanish Population in Gatesville, TX?
76597 has the Highest Percentage of Spanish Population in Gatesville, TX with 1.28%.
What is the Percentage of Spanish Population in Gatesville, TX?
Percentage of Spanish Population in Gatesville is 0.44%.
What is the Percentage of Spanish Population in Texas?
Percentage of Spanish Population in Texas is 0.25%.
What is the Percentage of Spanish Population in the United States?
Percentage of Spanish Population in the United States is 0.23%.