Zip Codes with the Highest Percentage of Immigrants from Latin America in Gatesville, TX
RELATED REPORTS & OPTIONS
Latin America
Gatesville
Compare Zip Codes
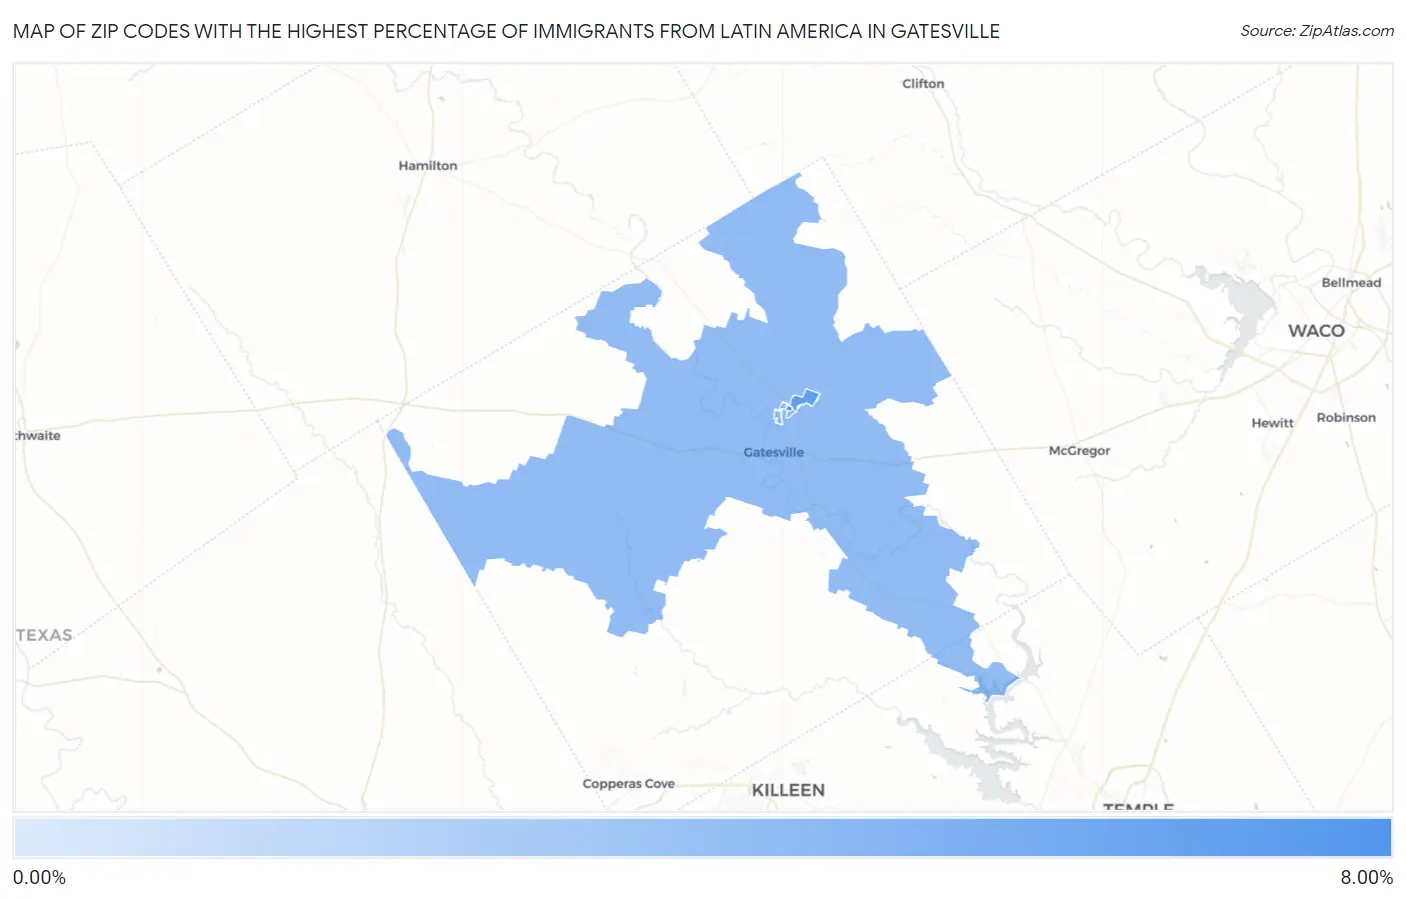
Map of Zip Codes with the Highest Percentage of Immigrants from Latin America in Gatesville
2.50%
6.11%
Zip Codes with the Highest Percentage of Immigrants from Latin America in Gatesville, TX
| Zip Code | Latin America | vs State | vs National | |
| 1. | 76596 | 6.11% | 11.14%(-5.03)#-1 | 6.84%(-0.733)#0 |
| 2. | 76597 | 5.09% | 11.14%(-6.05)#0 | 6.84%(-1.75)#1 |
| 3. | 76599 | 3.51% | 11.14%(-7.63)#39 | 6.84%(-3.33)#988 |
| 4. | 76528 | 3.08% | 11.14%(-8.06)#283 | 6.84%(-3.76)#4,483 |
| 5. | 76598 | 2.50% | 11.14%(-8.64)#284 | 6.84%(-4.34)#4,484 |
1
Common Questions
What are the Top 3 Zip Codes with the Highest Percentage of Immigrants from Latin America in Gatesville, TX?
Top 3 Zip Codes with the Highest Percentage of Immigrants from Latin America in Gatesville, TX are:
What zip code has the Highest Percentage of Immigrants from Latin America in Gatesville, TX?
76596 has the Highest Percentage of Immigrants from Latin America in Gatesville, TX with 6.11%.
What is the Percentage of Immigrants from Latin America in Gatesville, TX?
Percentage of Immigrants from Latin America in Gatesville is 3.94%.
What is the Percentage of Immigrants from Latin America in Texas?
Percentage of Immigrants from Latin America in Texas is 11.14%.
What is the Percentage of Immigrants from Latin America in the United States?
Percentage of Immigrants from Latin America in the United States is 6.84%.