Zip Codes with the Highest Percentage of Population Employed in Agriculture, Fishing & Hunting in Sevierville, TN
RELATED REPORTS & OPTIONS
Select to Compare
Select to Compare
Compare Zip Codes
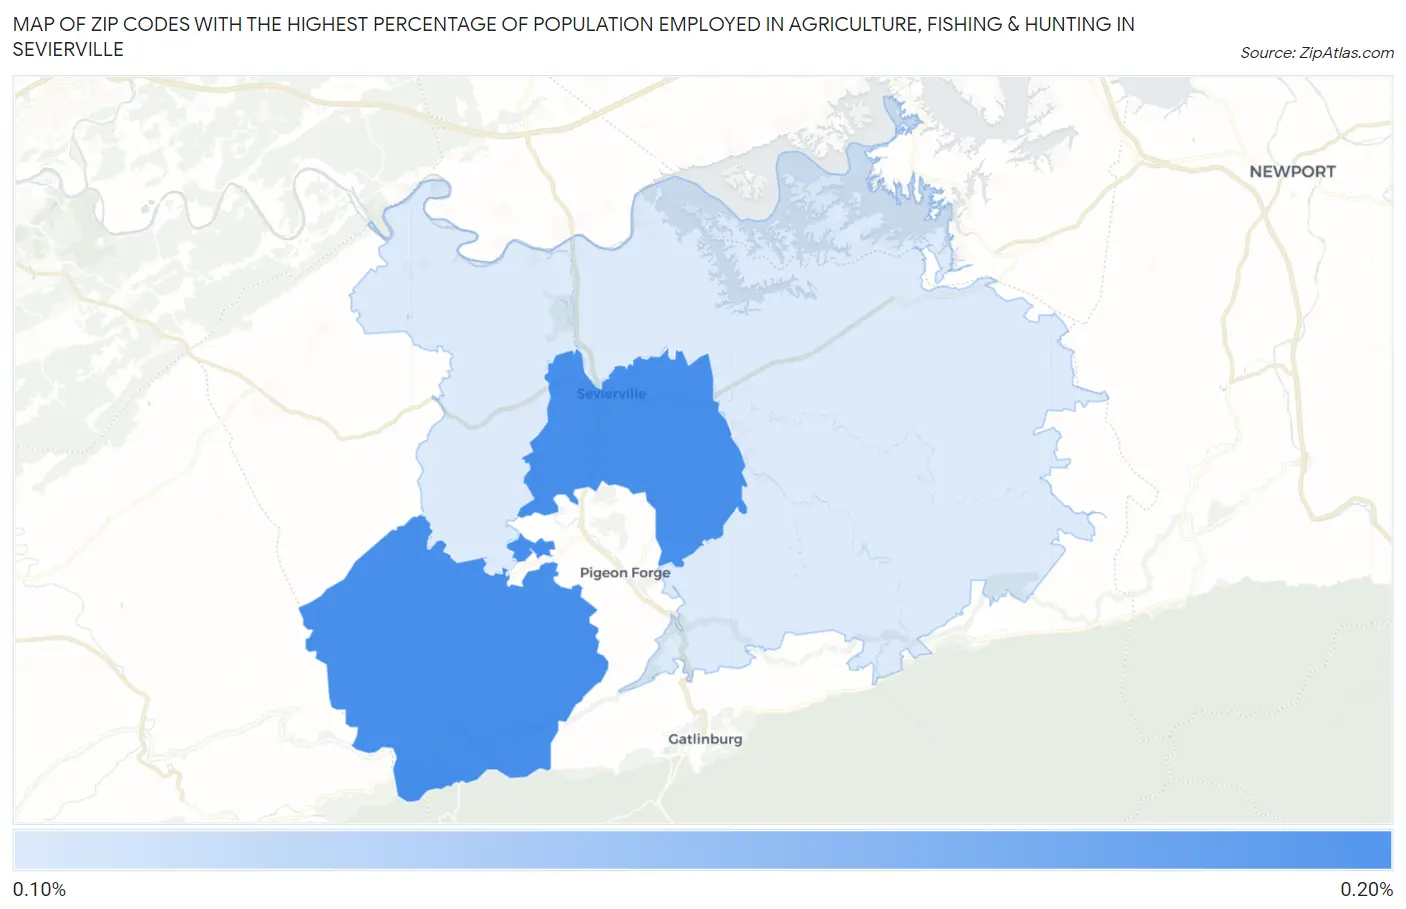
Map of Zip Codes with the Highest Percentage of Population Employed in Agriculture, Fishing & Hunting in Sevierville
0.0%
0.50%
Zip Codes with the Highest Percentage of Population Employed in Agriculture, Fishing & Hunting in Sevierville, TN
| Zip Code | % Employed | vs State | vs National | |
| 1. | 37862 | 0.40% | 0.74%(-0.334)#348 | 1.2%(-0.797)#20,134 |
1
Common Questions
What are the Top Zip Codes with the Highest Percentage of Population Employed in Agriculture, Fishing & Hunting in Sevierville, TN?
Top Zip Codes with the Highest Percentage of Population Employed in Agriculture, Fishing & Hunting in Sevierville, TN are:
What zip code has the Highest Percentage of Population Employed in Agriculture, Fishing & Hunting in Sevierville, TN?
37862 has the Highest Percentage of Population Employed in Agriculture, Fishing & Hunting in Sevierville, TN with 0.40%.
What is the Percentage of Population Employed in Agriculture, Fishing & Hunting in Sevierville, TN?
Percentage of Population Employed in Agriculture, Fishing & Hunting in Sevierville is 0.44%.
What is the Percentage of Population Employed in Agriculture, Fishing & Hunting in Tennessee?
Percentage of Population Employed in Agriculture, Fishing & Hunting in Tennessee is 0.74%.
What is the Percentage of Population Employed in Agriculture, Fishing & Hunting in the United States?
Percentage of Population Employed in Agriculture, Fishing & Hunting in the United States is 1.2%.