Zip Codes with the Highest Percentage of Population Employed in Farming, Fishing & Forestry in Spearfish, SD
RELATED REPORTS & OPTIONS
Select to Compare
Select to Compare
Compare Zip Codes
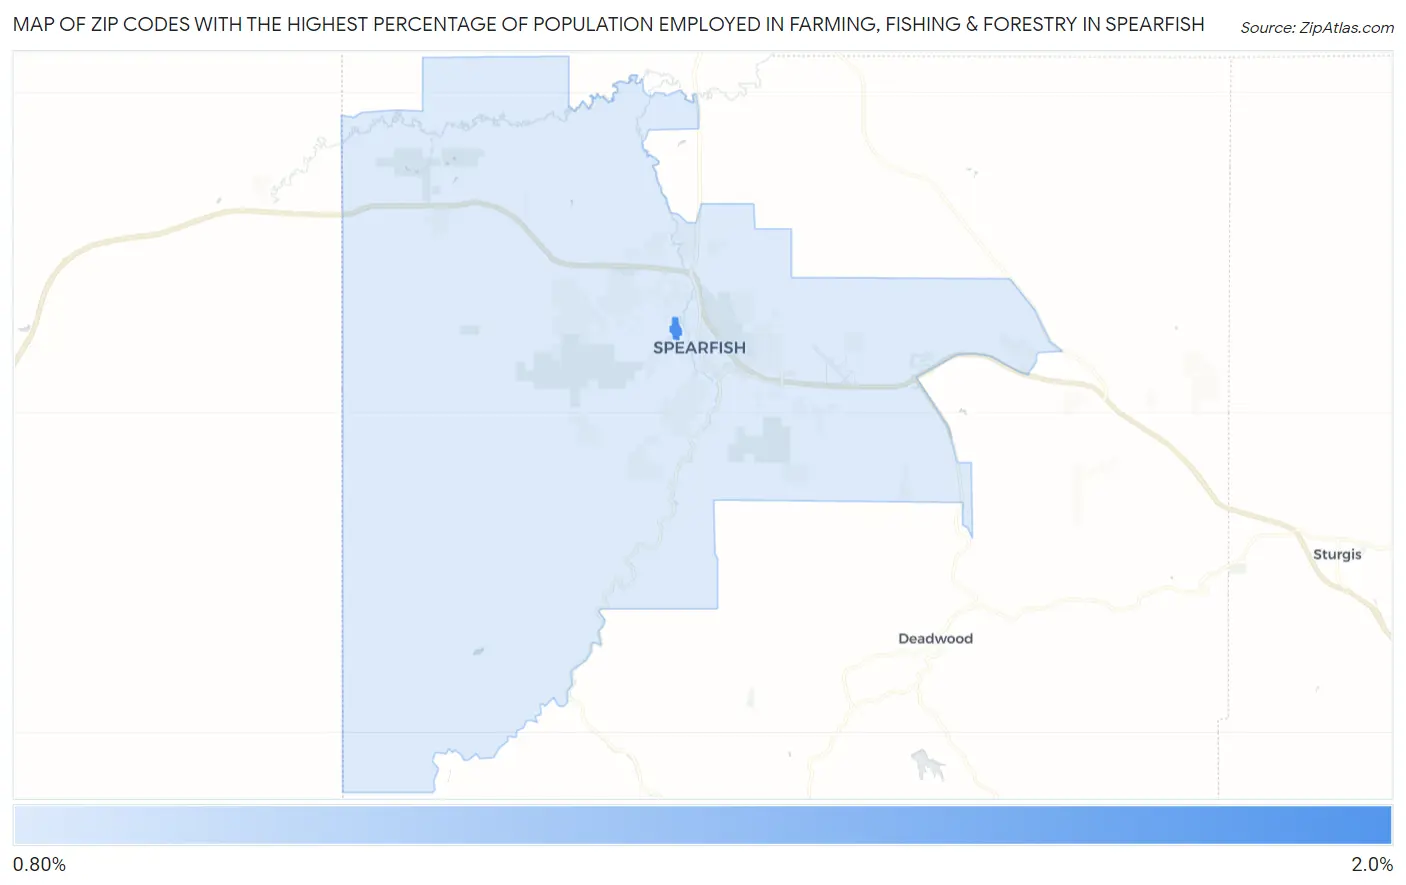
Map of Zip Codes with the Highest Percentage of Population Employed in Farming, Fishing & Forestry in Spearfish
0.0%
1.0%
Zip Codes with the Highest Percentage of Population Employed in Farming, Fishing & Forestry in Spearfish, SD
| Zip Code | % Employed | vs State | vs National | |
| 1. | 57783 | 0.92% | 1.7%(-0.823)#244 | 0.61%(+0.315)#10,123 |
1
Common Questions
What are the Top Zip Codes with the Highest Percentage of Population Employed in Farming, Fishing & Forestry in Spearfish, SD?
Top Zip Codes with the Highest Percentage of Population Employed in Farming, Fishing & Forestry in Spearfish, SD are:
What zip code has the Highest Percentage of Population Employed in Farming, Fishing & Forestry in Spearfish, SD?
57783 has the Highest Percentage of Population Employed in Farming, Fishing & Forestry in Spearfish, SD with 0.92%.
What is the Percentage of Population Employed in Farming, Fishing & Forestry in South Dakota?
Percentage of Population Employed in Farming, Fishing & Forestry in South Dakota is 1.7%.
What is the Percentage of Population Employed in Farming, Fishing & Forestry in the United States?
Percentage of Population Employed in Farming, Fishing & Forestry in the United States is 0.61%.