Zip Codes with the Highest Percentage of Population Employed in Farming, Fishing & Forestry in Rock Hill, SC
RELATED REPORTS & OPTIONS
Farming, Fishing & Forestry
Rock Hill
Compare Zip Codes
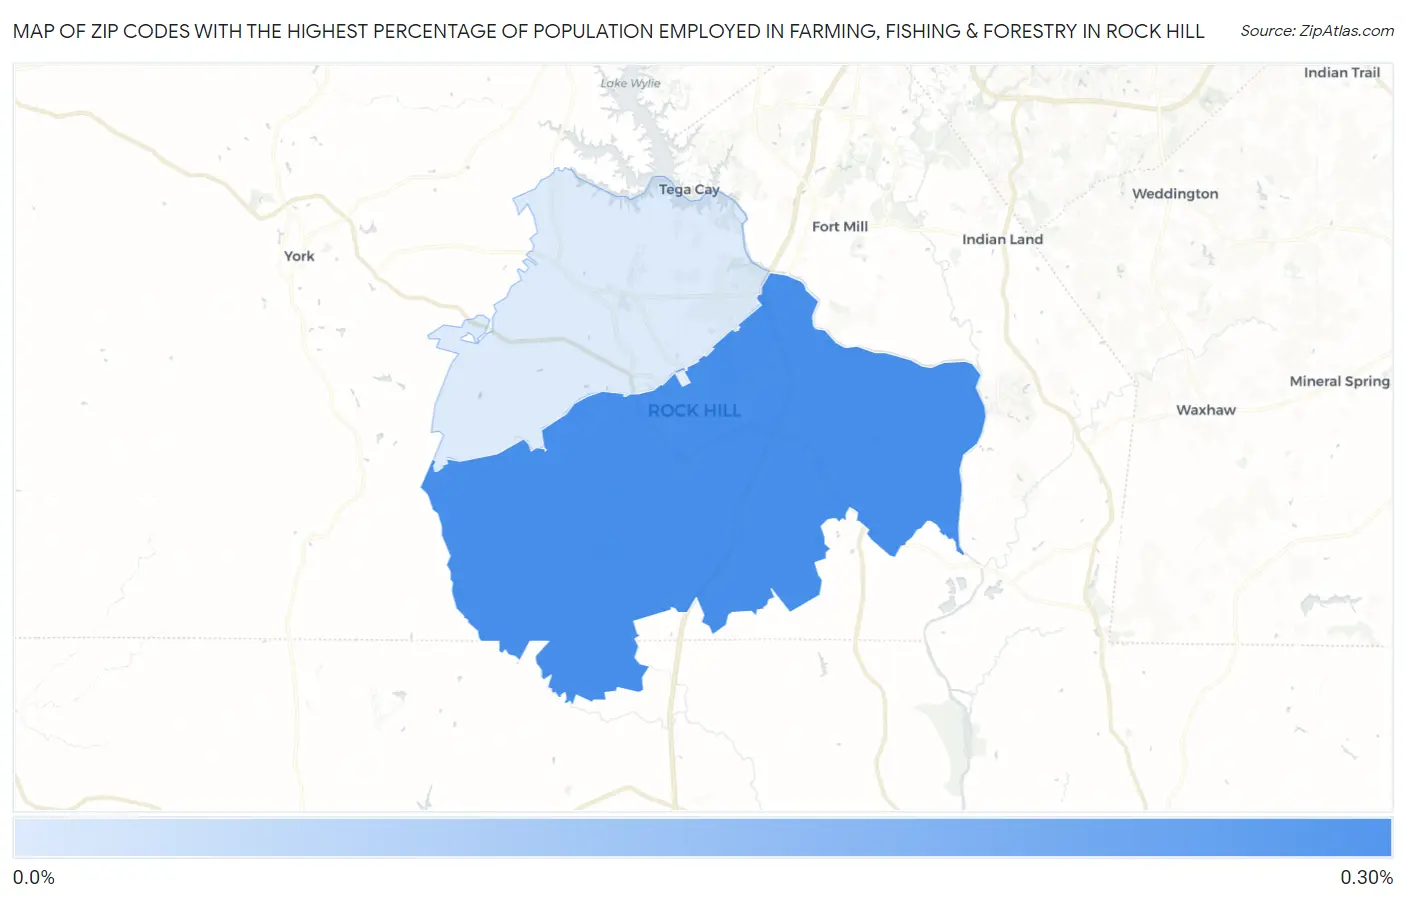
Map of Zip Codes with the Highest Percentage of Population Employed in Farming, Fishing & Forestry in Rock Hill
0.0%
0.30%
Zip Codes with the Highest Percentage of Population Employed in Farming, Fishing & Forestry in Rock Hill, SC
| Zip Code | % Employed | vs State | vs National | |
| 1. | 29730 | 0.29% | 0.39%(-0.098)#156 | 0.61%(-0.316)#14,950 |
| 2. | 29732 | 0.093% | 0.39%(-0.295)#217 | 0.61%(-0.513)#17,878 |
1
Common Questions
What are the Top Zip Codes with the Highest Percentage of Population Employed in Farming, Fishing & Forestry in Rock Hill, SC?
Top Zip Codes with the Highest Percentage of Population Employed in Farming, Fishing & Forestry in Rock Hill, SC are:
What zip code has the Highest Percentage of Population Employed in Farming, Fishing & Forestry in Rock Hill, SC?
29730 has the Highest Percentage of Population Employed in Farming, Fishing & Forestry in Rock Hill, SC with 0.29%.
What is the Percentage of Population Employed in Farming, Fishing & Forestry in Rock Hill, SC?
Percentage of Population Employed in Farming, Fishing & Forestry in Rock Hill is 0.085%.
What is the Percentage of Population Employed in Farming, Fishing & Forestry in South Carolina?
Percentage of Population Employed in Farming, Fishing & Forestry in South Carolina is 0.39%.
What is the Percentage of Population Employed in Farming, Fishing & Forestry in the United States?
Percentage of Population Employed in Farming, Fishing & Forestry in the United States is 0.61%.