Zip Codes with the Highest Percentage of Households Heated by Bottled Gas / Liquid Propane in Warwick, RI
RELATED REPORTS & OPTIONS
Bottled Gas / LP Heating
Warwick
Compare Zip Codes
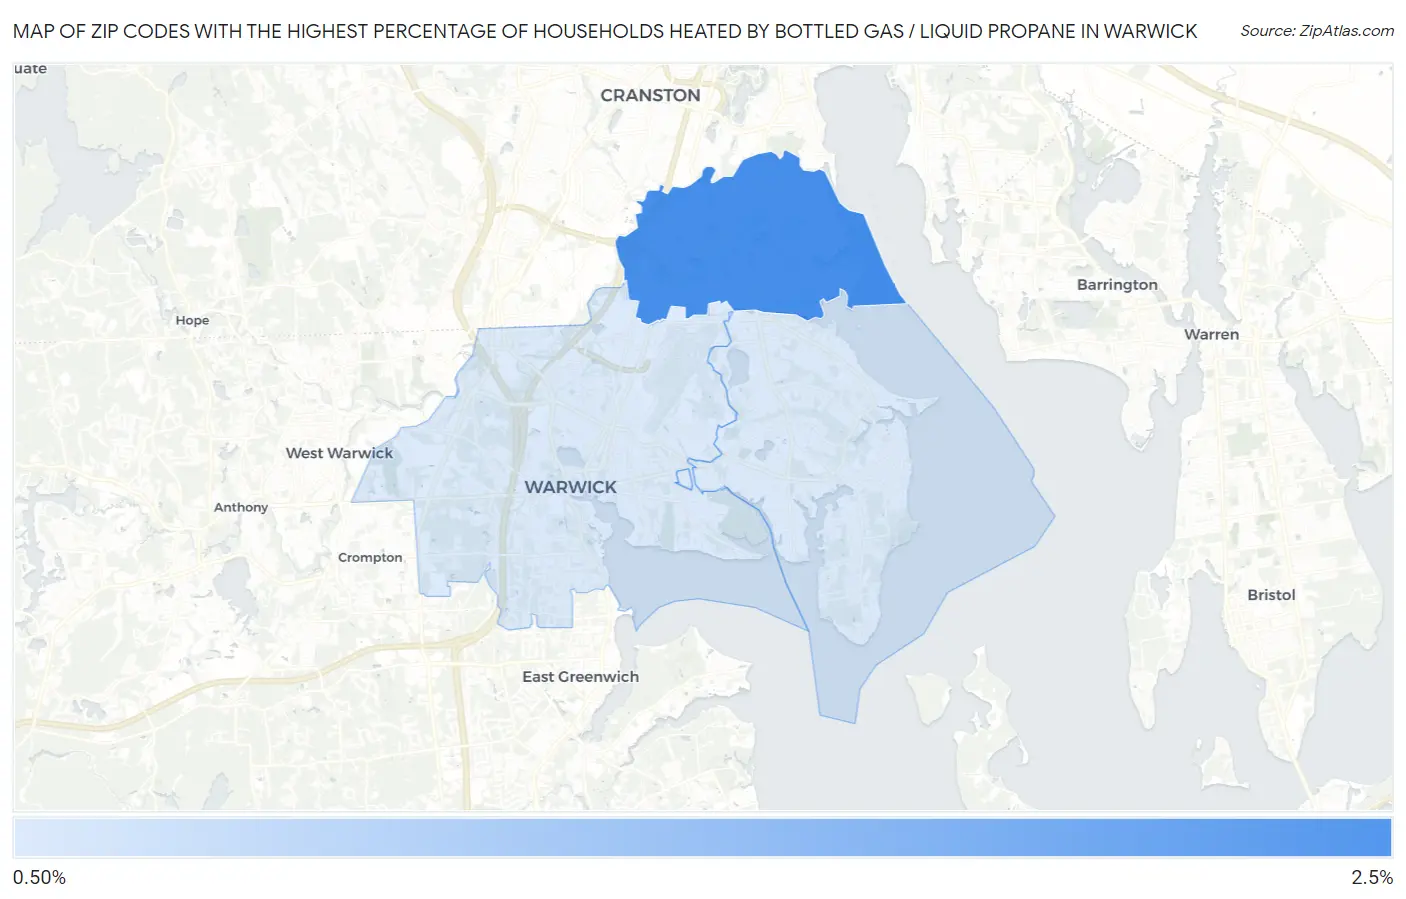
Map of Zip Codes with the Highest Percentage of Households Heated by Bottled Gas / Liquid Propane in Warwick
0.0%
2.5%
Zip Codes with the Highest Percentage of Households Heated by Bottled Gas / Liquid Propane in Warwick, RI
| Zip Code | Bottled Gas / LP Heating | vs State | vs National | |
| 1. | 02888 | 2.1% | 4.3%(-2.20)#55 | 4.9%(-2.80)#22,948 |
| 2. | 02886 | 1.5% | 4.3%(-2.80)#62 | 4.9%(-3.40)#24,727 |
| 3. | 02889 | 1.5% | 4.3%(-2.80)#63 | 4.9%(-3.40)#24,744 |
1
Common Questions
What are the Top Zip Codes with the Highest Percentage of Households Heated by Bottled Gas / Liquid Propane in Warwick, RI?
Top Zip Codes with the Highest Percentage of Households Heated by Bottled Gas / Liquid Propane in Warwick, RI are:
What zip code has the Highest Percentage of Households Heated by Bottled Gas / Liquid Propane in Warwick, RI?
02888 has the Highest Percentage of Households Heated by Bottled Gas / Liquid Propane in Warwick, RI with 2.1%.
What is the Percentage of Households Heated by Bottled Gas / Liquid Propane in Warwick, RI?
Percentage of Households Heated by Bottled Gas / Liquid Propane in Warwick is 1.6%.
What is the Percentage of Households Heated by Bottled Gas / Liquid Propane in Rhode Island?
Percentage of Households Heated by Bottled Gas / Liquid Propane in Rhode Island is 4.3%.
What is the Percentage of Households Heated by Bottled Gas / Liquid Propane in the United States?
Percentage of Households Heated by Bottled Gas / Liquid Propane in the United States is 4.9%.