Zip Codes with the Highest Percentage of Population Employed in Professional & Scientific Services in Salem, OR

RELATED REPORTS & OPTIONS

Professional & Scientific Services
Population
Families and Households
Female Fertility
Female Fertility (Unmarried)
Race (Community Size)
Race (Percentage)
Ancestry (Community Size)
AfricanAlaska NativeAlaskan AthabascanAmericanApacheArabArapahoArgentineanArmenianAustralianAustrianBangladeshiBasqueBelgianBhutaneseBlackfeetBolivianBrazilianBritishBulgarianBurmeseCanadianCelticCentral AmericanCentral American IndianCherokeeCheyenneChickasawChineseChippewaChoctawColombianComancheCroatianCubanCzechCzechoslovakianDanishDominicanDutchEastern EuropeanEcuadorianEgyptianEnglishEstonianEthiopianEuropeanFijianFinnishFrenchFrench American IndianFrench CanadianGermanGreekGuamanian / ChamorroGuatemalanHonduranHungarianIcelanderIndian (Asian)InupiatIranianIrishIroquoisIsraeliItalianJamaicanJapaneseKoreanLaotianLatvianLebaneseLiberianLithuanianMalaysianMalteseMexicanMexican American IndianNative HawaiianNavajoNicaraguanNigerianNorthern EuropeanNorwegianOsagePaiutePakistaniPalestinianPennsylvania GermanPeruvianPolishPortuguesePotawatomiPuebloPuerto RicanRomanianRussianSalvadoranSamoanScandinavianScotch-IrishScottishSeminoleSerbianShoshoneSiouxSlavicSlovakSloveneSouth AmericanSouth American IndianSpaniardSpanishSri LankanSubsaharan AfricanSwedishSwissThaiUkrainianVenezuelanWelshYaquiYugoslavianYuman
Ancestry (Percentage)
AfricanAlaska NativeAlaskan AthabascanAmericanApacheArabArapahoArgentineanArmenianAustralianAustrianBangladeshiBasqueBelgianBhutaneseBlackfeetBolivianBrazilianBritishBulgarianBurmeseCanadianCelticCentral AmericanCentral American IndianCherokeeCheyenneChickasawChineseChippewaChoctawColombianComancheCroatianCubanCzechCzechoslovakianDanishDominicanDutchEastern EuropeanEcuadorianEgyptianEnglishEstonianEthiopianEuropeanFijianFinnishFrenchFrench American IndianFrench CanadianGermanGreekGuamanian / ChamorroGuatemalanHonduranHungarianIcelanderIndian (Asian)InupiatIranianIrishIroquoisIsraeliItalianJamaicanJapaneseKoreanLaotianLatvianLebaneseLiberianLithuanianMalaysianMalteseMexicanMexican American IndianNative HawaiianNavajoNicaraguanNigerianNorthern EuropeanNorwegianOsagePaiutePakistaniPalestinianPennsylvania GermanPeruvianPolishPortuguesePotawatomiPuebloPuerto RicanRomanianRussianSalvadoranSamoanScandinavianScotch-IrishScottishSeminoleSerbianShoshoneSiouxSlavicSlovakSloveneSouth AmericanSouth American IndianSpaniardSpanishSri LankanSubsaharan AfricanSwedishSwissThaiUkrainianVenezuelanWelshYaquiYugoslavianYuman
Immigrant Origin (Total)
Immigrant Origin (Percentage)
Income
Income (Families)
Income (Households)
Poverty
Poverty (Families)
Unemployment
Employment Occupations
Employment Industries
Employer Class
Commute Time
Commute Means
School Enrollment
Education by Degree Field
Occupancy
Finances
Physical Characteristics
Salem
Compare Zip Codes
Comparison Subject

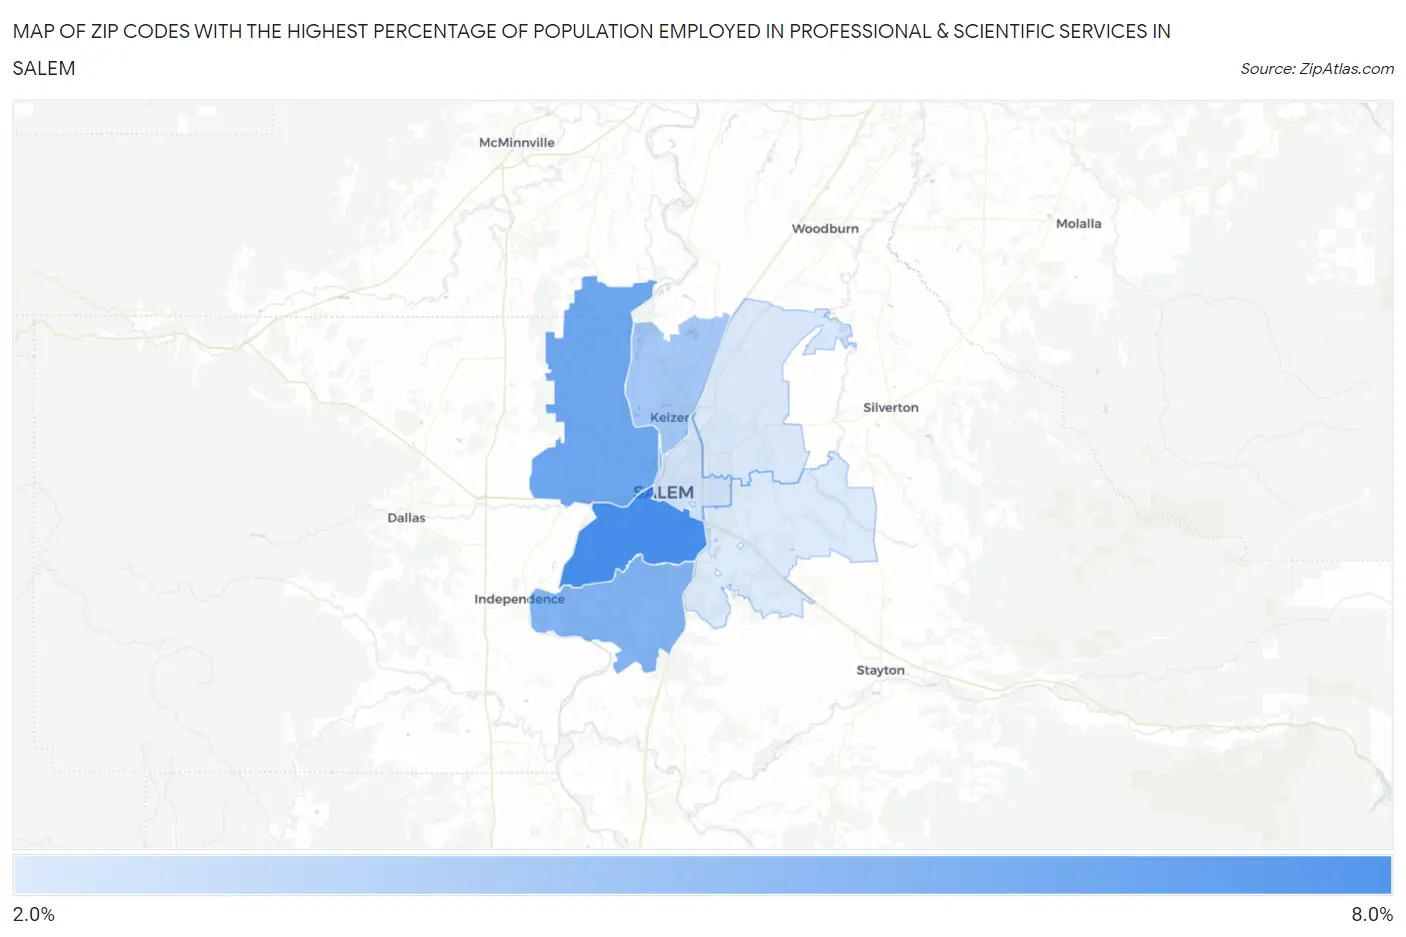
Map of Zip Codes with the Highest Percentage of Population Employed in Professional & Scientific Services in Salem

0.0%
8.0%
Zip Codes with the Highest Percentage of Population Employed in Professional & Scientific Services in Salem Map

Zip Codes with the Highest Percentage of Population Employed in Professional & Scientific Services in Salem, OR

Zip Code % Employed vs State vs National
1.973027.5%7.7%(-0.175)#867.8%(-0.351)#7,355
2.973046.3%7.7%(-1.42)#1227.8%(-1.60)#9,477
3.973065.6%7.7%(-2.04)#1417.8%(-2.22)#10,757
4.973034.5%7.7%(-3.16)#1667.8%(-3.34)#13,627
5.973013.1%7.7%(-4.59)#2307.8%(-4.77)#18,179
6.973052.8%7.7%(-4.85)#2467.8%(-5.03)#19,075
7.973172.7%7.7%(-4.98)#2537.8%(-5.16)#19,547

Common Questions

What are the Top 5 Zip Codes with the Highest Percentage of Population Employed in Professional & Scientific Services in Salem, OR?
Top 5 Zip Codes with the Highest Percentage of Population Employed in Professional & Scientific Services in Salem, OR are:
#1
7.5%
#2
6.3%
#3
5.6%
#4
4.5%
#5
3.1%
What zip code has the Highest Percentage of Population Employed in Professional & Scientific Services in Salem, OR?
97302 has the Highest Percentage of Population Employed in Professional & Scientific Services in Salem, OR with 7.5%.
What is the Percentage of Population Employed in Professional & Scientific Services in Salem, OR?
Percentage of Population Employed in Professional & Scientific Services in Salem is 5.1%.
What is the Percentage of Population Employed in Professional & Scientific Services in Oregon?
Percentage of Population Employed in Professional & Scientific Services in Oregon is 7.7%.
What is the Percentage of Population Employed in Professional & Scientific Services in the United States?
Percentage of Population Employed in Professional & Scientific Services in the United States is 7.8%.