Zip Codes with the Highest Percentage of Population Employed in Transportation & Warehousing in Grants Pass, OR
RELATED REPORTS & OPTIONS
Transportation & Warehousing
Grants Pass
Compare Zip Codes
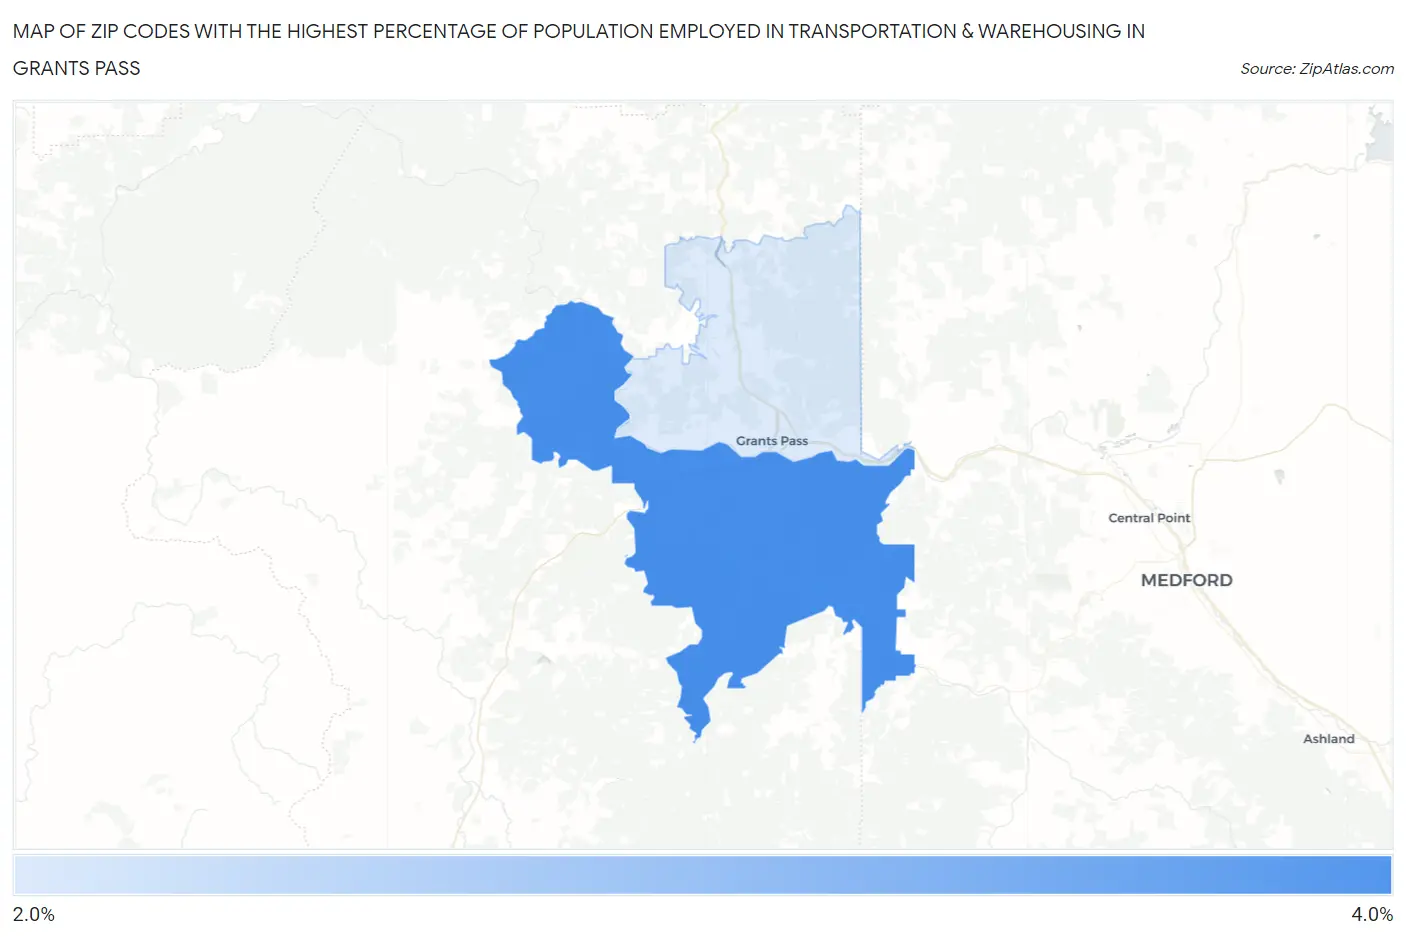
Map of Zip Codes with the Highest Percentage of Population Employed in Transportation & Warehousing in Grants Pass
0.0%
4.0%
Zip Codes with the Highest Percentage of Population Employed in Transportation & Warehousing in Grants Pass, OR
| Zip Code | % Employed | vs State | vs National | |
| 1. | 97527 | 3.8% | 3.8%(+0.040)#164 | 4.9%(-1.12)#16,675 |
| 2. | 97526 | 2.8% | 3.8%(-1.02)#230 | 4.9%(-2.18)#21,289 |
1
Common Questions
What are the Top Zip Codes with the Highest Percentage of Population Employed in Transportation & Warehousing in Grants Pass, OR?
Top Zip Codes with the Highest Percentage of Population Employed in Transportation & Warehousing in Grants Pass, OR are:
What zip code has the Highest Percentage of Population Employed in Transportation & Warehousing in Grants Pass, OR?
97527 has the Highest Percentage of Population Employed in Transportation & Warehousing in Grants Pass, OR with 3.8%.
What is the Percentage of Population Employed in Transportation & Warehousing in Grants Pass, OR?
Percentage of Population Employed in Transportation & Warehousing in Grants Pass is 3.5%.
What is the Percentage of Population Employed in Transportation & Warehousing in Oregon?
Percentage of Population Employed in Transportation & Warehousing in Oregon is 3.8%.
What is the Percentage of Population Employed in Transportation & Warehousing in the United States?
Percentage of Population Employed in Transportation & Warehousing in the United States is 4.9%.