Zip Codes with the Highest Percentage of Population Employed in Farming, Fishing & Forestry in Ohio
RELATED REPORTS & OPTIONS
Farming, Fishing & Forestry
Ohio
Compare Zip Codes
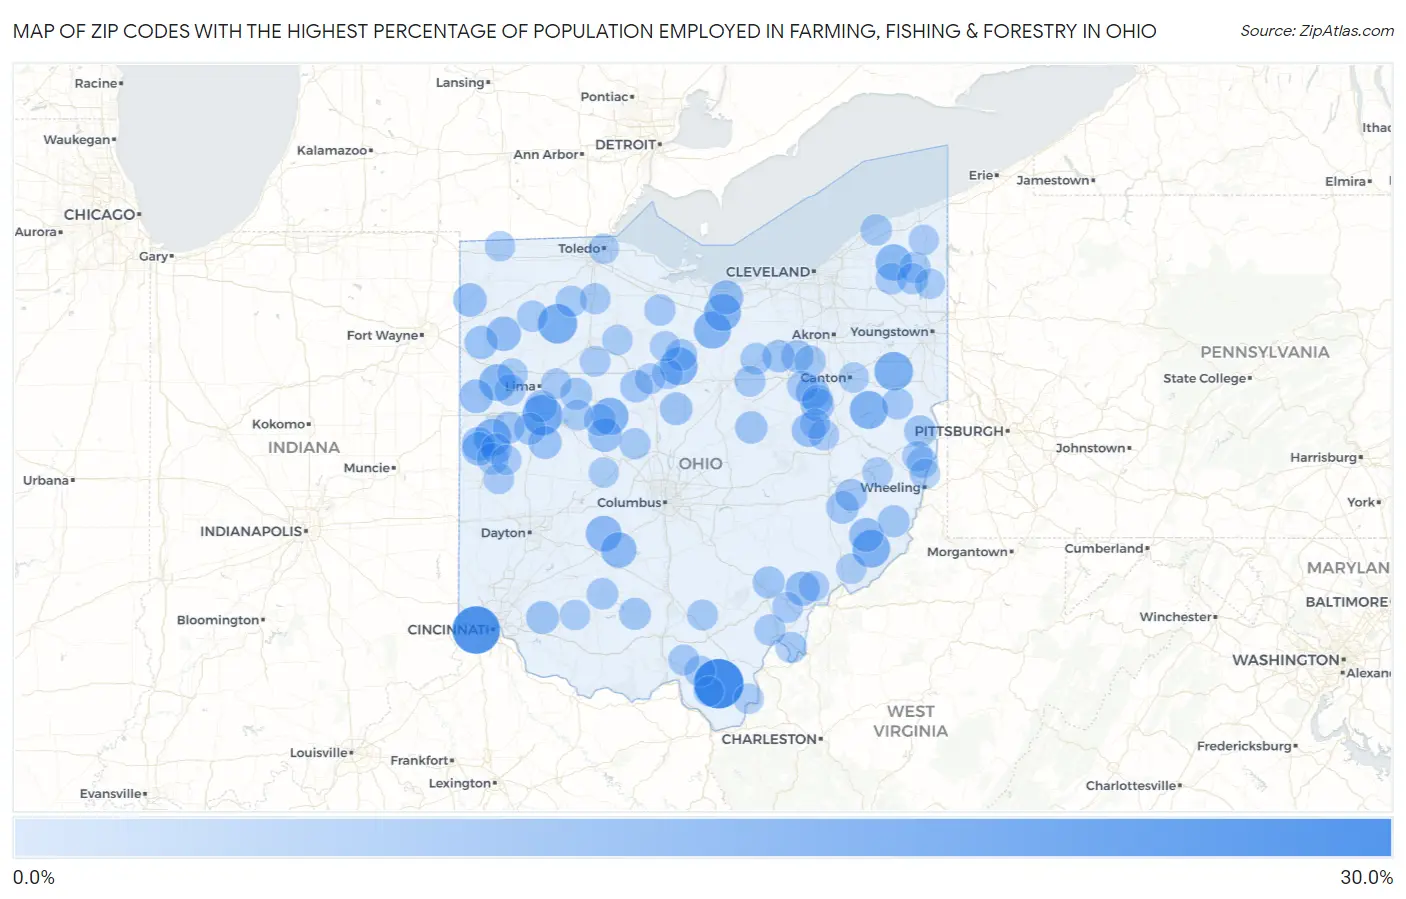
Map of Zip Codes with the Highest Percentage of Population Employed in Farming, Fishing & Forestry in Ohio
0.0%
30.0%
Zip Codes with the Highest Percentage of Population Employed in Farming, Fishing & Forestry in Ohio
| Zip Code | % Employed | vs State | vs National | |
| 1. | 45688 | 26.1% | 0.29%(+25.8)#1 | 0.61%(+25.5)#265 |
| 2. | 45051 | 23.4% | 0.29%(+23.1)#2 | 0.61%(+22.8)#311 |
| 3. | 45884 | 14.4% | 0.29%(+14.1)#3 | 0.61%(+13.8)#686 |
| 4. | 45815 | 13.2% | 0.29%(+12.9)#4 | 0.61%(+12.6)#799 |
| 5. | 44665 | 12.3% | 0.29%(+12.0)#5 | 0.61%(+11.7)#899 |
| 6. | 44620 | 11.4% | 0.29%(+11.1)#6 | 0.61%(+10.8)#1,004 |
| 7. | 45734 | 11.3% | 0.29%(+11.0)#7 | 0.61%(+10.7)#1,014 |
| 8. | 44881 | 11.3% | 0.29%(+11.0)#8 | 0.61%(+10.6)#1,021 |
| 9. | 45860 | 10.5% | 0.29%(+10.2)#9 | 0.61%(+9.90)#1,124 |
| 10. | 44855 | 10.4% | 0.29%(+10.1)#10 | 0.61%(+9.83)#1,137 |
| 11. | 44826 | 10.3% | 0.29%(+10.0)#11 | 0.61%(+9.70)#1,163 |
| 12. | 43340 | 10.3% | 0.29%(+9.97)#12 | 0.61%(+9.65)#1,168 |
| 13. | 45894 | 9.9% | 0.29%(+9.59)#13 | 0.61%(+9.28)#1,226 |
| 14. | 44099 | 9.5% | 0.29%(+9.20)#14 | 0.61%(+8.88)#1,300 |
| 15. | 43153 | 8.7% | 0.29%(+8.44)#15 | 0.61%(+8.12)#1,474 |
| 16. | 43106 | 8.4% | 0.29%(+8.16)#16 | 0.61%(+7.84)#1,535 |
| 17. | 45861 | 7.1% | 0.29%(+6.85)#17 | 0.61%(+6.54)#1,931 |
| 18. | 45724 | 6.9% | 0.29%(+6.65)#18 | 0.61%(+6.33)#2,006 |
| 19. | 44814 | 6.8% | 0.29%(+6.48)#19 | 0.61%(+6.17)#2,069 |
| 20. | 43754 | 6.7% | 0.29%(+6.40)#20 | 0.61%(+6.08)#2,097 |
| 21. | 43804 | 6.5% | 0.29%(+6.26)#21 | 0.61%(+5.94)#2,145 |
| 22. | 45882 | 6.2% | 0.29%(+5.93)#22 | 0.61%(+5.61)#2,285 |
| 23. | 43526 | 6.2% | 0.29%(+5.87)#23 | 0.61%(+5.55)#2,316 |
| 24. | 43358 | 6.1% | 0.29%(+5.85)#24 | 0.61%(+5.53)#2,324 |
| 25. | 45310 | 6.1% | 0.29%(+5.85)#25 | 0.61%(+5.53)#2,327 |
| 26. | 44659 | 6.1% | 0.29%(+5.81)#26 | 0.61%(+5.49)#2,347 |
| 27. | 45348 | 6.1% | 0.29%(+5.80)#27 | 0.61%(+5.48)#2,350 |
| 28. | 44624 | 5.8% | 0.29%(+5.47)#28 | 0.61%(+5.15)#2,518 |
| 29. | 45851 | 5.6% | 0.29%(+5.30)#29 | 0.61%(+4.98)#2,607 |
| 30. | 45340 | 5.4% | 0.29%(+5.09)#30 | 0.61%(+4.77)#2,710 |
| 31. | 45158 | 5.1% | 0.29%(+4.84)#31 | 0.61%(+4.52)#2,847 |
| 32. | 43320 | 5.0% | 0.29%(+4.75)#32 | 0.61%(+4.44)#2,900 |
| 33. | 43780 | 4.7% | 0.29%(+4.44)#33 | 0.61%(+4.12)#3,132 |
| 34. | 43014 | 4.7% | 0.29%(+4.42)#34 | 0.61%(+4.11)#3,140 |
| 35. | 43323 | 4.5% | 0.29%(+4.22)#35 | 0.61%(+3.90)#3,297 |
| 36. | 44276 | 4.5% | 0.29%(+4.17)#36 | 0.61%(+3.85)#3,342 |
| 37. | 44214 | 4.5% | 0.29%(+4.17)#37 | 0.61%(+3.85)#3,343 |
| 38. | 45888 | 4.3% | 0.29%(+4.03)#38 | 0.61%(+3.72)#3,433 |
| 39. | 45761 | 4.3% | 0.29%(+4.03)#39 | 0.61%(+3.71)#3,442 |
| 40. | 43778 | 4.3% | 0.29%(+4.01)#40 | 0.61%(+3.70)#3,455 |
| 41. | 45306 | 4.1% | 0.29%(+3.85)#41 | 0.61%(+3.53)#3,591 |
| 42. | 43345 | 4.1% | 0.29%(+3.84)#42 | 0.61%(+3.53)#3,601 |
| 43. | 43716 | 4.1% | 0.29%(+3.82)#43 | 0.61%(+3.50)#3,616 |
| 44. | 45612 | 4.1% | 0.29%(+3.80)#44 | 0.61%(+3.49)#3,640 |
| 45. | 45869 | 4.1% | 0.29%(+3.78)#45 | 0.61%(+3.46)#3,670 |
| 46. | 45859 | 4.0% | 0.29%(+3.73)#46 | 0.61%(+3.42)#3,698 |
| 47. | 43944 | 3.9% | 0.29%(+3.62)#47 | 0.61%(+3.31)#3,803 |
| 48. | 44854 | 3.9% | 0.29%(+3.58)#48 | 0.61%(+3.26)#3,837 |
| 49. | 44866 | 3.7% | 0.29%(+3.41)#49 | 0.61%(+3.09)#4,003 |
| 50. | 44645 | 3.6% | 0.29%(+3.33)#50 | 0.61%(+3.01)#4,077 |
| 51. | 45135 | 3.6% | 0.29%(+3.33)#51 | 0.61%(+3.01)#4,078 |
| 52. | 44062 | 3.6% | 0.29%(+3.31)#52 | 0.61%(+2.99)#4,097 |
| 53. | 45380 | 3.6% | 0.29%(+3.30)#53 | 0.61%(+2.98)#4,107 |
| 54. | 44651 | 3.4% | 0.29%(+3.10)#54 | 0.61%(+2.79)#4,336 |
| 55. | 44836 | 3.4% | 0.29%(+3.06)#55 | 0.61%(+2.75)#4,392 |
| 56. | 44081 | 3.3% | 0.29%(+3.02)#56 | 0.61%(+2.70)#4,432 |
| 57. | 44076 | 3.3% | 0.29%(+2.99)#57 | 0.61%(+2.67)#4,467 |
| 58. | 45771 | 3.2% | 0.29%(+2.95)#58 | 0.61%(+2.64)#4,504 |
| 59. | 44450 | 3.2% | 0.29%(+2.94)#59 | 0.61%(+2.62)#4,520 |
| 60. | 45769 | 3.2% | 0.29%(+2.94)#60 | 0.61%(+2.62)#4,527 |
| 61. | 45682 | 3.2% | 0.29%(+2.88)#61 | 0.61%(+2.56)#4,597 |
| 62. | 43036 | 3.1% | 0.29%(+2.84)#62 | 0.61%(+2.52)#4,654 |
| 63. | 43541 | 3.1% | 0.29%(+2.84)#63 | 0.61%(+2.52)#4,658 |
| 64. | 43548 | 3.1% | 0.29%(+2.82)#64 | 0.61%(+2.51)#4,674 |
| 65. | 45887 | 3.0% | 0.29%(+2.75)#65 | 0.61%(+2.43)#4,762 |
| 66. | 43451 | 3.0% | 0.29%(+2.67)#66 | 0.61%(+2.35)#4,871 |
| 67. | 43943 | 2.9% | 0.29%(+2.63)#67 | 0.61%(+2.31)#4,938 |
| 68. | 45672 | 2.9% | 0.29%(+2.62)#68 | 0.61%(+2.31)#4,942 |
| 69. | 44838 | 2.9% | 0.29%(+2.57)#69 | 0.61%(+2.25)#5,018 |
| 70. | 45653 | 2.8% | 0.29%(+2.55)#70 | 0.61%(+2.24)#5,041 |
| 71. | 44606 | 2.8% | 0.29%(+2.50)#71 | 0.61%(+2.18)#5,123 |
| 72. | 43310 | 2.8% | 0.29%(+2.49)#72 | 0.61%(+2.18)#5,134 |
| 73. | 45814 | 2.7% | 0.29%(+2.45)#73 | 0.61%(+2.13)#5,189 |
| 74. | 44820 | 2.7% | 0.29%(+2.44)#74 | 0.61%(+2.13)#5,199 |
| 75. | 43840 | 2.7% | 0.29%(+2.42)#75 | 0.61%(+2.10)#5,230 |
| 76. | 44689 | 2.7% | 0.29%(+2.41)#76 | 0.61%(+2.10)#5,242 |
| 77. | 45308 | 2.7% | 0.29%(+2.40)#77 | 0.61%(+2.09)#5,259 |
| 78. | 45854 | 2.7% | 0.29%(+2.40)#78 | 0.61%(+2.08)#5,264 |
| 79. | 45735 | 2.7% | 0.29%(+2.37)#79 | 0.61%(+2.05)#5,316 |
| 80. | 44849 | 2.6% | 0.29%(+2.36)#80 | 0.61%(+2.04)#5,320 |
| 81. | 45388 | 2.6% | 0.29%(+2.34)#81 | 0.61%(+2.02)#5,350 |
| 82. | 43948 | 2.5% | 0.29%(+2.26)#82 | 0.61%(+1.94)#5,473 |
| 83. | 44802 | 2.4% | 0.29%(+2.14)#83 | 0.61%(+1.82)#5,679 |
| 84. | 45784 | 2.4% | 0.29%(+2.13)#84 | 0.61%(+1.81)#5,698 |
| 85. | 45833 | 2.4% | 0.29%(+2.12)#85 | 0.61%(+1.80)#5,716 |
| 86. | 44681 | 2.4% | 0.29%(+2.06)#86 | 0.61%(+1.75)#5,816 |
| 87. | 44047 | 2.3% | 0.29%(+2.02)#87 | 0.61%(+1.70)#5,906 |
| 88. | 45788 | 2.3% | 0.29%(+1.98)#88 | 0.61%(+1.67)#5,974 |
| 89. | 44417 | 2.3% | 0.29%(+1.97)#89 | 0.61%(+1.66)#5,996 |
| 90. | 44818 | 2.3% | 0.29%(+1.97)#90 | 0.61%(+1.65)#6,008 |
| 91. | 43985 | 2.2% | 0.29%(+1.96)#91 | 0.61%(+1.64)#6,030 |
| 92. | 45363 | 2.2% | 0.29%(+1.95)#92 | 0.61%(+1.63)#6,053 |
| 93. | 43971 | 2.2% | 0.29%(+1.94)#93 | 0.61%(+1.62)#6,072 |
| 94. | 43604 | 2.2% | 0.29%(+1.91)#94 | 0.61%(+1.59)#6,133 |
| 95. | 45142 | 2.2% | 0.29%(+1.90)#95 | 0.61%(+1.58)#6,154 |
| 96. | 44704 | 2.2% | 0.29%(+1.88)#96 | 0.61%(+1.56)#6,197 |
| 97. | 45623 | 2.1% | 0.29%(+1.86)#97 | 0.61%(+1.54)#6,239 |
| 98. | 45659 | 2.1% | 0.29%(+1.83)#98 | 0.61%(+1.51)#6,308 |
| 99. | 43084 | 2.1% | 0.29%(+1.82)#99 | 0.61%(+1.50)#6,317 |
| 100. | 43501 | 2.1% | 0.29%(+1.81)#100 | 0.61%(+1.49)#6,338 |
Common Questions
What are the Top 10 Zip Codes with the Highest Percentage of Population Employed in Farming, Fishing & Forestry in Ohio?
Top 10 Zip Codes with the Highest Percentage of Population Employed in Farming, Fishing & Forestry in Ohio are:
What zip code has the Highest Percentage of Population Employed in Farming, Fishing & Forestry in Ohio?
45688 has the Highest Percentage of Population Employed in Farming, Fishing & Forestry in Ohio with 26.1%.
What is the Percentage of Population Employed in Farming, Fishing & Forestry in the State of Ohio?
Percentage of Population Employed in Farming, Fishing & Forestry in Ohio is 0.29%.
What is the Percentage of Population Employed in Farming, Fishing & Forestry in the United States?
Percentage of Population Employed in Farming, Fishing & Forestry in the United States is 0.61%.