Zip Codes with the Highest Percentage of Population Employed in Construction & Extraction in Ohio
RELATED REPORTS & OPTIONS
Construction & Extraction
Ohio
Compare Zip Codes
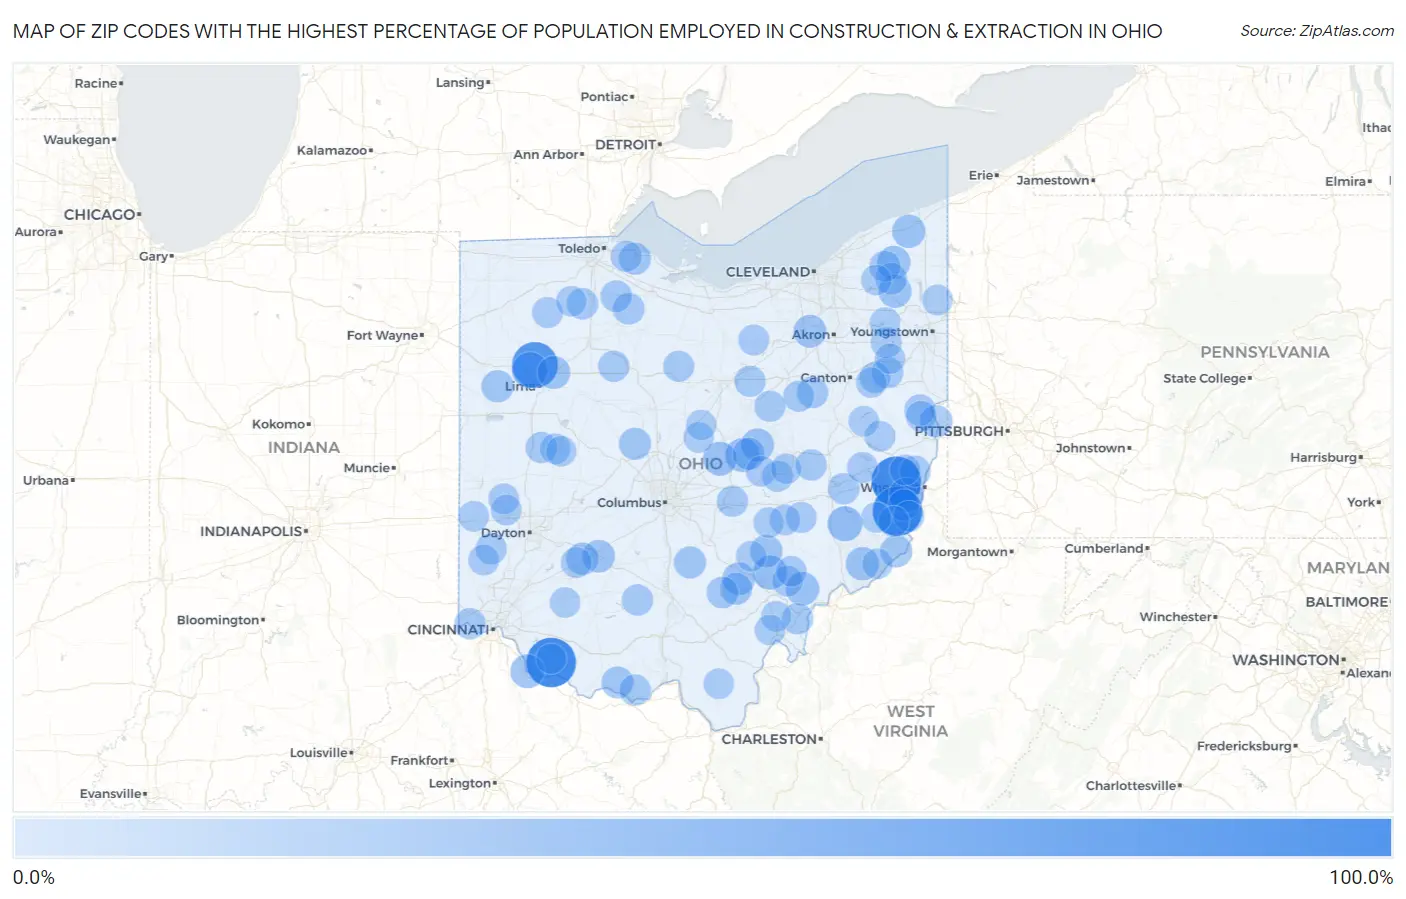
Map of Zip Codes with the Highest Percentage of Population Employed in Construction & Extraction in Ohio
0.0%
100.0%
Zip Codes with the Highest Percentage of Population Employed in Construction & Extraction in Ohio
| Zip Code | % Employed | vs State | vs National | |
| 1. | 43972 | 100.0% | 4.1%(+95.9)#1 | 5.0%(+95.0)#14 |
| 2. | 43902 | 100.0% | 4.1%(+95.9)#2 | 5.0%(+95.0)#15 |
| 3. | 45119 | 100.0% | 4.1%(+95.9)#3 | 5.0%(+95.0)#30 |
| 4. | 45893 | 82.5% | 4.1%(+78.3)#4 | 5.0%(+77.5)#45 |
| 5. | 45809 | 37.5% | 4.1%(+33.4)#5 | 5.0%(+32.5)#253 |
| 6. | 43779 | 32.1% | 4.1%(+28.0)#6 | 5.0%(+27.1)#353 |
| 7. | 43928 | 31.7% | 4.1%(+27.6)#7 | 5.0%(+26.7)#362 |
| 8. | 45782 | 29.0% | 4.1%(+24.9)#8 | 5.0%(+24.0)#426 |
| 9. | 43037 | 27.8% | 4.1%(+23.7)#9 | 5.0%(+22.9)#469 |
| 10. | 45156 | 27.8% | 4.1%(+23.7)#10 | 5.0%(+22.8)#475 |
| 11. | 43027 | 27.6% | 4.1%(+23.5)#11 | 5.0%(+22.6)#483 |
| 12. | 45724 | 25.7% | 4.1%(+21.6)#12 | 5.0%(+20.7)#561 |
| 13. | 44099 | 25.0% | 4.1%(+20.9)#13 | 5.0%(+20.0)#585 |
| 14. | 45789 | 25.0% | 4.1%(+20.9)#14 | 5.0%(+20.0)#594 |
| 15. | 44010 | 24.8% | 4.1%(+20.7)#15 | 5.0%(+19.8)#605 |
| 16. | 44491 | 24.1% | 4.1%(+20.0)#16 | 5.0%(+19.1)#641 |
| 17. | 43843 | 24.0% | 4.1%(+19.9)#17 | 5.0%(+19.0)#646 |
| 18. | 45808 | 23.5% | 4.1%(+19.4)#18 | 5.0%(+18.5)#680 |
| 19. | 44274 | 23.3% | 4.1%(+19.1)#19 | 5.0%(+18.3)#701 |
| 20. | 43142 | 22.0% | 4.1%(+17.9)#20 | 5.0%(+17.0)#793 |
| 21. | 43158 | 22.0% | 4.1%(+17.9)#21 | 5.0%(+17.0)#795 |
| 22. | 43730 | 21.9% | 4.1%(+17.8)#22 | 5.0%(+16.9)#803 |
| 23. | 45307 | 21.4% | 4.1%(+17.3)#23 | 5.0%(+16.4)#846 |
| 24. | 43926 | 21.1% | 4.1%(+17.0)#24 | 5.0%(+16.1)#878 |
| 25. | 45838 | 20.0% | 4.1%(+15.9)#25 | 5.0%(+15.0)#1,001 |
| 26. | 43445 | 19.8% | 4.1%(+15.7)#26 | 5.0%(+14.8)#1,013 |
| 27. | 43946 | 19.6% | 4.1%(+15.5)#27 | 5.0%(+14.6)#1,052 |
| 28. | 43156 | 19.6% | 4.1%(+15.5)#28 | 5.0%(+14.6)#1,056 |
| 29. | 43005 | 19.5% | 4.1%(+15.4)#29 | 5.0%(+14.5)#1,060 |
| 30. | 43036 | 19.4% | 4.1%(+15.3)#30 | 5.0%(+14.4)#1,080 |
| 31. | 45654 | 19.0% | 4.1%(+14.9)#31 | 5.0%(+14.0)#1,133 |
| 32. | 45650 | 18.9% | 4.1%(+14.8)#32 | 5.0%(+13.9)#1,154 |
| 33. | 45622 | 18.0% | 4.1%(+13.9)#33 | 5.0%(+13.0)#1,301 |
| 34. | 44062 | 17.8% | 4.1%(+13.7)#34 | 5.0%(+12.8)#1,325 |
| 35. | 44841 | 17.7% | 4.1%(+13.6)#35 | 5.0%(+12.7)#1,342 |
| 36. | 43406 | 17.7% | 4.1%(+13.5)#36 | 5.0%(+12.7)#1,348 |
| 37. | 44634 | 17.4% | 4.1%(+13.3)#37 | 5.0%(+12.4)#1,405 |
| 38. | 44659 | 17.1% | 4.1%(+13.0)#38 | 5.0%(+12.1)#1,456 |
| 39. | 43933 | 16.6% | 4.1%(+12.5)#39 | 5.0%(+11.6)#1,577 |
| 40. | 43462 | 16.5% | 4.1%(+12.3)#40 | 5.0%(+11.5)#1,603 |
| 41. | 45681 | 16.4% | 4.1%(+12.3)#41 | 5.0%(+11.4)#1,616 |
| 42. | 43755 | 16.3% | 4.1%(+12.2)#42 | 5.0%(+11.3)#1,632 |
| 43. | 43939 | 16.2% | 4.1%(+12.0)#43 | 5.0%(+11.2)#1,677 |
| 44. | 43359 | 16.0% | 4.1%(+11.9)#44 | 5.0%(+11.0)#1,715 |
| 45. | 45783 | 15.9% | 4.1%(+11.8)#45 | 5.0%(+10.9)#1,746 |
| 46. | 45684 | 15.9% | 4.1%(+11.8)#46 | 5.0%(+10.9)#1,752 |
| 47. | 45001 | 15.8% | 4.1%(+11.7)#47 | 5.0%(+10.8)#1,760 |
| 48. | 43836 | 15.8% | 4.1%(+11.7)#48 | 5.0%(+10.8)#1,772 |
| 49. | 45360 | 15.7% | 4.1%(+11.6)#49 | 5.0%(+10.7)#1,797 |
| 50. | 43030 | 15.6% | 4.1%(+11.5)#50 | 5.0%(+10.6)#1,821 |
| 51. | 45330 | 15.5% | 4.1%(+11.4)#51 | 5.0%(+10.6)#1,840 |
| 52. | 44838 | 15.2% | 4.1%(+11.1)#52 | 5.0%(+10.2)#1,935 |
| 53. | 44669 | 15.2% | 4.1%(+11.1)#53 | 5.0%(+10.2)#1,941 |
| 54. | 43842 | 15.2% | 4.1%(+11.1)#54 | 5.0%(+10.2)#1,955 |
| 55. | 43930 | 15.2% | 4.1%(+11.1)#55 | 5.0%(+10.2)#1,957 |
| 56. | 44627 | 15.2% | 4.1%(+11.0)#56 | 5.0%(+10.2)#1,967 |
| 57. | 44611 | 15.1% | 4.1%(+11.0)#57 | 5.0%(+10.1)#1,976 |
| 58. | 44881 | 15.0% | 4.1%(+10.9)#58 | 5.0%(+10.0)#2,025 |
| 59. | 44046 | 14.8% | 4.1%(+10.7)#59 | 5.0%(+9.77)#2,126 |
| 60. | 43942 | 14.8% | 4.1%(+10.6)#60 | 5.0%(+9.76)#2,130 |
| 61. | 43973 | 14.6% | 4.1%(+10.5)#61 | 5.0%(+9.64)#2,180 |
| 62. | 44880 | 14.6% | 4.1%(+10.5)#62 | 5.0%(+9.60)#2,198 |
| 63. | 44411 | 14.6% | 4.1%(+10.4)#63 | 5.0%(+9.56)#2,215 |
| 64. | 43468 | 14.5% | 4.1%(+10.4)#64 | 5.0%(+9.53)#2,231 |
| 65. | 43727 | 14.5% | 4.1%(+10.4)#65 | 5.0%(+9.53)#2,234 |
| 66. | 43524 | 14.5% | 4.1%(+10.4)#66 | 5.0%(+9.49)#2,249 |
| 67. | 45064 | 14.1% | 4.1%(+9.96)#67 | 5.0%(+9.08)#2,427 |
| 68. | 44418 | 13.9% | 4.1%(+9.84)#68 | 5.0%(+8.96)#2,487 |
| 69. | 45164 | 13.9% | 4.1%(+9.75)#69 | 5.0%(+8.87)#2,528 |
| 70. | 43716 | 13.8% | 4.1%(+9.73)#70 | 5.0%(+8.84)#2,534 |
| 71. | 43974 | 13.6% | 4.1%(+9.53)#71 | 5.0%(+8.64)#2,637 |
| 72. | 45711 | 13.6% | 4.1%(+9.51)#72 | 5.0%(+8.62)#2,648 |
| 73. | 43728 | 13.6% | 4.1%(+9.45)#73 | 5.0%(+8.56)#2,677 |
| 74. | 45337 | 13.4% | 4.1%(+9.33)#74 | 5.0%(+8.45)#2,734 |
| 75. | 45354 | 13.4% | 4.1%(+9.27)#75 | 5.0%(+8.38)#2,762 |
| 76. | 43988 | 13.3% | 4.1%(+9.18)#76 | 5.0%(+8.30)#2,799 |
| 77. | 45321 | 13.3% | 4.1%(+9.17)#77 | 5.0%(+8.29)#2,802 |
| 78. | 43822 | 13.2% | 4.1%(+9.08)#78 | 5.0%(+8.20)#2,839 |
| 79. | 43771 | 13.2% | 4.1%(+9.08)#79 | 5.0%(+8.20)#2,841 |
| 80. | 43932 | 13.1% | 4.1%(+8.98)#80 | 5.0%(+8.09)#2,888 |
| 81. | 45688 | 13.0% | 4.1%(+8.93)#81 | 5.0%(+8.05)#2,911 |
| 82. | 44675 | 12.9% | 4.1%(+8.84)#82 | 5.0%(+7.95)#2,966 |
| 83. | 43766 | 12.9% | 4.1%(+8.76)#83 | 5.0%(+7.88)#3,007 |
| 84. | 43777 | 12.8% | 4.1%(+8.73)#84 | 5.0%(+7.84)#3,026 |
| 85. | 45776 | 12.6% | 4.1%(+8.44)#85 | 5.0%(+7.56)#3,214 |
| 86. | 43343 | 12.5% | 4.1%(+8.43)#86 | 5.0%(+7.55)#3,220 |
| 87. | 43541 | 12.5% | 4.1%(+8.39)#87 | 5.0%(+7.51)#3,266 |
| 88. | 45148 | 12.5% | 4.1%(+8.37)#88 | 5.0%(+7.48)#3,281 |
| 89. | 44021 | 12.5% | 4.1%(+8.34)#89 | 5.0%(+7.46)#3,303 |
| 90. | 43318 | 12.4% | 4.1%(+8.27)#90 | 5.0%(+7.38)#3,354 |
| 91. | 43747 | 12.4% | 4.1%(+8.26)#91 | 5.0%(+7.37)#3,359 |
| 92. | 45767 | 12.4% | 4.1%(+8.26)#92 | 5.0%(+7.37)#3,361 |
| 93. | 43350 | 12.3% | 4.1%(+8.22)#93 | 5.0%(+7.33)#3,388 |
| 94. | 43811 | 12.3% | 4.1%(+8.19)#94 | 5.0%(+7.30)#3,404 |
| 95. | 44285 | 12.3% | 4.1%(+8.17)#95 | 5.0%(+7.29)#3,411 |
| 96. | 45769 | 12.3% | 4.1%(+8.15)#96 | 5.0%(+7.27)#3,419 |
| 97. | 44670 | 12.2% | 4.1%(+8.14)#97 | 5.0%(+7.25)#3,428 |
| 98. | 45130 | 12.2% | 4.1%(+8.10)#98 | 5.0%(+7.21)#3,451 |
| 99. | 44672 | 12.2% | 4.1%(+8.05)#99 | 5.0%(+7.16)#3,483 |
| 100. | 43317 | 12.1% | 4.1%(+8.01)#100 | 5.0%(+7.13)#3,519 |
Common Questions
What are the Top 10 Zip Codes with the Highest Percentage of Population Employed in Construction & Extraction in Ohio?
Top 10 Zip Codes with the Highest Percentage of Population Employed in Construction & Extraction in Ohio are:
What zip code has the Highest Percentage of Population Employed in Construction & Extraction in Ohio?
43972 has the Highest Percentage of Population Employed in Construction & Extraction in Ohio with 100.0%.
What is the Percentage of Population Employed in Construction & Extraction in the State of Ohio?
Percentage of Population Employed in Construction & Extraction in Ohio is 4.1%.
What is the Percentage of Population Employed in Construction & Extraction in the United States?
Percentage of Population Employed in Construction & Extraction in the United States is 5.0%.