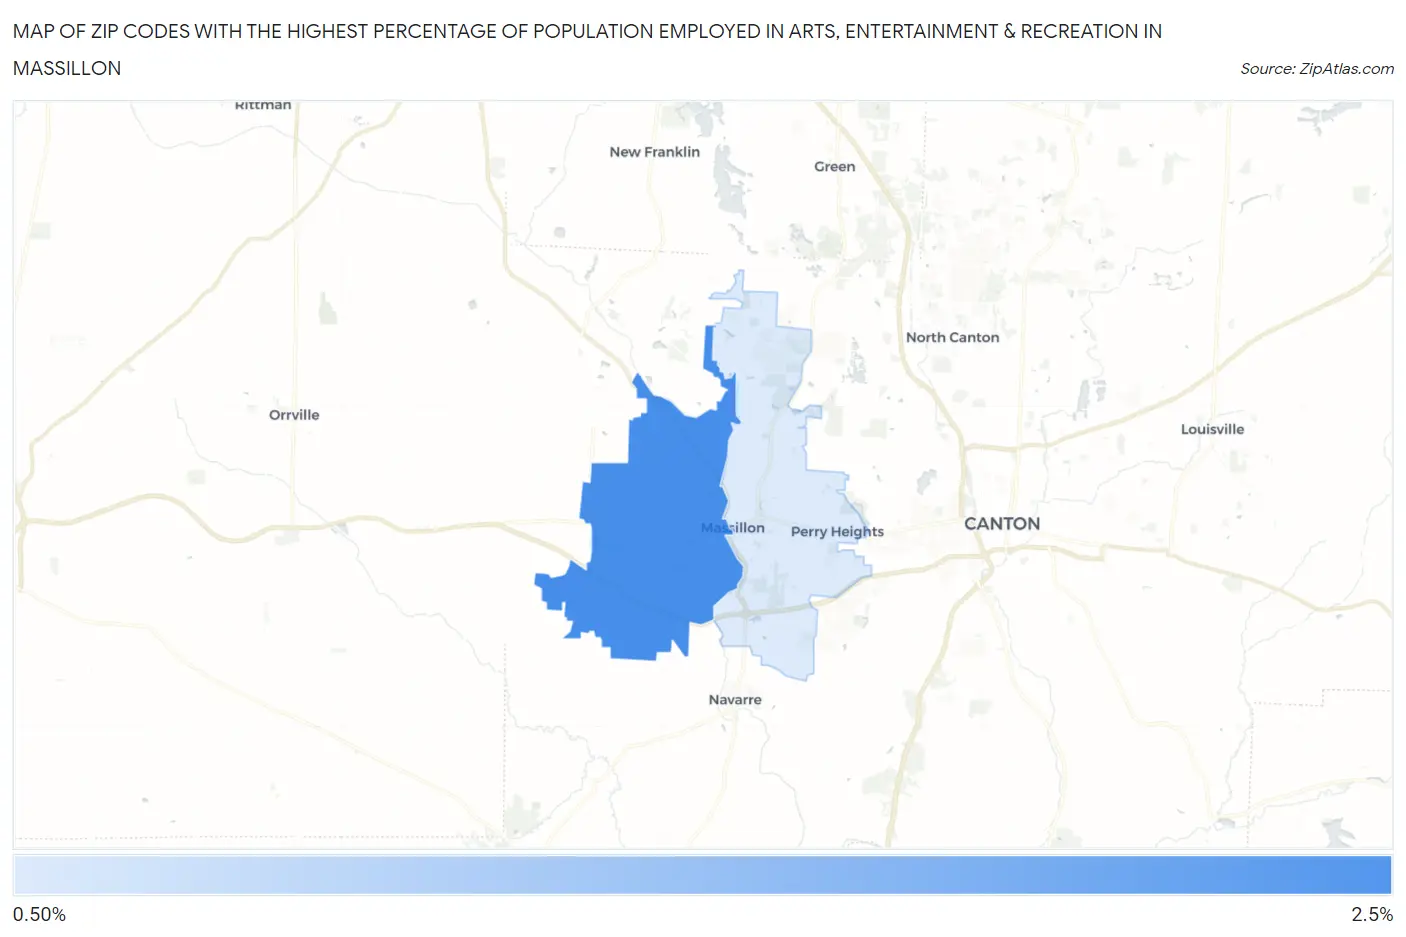
Zip Codes with the Highest Percentage of Population Employed in Arts, Entertainment & Recreation in Massillon, OH
RELATED REPORTS & OPTIONS
Arts, Entertainment & Recreation
Massillon
Compare Zip Codes
Map of Zip Codes with the Highest Percentage of Population Employed in Arts, Entertainment & Recreation in Massillon
0.0%
2.5%
Zip Codes with the Highest Percentage of Population Employed in Arts, Entertainment & Recreation in Massillon, OH
| Zip Code | % Employed | vs State | vs National | |
| 1. | 44647 | 2.3% | 1.7%(+0.644)#199 | 2.1%(+0.240)#8,027 |
| 2. | 44646 | 1.3% | 1.7%(-0.389)#483 | 2.1%(-0.793)#14,796 |
1
Common Questions
What are the Top Zip Codes with the Highest Percentage of Population Employed in Arts, Entertainment & Recreation in Massillon, OH?
Top Zip Codes with the Highest Percentage of Population Employed in Arts, Entertainment & Recreation in Massillon, OH are:
What zip code has the Highest Percentage of Population Employed in Arts, Entertainment & Recreation in Massillon, OH?
44647 has the Highest Percentage of Population Employed in Arts, Entertainment & Recreation in Massillon, OH with 2.3%.
What is the Percentage of Population Employed in Arts, Entertainment & Recreation in Massillon, OH?
Percentage of Population Employed in Arts, Entertainment & Recreation in Massillon is 0.66%.
What is the Percentage of Population Employed in Arts, Entertainment & Recreation in Ohio?
Percentage of Population Employed in Arts, Entertainment & Recreation in Ohio is 1.7%.
What is the Percentage of Population Employed in Arts, Entertainment & Recreation in the United States?
Percentage of Population Employed in Arts, Entertainment & Recreation in the United States is 2.1%.