Zip Codes with the Highest Percentage of Population Employed in Farming, Fishing & Forestry in Lima, OH
RELATED REPORTS & OPTIONS
Farming, Fishing & Forestry
Lima
Compare Zip Codes
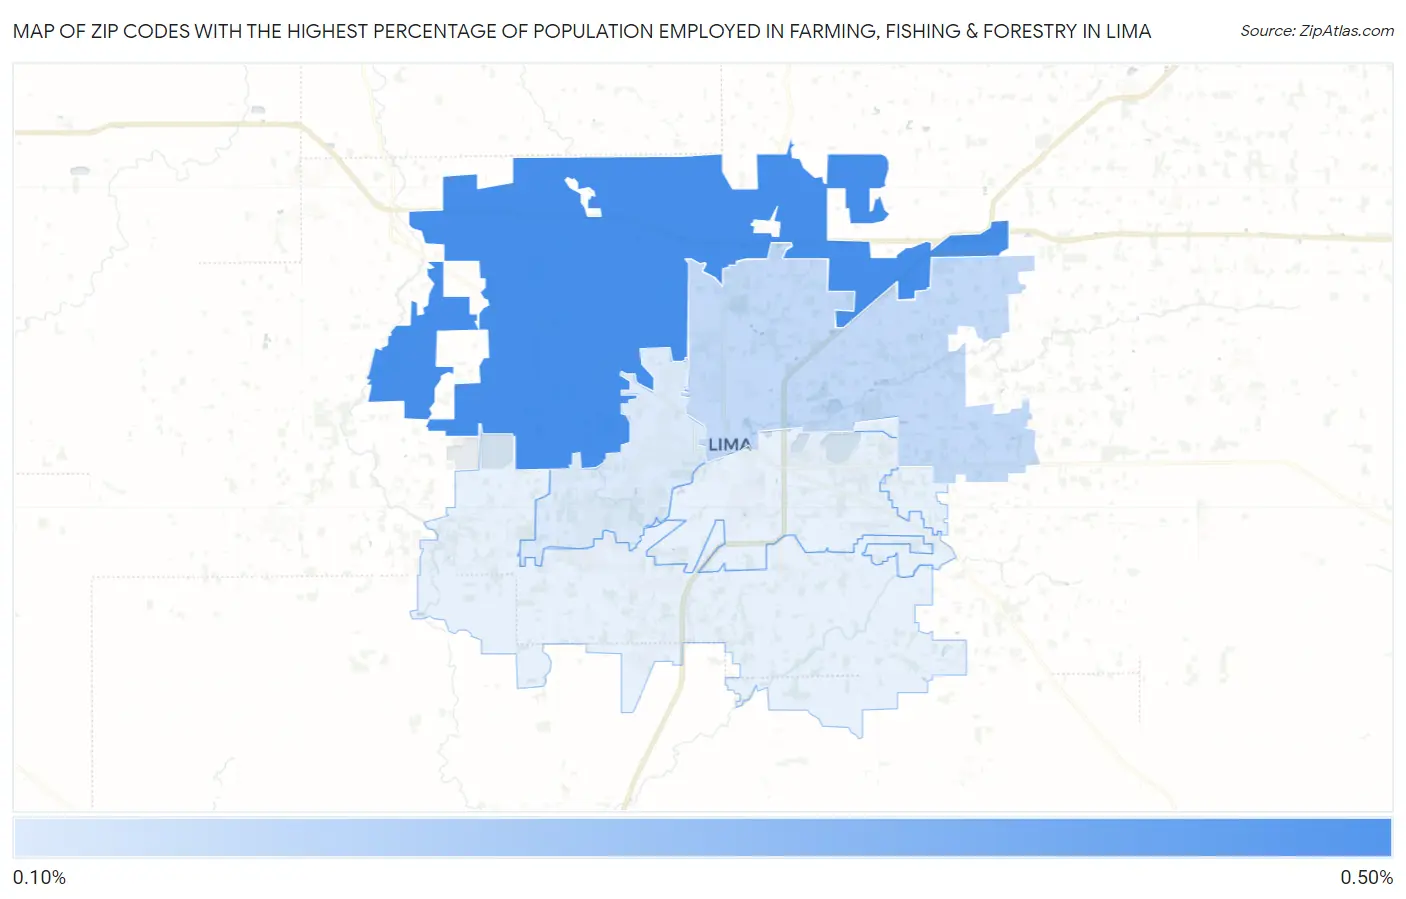
Map of Zip Codes with the Highest Percentage of Population Employed in Farming, Fishing & Forestry in Lima
0.0%
0.50%
Zip Codes with the Highest Percentage of Population Employed in Farming, Fishing & Forestry in Lima, OH
| Zip Code | % Employed | vs State | vs National | |
| 1. | 45807 | 0.43% | 0.29%(+0.143)#314 | 0.61%(-0.174)#13,488 |
| 2. | 45801 | 0.24% | 0.29%(-0.050)#398 | 0.61%(-0.367)#15,566 |
| 3. | 45805 | 0.19% | 0.29%(-0.096)#425 | 0.61%(-0.413)#16,234 |
1
Common Questions
What are the Top 3 Zip Codes with the Highest Percentage of Population Employed in Farming, Fishing & Forestry in Lima, OH?
Top 3 Zip Codes with the Highest Percentage of Population Employed in Farming, Fishing & Forestry in Lima, OH are:
What zip code has the Highest Percentage of Population Employed in Farming, Fishing & Forestry in Lima, OH?
45807 has the Highest Percentage of Population Employed in Farming, Fishing & Forestry in Lima, OH with 0.43%.
What is the Percentage of Population Employed in Farming, Fishing & Forestry in Lima, OH?
Percentage of Population Employed in Farming, Fishing & Forestry in Lima is 0.24%.
What is the Percentage of Population Employed in Farming, Fishing & Forestry in Ohio?
Percentage of Population Employed in Farming, Fishing & Forestry in Ohio is 0.29%.
What is the Percentage of Population Employed in Farming, Fishing & Forestry in the United States?
Percentage of Population Employed in Farming, Fishing & Forestry in the United States is 0.61%.