Zip Codes with the Highest Percentage of Population Employed in Farming, Fishing & Forestry in Kent, OH
RELATED REPORTS & OPTIONS
Farming, Fishing & Forestry
Kent
Compare Zip Codes
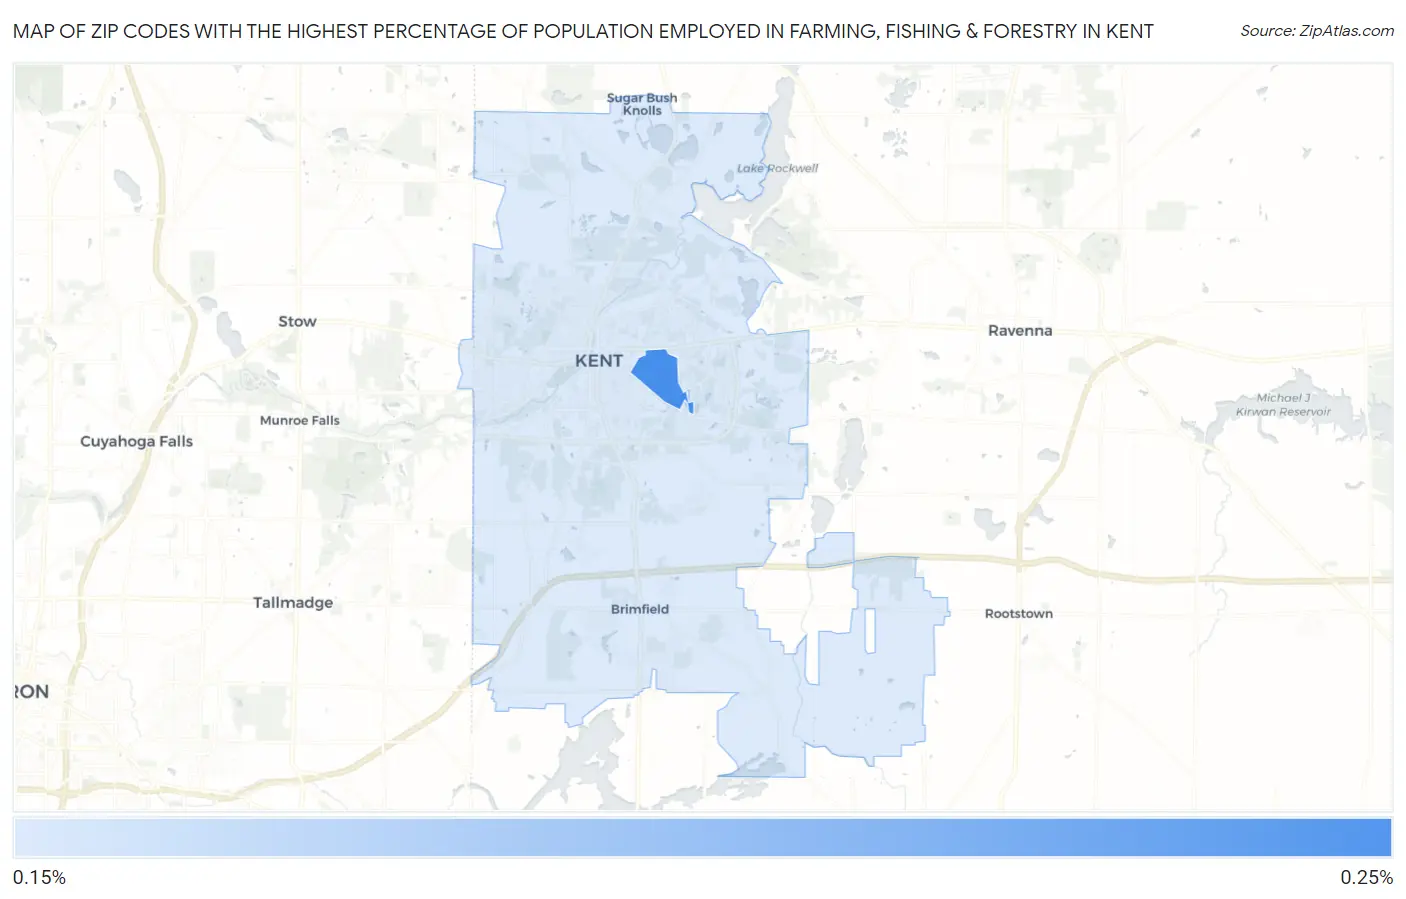
Map of Zip Codes with the Highest Percentage of Population Employed in Farming, Fishing & Forestry in Kent
0.0%
0.25%
Zip Codes with the Highest Percentage of Population Employed in Farming, Fishing & Forestry in Kent, OH
| Zip Code | % Employed | vs State | vs National | |
| 1. | 44243 | 0.21% | 0.29%(-0.076)#413 | 0.61%(-0.393)#15,949 |
| 2. | 44240 | 0.20% | 0.29%(-0.091)#421 | 0.61%(-0.407)#16,159 |
1
Common Questions
What are the Top Zip Codes with the Highest Percentage of Population Employed in Farming, Fishing & Forestry in Kent, OH?
Top Zip Codes with the Highest Percentage of Population Employed in Farming, Fishing & Forestry in Kent, OH are:
What zip code has the Highest Percentage of Population Employed in Farming, Fishing & Forestry in Kent, OH?
44243 has the Highest Percentage of Population Employed in Farming, Fishing & Forestry in Kent, OH with 0.21%.
What is the Percentage of Population Employed in Farming, Fishing & Forestry in Kent, OH?
Percentage of Population Employed in Farming, Fishing & Forestry in Kent is 0.33%.
What is the Percentage of Population Employed in Farming, Fishing & Forestry in Ohio?
Percentage of Population Employed in Farming, Fishing & Forestry in Ohio is 0.29%.
What is the Percentage of Population Employed in Farming, Fishing & Forestry in the United States?
Percentage of Population Employed in Farming, Fishing & Forestry in the United States is 0.61%.