Zip Codes with the Highest Percentage of Population Employed in Arts, Entertainment & Recreation in Cuyahoga Falls, OH
RELATED REPORTS & OPTIONS
Arts, Entertainment & Recreation
Cuyahoga Falls
Compare Zip Codes
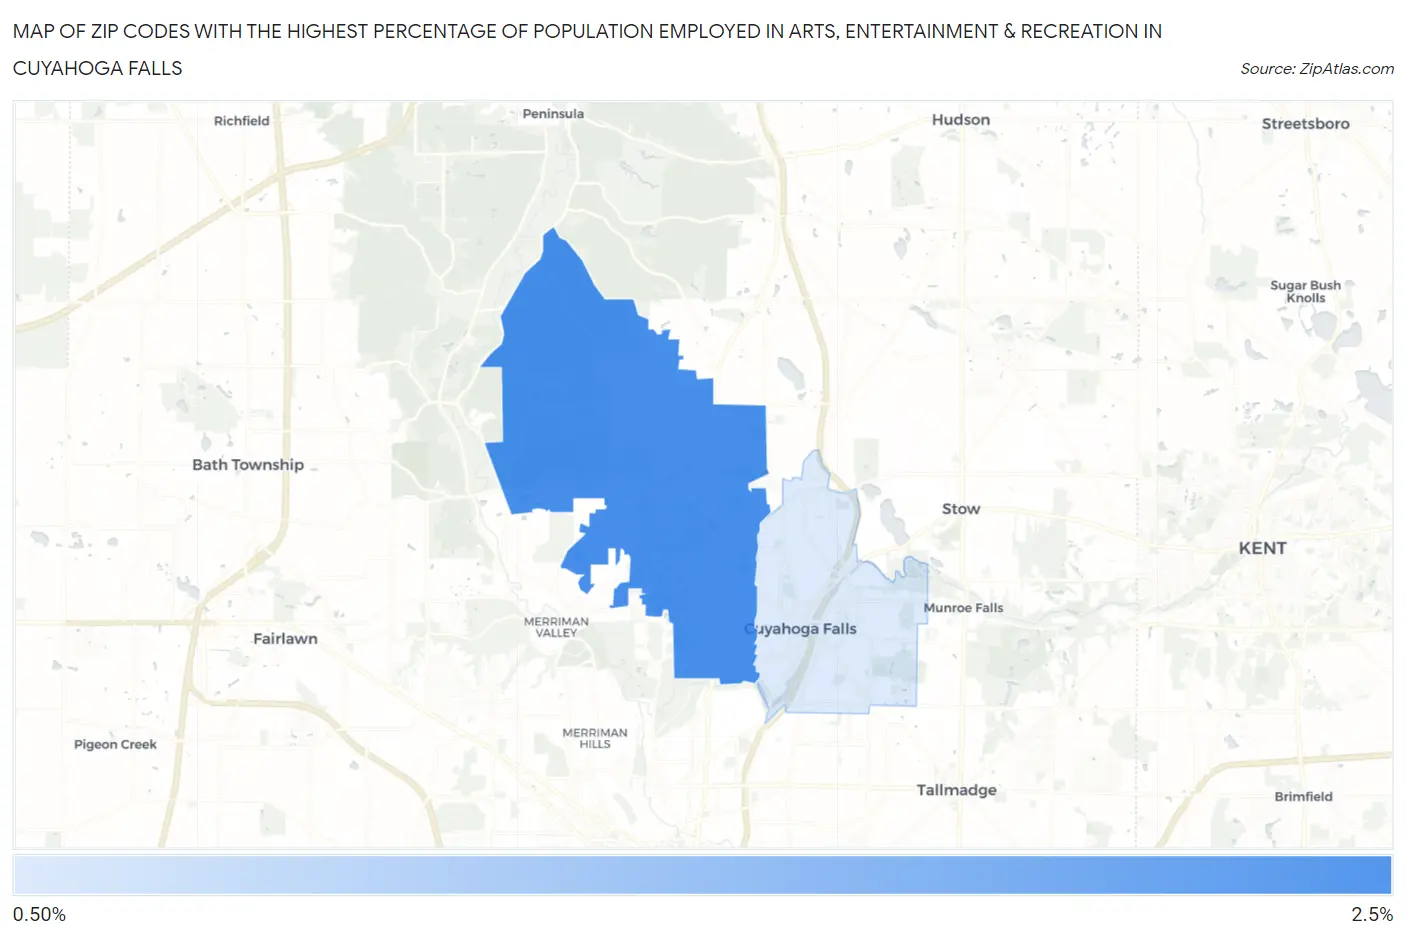
Map of Zip Codes with the Highest Percentage of Population Employed in Arts, Entertainment & Recreation in Cuyahoga Falls
0.0%
2.5%
Zip Codes with the Highest Percentage of Population Employed in Arts, Entertainment & Recreation in Cuyahoga Falls, OH
| Zip Code | % Employed | vs State | vs National | |
| 1. | 44223 | 2.3% | 1.7%(+0.632)#202 | 2.1%(+0.228)#8,077 |
| 2. | 44221 | 0.63% | 1.7%(-1.04)#702 | 2.1%(-1.45)#19,599 |
1
Common Questions
What are the Top Zip Codes with the Highest Percentage of Population Employed in Arts, Entertainment & Recreation in Cuyahoga Falls, OH?
Top Zip Codes with the Highest Percentage of Population Employed in Arts, Entertainment & Recreation in Cuyahoga Falls, OH are:
What zip code has the Highest Percentage of Population Employed in Arts, Entertainment & Recreation in Cuyahoga Falls, OH?
44223 has the Highest Percentage of Population Employed in Arts, Entertainment & Recreation in Cuyahoga Falls, OH with 2.3%.
What is the Percentage of Population Employed in Arts, Entertainment & Recreation in Cuyahoga Falls, OH?
Percentage of Population Employed in Arts, Entertainment & Recreation in Cuyahoga Falls is 0.95%.
What is the Percentage of Population Employed in Arts, Entertainment & Recreation in Ohio?
Percentage of Population Employed in Arts, Entertainment & Recreation in Ohio is 1.7%.
What is the Percentage of Population Employed in Arts, Entertainment & Recreation in the United States?
Percentage of Population Employed in Arts, Entertainment & Recreation in the United States is 2.1%.