Zip Codes with the Highest Percentage of Population with a Degree in Liberal Arts and History in Henderson, NV
RELATED REPORTS & OPTIONS
Liberal Arts and History
Henderson
Compare Zip Codes
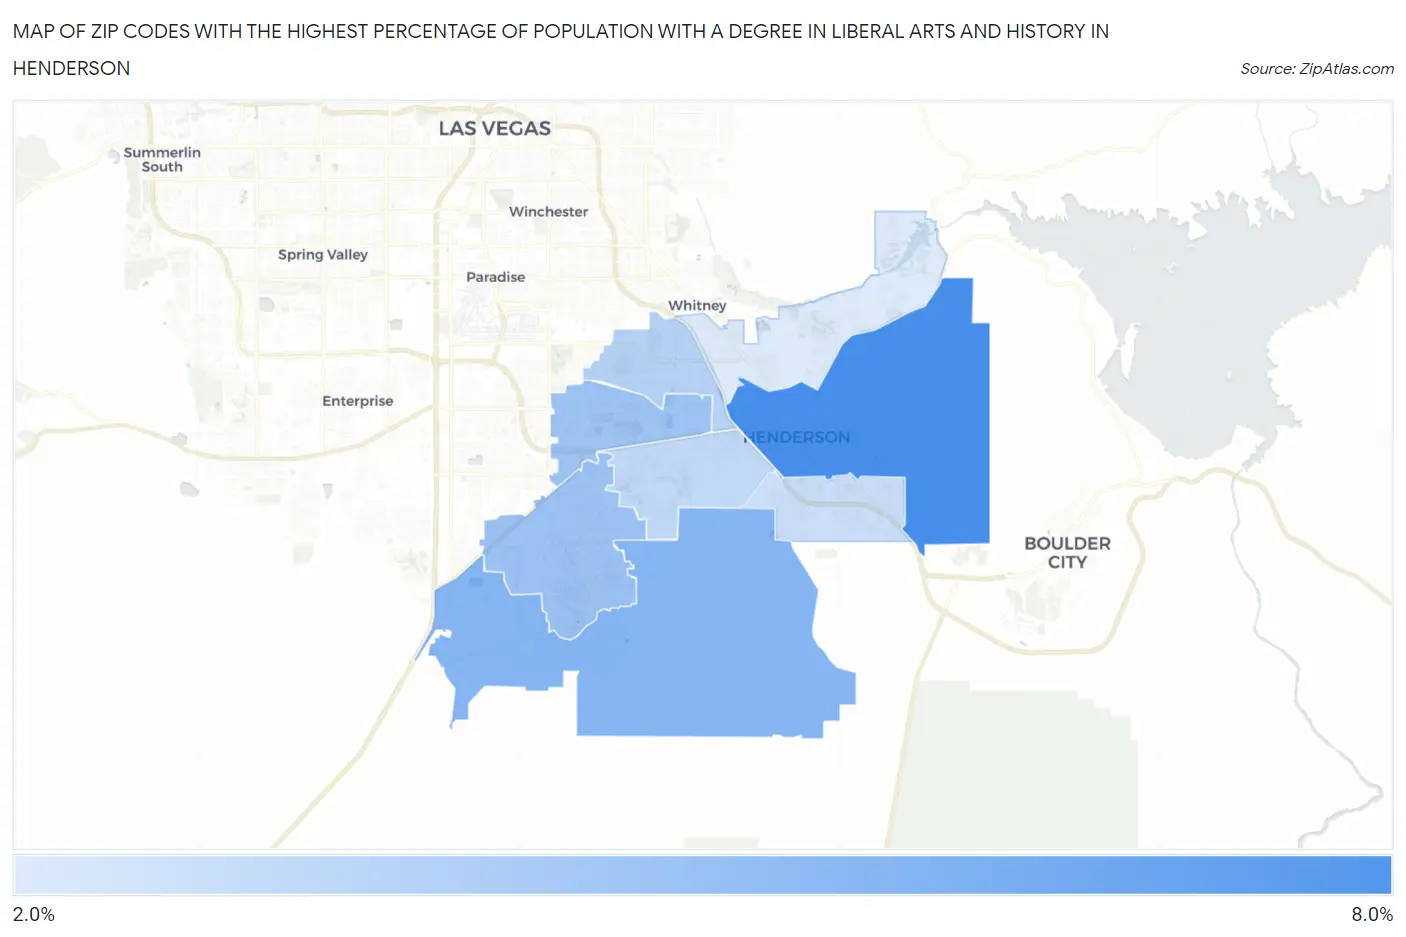
Map of Zip Codes with the Highest Percentage of Population with a Degree in Liberal Arts and History in Henderson
2.4%
6.7%
Zip Codes with the Highest Percentage of Population with a Degree in Liberal Arts and History in Henderson, NV
| Zip Code | % Graduates | vs State | vs National | |
| 1. | 89015 | 6.7% | 3.8%(+2.84)#18 | 4.9%(+1.81)#6,979 |
| 2. | 89044 | 4.9% | 3.8%(+1.03)#40 | 4.9%(+0.007)#11,697 |
| 3. | 89052 | 4.3% | 3.8%(+0.489)#59 | 4.9%(-0.535)#13,512 |
| 4. | 89074 | 4.2% | 3.8%(+0.340)#63 | 4.9%(-0.684)#14,058 |
| 5. | 89014 | 3.5% | 3.8%(-0.305)#77 | 4.9%(-1.33)#16,432 |
| 6. | 89012 | 3.2% | 3.8%(-0.671)#88 | 4.9%(-1.70)#17,737 |
| 7. | 89002 | 2.9% | 3.8%(-0.918)#91 | 4.9%(-1.94)#18,599 |
| 8. | 89011 | 2.4% | 3.8%(-1.41)#102 | 4.9%(-2.43)#20,184 |
1
Common Questions
What are the Top 5 Zip Codes with the Highest Percentage of Population with a Degree in Liberal Arts and History in Henderson, NV?
Top 5 Zip Codes with the Highest Percentage of Population with a Degree in Liberal Arts and History in Henderson, NV are:
What zip code has the Highest Percentage of Population with a Degree in Liberal Arts and History in Henderson, NV?
89015 has the Highest Percentage of Population with a Degree in Liberal Arts and History in Henderson, NV with 6.7%.
What is the Percentage of Population with a Degree in Liberal Arts and History in Henderson, NV?
Percentage of Population with a Degree in Liberal Arts and History in Henderson is 4.1%.
What is the Percentage of Population with a Degree in Liberal Arts and History in Nevada?
Percentage of Population with a Degree in Liberal Arts and History in Nevada is 3.8%.
What is the Percentage of Population with a Degree in Liberal Arts and History in the United States?
Percentage of Population with a Degree in Liberal Arts and History in the United States is 4.9%.