Villanueva, NM Map & Demographics
Villanueva Map
Villanueva Overview
$17,080
PER CAPITA INCOME
$25,264
AVG HOUSEHOLD INCOME
0.44
INEQUALITY / GINI INDEX
433
TOTAL POPULATION
199
MALE POPULATION
234
FEMALE POPULATION
85.04
MALES / 100 FEMALES
117.59
FEMALES / 100 MALES
54.4
MEDIAN AGE
4.3
AVG FAMILY SIZE
2.5
AVG HOUSEHOLD SIZE
175
LABOR FORCE [ PEOPLE ]
46.9%
PERCENT IN LABOR FORCE
Villanueva Zip Codes
Villanueva Area Codes
Income in Villanueva
Income Overview in Villanueva
| Characteristic | Number | Measure |
| Per Capita Income | 433 | $17,080 |
| Median Family Income | 67 | $0 |
| Mean Family Income | 67 | $65,970 |
| Median Household Income | 171 | $25,264 |
| Mean Household Income | 171 | $38,483 |
| Income Deficit | 67 | $0 |
| Wage / Income Gap (%) | 433 | 0.00% |
| Wage / Income Gap ($) | 433 | 100.00¢ per $1 |
| Gini / Inequality Index | 433 | 0.44 |
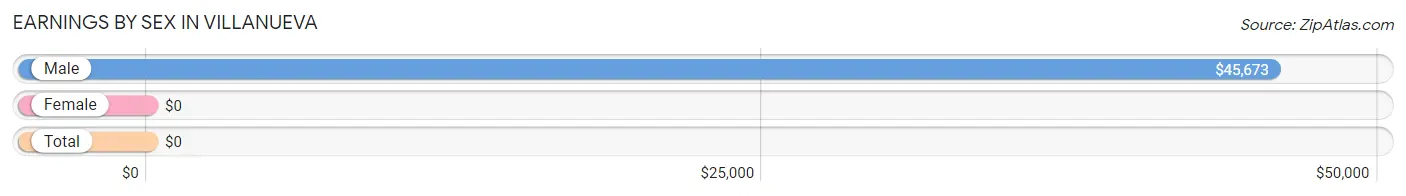
Earnings by Sex in Villanueva
| Sex | Number | Average Earnings |
| Male | 52 (29.7%) | $45,673 |
| Female | 123 (70.3%) | $0 |
| Total | 175 (100.0%) | $0 |
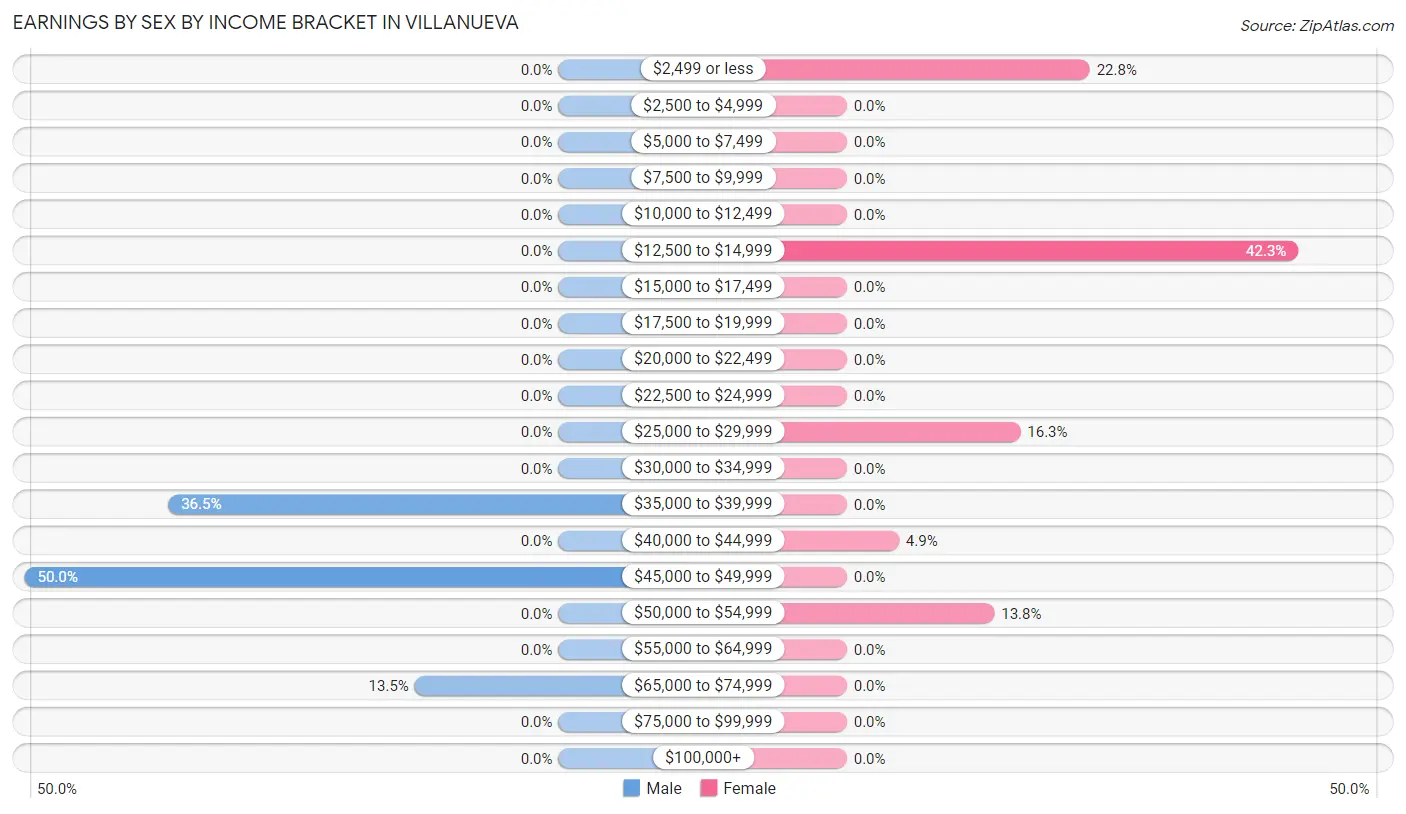
Earnings by Sex by Income Bracket in Villanueva
The most common earnings brackets in Villanueva are $45,000 to $49,999 for men (26 | 50.0%) and $12,500 to $14,999 for women (52 | 42.3%).
| Income | Male | Female |
| $2,499 or less | 0 (0.0%) | 28 (22.8%) |
| $2,500 to $4,999 | 0 (0.0%) | 0 (0.0%) |
| $5,000 to $7,499 | 0 (0.0%) | 0 (0.0%) |
| $7,500 to $9,999 | 0 (0.0%) | 0 (0.0%) |
| $10,000 to $12,499 | 0 (0.0%) | 0 (0.0%) |
| $12,500 to $14,999 | 0 (0.0%) | 52 (42.3%) |
| $15,000 to $17,499 | 0 (0.0%) | 0 (0.0%) |
| $17,500 to $19,999 | 0 (0.0%) | 0 (0.0%) |
| $20,000 to $22,499 | 0 (0.0%) | 0 (0.0%) |
| $22,500 to $24,999 | 0 (0.0%) | 0 (0.0%) |
| $25,000 to $29,999 | 0 (0.0%) | 20 (16.3%) |
| $30,000 to $34,999 | 0 (0.0%) | 0 (0.0%) |
| $35,000 to $39,999 | 19 (36.5%) | 0 (0.0%) |
| $40,000 to $44,999 | 0 (0.0%) | 6 (4.9%) |
| $45,000 to $49,999 | 26 (50.0%) | 0 (0.0%) |
| $50,000 to $54,999 | 0 (0.0%) | 17 (13.8%) |
| $55,000 to $64,999 | 0 (0.0%) | 0 (0.0%) |
| $65,000 to $74,999 | 7 (13.5%) | 0 (0.0%) |
| $75,000 to $99,999 | 0 (0.0%) | 0 (0.0%) |
| $100,000+ | 0 (0.0%) | 0 (0.0%) |
| Total | 52 (100.0%) | 123 (100.0%) |
Earnings by Sex by Educational Attainment in Villanueva
| Educational Attainment | Male Income | Female Income |
| Less than High School | - | - |
| High School Diploma | - | - |
| College or Associate's Degree | - | - |
| Bachelor's Degree | - | - |
| Graduate Degree | - | - |
| Total | - | - |
Family Income in Villanueva
Family Income Brackets in Villanueva
According to the Villanueva family income data, there are 28 families falling into the $15,000 to $24,999 income range, which is the most common income bracket and makes up 41.8% of all families.
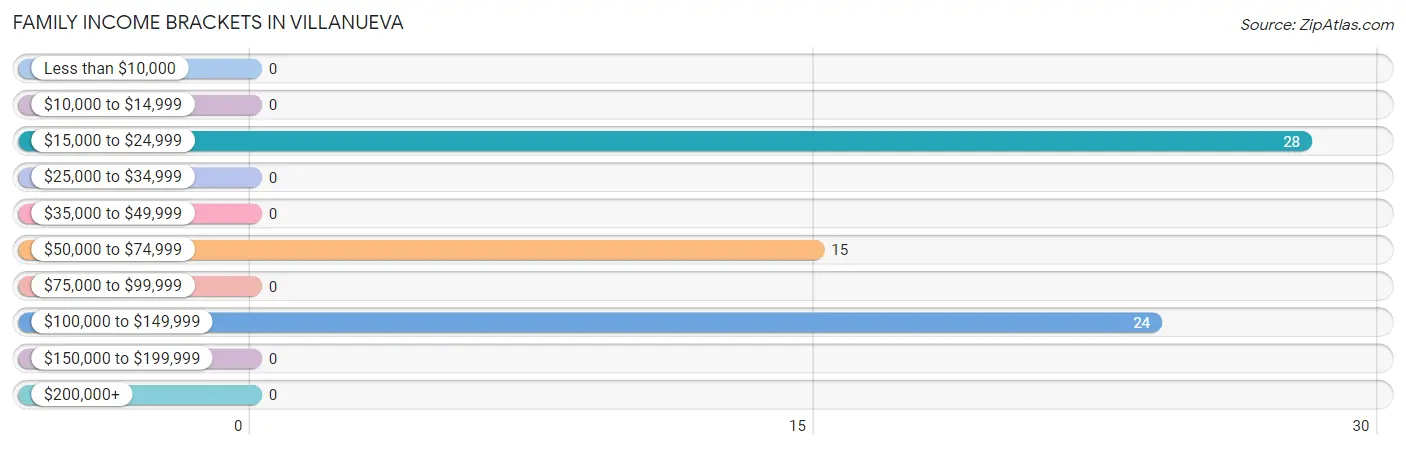
| Income Bracket | # Families | % Families |
| Less than $10,000 | 0 | 0.0% |
| $10,000 to $14,999 | 0 | 0.0% |
| $15,000 to $24,999 | 28 | 41.8% |
| $25,000 to $34,999 | 0 | 0.0% |
| $35,000 to $49,999 | 0 | 0.0% |
| $50,000 to $74,999 | 15 | 22.4% |
| $75,000 to $99,999 | 0 | 0.0% |
| $100,000 to $149,999 | 24 | 35.8% |
| $150,000 to $199,999 | 0 | 0.0% |
| $200,000+ | 0 | 0.0% |
Family Income by Famaliy Size in Villanueva
3-person families (33 | 49.2%) account for the highest median family income in Villanueva with $127,574 per family, while 3-person families (33 | 49.2%) have the highest median income of $42,525 per family member.
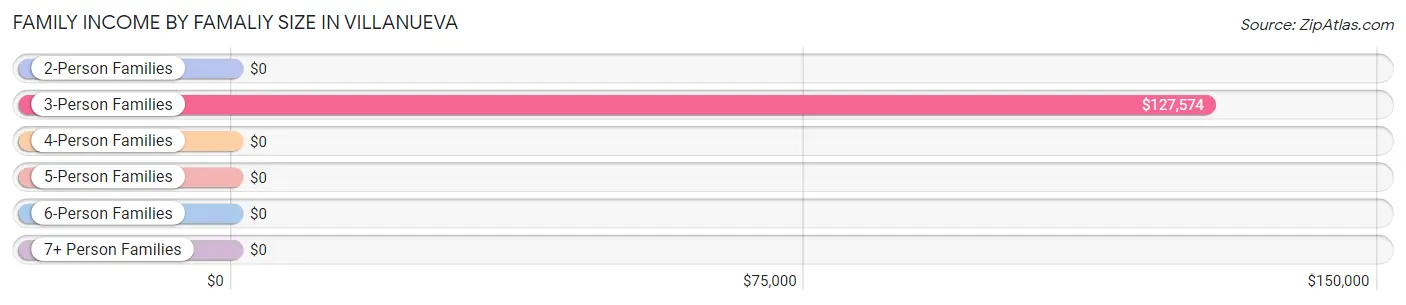
| Income Bracket | # Families | Median Income |
| 2-Person Families | 6 (9.0%) | $0 |
| 3-Person Families | 33 (49.2%) | $127,574 |
| 4-Person Families | 0 (0.0%) | $0 |
| 5-Person Families | 28 (41.8%) | $0 |
| 6-Person Families | 0 (0.0%) | $0 |
| 7+ Person Families | 0 (0.0%) | $0 |
| Total | 67 (100.0%) | $0 |
Family Income by Number of Earners in Villanueva
| Number of Earners | # Families | Median Income |
| No Earners | 6 (9.0%) | $0 |
| 1 Earner | 37 (55.2%) | $0 |
| 2 Earners | 7 (10.4%) | $0 |
| 3+ Earners | 17 (25.4%) | $0 |
| Total | 67 (100.0%) | $0 |
Household Income in Villanueva
Household Income Brackets in Villanueva
With 59 households falling in the category, the $15,000 to $24,999 income range is the most frequent in Villanueva, accounting for 34.5% of all households.
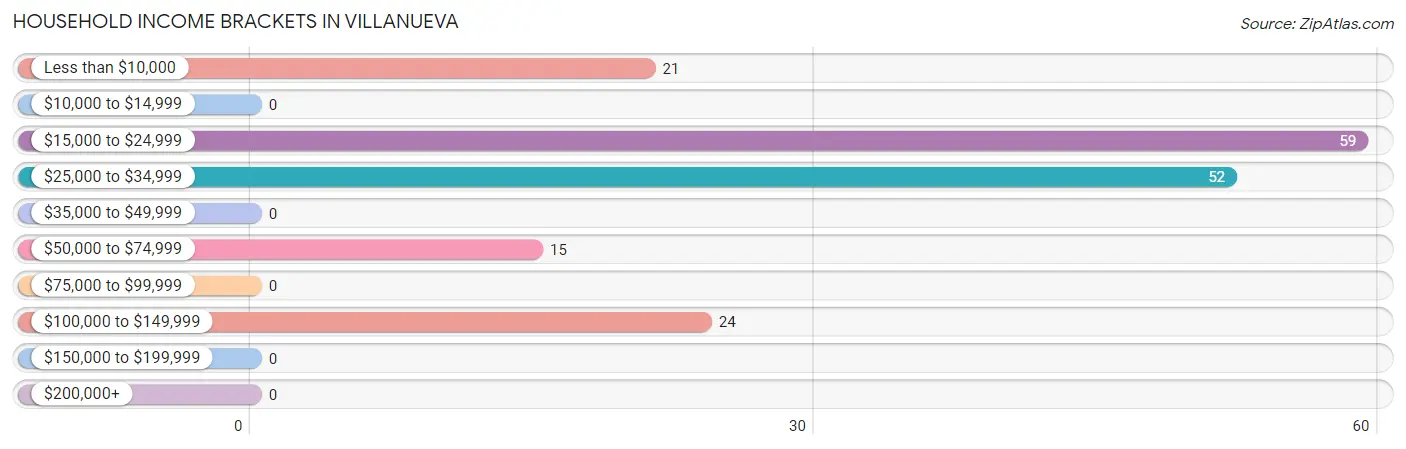
| Income Bracket | # Households | % Households |
| Less than $10,000 | 21 | 12.3% |
| $10,000 to $14,999 | 0 | 0.0% |
| $15,000 to $24,999 | 59 | 34.5% |
| $25,000 to $34,999 | 52 | 30.4% |
| $35,000 to $49,999 | 0 | 0.0% |
| $50,000 to $74,999 | 15 | 8.8% |
| $75,000 to $99,999 | 0 | 0.0% |
| $100,000 to $149,999 | 24 | 14.0% |
| $150,000 to $199,999 | 0 | 0.0% |
| $200,000+ | 0 | 0.0% |
Household Income by Householder Age in Villanueva
The median household income in Villanueva is $25,264, with the highest median household income of $25,096 found in the 65+ years age bracket for the primary householder. A total of 164 households (95.9%) fall into this category.
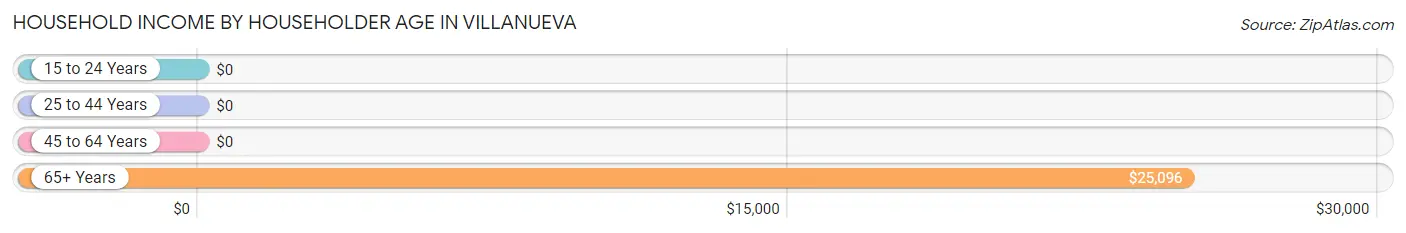
| Income Bracket | # Households | Median Income |
| 15 to 24 Years | 0 (0.0%) | $0 |
| 25 to 44 Years | 0 (0.0%) | $0 |
| 45 to 64 Years | 7 (4.1%) | $0 |
| 65+ Years | 164 (95.9%) | $25,096 |
| Total | 171 (100.0%) | $25,264 |
Poverty in Villanueva
Income Below Poverty by Sex and Age in Villanueva
With 47.7% poverty level for males and 53.4% for females among the residents of Villanueva, 5 year old males and 6 to 11 year old females are the most vulnerable to poverty, with 27 males (100.0%) and 33 females (100.0%) in their respective age groups living below the poverty level.
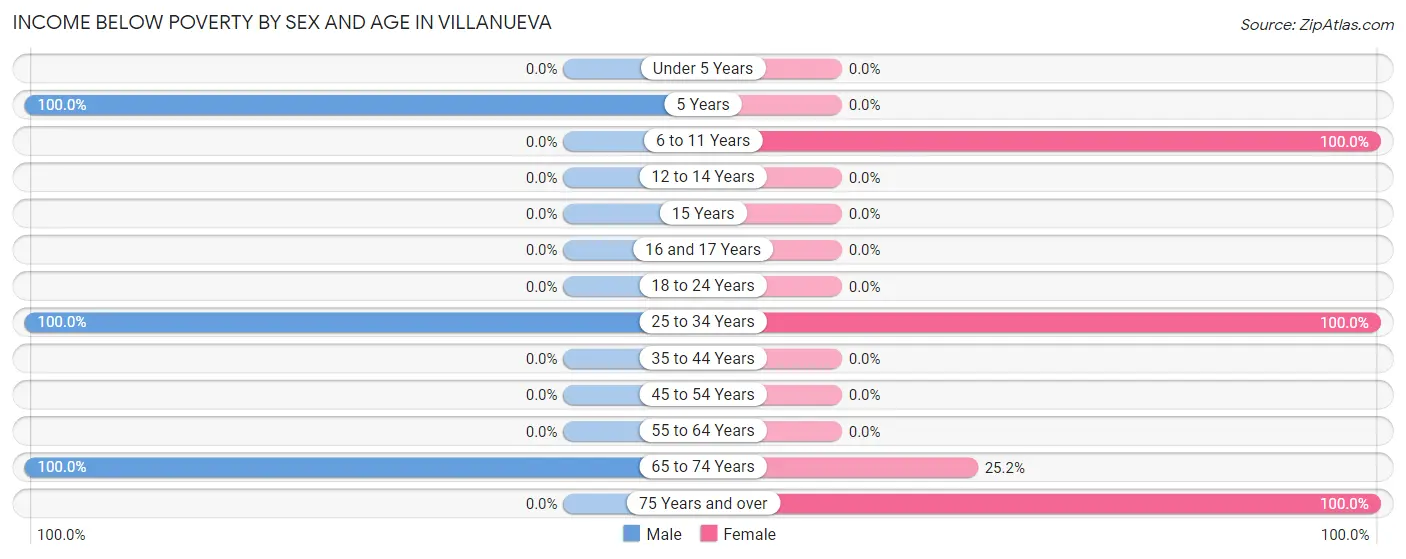
| Age Bracket | Male | Female |
| Under 5 Years | 0 (0.0%) | 0 (0.0%) |
| 5 Years | 27 (100.0%) | 0 (0.0%) |
| 6 to 11 Years | 0 (0.0%) | 33 (100.0%) |
| 12 to 14 Years | 0 (0.0%) | 0 (0.0%) |
| 15 Years | 0 (0.0%) | 0 (0.0%) |
| 16 and 17 Years | 0 (0.0%) | 0 (0.0%) |
| 18 to 24 Years | 0 (0.0%) | 0 (0.0%) |
| 25 to 34 Years | 40 (100.0%) | 43 (100.0%) |
| 35 to 44 Years | 0 (0.0%) | 0 (0.0%) |
| 45 to 54 Years | 0 (0.0%) | 0 (0.0%) |
| 55 to 64 Years | 0 (0.0%) | 0 (0.0%) |
| 65 to 74 Years | 28 (100.0%) | 28 (25.2%) |
| 75 Years and over | 0 (0.0%) | 21 (100.0%) |
| Total | 95 (47.7%) | 125 (53.4%) |
Income Above Poverty by Sex and Age in Villanueva
According to the poverty statistics in Villanueva, males aged 18 to 24 years and females aged 18 to 24 years are the age groups that are most secure financially, with 100.0% of males and 100.0% of females in these age groups living above the poverty line.
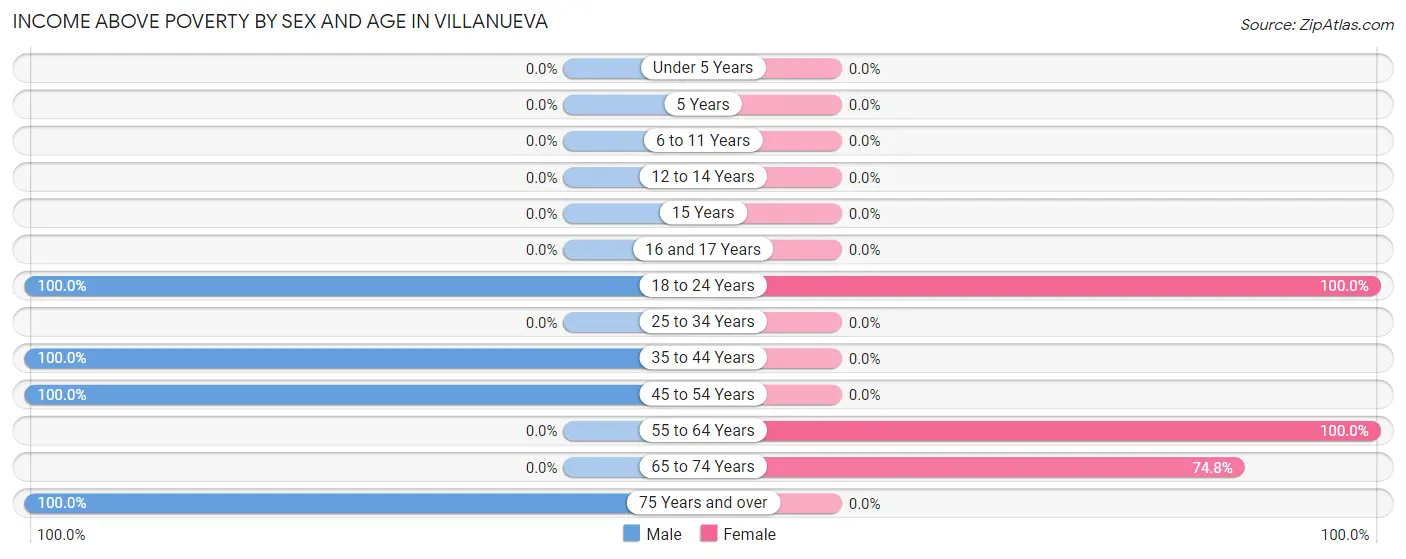
| Age Bracket | Male | Female |
| Under 5 Years | 0 (0.0%) | 0 (0.0%) |
| 5 Years | 0 (0.0%) | 0 (0.0%) |
| 6 to 11 Years | 0 (0.0%) | 0 (0.0%) |
| 12 to 14 Years | 0 (0.0%) | 0 (0.0%) |
| 15 Years | 0 (0.0%) | 0 (0.0%) |
| 16 and 17 Years | 0 (0.0%) | 0 (0.0%) |
| 18 to 24 Years | 25 (100.0%) | 20 (100.0%) |
| 25 to 34 Years | 0 (0.0%) | 0 (0.0%) |
| 35 to 44 Years | 26 (100.0%) | 0 (0.0%) |
| 45 to 54 Years | 7 (100.0%) | 0 (0.0%) |
| 55 to 64 Years | 0 (0.0%) | 6 (100.0%) |
| 65 to 74 Years | 0 (0.0%) | 83 (74.8%) |
| 75 Years and over | 46 (100.0%) | 0 (0.0%) |
| Total | 104 (52.3%) | 109 (46.6%) |
Income Below Poverty Among Married-Couple Families in Villanueva
The poverty statistics for married-couple families in Villanueva show that 56.0% or 28 of the total 50 families live below the poverty line. Families with 1 or 2 children have the highest poverty rate of 100.0%, comprising of 28 families. On the other hand, families with no children have the lowest poverty rate of 0.0%, which includes 0 families.
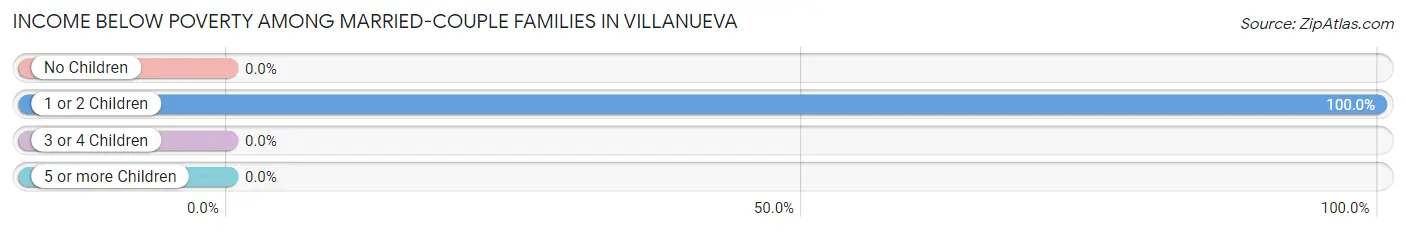
| Children | Above Poverty | Below Poverty |
| No Children | 22 (100.0%) | 0 (0.0%) |
| 1 or 2 Children | 0 (0.0%) | 28 (100.0%) |
| 3 or 4 Children | 0 (0.0%) | 0 (0.0%) |
| 5 or more Children | 0 (0.0%) | 0 (0.0%) |
| Total | 22 (44.0%) | 28 (56.0%) |
Income Below Poverty Among Single-Parent Households in Villanueva
| Children | Single Father | Single Mother |
| No Children | 0 (0.0%) | 0 (0.0%) |
| 1 or 2 Children | 0 (0.0%) | 0 (0.0%) |
| 3 or 4 Children | 0 (0.0%) | 0 (0.0%) |
| 5 or more Children | 0 (0.0%) | 0 (0.0%) |
| Total | 0 (0.0%) | 0 (0.0%) |
Income Below Poverty Among Married-Couple vs Single-Parent Households in Villanueva
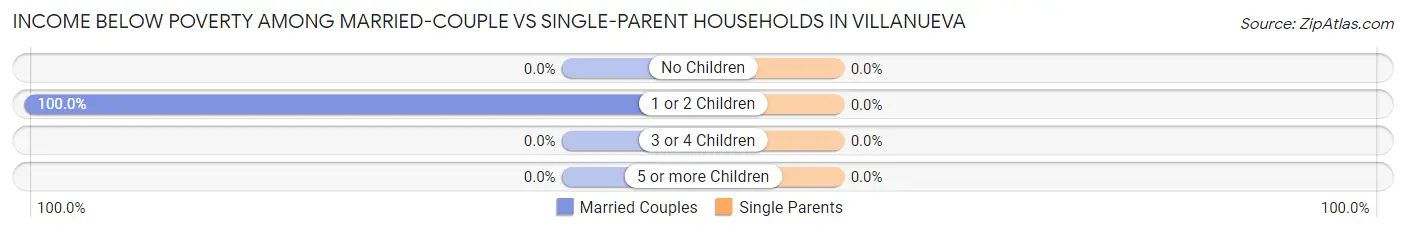
| Children | Married-Couple Families | Single-Parent Households |
| No Children | 0 (0.0%) | 0 (0.0%) |
| 1 or 2 Children | 28 (100.0%) | 0 (0.0%) |
| 3 or 4 Children | 0 (0.0%) | 0 (0.0%) |
| 5 or more Children | 0 (0.0%) | 0 (0.0%) |
| Total | 28 (56.0%) | 0 (0.0%) |
Race in Villanueva
The most populous races in Villanueva are Hispanic or Latino (381 | 88.0%), Some other Race (344 | 79.4%), and Native / Alaskan (52 | 12.0%).
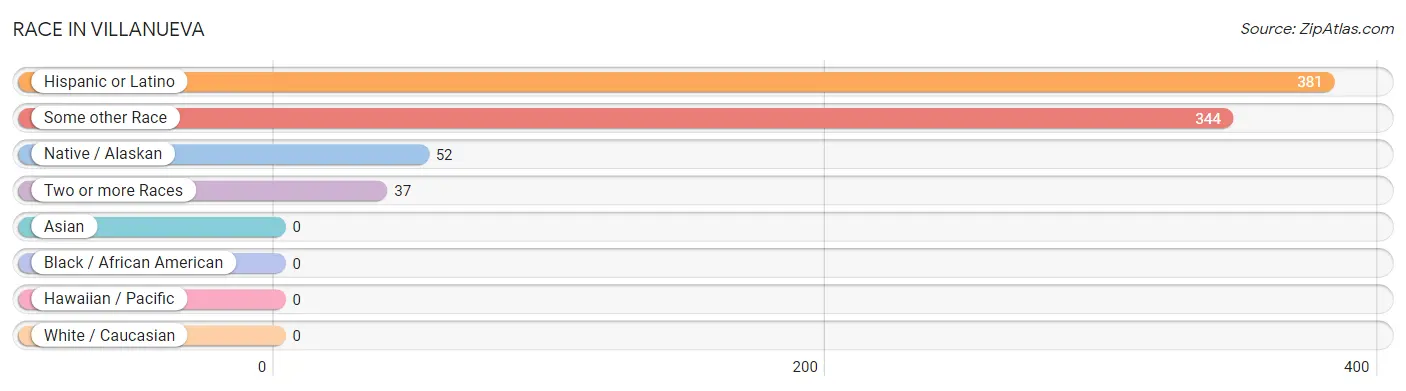
| Race | # Population | % Population |
| Asian | 0 | 0.0% |
| Black / African American | 0 | 0.0% |
| Hawaiian / Pacific | 0 | 0.0% |
| Hispanic or Latino | 381 | 88.0% |
| Native / Alaskan | 52 | 12.0% |
| White / Caucasian | 0 | 0.0% |
| Two or more Races | 37 | 8.6% |
| Some other Race | 344 | 79.4% |
| Total | 433 | 100.0% |
Ancestry in Villanueva
The most populous ancestries reported in Villanueva are Spanish (89 | 20.5%), Spaniard (63 | 14.5%), Navajo (52 | 12.0%), and Mexican (11 | 2.5%), together accounting for 49.6% of all Villanueva residents.
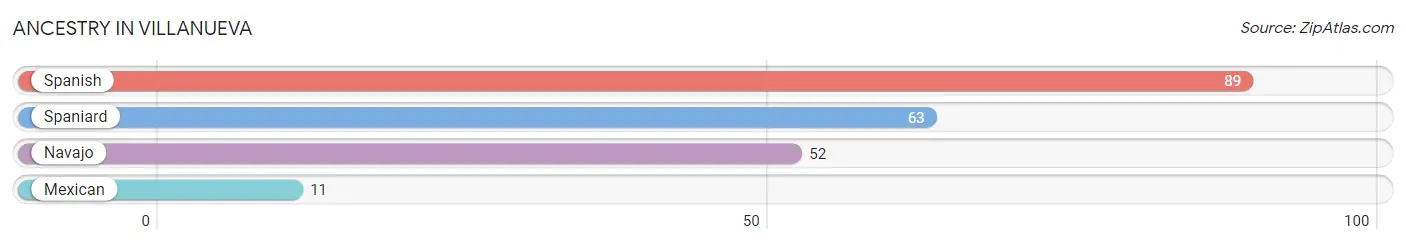
| Ancestry | # Population | % Population |
| Mexican | 11 | 2.5% |
| Navajo | 52 | 12.0% |
| Spaniard | 63 | 14.5% |
| Spanish | 89 | 20.5% | View All 4 Rows |
Immigrants in Villanueva

| Immigration Origin | # Population | % Population | View All 0 Rows |
Sex and Age in Villanueva
Sex and Age in Villanueva
The most populous age groups in Villanueva are 30 to 34 Years (40 | 20.1%) for men and 65 to 69 Years (97 | 41.4%) for women.
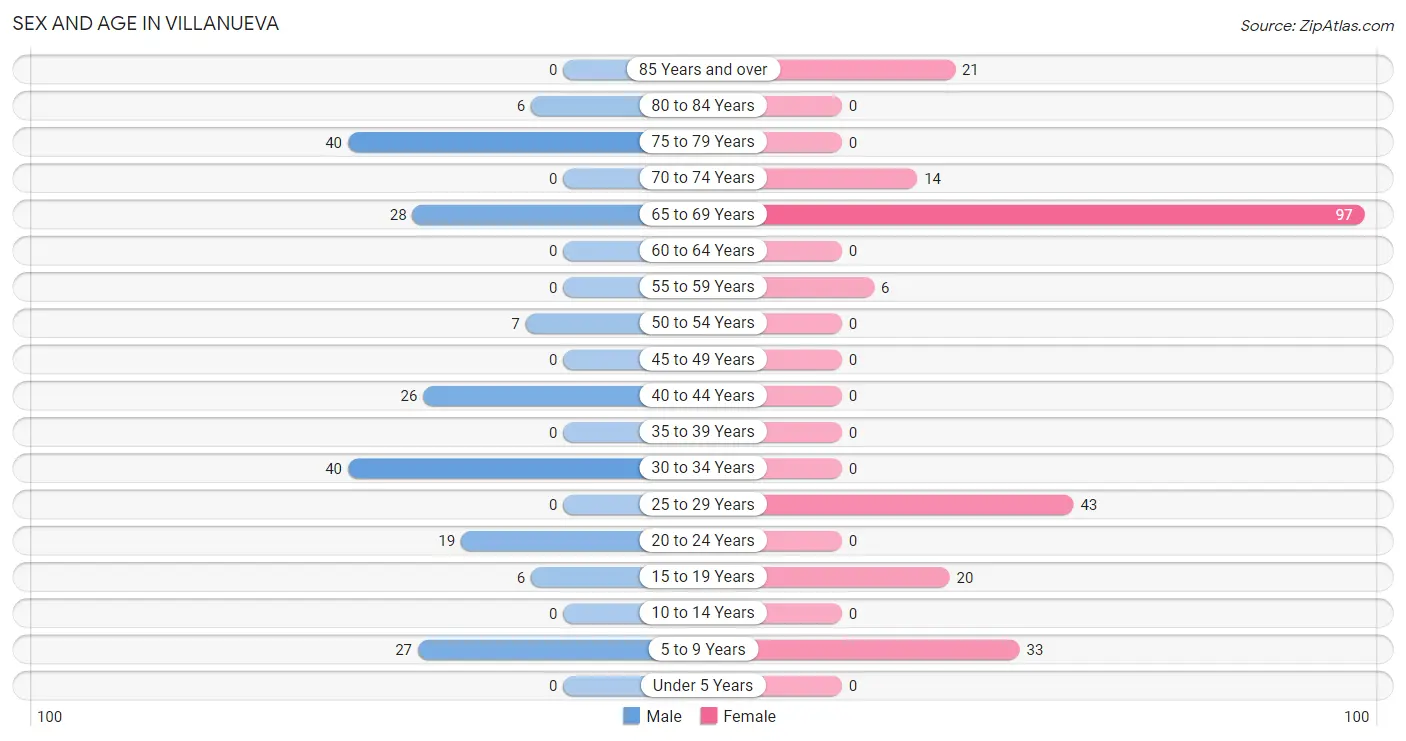
| Age Bracket | Male | Female |
| Under 5 Years | 0 (0.0%) | 0 (0.0%) |
| 5 to 9 Years | 27 (13.6%) | 33 (14.1%) |
| 10 to 14 Years | 0 (0.0%) | 0 (0.0%) |
| 15 to 19 Years | 6 (3.0%) | 20 (8.6%) |
| 20 to 24 Years | 19 (9.6%) | 0 (0.0%) |
| 25 to 29 Years | 0 (0.0%) | 43 (18.4%) |
| 30 to 34 Years | 40 (20.1%) | 0 (0.0%) |
| 35 to 39 Years | 0 (0.0%) | 0 (0.0%) |
| 40 to 44 Years | 26 (13.1%) | 0 (0.0%) |
| 45 to 49 Years | 0 (0.0%) | 0 (0.0%) |
| 50 to 54 Years | 7 (3.5%) | 0 (0.0%) |
| 55 to 59 Years | 0 (0.0%) | 6 (2.6%) |
| 60 to 64 Years | 0 (0.0%) | 0 (0.0%) |
| 65 to 69 Years | 28 (14.1%) | 97 (41.4%) |
| 70 to 74 Years | 0 (0.0%) | 14 (6.0%) |
| 75 to 79 Years | 40 (20.1%) | 0 (0.0%) |
| 80 to 84 Years | 6 (3.0%) | 0 (0.0%) |
| 85 Years and over | 0 (0.0%) | 21 (9.0%) |
| Total | 199 (100.0%) | 234 (100.0%) |
Families and Households in Villanueva
Median Family Size in Villanueva
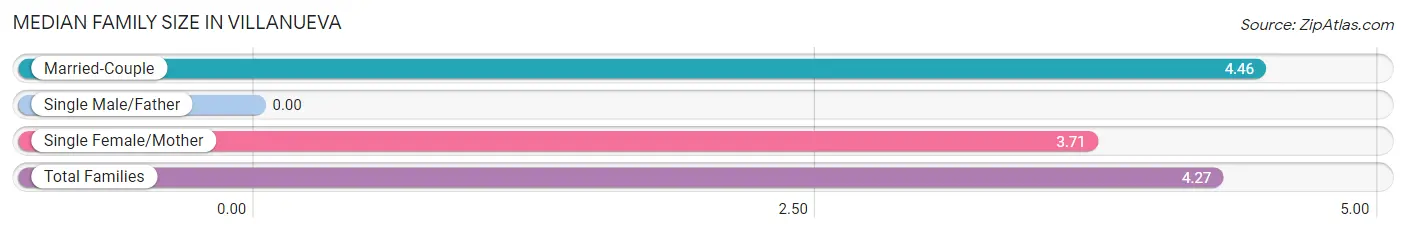
| Family Type | # Families | Family Size |
| Married-Couple | 50 (74.6%) | 4.46 |
| Single Male/Father | 0 (0.0%) | - |
| Single Female/Mother | 17 (25.4%) | 3.71 |
| Total Families | 67 (100.0%) | 4.27 |
Median Household Size in Villanueva
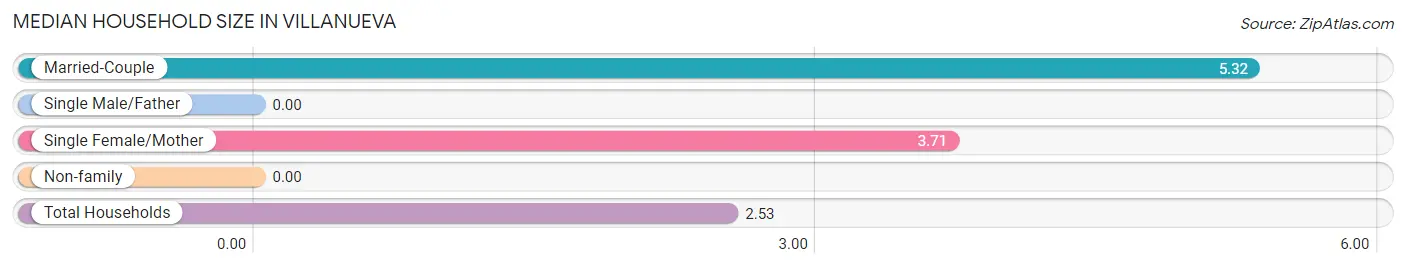
| Household Type | # Households | Household Size |
| Married-Couple | 50 (29.2%) | 5.32 |
| Single Male/Father | 0 (0.0%) | - |
| Single Female/Mother | 17 (9.9%) | 3.71 |
| Non-family | 104 (60.8%) | - |
| Total Households | 171 (100.0%) | 2.53 |
Household Size by Marriage Status in Villanueva
Out of a total of 171 households in Villanueva, 67 (39.2%) are family households, while 104 (60.8%) are nonfamily households. The most numerous type of family households are 3-person households, comprising 33, and the most common type of nonfamily households are 1-person households, comprising 104.
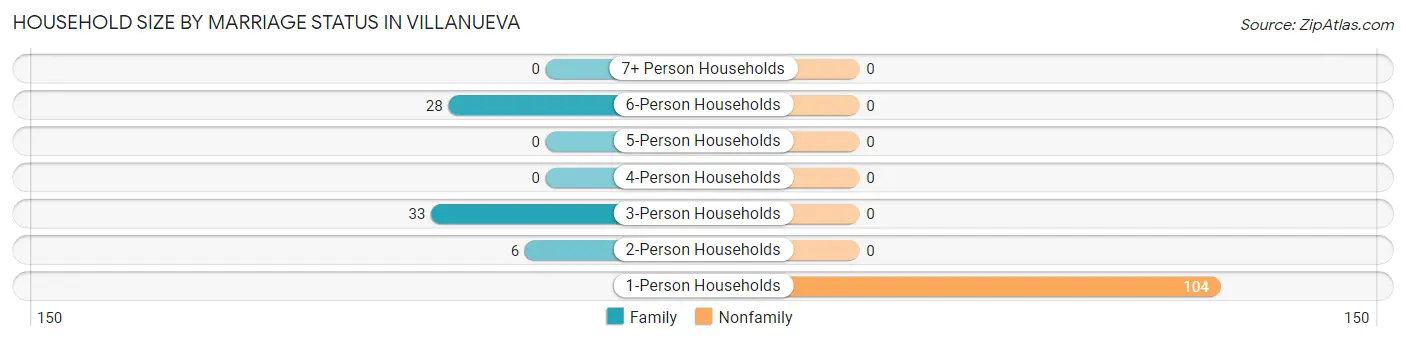
| Household Size | Family Households | Nonfamily Households |
| 1-Person Households | - | 104 (60.8%) |
| 2-Person Households | 6 (3.5%) | 0 (0.0%) |
| 3-Person Households | 33 (19.3%) | 0 (0.0%) |
| 4-Person Households | 0 (0.0%) | 0 (0.0%) |
| 5-Person Households | 0 (0.0%) | 0 (0.0%) |
| 6-Person Households | 28 (16.4%) | 0 (0.0%) |
| 7+ Person Households | 0 (0.0%) | 0 (0.0%) |
| Total | 67 (39.2%) | 104 (60.8%) |
Female Fertility in Villanueva
Fertility by Age in Villanueva
| Age Bracket | Women with Births | Births / 1,000 Women |
| 15 to 19 years | 0 (0.0%) | 0.0 |
| 20 to 34 years | 0 (0.0%) | 0.0 |
| 35 to 50 years | 0 (0.0%) | 0.0 |
| Total | 0 (0.0%) | 0.0 |
Fertility by Age by Marriage Status in Villanueva
| Age Bracket | Married | Unmarried |
| 15 to 19 years | 0 (0.0%) | 0 (0.0%) |
| 20 to 34 years | 0 (0.0%) | 0 (0.0%) |
| 35 to 50 years | 0 (0.0%) | 0 (0.0%) |
| Total | 0 (0.0%) | 0 (0.0%) |
Fertility by Education in Villanueva
| Educational Attainment | Women with Births | Births / 1,000 Women |
| Less than High School | 0 (0.0%) | 0.0 |
| High School Diploma | 0 (0.0%) | 0.0 |
| College or Associate's Degree | 0 (0.0%) | 0.0 |
| Bachelor's Degree | 0 (0.0%) | 0.0 |
| Graduate Degree | 0 (0.0%) | 0.0 |
| Total | 0 (0.0%) | 0.0 |
Fertility by Education by Marriage Status in Villanueva
| Educational Attainment | Married | Unmarried |
| Less than High School | 0 (0.0%) | 0 (0.0%) |
| High School Diploma | 0 (0.0%) | 0 (0.0%) |
| College or Associate's Degree | 0 (0.0%) | 0 (0.0%) |
| Bachelor's Degree | 0 (0.0%) | 0 (0.0%) |
| Graduate Degree | 0 (0.0%) | 0 (0.0%) |
| Total | 0 (0.0%) | 0 (0.0%) |
Employment Characteristics in Villanueva
Employment by Class of Employer in Villanueva
Among the 175 employed individuals in Villanueva, private company employees (107 | 61.1%), self-employed (not incorporated) (26 | 14.9%), and state government employees (25 | 14.3%) make up the most common classes of employment.
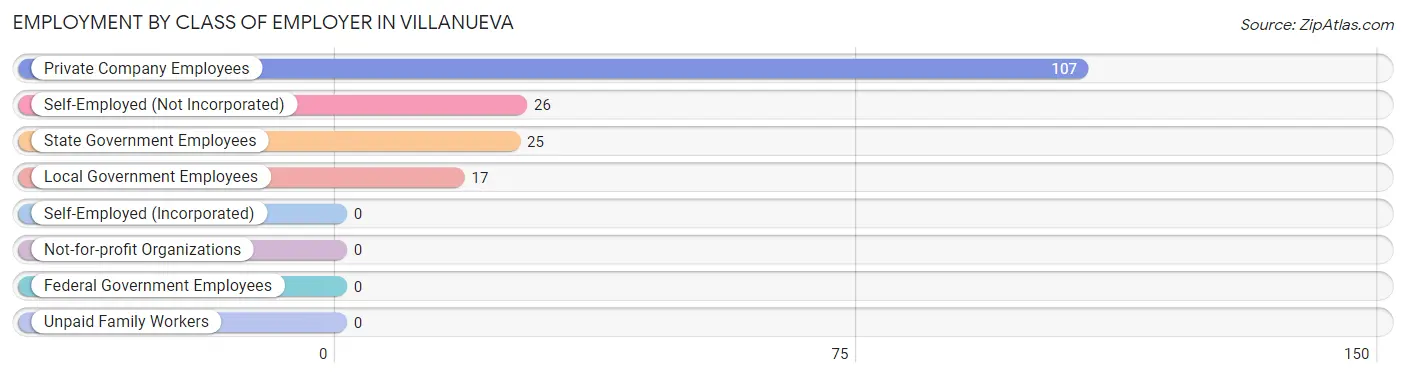
| Employer Class | # Employees | % Employees |
| Private Company Employees | 107 | 61.1% |
| Self-Employed (Incorporated) | 0 | 0.0% |
| Self-Employed (Not Incorporated) | 26 | 14.9% |
| Not-for-profit Organizations | 0 | 0.0% |
| Local Government Employees | 17 | 9.7% |
| State Government Employees | 25 | 14.3% |
| Federal Government Employees | 0 | 0.0% |
| Unpaid Family Workers | 0 | 0.0% |
| Total | 175 | 100.0% |
Employment Status by Age in Villanueva
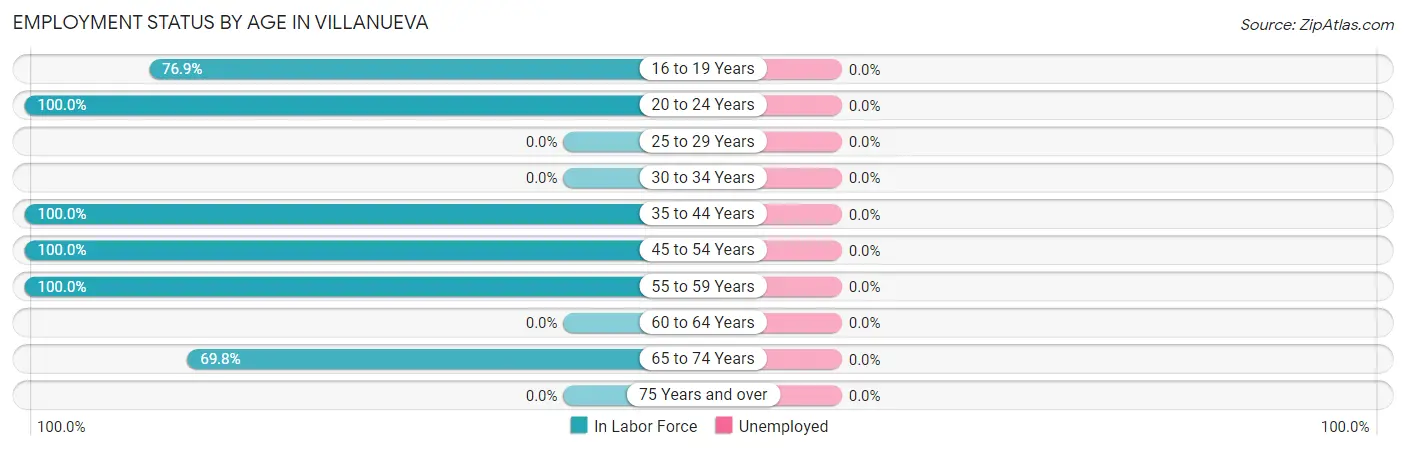
| Age Bracket | In Labor Force | Unemployed |
| 16 to 19 Years | 20 (76.9%) | 0 (0.0%) |
| 20 to 24 Years | 19 (100.0%) | 0 (0.0%) |
| 25 to 29 Years | 0 (0.0%) | 0 (0.0%) |
| 30 to 34 Years | 0 (0.0%) | 0 (0.0%) |
| 35 to 44 Years | 26 (100.0%) | 0 (0.0%) |
| 45 to 54 Years | 7 (100.0%) | 0 (0.0%) |
| 55 to 59 Years | 6 (100.0%) | 0 (0.0%) |
| 60 to 64 Years | 0 (0.0%) | 0 (0.0%) |
| 65 to 74 Years | 97 (69.8%) | 0 (0.0%) |
| 75 Years and over | 0 (0.0%) | 0 (0.0%) |
| Total | 175 (46.9%) | 0 (0.0%) |
Employment Status by Educational Attainment in Villanueva
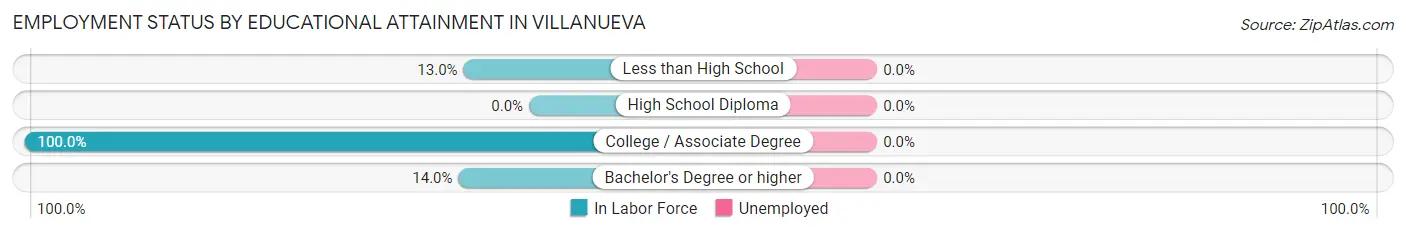
| Educational Attainment | In Labor Force | Unemployed |
| Less than High School | 6 (13.0%) | 0 (0.0%) |
| High School Diploma | 0 (0.0%) | 0 (0.0%) |
| College / Associate Degree | 26 (100.0%) | 0 (0.0%) |
| Bachelor's Degree or higher | 7 (14.0%) | 0 (0.0%) |
| Total | 39 (32.0%) | 0 (0.0%) |
Employment Occupations by Sex in Villanueva
Management, Business, Science and Arts Occupations
The most common Management, Business, Science and Arts occupations in Villanueva are Management (17 | 9.7%), Business & Financial (7 | 4.0%), Computers, Engineering & Science (6 | 3.4%), and Life, Physical & Social Science (6 | 3.4%).
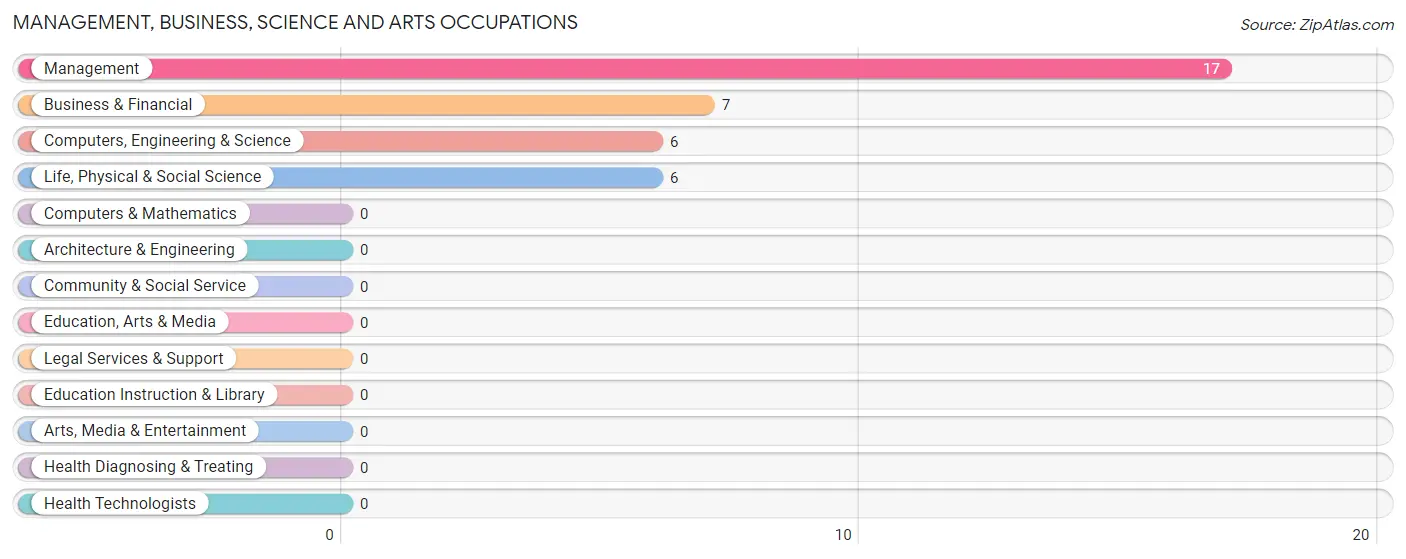
Management, Business, Science and Arts Occupations by Sex
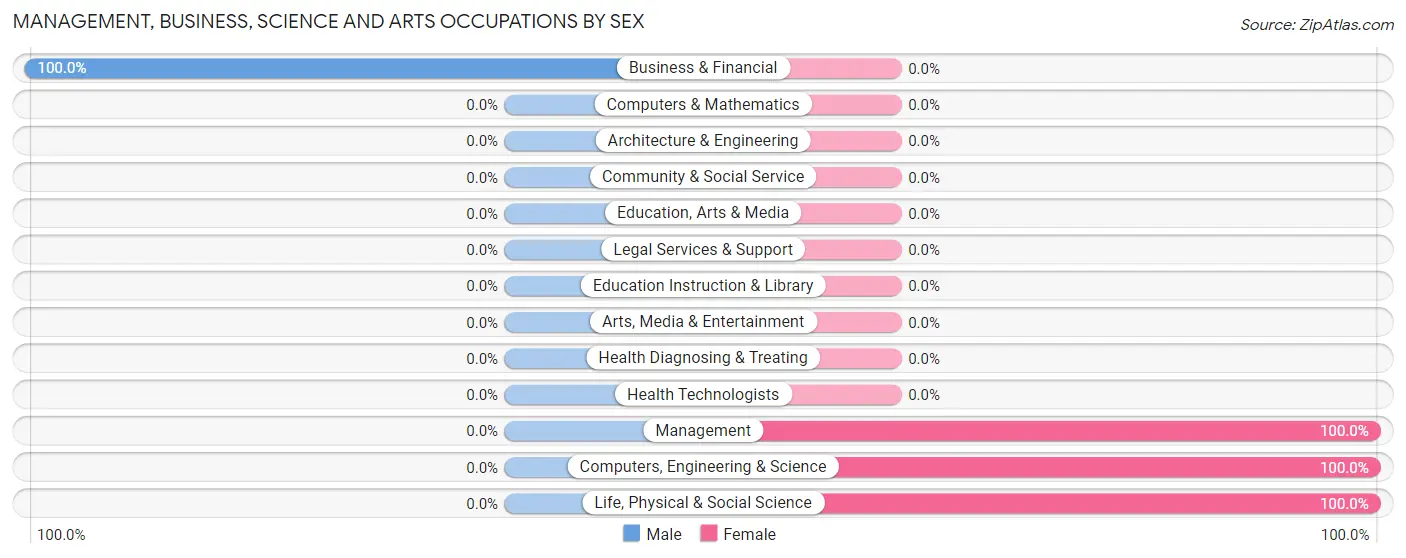
| Occupation | Male | Female |
| Management | 0 (0.0%) | 17 (100.0%) |
| Business & Financial | 7 (100.0%) | 0 (0.0%) |
| Computers, Engineering & Science | 0 (0.0%) | 6 (100.0%) |
| Computers & Mathematics | 0 (0.0%) | 0 (0.0%) |
| Architecture & Engineering | 0 (0.0%) | 0 (0.0%) |
| Life, Physical & Social Science | 0 (0.0%) | 6 (100.0%) |
| Community & Social Service | 0 (0.0%) | 0 (0.0%) |
| Education, Arts & Media | 0 (0.0%) | 0 (0.0%) |
| Legal Services & Support | 0 (0.0%) | 0 (0.0%) |
| Education Instruction & Library | 0 (0.0%) | 0 (0.0%) |
| Arts, Media & Entertainment | 0 (0.0%) | 0 (0.0%) |
| Health Diagnosing & Treating | 0 (0.0%) | 0 (0.0%) |
| Health Technologists | 0 (0.0%) | 0 (0.0%) |
| Total (Category) | 7 (23.3%) | 23 (76.7%) |
| Total (Overall) | 52 (29.7%) | 123 (70.3%) |
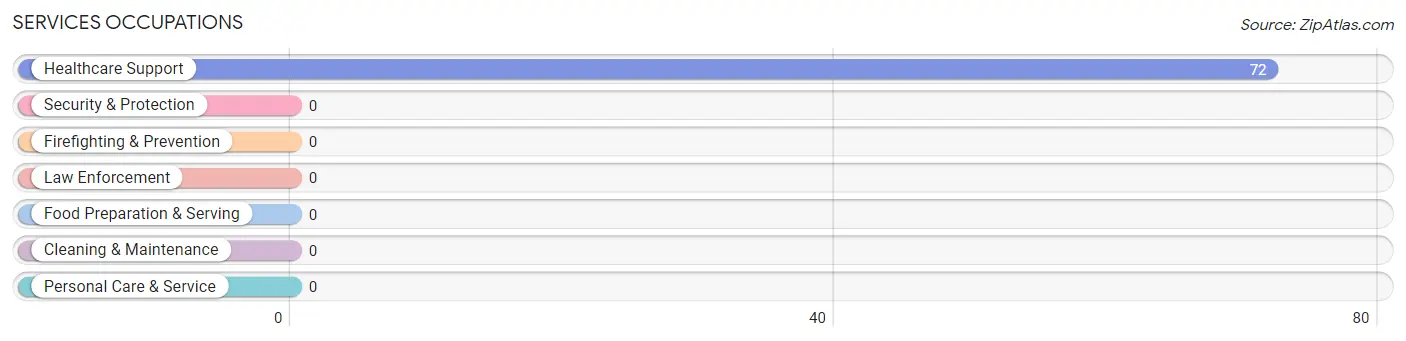
Services Occupations
The most common Services occupations in Villanueva are , and Healthcare Support (72 | 41.1%).
Services Occupations by Sex
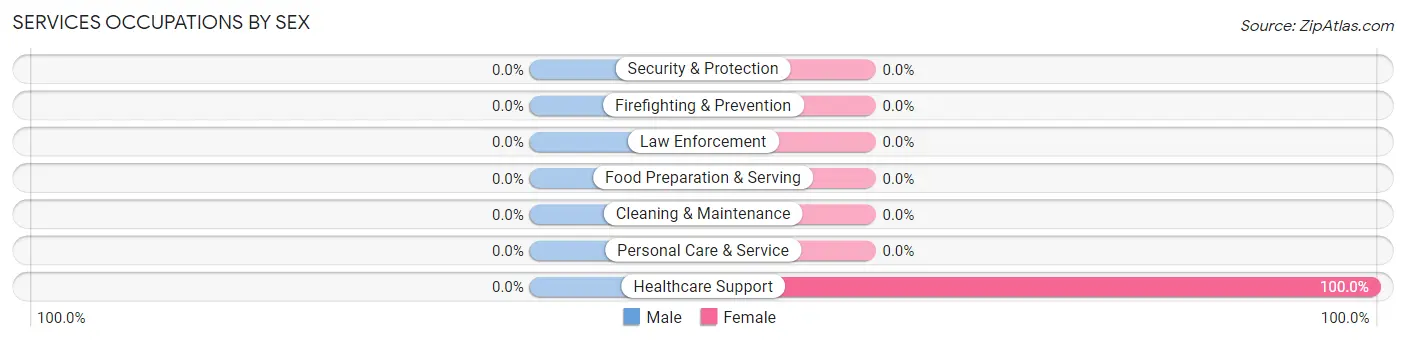
| Occupation | Male | Female |
| Healthcare Support | 0 (0.0%) | 72 (100.0%) |
| Security & Protection | 0 (0.0%) | 0 (0.0%) |
| Firefighting & Prevention | 0 (0.0%) | 0 (0.0%) |
| Law Enforcement | 0 (0.0%) | 0 (0.0%) |
| Food Preparation & Serving | 0 (0.0%) | 0 (0.0%) |
| Cleaning & Maintenance | 0 (0.0%) | 0 (0.0%) |
| Personal Care & Service | 0 (0.0%) | 0 (0.0%) |
| Total (Category) | 0 (0.0%) | 72 (100.0%) |
| Total (Overall) | 52 (29.7%) | 123 (70.3%) |
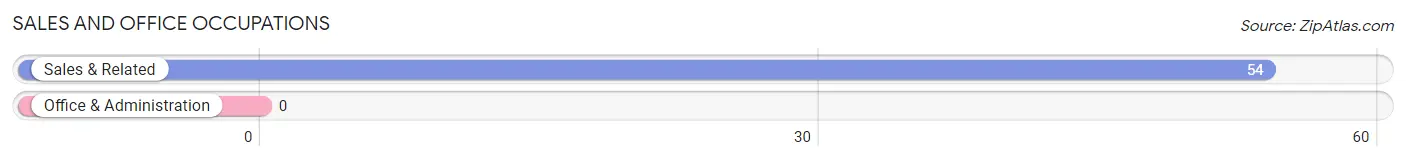
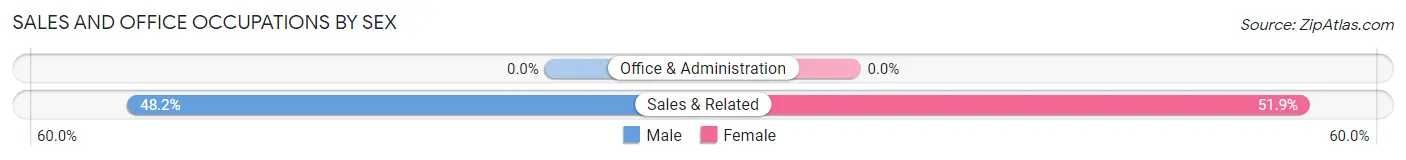
Sales and Office Occupations
The most common Sales and Office occupations in Villanueva are , and Sales & Related (54 | 30.9%).
Sales and Office Occupations by Sex
| Occupation | Male | Female |
| Sales & Related | 26 (48.1%) | 28 (51.8%) |
| Office & Administration | 0 (0.0%) | 0 (0.0%) |
| Total (Category) | 26 (48.1%) | 28 (51.8%) |
| Total (Overall) | 52 (29.7%) | 123 (70.3%) |
Natural Resources, Construction and Maintenance Occupations
The most common Natural Resources, Construction and Maintenance occupations in Villanueva are , and Construction & Extraction (19 | 10.9%).
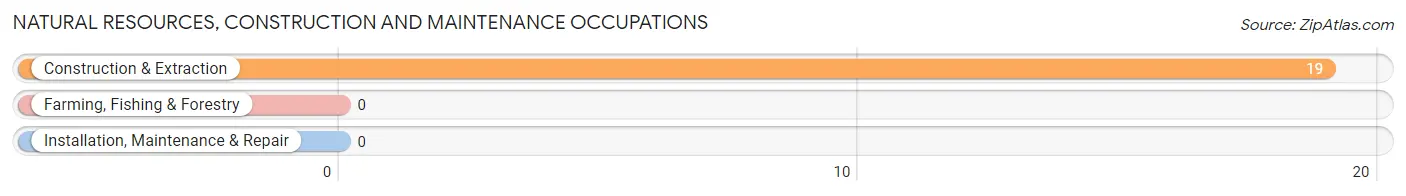
Natural Resources, Construction and Maintenance Occupations by Sex
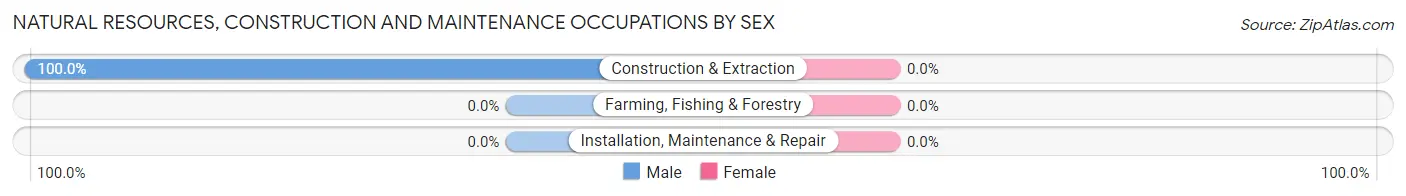
| Occupation | Male | Female |
| Farming, Fishing & Forestry | 0 (0.0%) | 0 (0.0%) |
| Construction & Extraction | 19 (100.0%) | 0 (0.0%) |
| Installation, Maintenance & Repair | 0 (0.0%) | 0 (0.0%) |
| Total (Category) | 19 (100.0%) | 0 (0.0%) |
| Total (Overall) | 52 (29.7%) | 123 (70.3%) |
Production, Transportation and Moving Occupations
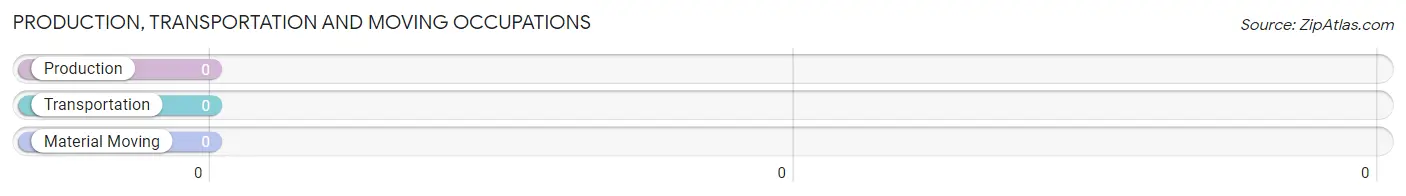
Production, Transportation and Moving Occupations by Sex
| Occupation | Male | Female |
| Production | 0 (0.0%) | 0 (0.0%) |
| Transportation | 0 (0.0%) | 0 (0.0%) |
| Material Moving | 0 (0.0%) | 0 (0.0%) |
| Total (Category) | 0 (0.0%) | 0 (0.0%) |
| Total (Overall) | 52 (29.7%) | 123 (70.3%) |
Employment Industries by Sex in Villanueva
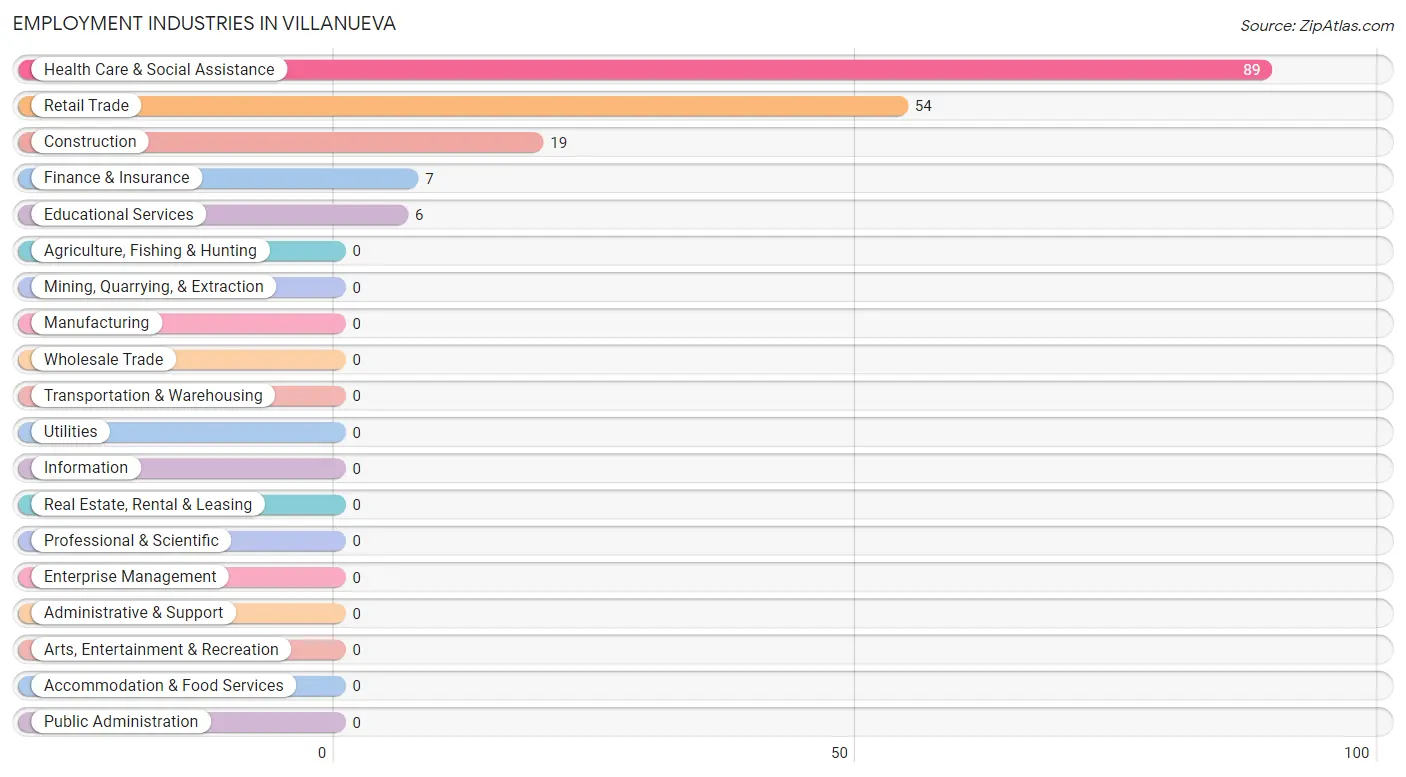
Employment Industries in Villanueva
The major employment industries in Villanueva include Health Care & Social Assistance (89 | 50.9%), Retail Trade (54 | 30.9%), Construction (19 | 10.9%), Finance & Insurance (7 | 4.0%), and Educational Services (6 | 3.4%).
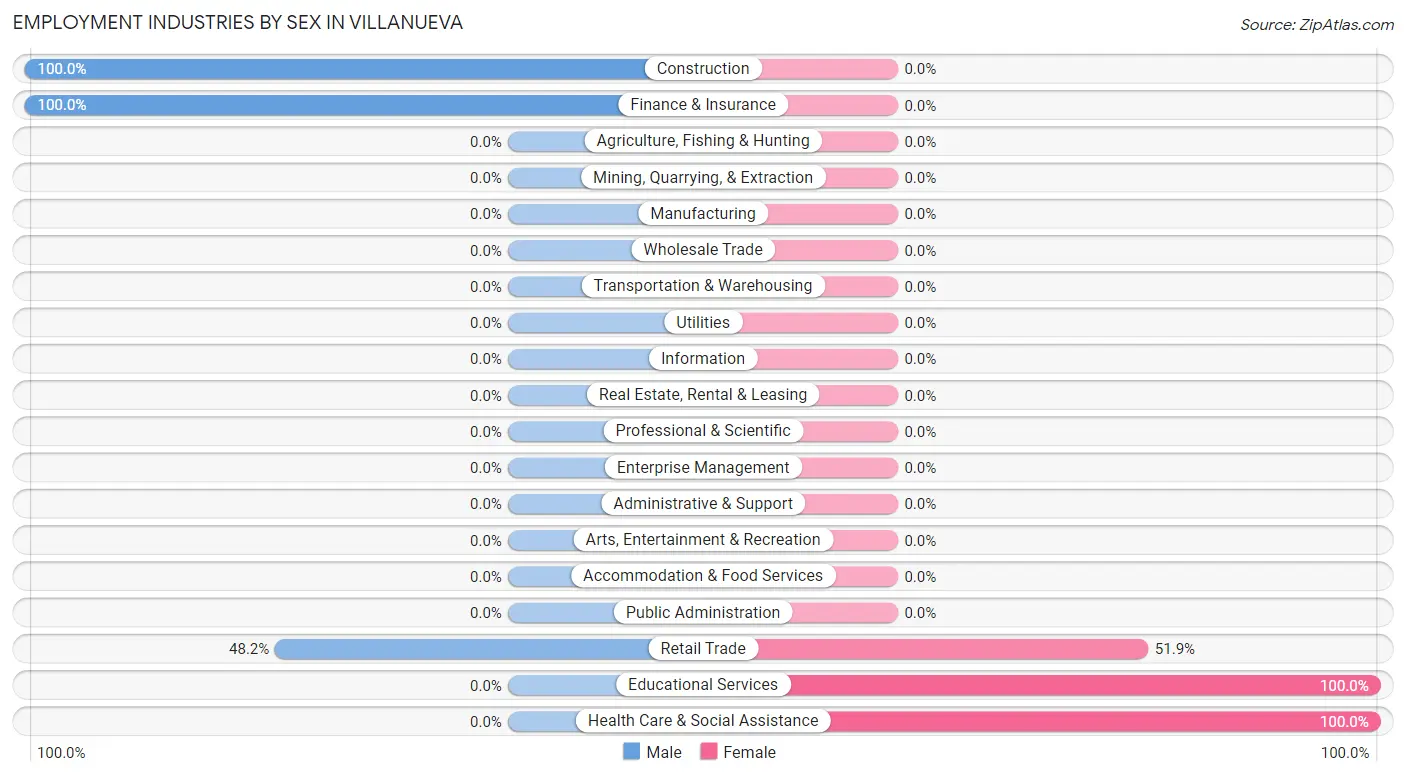
Employment Industries by Sex in Villanueva
The Villanueva industries that see more men than women are Construction (100.0%), Finance & Insurance (100.0%), and Retail Trade (48.1%), whereas the industries that tend to have a higher number of women are Educational Services (100.0%), Health Care & Social Assistance (100.0%), and Retail Trade (51.8%).
| Industry | Male | Female |
| Agriculture, Fishing & Hunting | 0 (0.0%) | 0 (0.0%) |
| Mining, Quarrying, & Extraction | 0 (0.0%) | 0 (0.0%) |
| Construction | 19 (100.0%) | 0 (0.0%) |
| Manufacturing | 0 (0.0%) | 0 (0.0%) |
| Wholesale Trade | 0 (0.0%) | 0 (0.0%) |
| Retail Trade | 26 (48.1%) | 28 (51.8%) |
| Transportation & Warehousing | 0 (0.0%) | 0 (0.0%) |
| Utilities | 0 (0.0%) | 0 (0.0%) |
| Information | 0 (0.0%) | 0 (0.0%) |
| Finance & Insurance | 7 (100.0%) | 0 (0.0%) |
| Real Estate, Rental & Leasing | 0 (0.0%) | 0 (0.0%) |
| Professional & Scientific | 0 (0.0%) | 0 (0.0%) |
| Enterprise Management | 0 (0.0%) | 0 (0.0%) |
| Administrative & Support | 0 (0.0%) | 0 (0.0%) |
| Educational Services | 0 (0.0%) | 6 (100.0%) |
| Health Care & Social Assistance | 0 (0.0%) | 89 (100.0%) |
| Arts, Entertainment & Recreation | 0 (0.0%) | 0 (0.0%) |
| Accommodation & Food Services | 0 (0.0%) | 0 (0.0%) |
| Public Administration | 0 (0.0%) | 0 (0.0%) |
| Total | 52 (29.7%) | 123 (70.3%) |
Education in Villanueva
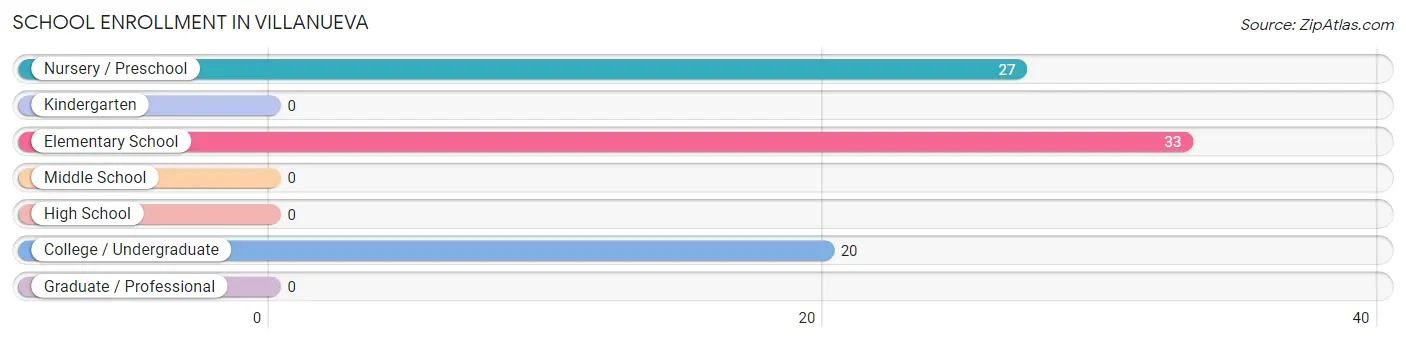
School Enrollment in Villanueva
The most common levels of schooling among the 80 students in Villanueva are elementary school (33 | 41.2%), nursery / preschool (27 | 33.8%), and college / undergraduate (20 | 25.0%).
| School Level | # Students | % Students |
| Nursery / Preschool | 27 | 33.8% |
| Kindergarten | 0 | 0.0% |
| Elementary School | 33 | 41.2% |
| Middle School | 0 | 0.0% |
| High School | 0 | 0.0% |
| College / Undergraduate | 20 | 25.0% |
| Graduate / Professional | 0 | 0.0% |
| Total | 80 | 100.0% |
School Enrollment by Age by Funding Source in Villanueva
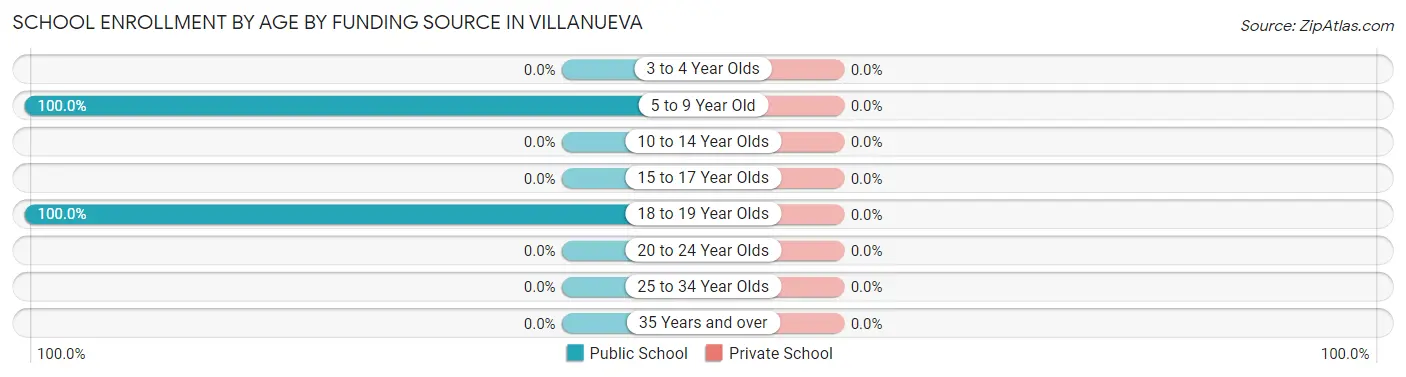
| Age Bracket | Public School | Private School |
| 3 to 4 Year Olds | 0 (0.0%) | 0 (0.0%) |
| 5 to 9 Year Old | 60 (100.0%) | 0 (0.0%) |
| 10 to 14 Year Olds | 0 (0.0%) | 0 (0.0%) |
| 15 to 17 Year Olds | 0 (0.0%) | 0 (0.0%) |
| 18 to 19 Year Olds | 20 (100.0%) | 0 (0.0%) |
| 20 to 24 Year Olds | 0 (0.0%) | 0 (0.0%) |
| 25 to 34 Year Olds | 0 (0.0%) | 0 (0.0%) |
| 35 Years and over | 0 (0.0%) | 0 (0.0%) |
| Total | 80 (100.0%) | 0 (0.0%) |
Educational Attainment by Field of Study in Villanueva
Engineering (43 | 36.4%), social sciences (31 | 26.3%), multidisciplinary studies (31 | 26.3%), business (7 | 5.9%), and education (6 | 5.1%) are the most common fields of study among 118 individuals in Villanueva who have obtained a bachelor's degree or higher.
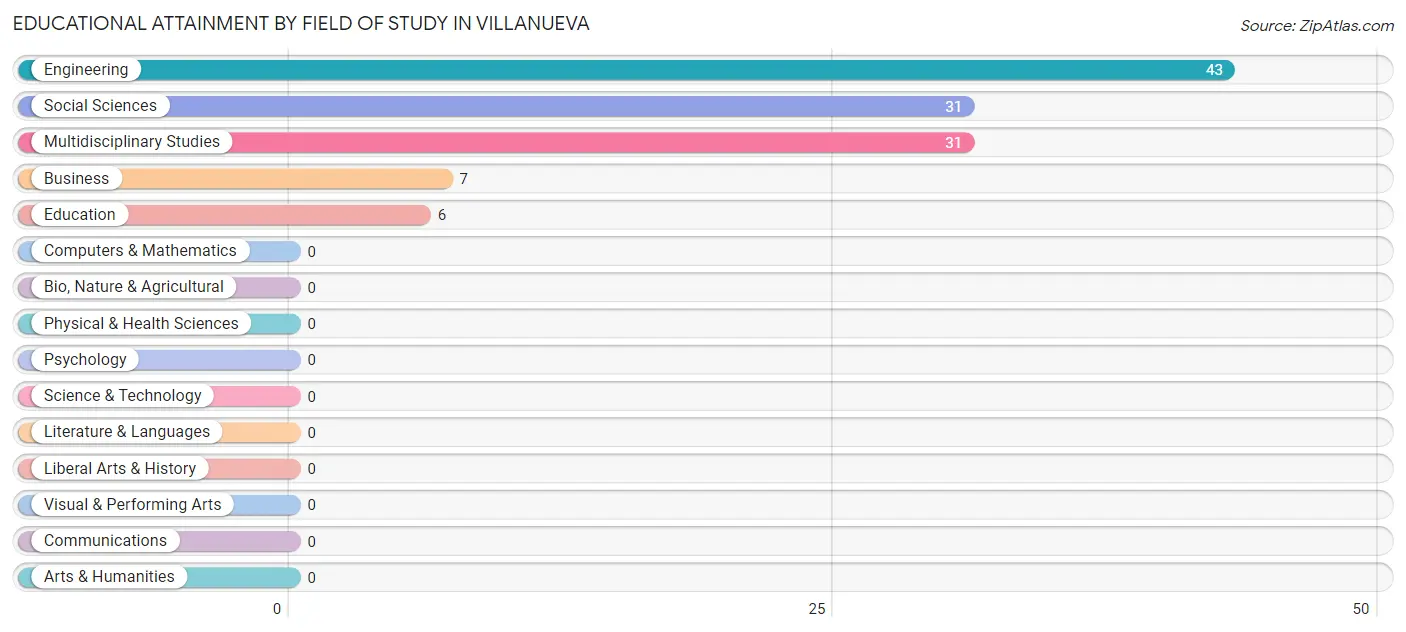
| Field of Study | # Graduates | % Graduates |
| Computers & Mathematics | 0 | 0.0% |
| Bio, Nature & Agricultural | 0 | 0.0% |
| Physical & Health Sciences | 0 | 0.0% |
| Psychology | 0 | 0.0% |
| Social Sciences | 31 | 26.3% |
| Engineering | 43 | 36.4% |
| Multidisciplinary Studies | 31 | 26.3% |
| Science & Technology | 0 | 0.0% |
| Business | 7 | 5.9% |
| Education | 6 | 5.1% |
| Literature & Languages | 0 | 0.0% |
| Liberal Arts & History | 0 | 0.0% |
| Visual & Performing Arts | 0 | 0.0% |
| Communications | 0 | 0.0% |
| Arts & Humanities | 0 | 0.0% |
| Total | 118 | 100.0% |
Transportation & Commute in Villanueva
Vehicle Availability by Sex in Villanueva
The most prevalent vehicle ownership categories in Villanueva are males with 3 vehicles (26, accounting for 50.0%) and females with 3 vehicles (37, making up 21.1%).
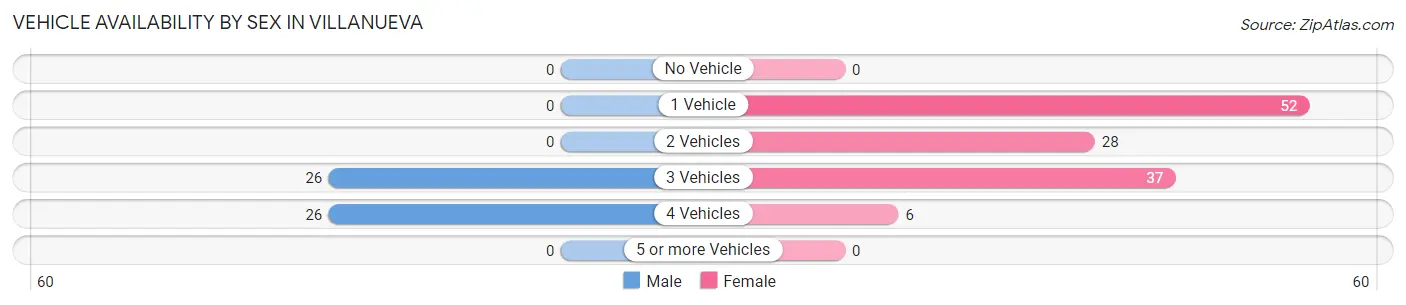
| Vehicles Available | Male | Female |
| No Vehicle | 0 (0.0%) | 0 (0.0%) |
| 1 Vehicle | 0 (0.0%) | 52 (42.3%) |
| 2 Vehicles | 0 (0.0%) | 28 (22.8%) |
| 3 Vehicles | 26 (50.0%) | 37 (30.1%) |
| 4 Vehicles | 26 (50.0%) | 6 (4.9%) |
| 5 or more Vehicles | 0 (0.0%) | 0 (0.0%) |
| Total | 52 (100.0%) | 123 (100.0%) |
Commute Time in Villanueva
The most frequently occuring commute durations in Villanueva are 60 to 89 minutes (37 commuters, 38.1%), less than 5 minutes (28 commuters, 28.9%), and 30 to 34 minutes (26 commuters, 26.8%).
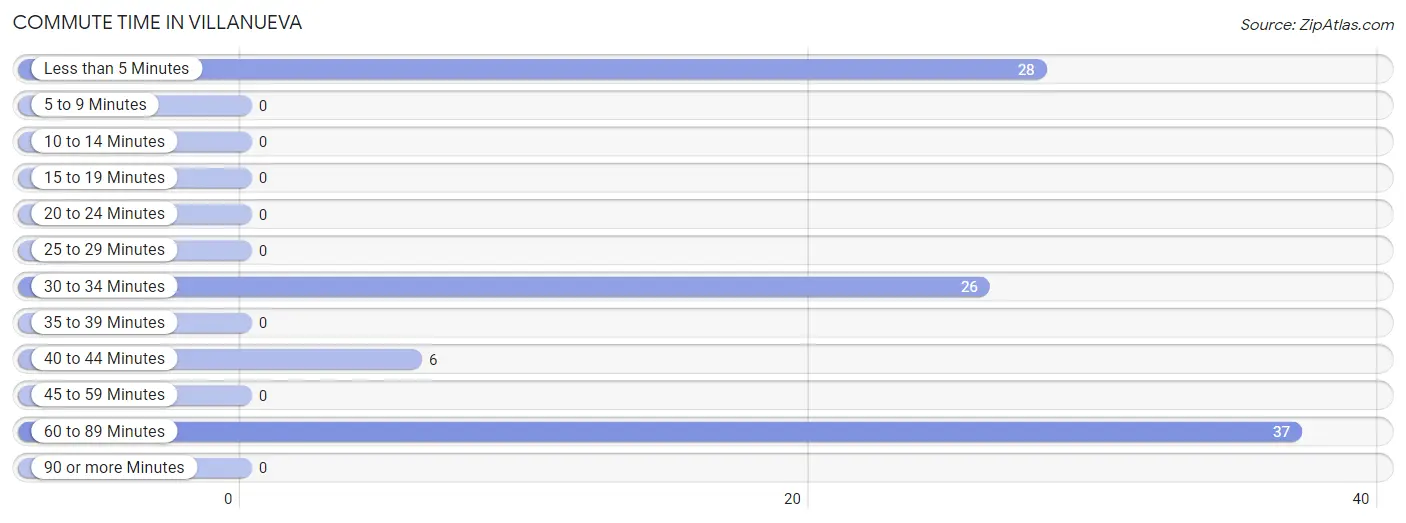
| Commute Time | # Commuters | % Commuters |
| Less than 5 Minutes | 28 | 28.9% |
| 5 to 9 Minutes | 0 | 0.0% |
| 10 to 14 Minutes | 0 | 0.0% |
| 15 to 19 Minutes | 0 | 0.0% |
| 20 to 24 Minutes | 0 | 0.0% |
| 25 to 29 Minutes | 0 | 0.0% |
| 30 to 34 Minutes | 26 | 26.8% |
| 35 to 39 Minutes | 0 | 0.0% |
| 40 to 44 Minutes | 6 | 6.2% |
| 45 to 59 Minutes | 0 | 0.0% |
| 60 to 89 Minutes | 37 | 38.1% |
| 90 or more Minutes | 0 | 0.0% |
Commute Time by Sex in Villanueva
The most common commute times in Villanueva are 30 to 34 minutes (26 commuters, 100.0%) for males and 60 to 89 minutes (37 commuters, 52.1%) for females.
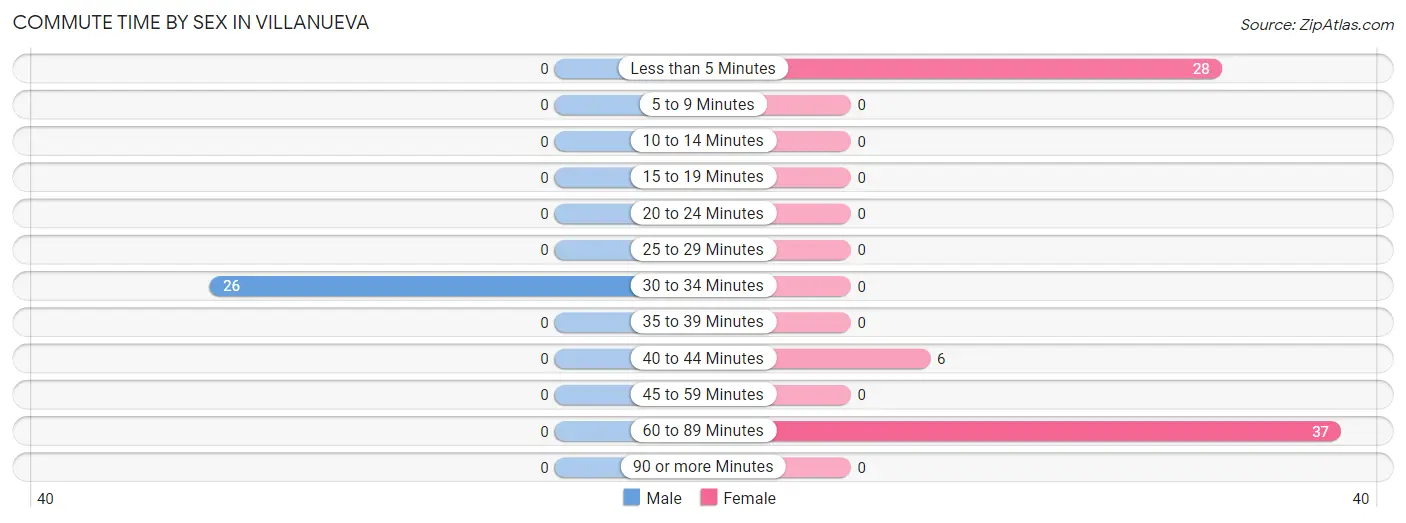
| Commute Time | Male | Female |
| Less than 5 Minutes | 0 (0.0%) | 28 (39.4%) |
| 5 to 9 Minutes | 0 (0.0%) | 0 (0.0%) |
| 10 to 14 Minutes | 0 (0.0%) | 0 (0.0%) |
| 15 to 19 Minutes | 0 (0.0%) | 0 (0.0%) |
| 20 to 24 Minutes | 0 (0.0%) | 0 (0.0%) |
| 25 to 29 Minutes | 0 (0.0%) | 0 (0.0%) |
| 30 to 34 Minutes | 26 (100.0%) | 0 (0.0%) |
| 35 to 39 Minutes | 0 (0.0%) | 0 (0.0%) |
| 40 to 44 Minutes | 0 (0.0%) | 6 (8.5%) |
| 45 to 59 Minutes | 0 (0.0%) | 0 (0.0%) |
| 60 to 89 Minutes | 0 (0.0%) | 37 (52.1%) |
| 90 or more Minutes | 0 (0.0%) | 0 (0.0%) |
Time of Departure to Work by Sex in Villanueva
The most frequent times of departure to work in Villanueva are 6:30 AM to 6:59 AM (26, 100.0%) for males and 8:00 AM to 8:29 AM (28, 39.4%) for females.
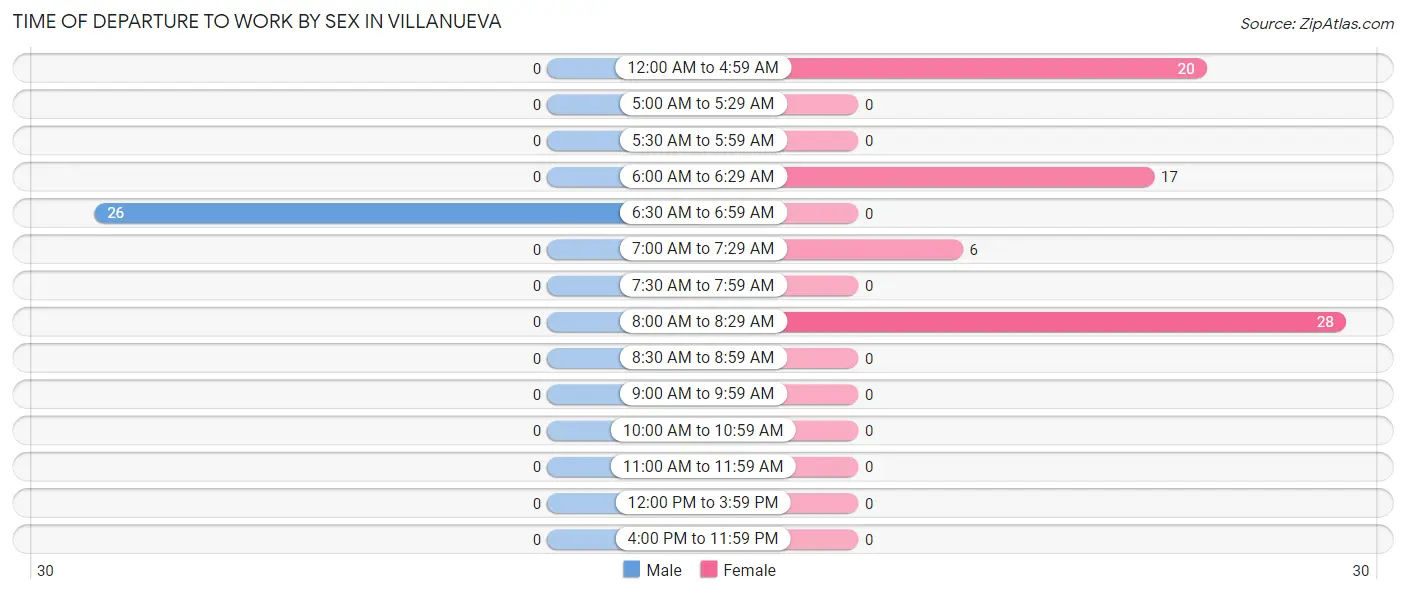
| Time of Departure | Male | Female |
| 12:00 AM to 4:59 AM | 0 (0.0%) | 20 (28.2%) |
| 5:00 AM to 5:29 AM | 0 (0.0%) | 0 (0.0%) |
| 5:30 AM to 5:59 AM | 0 (0.0%) | 0 (0.0%) |
| 6:00 AM to 6:29 AM | 0 (0.0%) | 17 (23.9%) |
| 6:30 AM to 6:59 AM | 26 (100.0%) | 0 (0.0%) |
| 7:00 AM to 7:29 AM | 0 (0.0%) | 6 (8.5%) |
| 7:30 AM to 7:59 AM | 0 (0.0%) | 0 (0.0%) |
| 8:00 AM to 8:29 AM | 0 (0.0%) | 28 (39.4%) |
| 8:30 AM to 8:59 AM | 0 (0.0%) | 0 (0.0%) |
| 9:00 AM to 9:59 AM | 0 (0.0%) | 0 (0.0%) |
| 10:00 AM to 10:59 AM | 0 (0.0%) | 0 (0.0%) |
| 11:00 AM to 11:59 AM | 0 (0.0%) | 0 (0.0%) |
| 12:00 PM to 3:59 PM | 0 (0.0%) | 0 (0.0%) |
| 4:00 PM to 11:59 PM | 0 (0.0%) | 0 (0.0%) |
| Total | 26 (100.0%) | 71 (100.0%) |
Housing Occupancy in Villanueva
Occupancy by Ownership in Villanueva
Of the total 171 dwellings in Villanueva, owner-occupied units account for 140 (81.9%), while renter-occupied units make up 31 (18.1%).
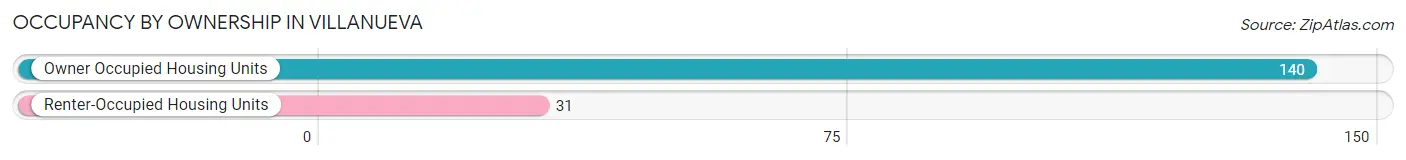
| Occupancy | # Housing Units | % Housing Units |
| Owner Occupied Housing Units | 140 | 81.9% |
| Renter-Occupied Housing Units | 31 | 18.1% |
| Total Occupied Housing Units | 171 | 100.0% |
Occupancy by Household Size in Villanueva
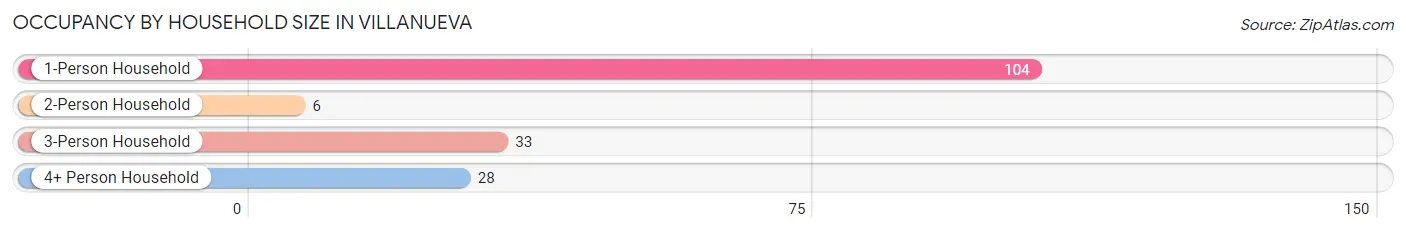
| Household Size | # Housing Units | % Housing Units |
| 1-Person Household | 104 | 60.8% |
| 2-Person Household | 6 | 3.5% |
| 3-Person Household | 33 | 19.3% |
| 4+ Person Household | 28 | 16.4% |
| Total Housing Units | 171 | 100.0% |
Occupancy by Ownership by Household Size in Villanueva
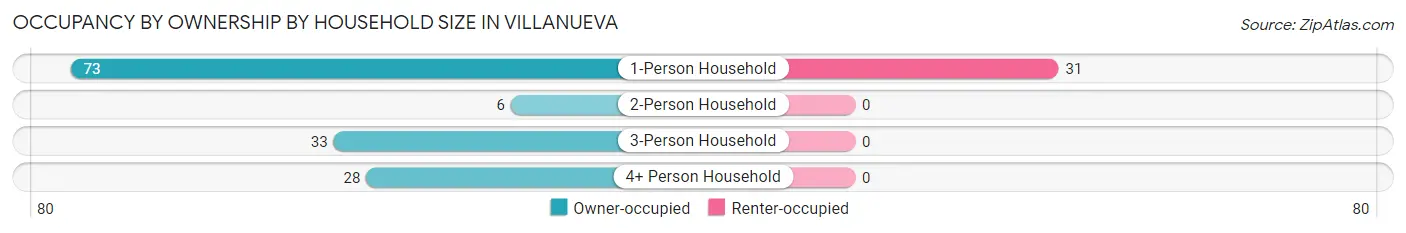
| Household Size | Owner-occupied | Renter-occupied |
| 1-Person Household | 73 (70.2%) | 31 (29.8%) |
| 2-Person Household | 6 (100.0%) | 0 (0.0%) |
| 3-Person Household | 33 (100.0%) | 0 (0.0%) |
| 4+ Person Household | 28 (100.0%) | 0 (0.0%) |
| Total Housing Units | 140 (81.9%) | 31 (18.1%) |
Occupancy by Educational Attainment in Villanueva
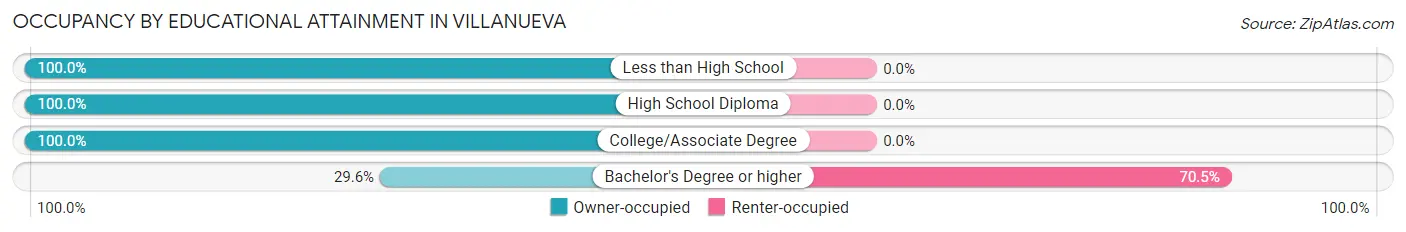
| Household Size | Owner-occupied | Renter-occupied |
| Less than High School | 30 (100.0%) | 0 (0.0%) |
| High School Diploma | 17 (100.0%) | 0 (0.0%) |
| College/Associate Degree | 80 (100.0%) | 0 (0.0%) |
| Bachelor's Degree or higher | 13 (29.5%) | 31 (70.5%) |
Occupancy by Age of Householder in Villanueva
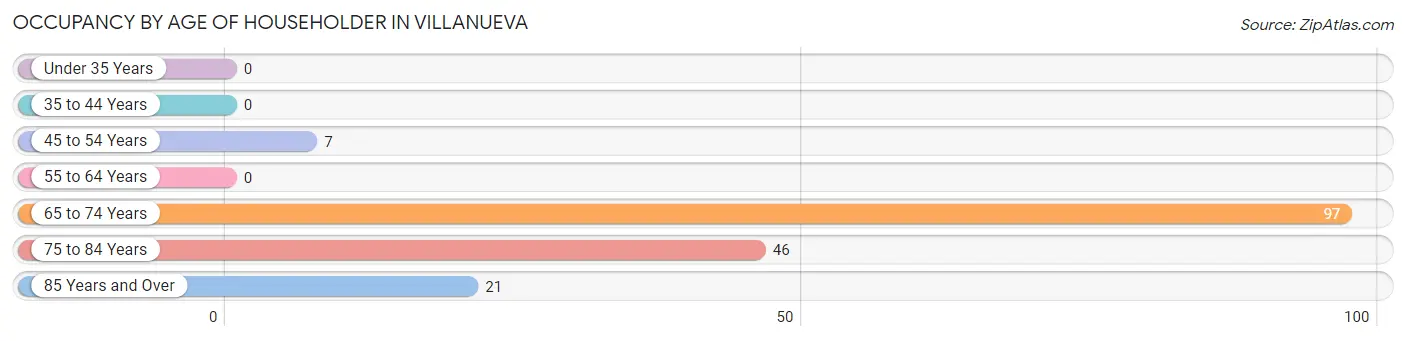
| Age Bracket | # Households | % Households |
| Under 35 Years | 0 | 0.0% |
| 35 to 44 Years | 0 | 0.0% |
| 45 to 54 Years | 7 | 4.1% |
| 55 to 64 Years | 0 | 0.0% |
| 65 to 74 Years | 97 | 56.7% |
| 75 to 84 Years | 46 | 26.9% |
| 85 Years and Over | 21 | 12.3% |
| Total | 171 | 100.0% |
Housing Finances in Villanueva
Median Income by Occupancy in Villanueva
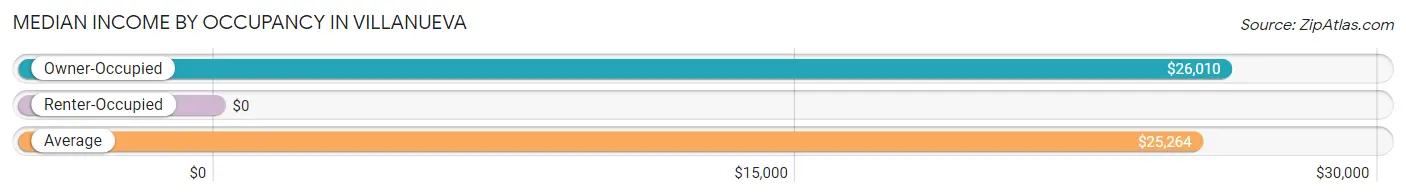
| Occupancy Type | # Households | Median Income |
| Owner-Occupied | 140 (81.9%) | $26,010 |
| Renter-Occupied | 31 (18.1%) | $0 |
| Average | 171 (100.0%) | $25,264 |
Occupancy by Householder Income Bracket in Villanueva
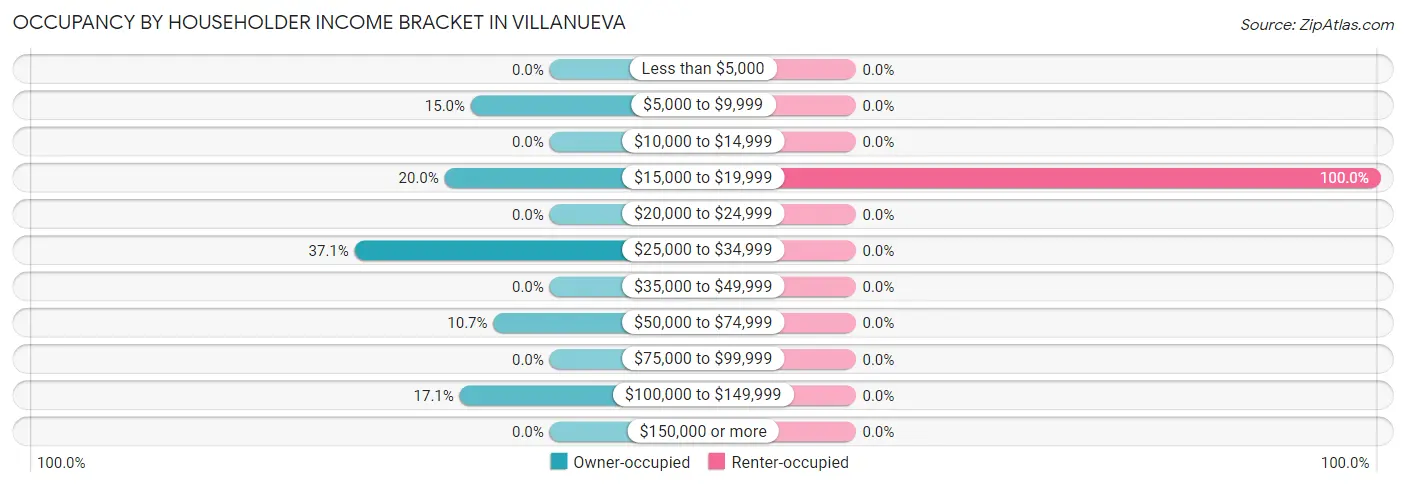
| Income Bracket | Owner-occupied | Renter-occupied |
| Less than $5,000 | 0 (0.0%) | 0 (0.0%) |
| $5,000 to $9,999 | 21 (15.0%) | 0 (0.0%) |
| $10,000 to $14,999 | 0 (0.0%) | 0 (0.0%) |
| $15,000 to $19,999 | 28 (20.0%) | 31 (100.0%) |
| $20,000 to $24,999 | 0 (0.0%) | 0 (0.0%) |
| $25,000 to $34,999 | 52 (37.1%) | 0 (0.0%) |
| $35,000 to $49,999 | 0 (0.0%) | 0 (0.0%) |
| $50,000 to $74,999 | 15 (10.7%) | 0 (0.0%) |
| $75,000 to $99,999 | 0 (0.0%) | 0 (0.0%) |
| $100,000 to $149,999 | 24 (17.1%) | 0 (0.0%) |
| $150,000 or more | 0 (0.0%) | 0 (0.0%) |
| Total | 140 (100.0%) | 31 (100.0%) |
Monthly Housing Cost Tiers in Villanueva
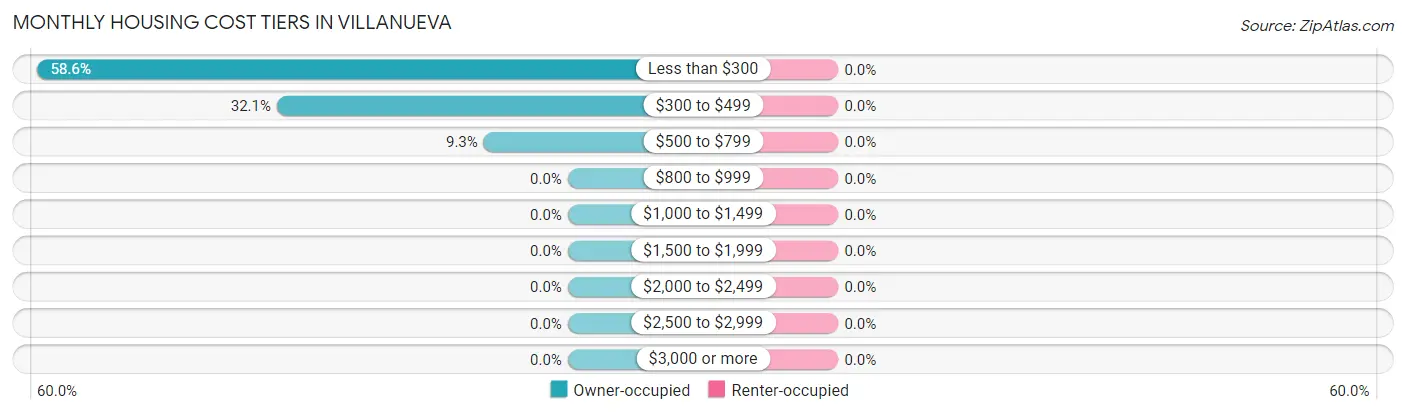
| Monthly Cost | Owner-occupied | Renter-occupied |
| Less than $300 | 82 (58.6%) | 0 (0.0%) |
| $300 to $499 | 45 (32.1%) | 0 (0.0%) |
| $500 to $799 | 13 (9.3%) | 0 (0.0%) |
| $800 to $999 | 0 (0.0%) | 0 (0.0%) |
| $1,000 to $1,499 | 0 (0.0%) | 0 (0.0%) |
| $1,500 to $1,999 | 0 (0.0%) | 0 (0.0%) |
| $2,000 to $2,499 | 0 (0.0%) | 0 (0.0%) |
| $2,500 to $2,999 | 0 (0.0%) | 0 (0.0%) |
| $3,000 or more | 0 (0.0%) | 0 (0.0%) |
| Total | 140 (100.0%) | 31 (100.0%) |
Physical Housing Characteristics in Villanueva
Housing Structures in Villanueva
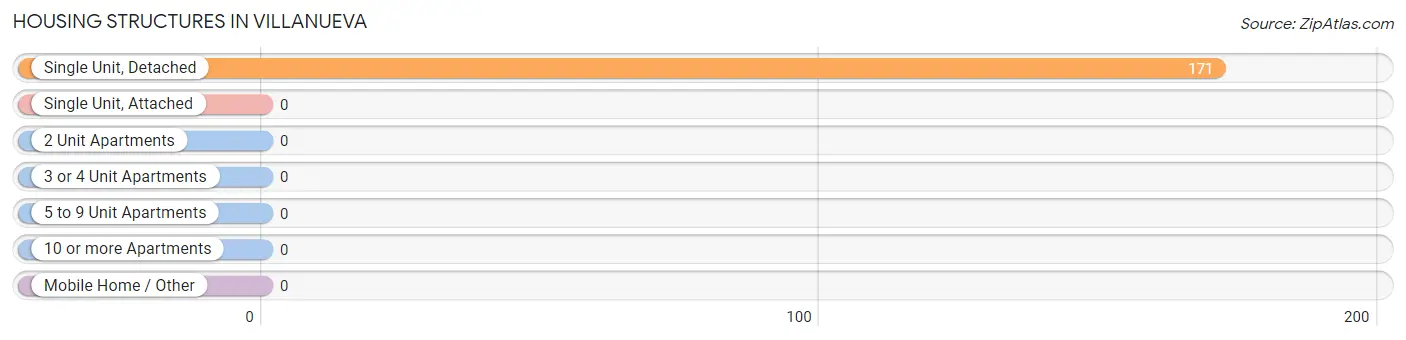
| Structure Type | # Housing Units | % Housing Units |
| Single Unit, Detached | 171 | 100.0% |
| Single Unit, Attached | 0 | 0.0% |
| 2 Unit Apartments | 0 | 0.0% |
| 3 or 4 Unit Apartments | 0 | 0.0% |
| 5 to 9 Unit Apartments | 0 | 0.0% |
| 10 or more Apartments | 0 | 0.0% |
| Mobile Home / Other | 0 | 0.0% |
| Total | 171 | 100.0% |
Housing Structures by Occupancy in Villanueva
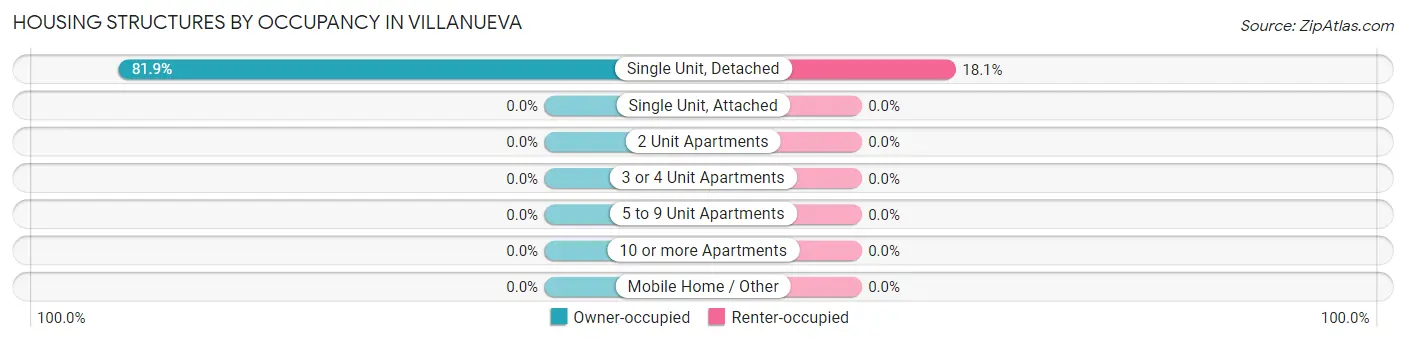
| Structure Type | Owner-occupied | Renter-occupied |
| Single Unit, Detached | 140 (81.9%) | 31 (18.1%) |
| Single Unit, Attached | 0 (0.0%) | 0 (0.0%) |
| 2 Unit Apartments | 0 (0.0%) | 0 (0.0%) |
| 3 or 4 Unit Apartments | 0 (0.0%) | 0 (0.0%) |
| 5 to 9 Unit Apartments | 0 (0.0%) | 0 (0.0%) |
| 10 or more Apartments | 0 (0.0%) | 0 (0.0%) |
| Mobile Home / Other | 0 (0.0%) | 0 (0.0%) |
| Total | 140 (81.9%) | 31 (18.1%) |
Housing Structures by Number of Rooms in Villanueva
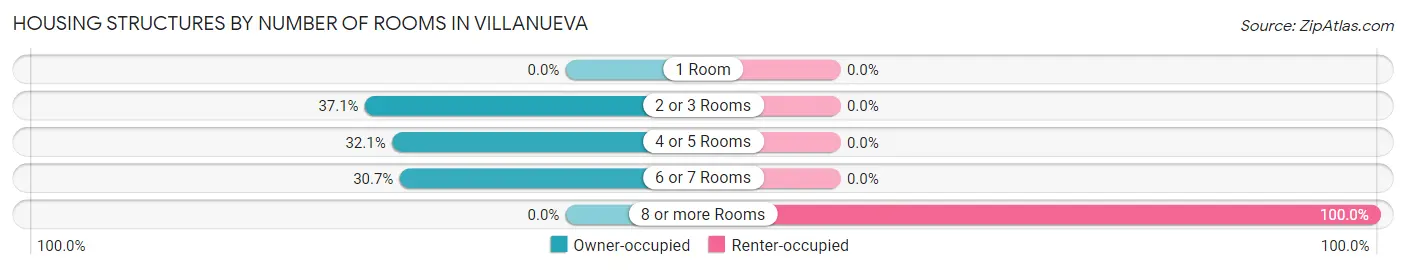
| Number of Rooms | Owner-occupied | Renter-occupied |
| 1 Room | 0 (0.0%) | 0 (0.0%) |
| 2 or 3 Rooms | 52 (37.1%) | 0 (0.0%) |
| 4 or 5 Rooms | 45 (32.1%) | 0 (0.0%) |
| 6 or 7 Rooms | 43 (30.7%) | 0 (0.0%) |
| 8 or more Rooms | 0 (0.0%) | 31 (100.0%) |
| Total | 140 (100.0%) | 31 (100.0%) |
Housing Structure by Heating Type in Villanueva
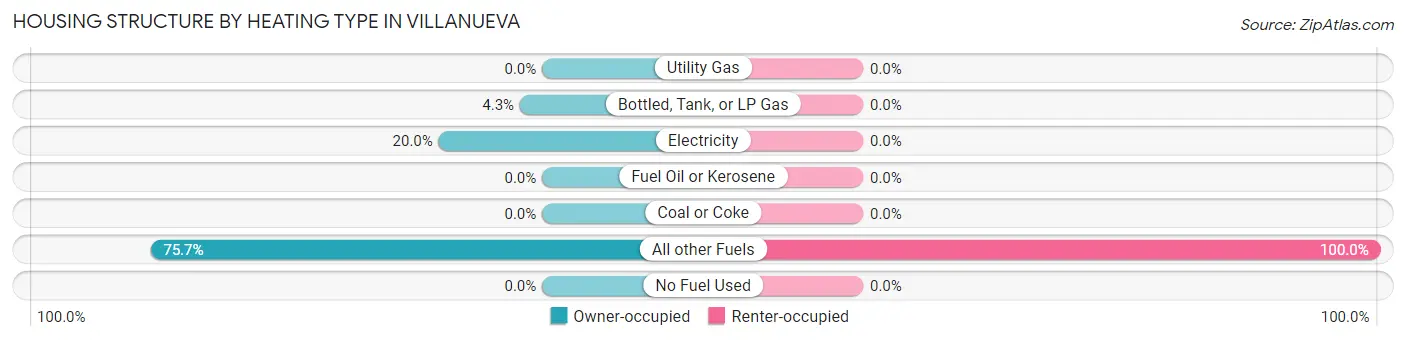
| Heating Type | Owner-occupied | Renter-occupied |
| Utility Gas | 0 (0.0%) | 0 (0.0%) |
| Bottled, Tank, or LP Gas | 6 (4.3%) | 0 (0.0%) |
| Electricity | 28 (20.0%) | 0 (0.0%) |
| Fuel Oil or Kerosene | 0 (0.0%) | 0 (0.0%) |
| Coal or Coke | 0 (0.0%) | 0 (0.0%) |
| All other Fuels | 106 (75.7%) | 31 (100.0%) |
| No Fuel Used | 0 (0.0%) | 0 (0.0%) |
| Total | 140 (100.0%) | 31 (100.0%) |
Household Vehicle Usage in Villanueva
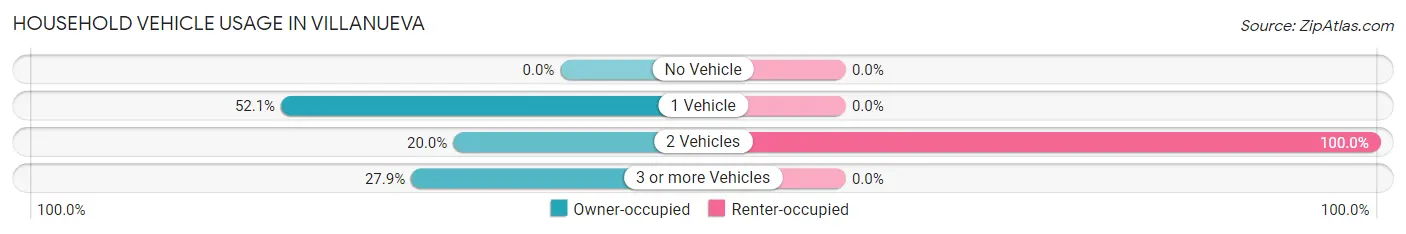
| Vehicles per Household | Owner-occupied | Renter-occupied |
| No Vehicle | 0 (0.0%) | 0 (0.0%) |
| 1 Vehicle | 73 (52.1%) | 0 (0.0%) |
| 2 Vehicles | 28 (20.0%) | 31 (100.0%) |
| 3 or more Vehicles | 39 (27.9%) | 0 (0.0%) |
| Total | 140 (100.0%) | 31 (100.0%) |
Real Estate & Mortgages in Villanueva
Real Estate and Mortgage Overview in Villanueva
| Characteristic | Without Mortgage | With Mortgage |
| Housing Units | 140 | 0 |
| Median Property Value | $110,100 | $0 |
| Median Household Income | $26,010 | $0 |
| Monthly Housing Costs | - | - |
| Real Estate Taxes | $700 | $0 |
Property Value by Mortgage Status in Villanueva
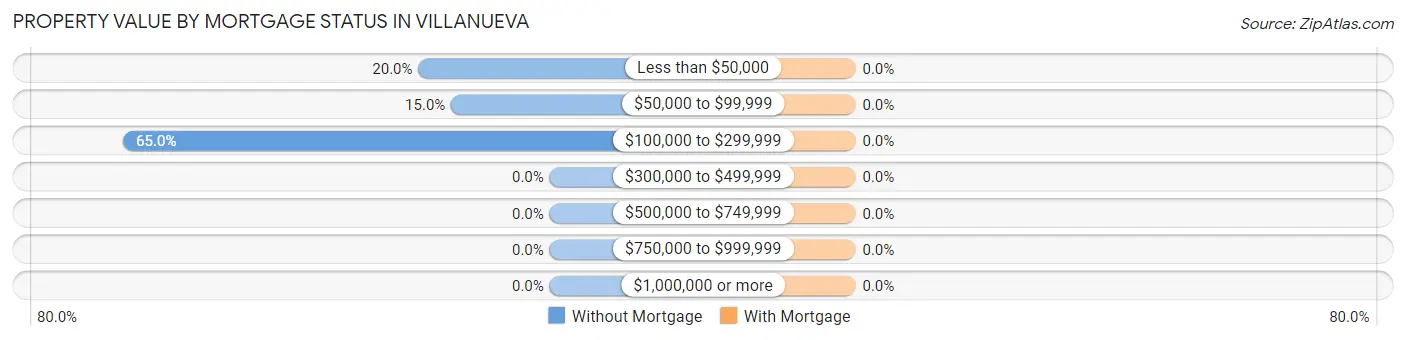
| Property Value | Without Mortgage | With Mortgage |
| Less than $50,000 | 28 (20.0%) | 0 (0.0%) |
| $50,000 to $99,999 | 21 (15.0%) | 0 (0.0%) |
| $100,000 to $299,999 | 91 (65.0%) | 0 (0.0%) |
| $300,000 to $499,999 | 0 (0.0%) | 0 (0.0%) |
| $500,000 to $749,999 | 0 (0.0%) | 0 (0.0%) |
| $750,000 to $999,999 | 0 (0.0%) | 0 (0.0%) |
| $1,000,000 or more | 0 (0.0%) | 0 (0.0%) |
| Total | 140 (100.0%) | 0 (0.0%) |
Household Income by Mortgage Status in Villanueva

| Household Income | Without Mortgage | With Mortgage |
| Less than $10,000 | 21 (15.0%) | 0 (0.0%) |
| $10,000 to $24,999 | 28 (20.0%) | 0 (0.0%) |
| $25,000 to $34,999 | 52 (37.1%) | 0 (0.0%) |
| $35,000 to $49,999 | 0 (0.0%) | 0 (0.0%) |
| $50,000 to $74,999 | 15 (10.7%) | 0 (0.0%) |
| $75,000 to $99,999 | 0 (0.0%) | 0 (0.0%) |
| $100,000 to $149,999 | 24 (17.1%) | 0 (0.0%) |
| $150,000 or more | 0 (0.0%) | 0 (0.0%) |
| Total | 140 (100.0%) | 0 (0.0%) |
Property Value to Household Income Ratio in Villanueva
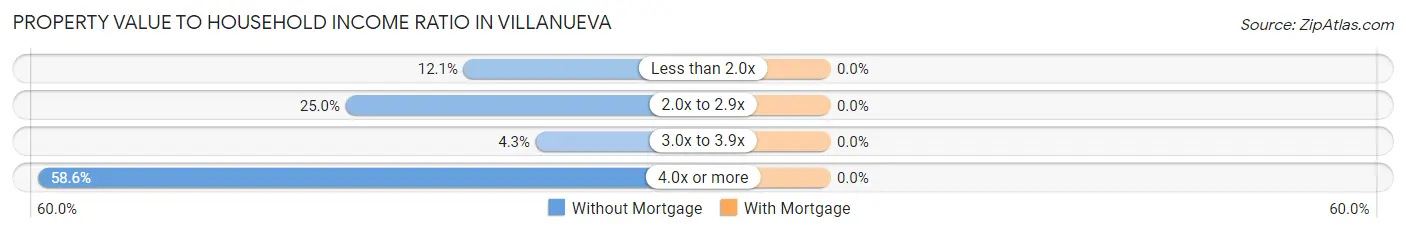
| Value-to-Income Ratio | Without Mortgage | With Mortgage |
| Less than 2.0x | 17 (12.1%) | 0 (0.0%) |
| 2.0x to 2.9x | 35 (25.0%) | 0 (0.0%) |
| 3.0x to 3.9x | 6 (4.3%) | 0 (0.0%) |
| 4.0x or more | 82 (58.6%) | 0 (0.0%) |
| Total | 140 (100.0%) | 0 (0.0%) |
Real Estate Taxes by Mortgage Status in Villanueva
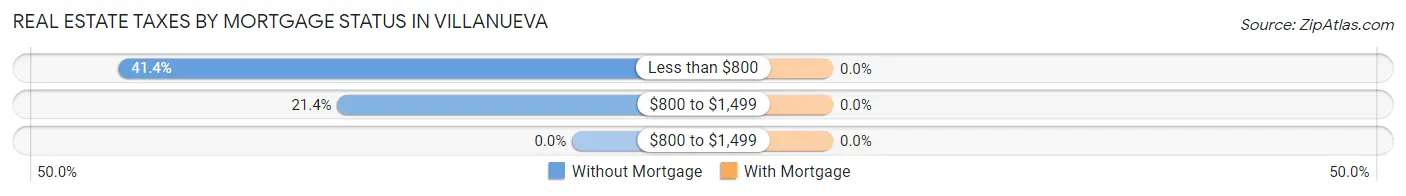
| Property Taxes | Without Mortgage | With Mortgage |
| Less than $800 | 58 (41.4%) | 0 (0.0%) |
| $800 to $1,499 | 30 (21.4%) | 0 (0.0%) |
| $800 to $1,499 | 0 (0.0%) | 0 (0.0%) |
| Total | 140 (100.0%) | 0 (0.0%) |
Health & Disability in Villanueva
Health Insurance Coverage by Age in Villanueva
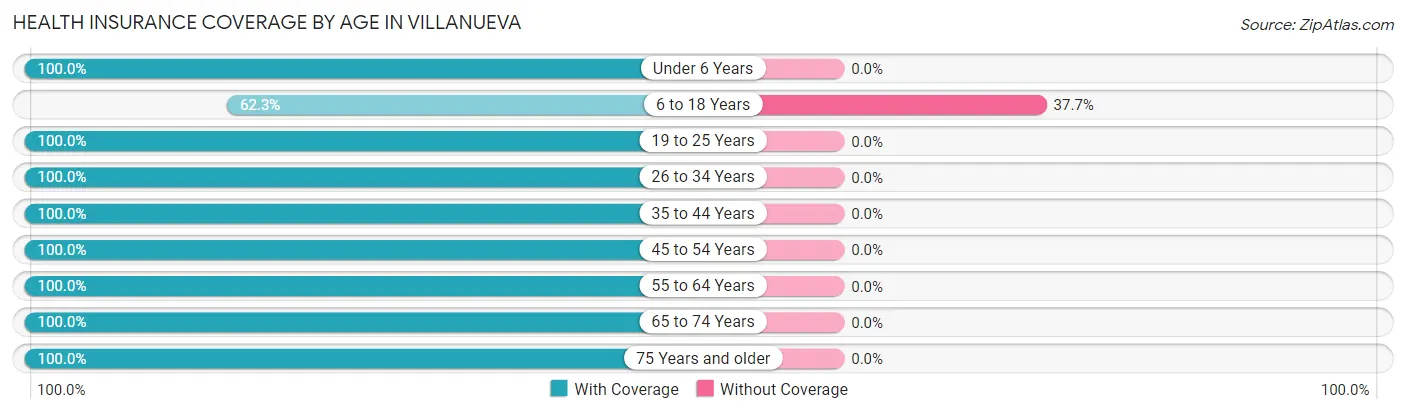
| Age Bracket | With Coverage | Without Coverage |
| Under 6 Years | 27 (100.0%) | 0 (0.0%) |
| 6 to 18 Years | 33 (62.3%) | 20 (37.7%) |
| 19 to 25 Years | 68 (100.0%) | 0 (0.0%) |
| 26 to 34 Years | 40 (100.0%) | 0 (0.0%) |
| 35 to 44 Years | 26 (100.0%) | 0 (0.0%) |
| 45 to 54 Years | 7 (100.0%) | 0 (0.0%) |
| 55 to 64 Years | 6 (100.0%) | 0 (0.0%) |
| 65 to 74 Years | 139 (100.0%) | 0 (0.0%) |
| 75 Years and older | 67 (100.0%) | 0 (0.0%) |
| Total | 413 (95.4%) | 20 (4.6%) |
Health Insurance Coverage by Citizenship Status in Villanueva
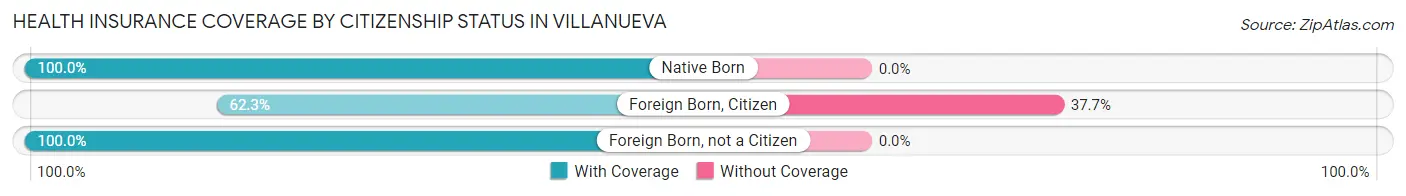
| Citizenship Status | With Coverage | Without Coverage |
| Native Born | 27 (100.0%) | 0 (0.0%) |
| Foreign Born, Citizen | 33 (62.3%) | 20 (37.7%) |
| Foreign Born, not a Citizen | 68 (100.0%) | 0 (0.0%) |
Health Insurance Coverage by Household Income in Villanueva
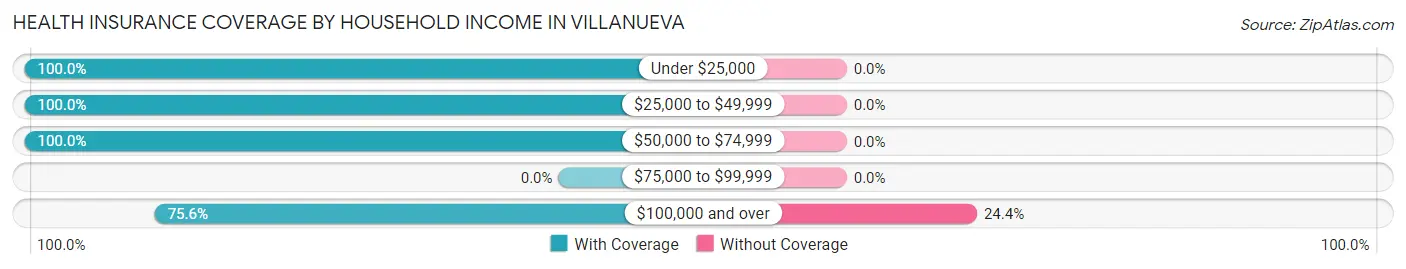
| Household Income | With Coverage | Without Coverage |
| Under $25,000 | 251 (100.0%) | 0 (0.0%) |
| $25,000 to $49,999 | 52 (100.0%) | 0 (0.0%) |
| $50,000 to $74,999 | 48 (100.0%) | 0 (0.0%) |
| $75,000 to $99,999 | 0 (0.0%) | 0 (0.0%) |
| $100,000 and over | 62 (75.6%) | 20 (24.4%) |
Public vs Private Health Insurance Coverage by Age in Villanueva
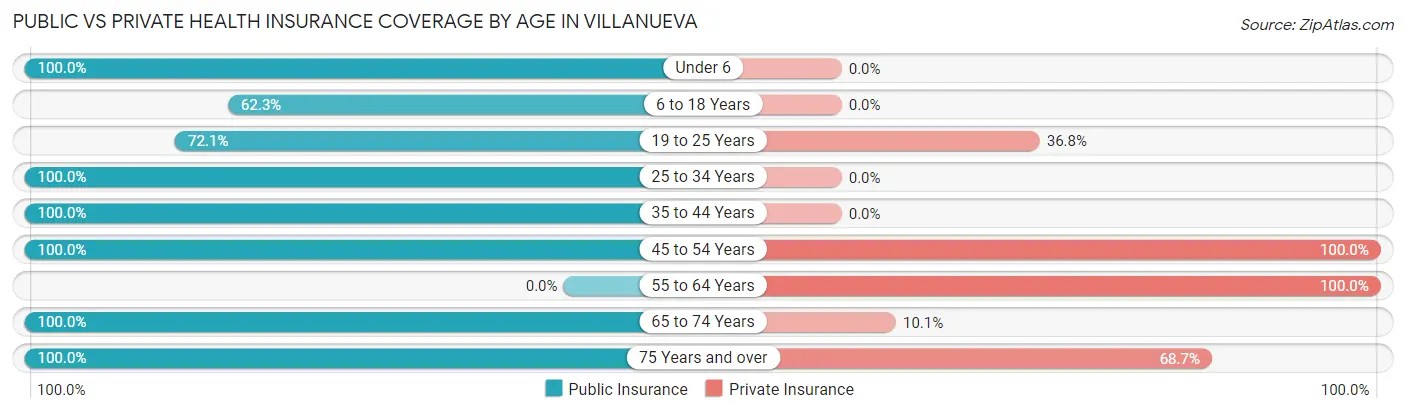
| Age Bracket | Public Insurance | Private Insurance |
| Under 6 | 27 (100.0%) | 0 (0.0%) |
| 6 to 18 Years | 33 (62.3%) | 0 (0.0%) |
| 19 to 25 Years | 49 (72.1%) | 25 (36.8%) |
| 25 to 34 Years | 40 (100.0%) | 0 (0.0%) |
| 35 to 44 Years | 26 (100.0%) | 0 (0.0%) |
| 45 to 54 Years | 7 (100.0%) | 7 (100.0%) |
| 55 to 64 Years | 0 (0.0%) | 6 (100.0%) |
| 65 to 74 Years | 139 (100.0%) | 14 (10.1%) |
| 75 Years and over | 67 (100.0%) | 46 (68.7%) |
| Total | 388 (89.6%) | 98 (22.6%) |
Disability Status by Sex by Age in Villanueva
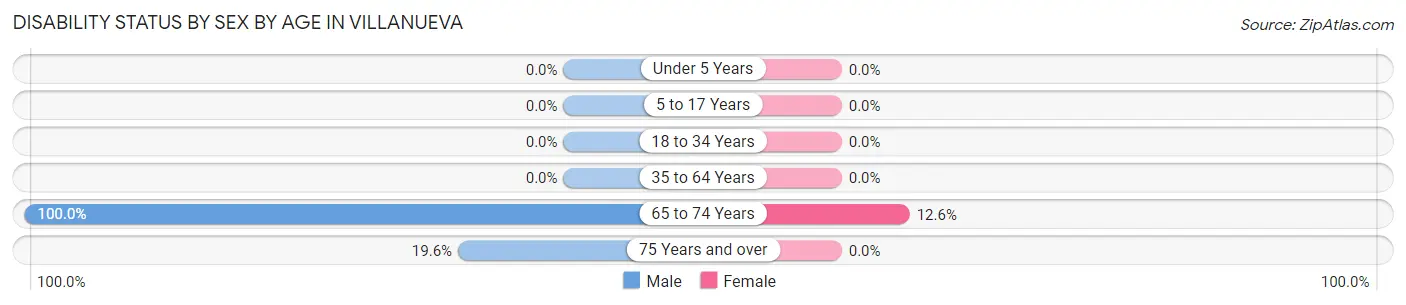
| Age Bracket | Male | Female |
| Under 5 Years | 0 (0.0%) | 0 (0.0%) |
| 5 to 17 Years | 0 (0.0%) | 0 (0.0%) |
| 18 to 34 Years | 0 (0.0%) | 0 (0.0%) |
| 35 to 64 Years | 0 (0.0%) | 0 (0.0%) |
| 65 to 74 Years | 28 (100.0%) | 14 (12.6%) |
| 75 Years and over | 9 (19.6%) | 0 (0.0%) |
Disability Class by Sex by Age in Villanueva
Disability Class: Hearing Difficulty
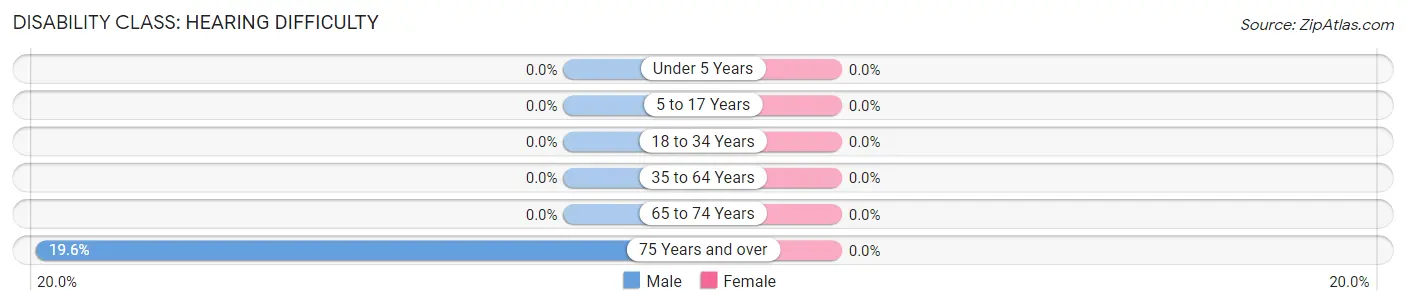
| Age Bracket | Male | Female |
| Under 5 Years | 0 (0.0%) | 0 (0.0%) |
| 5 to 17 Years | 0 (0.0%) | 0 (0.0%) |
| 18 to 34 Years | 0 (0.0%) | 0 (0.0%) |
| 35 to 64 Years | 0 (0.0%) | 0 (0.0%) |
| 65 to 74 Years | 0 (0.0%) | 0 (0.0%) |
| 75 Years and over | 9 (19.6%) | 0 (0.0%) |
Disability Class: Vision Difficulty
| Age Bracket | Male | Female |
| Under 5 Years | 0 (0.0%) | 0 (0.0%) |
| 5 to 17 Years | 0 (0.0%) | 0 (0.0%) |
| 18 to 34 Years | 0 (0.0%) | 0 (0.0%) |
| 35 to 64 Years | 0 (0.0%) | 0 (0.0%) |
| 65 to 74 Years | 0 (0.0%) | 0 (0.0%) |
| 75 Years and over | 0 (0.0%) | 0 (0.0%) |
Disability Class: Cognitive Difficulty
| Age Bracket | Male | Female |
| 5 to 17 Years | 0 (0.0%) | 0 (0.0%) |
| 18 to 34 Years | 0 (0.0%) | 0 (0.0%) |
| 35 to 64 Years | 0 (0.0%) | 0 (0.0%) |
| 65 to 74 Years | 28 (100.0%) | 0 (0.0%) |
| 75 Years and over | 0 (0.0%) | 0 (0.0%) |
Disability Class: Ambulatory Difficulty
| Age Bracket | Male | Female |
| 5 to 17 Years | 0 (0.0%) | 0 (0.0%) |
| 18 to 34 Years | 0 (0.0%) | 0 (0.0%) |
| 35 to 64 Years | 0 (0.0%) | 0 (0.0%) |
| 65 to 74 Years | 28 (100.0%) | 9 (8.1%) |
| 75 Years and over | 0 (0.0%) | 0 (0.0%) |
Disability Class: Self-Care Difficulty
| Age Bracket | Male | Female |
| 5 to 17 Years | 0 (0.0%) | 0 (0.0%) |
| 18 to 34 Years | 0 (0.0%) | 0 (0.0%) |
| 35 to 64 Years | 0 (0.0%) | 0 (0.0%) |
| 65 to 74 Years | 28 (100.0%) | 9 (8.1%) |
| 75 Years and over | 0 (0.0%) | 0 (0.0%) |
Technology Access in Villanueva
Computing Device Access in Villanueva
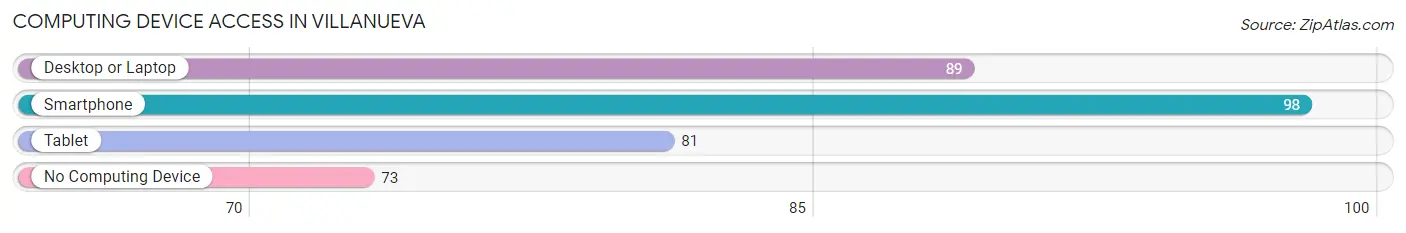
| Device Type | # Households | % Households |
| Desktop or Laptop | 89 | 52.0% |
| Smartphone | 98 | 57.3% |
| Tablet | 81 | 47.4% |
| No Computing Device | 73 | 42.7% |
| Total | 171 | 100.0% |
Internet Access in Villanueva
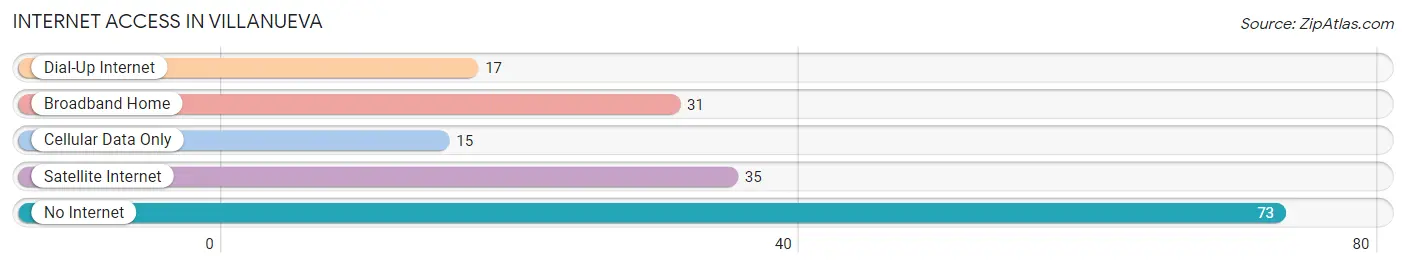
| Internet Type | # Households | % Households |
| Dial-Up Internet | 17 | 9.9% |
| Broadband Home | 31 | 18.1% |
| Cellular Data Only | 15 | 8.8% |
| Satellite Internet | 35 | 20.5% |
| No Internet | 73 | 42.7% |
| Total | 171 | 100.0% |
Villanueva Summary
Villanueva is a small village located in the state of New Mexico, United States. It is situated in the San Miguel County, and is part of the Las Vegas Micropolitan Statistical Area. The village has a population of around 1,000 people, and is located at an elevation of 6,000 feet.
History
Villanueva was founded in 1876 by a group of settlers from the nearby town of Las Vegas. The settlers were looking for a place to settle and start a new life, and they chose the area around Villanueva due to its fertile soil and abundant water sources. The village was named after the Spanish explorer, Francisco Villanueva, who had explored the area in the late 1700s.
The village grew slowly over the years, and by the early 1900s, it had become a thriving agricultural community. The main crops grown in the area were wheat, corn, and alfalfa. The village also had a small sawmill, which provided lumber for the local farmers.
In the 1920s, the village began to experience a period of growth and prosperity. The railroad arrived in the area, and the village became a stop on the Santa Fe Trail. This allowed the village to become a trading center for the surrounding area. The village also had a post office, a bank, and a hotel.
Geography
Villanueva is located in the San Miguel County, in the northern part of New Mexico. The village is situated at an elevation of 6,000 feet, and is surrounded by the Sangre de Cristo Mountains. The village is located on the banks of the Gallinas River, which flows through the area.
The climate in Villanueva is semi-arid, with hot summers and cold winters. The average annual temperature is around 50 degrees Fahrenheit, and the average annual precipitation is around 12 inches.
Economy
The economy of Villanueva is largely based on agriculture. The main crops grown in the area are wheat, corn, and alfalfa. The village also has a small sawmill, which provides lumber for the local farmers.
In addition to agriculture, the village also has a few small businesses, including a grocery store, a gas station, and a few restaurants. The village also has a post office, a bank, and a hotel.
Demographics
As of the 2010 census, the population of Villanueva was 1,000 people. The racial makeup of the village was 95.2% White, 0.7% African American, 0.7% Native American, 0.3% Asian, 0.1% Pacific Islander, and 2.1% from other races. The median household income was $25,000, and the median family income was $30,000.
Conclusion
Villanueva is a small village located in the state of New Mexico, United States. It is situated in the San Miguel County, and is part of the Las Vegas Micropolitan Statistical Area. The village has a population of around 1,000 people, and is located at an elevation of 6,000 feet. The economy of Villanueva is largely based on agriculture, and the village also has a few small businesses. The racial makeup of the village is 95.2% White, 0.7% African American, 0.7% Native American, 0.3% Asian, 0.1% Pacific Islander, and 2.1% from other races. The median household income was $25,000, and the median family income was $30,000.
Common Questions
What is Per Capita Income in Villanueva?
Per Capita income in Villanueva is $17,080.
What is the Median Household income in Villanueva?
Median Household Income in Villanueva is $25,264.
What is Inequality or Gini Index in Villanueva?
Inequality or Gini Index in Villanueva is 0.44.
What is the Total Population of Villanueva?
Total Population of Villanueva is 433.
What is the Total Male Population of Villanueva?
Total Male Population of Villanueva is 199.
What is the Total Female Population of Villanueva?
Total Female Population of Villanueva is 234.
What is the Ratio of Males per 100 Females in Villanueva?
There are 85.04 Males per 100 Females in Villanueva.
What is the Ratio of Females per 100 Males in Villanueva?
There are 117.59 Females per 100 Males in Villanueva.
What is the Median Population Age in Villanueva?
Median Population Age in Villanueva is 54.4 Years.
What is the Average Family Size in Villanueva
Average Family Size in Villanueva is 4.3 People.
What is the Average Household Size in Villanueva
Average Household Size in Villanueva is 2.5 People.
How Large is the Labor Force in Villanueva?
There are 175 People in the Labor Forcein in Villanueva.
What is the Percentage of People in the Labor Force in Villanueva?
46.9% of People are in the Labor Force in Villanueva.