Vado, NM Map & Demographics
Vado Map
Vado Overview
$14,262
PER CAPITA INCOME
$47,474
AVG FAMILY INCOME
$46,380
AVG HOUSEHOLD INCOME
37.1%
WAGE / INCOME GAP [ % ]
62.9¢/ $1
WAGE / INCOME GAP [ $ ]
$20,586
FAMILY INCOME DEFICIT
0.40
INEQUALITY / GINI INDEX
3,386
TOTAL POPULATION
1,924
MALE POPULATION
1,462
FEMALE POPULATION
131.60
MALES / 100 FEMALES
75.99
FEMALES / 100 MALES
26.8
MEDIAN AGE
4.1
AVG FAMILY SIZE
3.8
AVG HOUSEHOLD SIZE
1,333
LABOR FORCE [ PEOPLE ]
60.5%
PERCENT IN LABOR FORCE
6.5%
UNEMPLOYMENT RATE
Vado Zip Codes
Vado Area Codes
Income in Vado
Income Overview in Vado
Per Capita Income in Vado is $14,262, while median incomes of families and households are $47,474 and $46,380 respectively.
| Characteristic | Number | Measure |
| Per Capita Income | 3,386 | $14,262 |
| Median Family Income | 753 | $47,474 |
| Mean Family Income | 753 | $52,101 |
| Median Household Income | 891 | $46,380 |
| Mean Household Income | 891 | $51,366 |
| Income Deficit | 753 | $20,586 |
| Wage / Income Gap (%) | 3,386 | 37.15% |
| Wage / Income Gap ($) | 3,386 | 62.85¢ per $1 |
| Gini / Inequality Index | 3,386 | 0.40 |
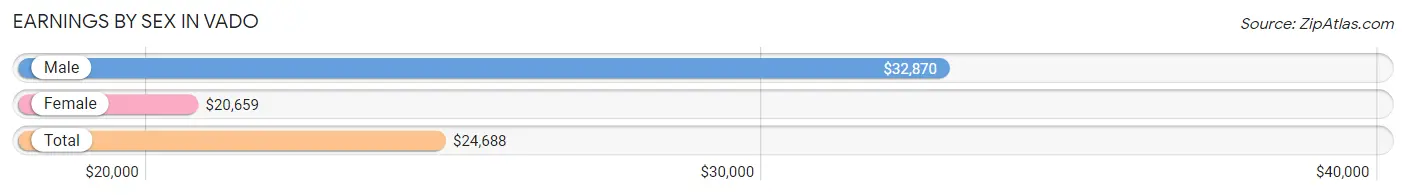
Earnings by Sex in Vado
Average Earnings in Vado are $24,688, $32,870 for men and $20,659 for women, a difference of 37.1%.
| Sex | Number | Average Earnings |
| Male | 976 (75.6%) | $32,870 |
| Female | 315 (24.4%) | $20,659 |
| Total | 1,291 (100.0%) | $24,688 |
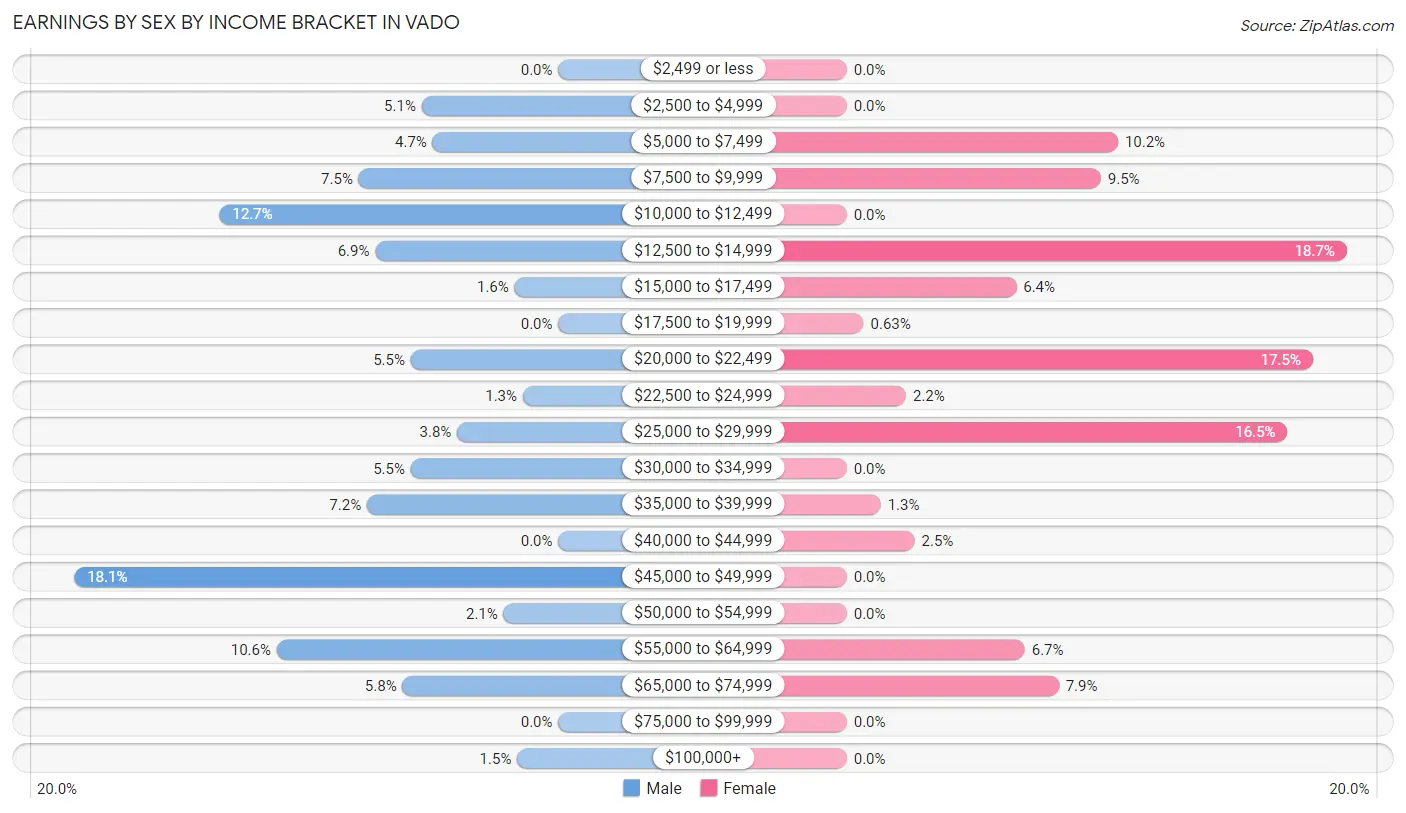
Earnings by Sex by Income Bracket in Vado
The most common earnings brackets in Vado are $45,000 to $49,999 for men (177 | 18.1%) and $12,500 to $14,999 for women (59 | 18.7%).
| Income | Male | Female |
| $2,499 or less | 0 (0.0%) | 0 (0.0%) |
| $2,500 to $4,999 | 50 (5.1%) | 0 (0.0%) |
| $5,000 to $7,499 | 46 (4.7%) | 32 (10.2%) |
| $7,500 to $9,999 | 73 (7.5%) | 30 (9.5%) |
| $10,000 to $12,499 | 124 (12.7%) | 0 (0.0%) |
| $12,500 to $14,999 | 67 (6.9%) | 59 (18.7%) |
| $15,000 to $17,499 | 16 (1.6%) | 20 (6.4%) |
| $17,500 to $19,999 | 0 (0.0%) | 2 (0.6%) |
| $20,000 to $22,499 | 54 (5.5%) | 55 (17.5%) |
| $22,500 to $24,999 | 13 (1.3%) | 7 (2.2%) |
| $25,000 to $29,999 | 37 (3.8%) | 52 (16.5%) |
| $30,000 to $34,999 | 54 (5.5%) | 0 (0.0%) |
| $35,000 to $39,999 | 70 (7.2%) | 4 (1.3%) |
| $40,000 to $44,999 | 0 (0.0%) | 8 (2.5%) |
| $45,000 to $49,999 | 177 (18.1%) | 0 (0.0%) |
| $50,000 to $54,999 | 20 (2.1%) | 0 (0.0%) |
| $55,000 to $64,999 | 103 (10.5%) | 21 (6.7%) |
| $65,000 to $74,999 | 57 (5.8%) | 25 (7.9%) |
| $75,000 to $99,999 | 0 (0.0%) | 0 (0.0%) |
| $100,000+ | 15 (1.5%) | 0 (0.0%) |
| Total | 976 (100.0%) | 315 (100.0%) |
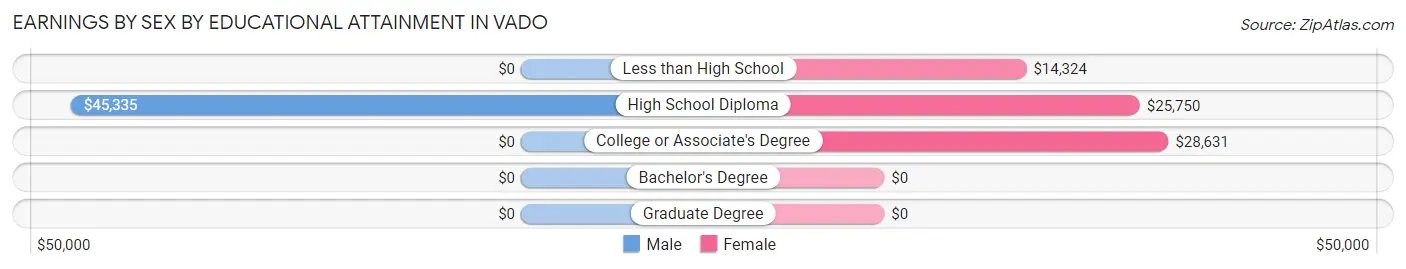
Earnings by Sex by Educational Attainment in Vado
Average earnings in Vado are $38,161 for men and $21,614 for women, a difference of 43.4%. Men with an educational attainment of high school diploma enjoy the highest average annual earnings of $45,335, while those with high school diploma education earn the least with $45,335. Women with an educational attainment of college or associate's degree earn the most with the average annual earnings of $28,631, while those with less than high school education have the smallest earnings of $14,324.
| Educational Attainment | Male Income | Female Income |
| Less than High School | - | - |
| High School Diploma | $45,335 | $25,750 |
| College or Associate's Degree | - | - |
| Bachelor's Degree | - | - |
| Graduate Degree | - | - |
| Total | $38,161 | $21,614 |
Family Income in Vado
Family Income Brackets in Vado
According to the Vado family income data, there are 165 families falling into the $75,000 to $99,999 income range, which is the most common income bracket and makes up 21.9% of all families.
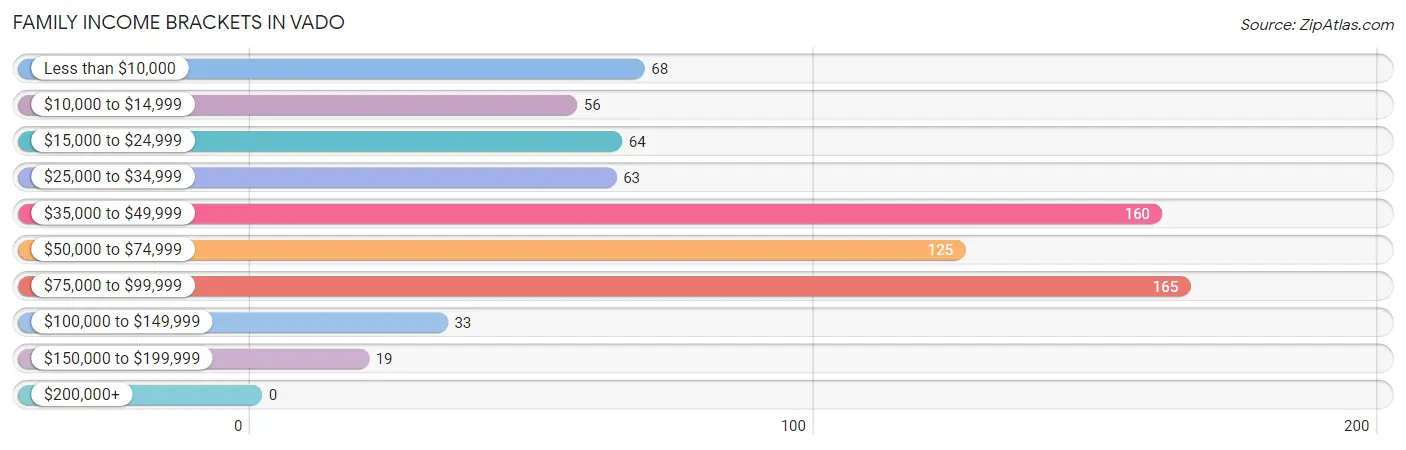
| Income Bracket | # Families | % Families |
| Less than $10,000 | 68 | 9.0% |
| $10,000 to $14,999 | 56 | 7.4% |
| $15,000 to $24,999 | 64 | 8.5% |
| $25,000 to $34,999 | 63 | 8.4% |
| $35,000 to $49,999 | 160 | 21.2% |
| $50,000 to $74,999 | 125 | 16.6% |
| $75,000 to $99,999 | 165 | 21.9% |
| $100,000 to $149,999 | 33 | 4.4% |
| $150,000 to $199,999 | 19 | 2.5% |
| $200,000+ | 0 | 0.0% |
Family Income by Famaliy Size in Vado
4-person families (263 | 34.9%) account for the highest median family income in Vado with $55,931 per family, while 4-person families (263 | 34.9%) have the highest median income of $13,983 per family member.
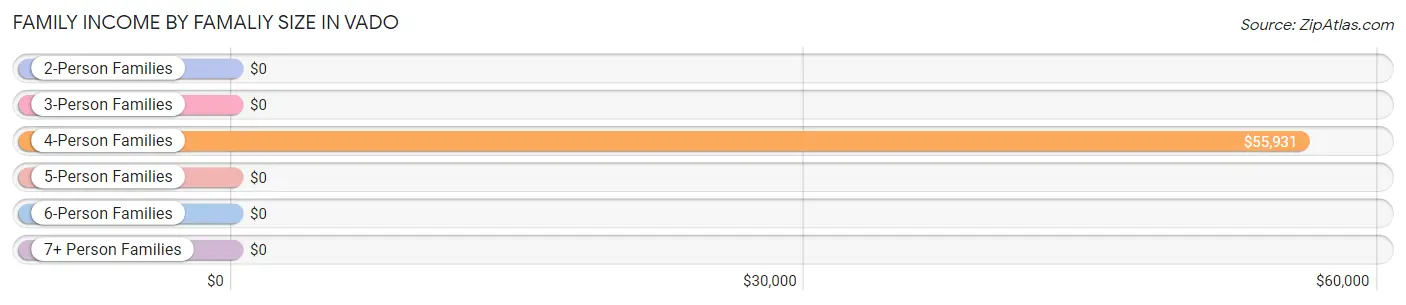
| Income Bracket | # Families | Median Income |
| 2-Person Families | 229 (30.4%) | $0 |
| 3-Person Families | 88 (11.7%) | $0 |
| 4-Person Families | 263 (34.9%) | $55,931 |
| 5-Person Families | 70 (9.3%) | $0 |
| 6-Person Families | 64 (8.5%) | $0 |
| 7+ Person Families | 39 (5.2%) | $0 |
| Total | 753 (100.0%) | $47,474 |
Family Income by Number of Earners in Vado
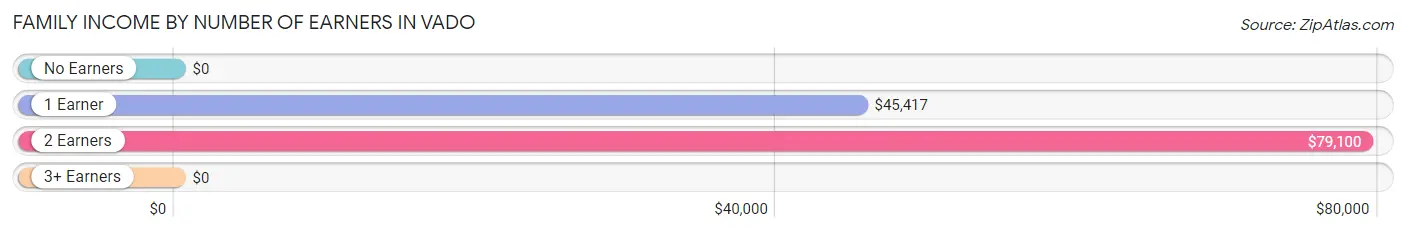
| Number of Earners | # Families | Median Income |
| No Earners | 82 (10.9%) | $0 |
| 1 Earner | 356 (47.3%) | $45,417 |
| 2 Earners | 296 (39.3%) | $79,100 |
| 3+ Earners | 19 (2.5%) | $0 |
| Total | 753 (100.0%) | $47,474 |
Household Income in Vado
Household Income Brackets in Vado
With 212 households falling in the category, the $75,000 to $99,999 income range is the most frequent in Vado, accounting for 23.8% of all households.
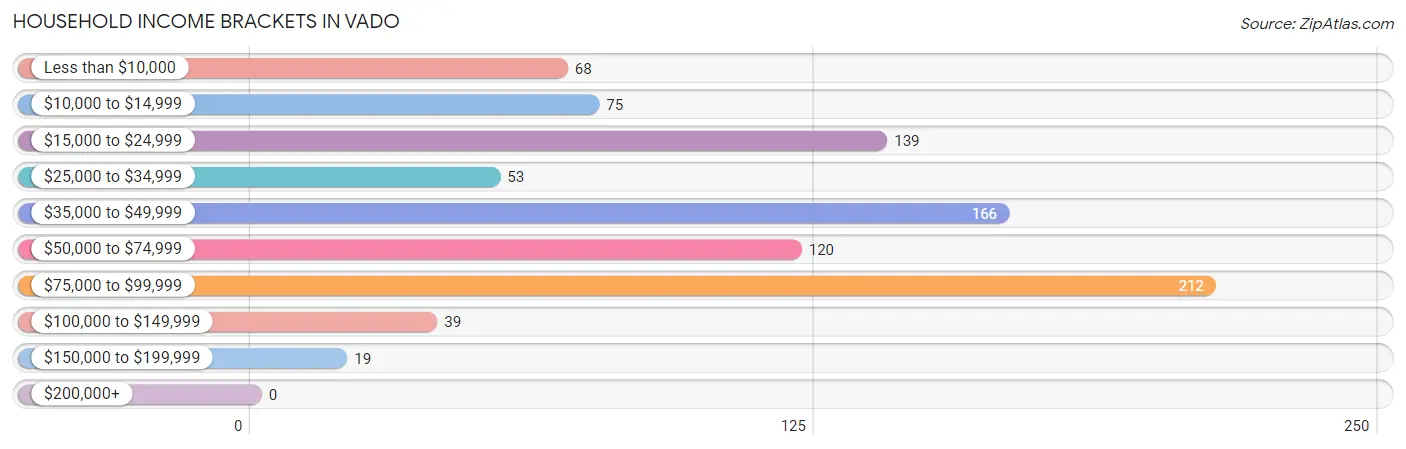
| Income Bracket | # Households | % Households |
| Less than $10,000 | 68 | 7.6% |
| $10,000 to $14,999 | 75 | 8.4% |
| $15,000 to $24,999 | 139 | 15.6% |
| $25,000 to $34,999 | 53 | 5.9% |
| $35,000 to $49,999 | 166 | 18.6% |
| $50,000 to $74,999 | 120 | 13.5% |
| $75,000 to $99,999 | 212 | 23.8% |
| $100,000 to $149,999 | 39 | 4.4% |
| $150,000 to $199,999 | 19 | 2.1% |
| $200,000+ | 0 | 0.0% |
Household Income by Householder Age in Vado
The median household income in Vado is $46,380, with the highest median household income of $49,706 found in the 25 to 44 years age bracket for the primary householder. A total of 430 households (48.3%) fall into this category.
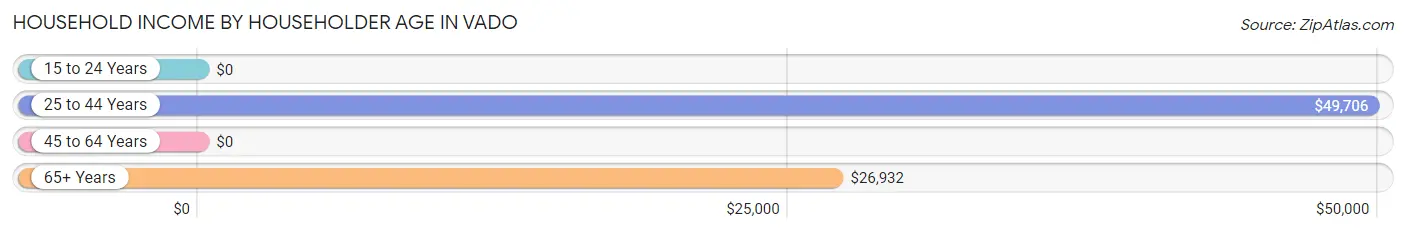
| Income Bracket | # Households | Median Income |
| 15 to 24 Years | 0 (0.0%) | $0 |
| 25 to 44 Years | 430 (48.3%) | $49,706 |
| 45 to 64 Years | 284 (31.9%) | $0 |
| 65+ Years | 177 (19.9%) | $26,932 |
| Total | 891 (100.0%) | $46,380 |
Poverty in Vado
Income Below Poverty by Sex and Age in Vado
With 29.7% poverty level for males and 39.4% for females among the residents of Vado, under 5 year old males and 5 year old females are the most vulnerable to poverty, with 85 males (75.9%) and 15 females (100.0%) in their respective age groups living below the poverty level.
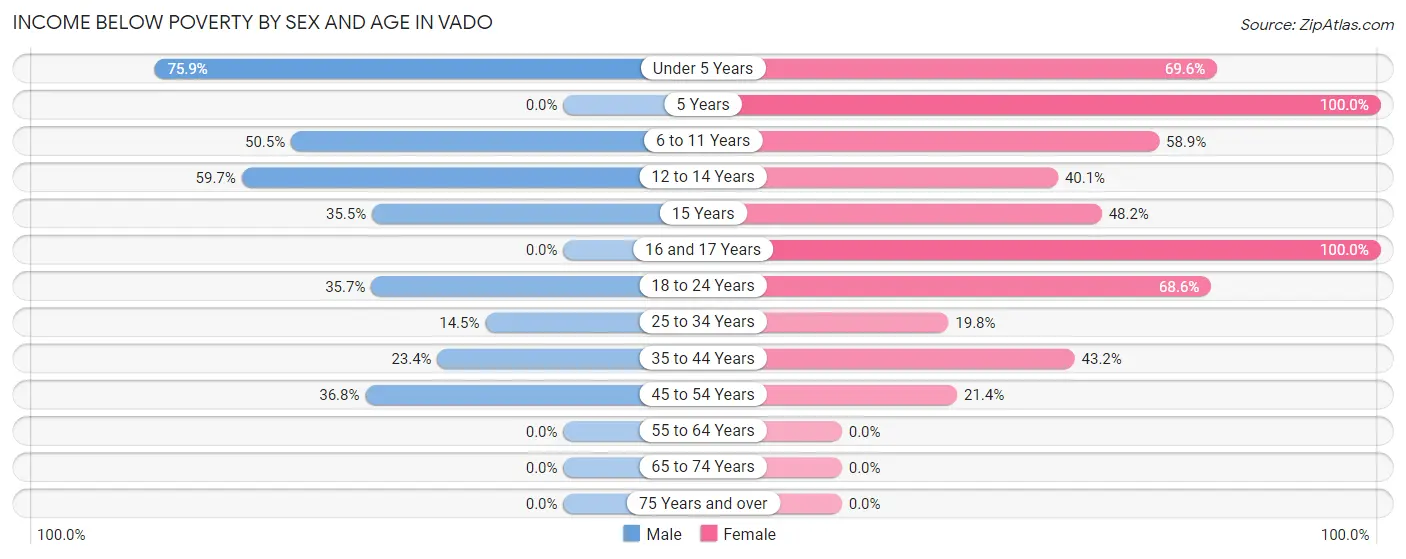
| Age Bracket | Male | Female |
| Under 5 Years | 85 (75.9%) | 78 (69.6%) |
| 5 Years | 0 (0.0%) | 15 (100.0%) |
| 6 to 11 Years | 140 (50.5%) | 96 (58.9%) |
| 12 to 14 Years | 86 (59.7%) | 67 (40.1%) |
| 15 Years | 38 (35.5%) | 41 (48.2%) |
| 16 and 17 Years | 0 (0.0%) | 15 (100.0%) |
| 18 to 24 Years | 46 (35.7%) | 85 (68.5%) |
| 25 to 34 Years | 40 (14.5%) | 18 (19.8%) |
| 35 to 44 Years | 86 (23.4%) | 124 (43.2%) |
| 45 to 54 Years | 50 (36.8%) | 37 (21.4%) |
| 55 to 64 Years | 0 (0.0%) | 0 (0.0%) |
| 65 to 74 Years | 0 (0.0%) | 0 (0.0%) |
| 75 Years and over | 0 (0.0%) | 0 (0.0%) |
| Total | 571 (29.7%) | 576 (39.4%) |
Income Above Poverty by Sex and Age in Vado
According to the poverty statistics in Vado, males aged 16 and 17 years and females aged 55 to 64 years are the age groups that are most secure financially, with 100.0% of males and 100.0% of females in these age groups living above the poverty line.
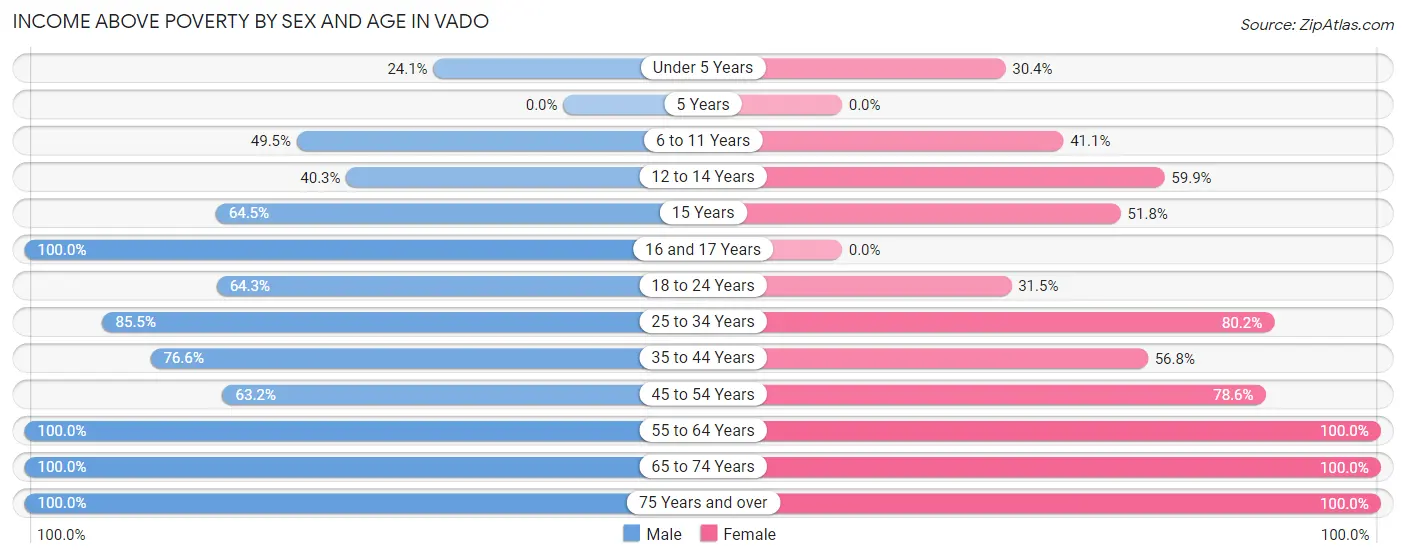
| Age Bracket | Male | Female |
| Under 5 Years | 27 (24.1%) | 34 (30.4%) |
| 5 Years | 0 (0.0%) | 0 (0.0%) |
| 6 to 11 Years | 137 (49.5%) | 67 (41.1%) |
| 12 to 14 Years | 58 (40.3%) | 100 (59.9%) |
| 15 Years | 69 (64.5%) | 44 (51.8%) |
| 16 and 17 Years | 125 (100.0%) | 0 (0.0%) |
| 18 to 24 Years | 83 (64.3%) | 39 (31.5%) |
| 25 to 34 Years | 236 (85.5%) | 73 (80.2%) |
| 35 to 44 Years | 282 (76.6%) | 163 (56.8%) |
| 45 to 54 Years | 86 (63.2%) | 136 (78.6%) |
| 55 to 64 Years | 170 (100.0%) | 99 (100.0%) |
| 65 to 74 Years | 74 (100.0%) | 95 (100.0%) |
| 75 Years and over | 6 (100.0%) | 36 (100.0%) |
| Total | 1,353 (70.3%) | 886 (60.6%) |
Income Below Poverty Among Married-Couple Families in Vado
The poverty statistics for married-couple families in Vado show that 23.1% or 109 of the total 472 families live below the poverty line. Families with 3 or 4 children have the highest poverty rate of 100.0%, comprising of 50 families. On the other hand, families with no children have the lowest poverty rate of 0.0%, which includes 0 families.
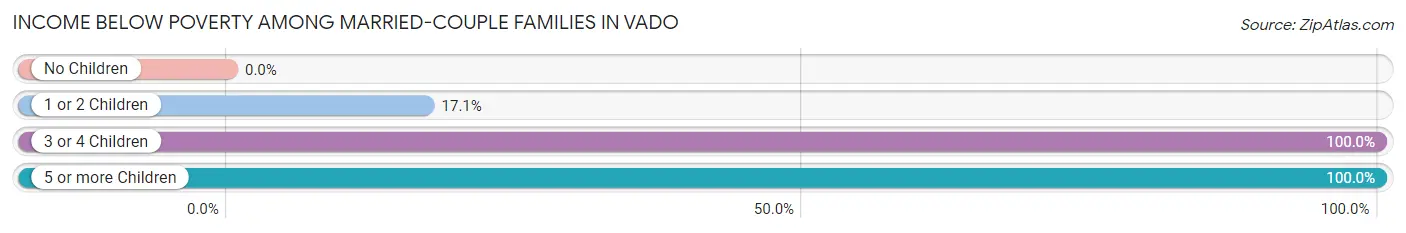
| Children | Above Poverty | Below Poverty |
| No Children | 145 (100.0%) | 0 (0.0%) |
| 1 or 2 Children | 218 (82.9%) | 45 (17.1%) |
| 3 or 4 Children | 0 (0.0%) | 50 (100.0%) |
| 5 or more Children | 0 (0.0%) | 14 (100.0%) |
| Total | 363 (76.9%) | 109 (23.1%) |
Income Below Poverty Among Single-Parent Households in Vado
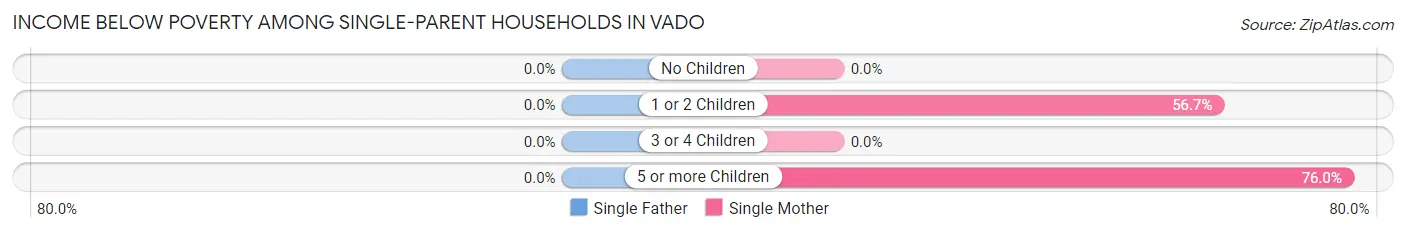
| Children | Single Father | Single Mother |
| No Children | 0 (0.0%) | 0 (0.0%) |
| 1 or 2 Children | 0 (0.0%) | 55 (56.7%) |
| 3 or 4 Children | 0 (0.0%) | 0 (0.0%) |
| 5 or more Children | 0 (0.0%) | 19 (76.0%) |
| Total | 0 (0.0%) | 74 (40.2%) |
Income Below Poverty Among Married-Couple vs Single-Parent Households in Vado
The poverty data for Vado shows that 109 of the married-couple family households (23.1%) and 74 of the single-parent households (26.3%) are living below the poverty level. Within the married-couple family households, those with 3 or 4 children have the highest poverty rate, with 50 households (100.0%) falling below the poverty line. Among the single-parent households, those with 5 or more children have the highest poverty rate, with 19 household (76.0%) living below poverty.
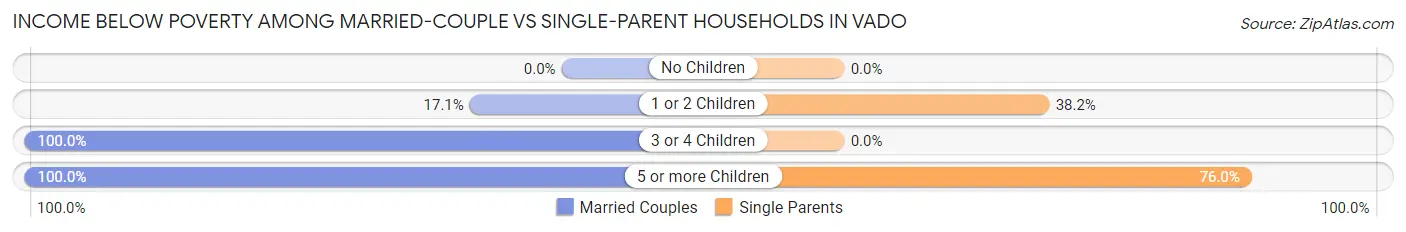
| Children | Married-Couple Families | Single-Parent Households |
| No Children | 0 (0.0%) | 0 (0.0%) |
| 1 or 2 Children | 45 (17.1%) | 55 (38.2%) |
| 3 or 4 Children | 50 (100.0%) | 0 (0.0%) |
| 5 or more Children | 14 (100.0%) | 19 (76.0%) |
| Total | 109 (23.1%) | 74 (26.3%) |
Race in Vado
The most populous races in Vado are Hispanic or Latino (3,219 | 95.1%), Some other Race (1,926 | 56.9%), and White / Caucasian (1,307 | 38.6%).
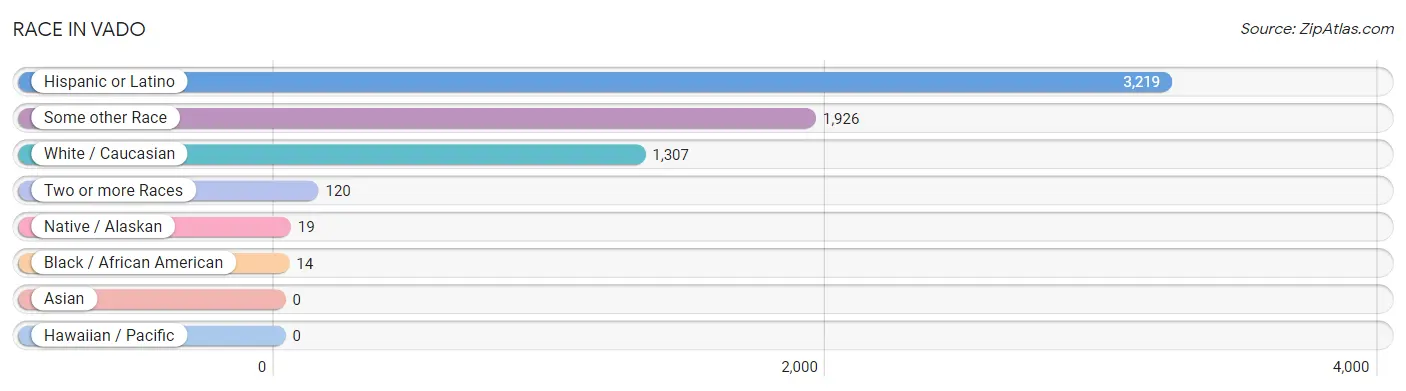
| Race | # Population | % Population |
| Asian | 0 | 0.0% |
| Black / African American | 14 | 0.4% |
| Hawaiian / Pacific | 0 | 0.0% |
| Hispanic or Latino | 3,219 | 95.1% |
| Native / Alaskan | 19 | 0.6% |
| White / Caucasian | 1,307 | 38.6% |
| Two or more Races | 120 | 3.5% |
| Some other Race | 1,926 | 56.9% |
| Total | 3,386 | 100.0% |
Ancestry in Vado
The most populous ancestries reported in Vado are Mexican (3,014 | 89.0%), Spaniard (100 | 2.9%), German (80 | 2.4%), Irish (63 | 1.9%), and English (37 | 1.1%), together accounting for 97.3% of all Vado residents.
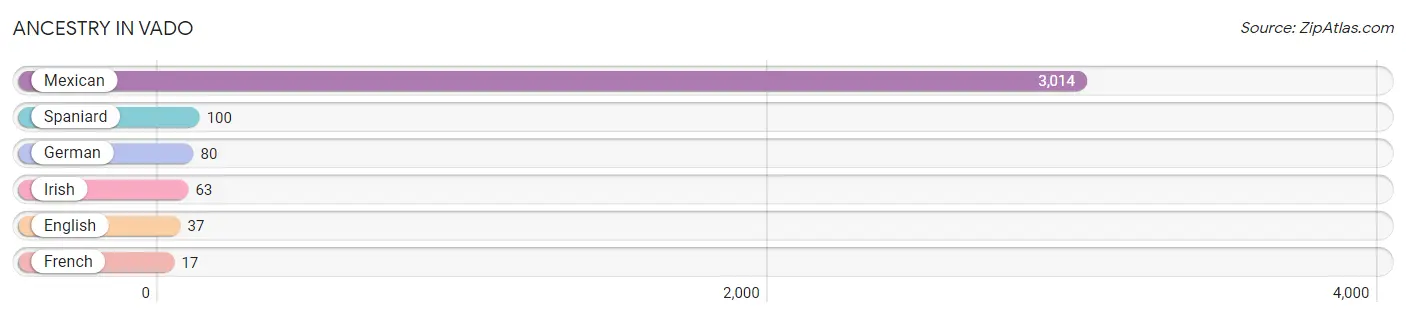
| Ancestry | # Population | % Population |
| English | 37 | 1.1% |
| French | 17 | 0.5% |
| German | 80 | 2.4% |
| Irish | 63 | 1.9% |
| Mexican | 3,014 | 89.0% |
| Spaniard | 100 | 2.9% | View All 6 Rows |
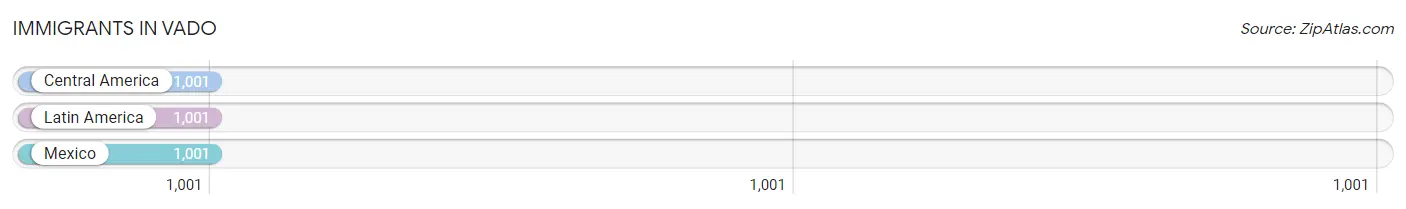
Immigrants in Vado
The most numerous immigrant groups reported in Vado came from Central America (1,001 | 29.6%), Latin America (1,001 | 29.6%), and Mexico (1,001 | 29.6%), together accounting for 88.7% of all Vado residents.
| Immigration Origin | # Population | % Population |
| Central America | 1,001 | 29.6% |
| Latin America | 1,001 | 29.6% |
| Mexico | 1,001 | 29.6% | View All 3 Rows |
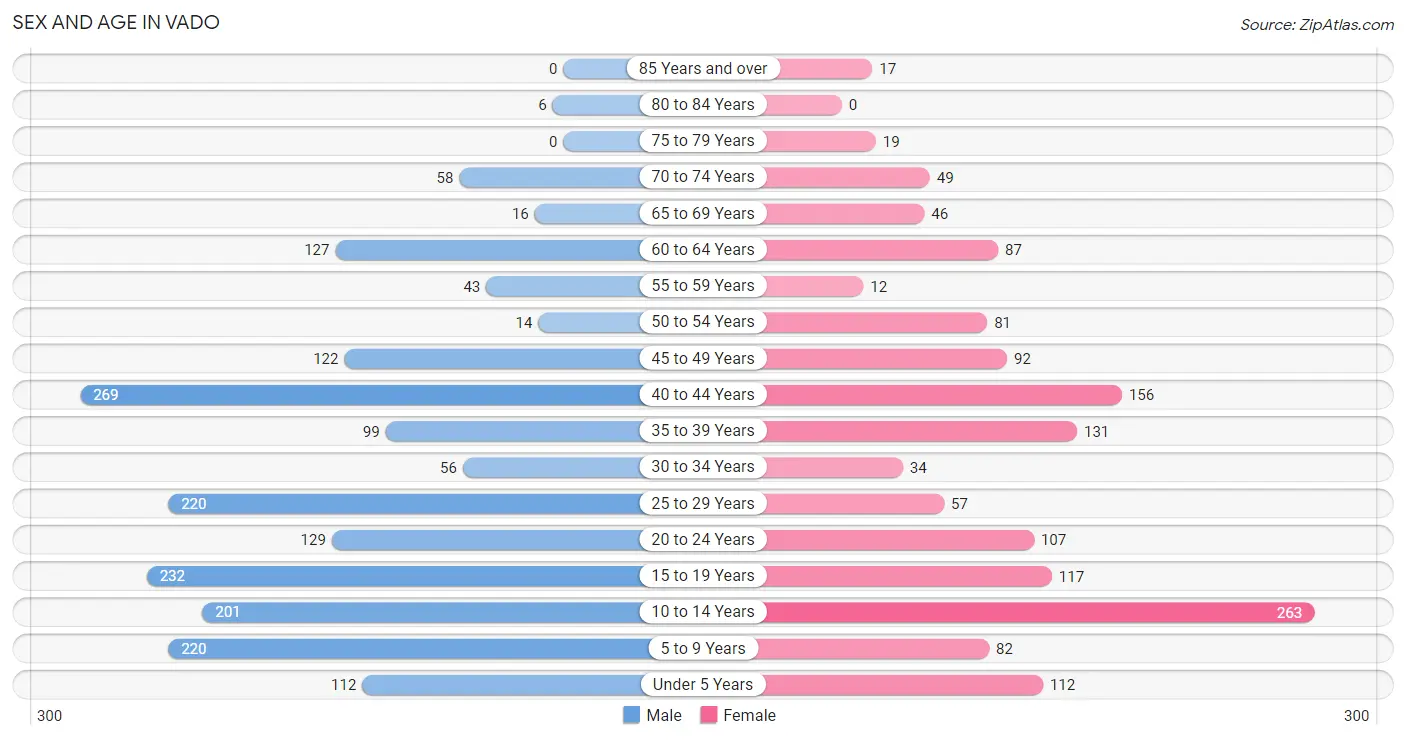
Sex and Age in Vado
Sex and Age in Vado
The most populous age groups in Vado are 40 to 44 Years (269 | 14.0%) for men and 10 to 14 Years (263 | 18.0%) for women.
| Age Bracket | Male | Female |
| Under 5 Years | 112 (5.8%) | 112 (7.7%) |
| 5 to 9 Years | 220 (11.4%) | 82 (5.6%) |
| 10 to 14 Years | 201 (10.4%) | 263 (18.0%) |
| 15 to 19 Years | 232 (12.1%) | 117 (8.0%) |
| 20 to 24 Years | 129 (6.7%) | 107 (7.3%) |
| 25 to 29 Years | 220 (11.4%) | 57 (3.9%) |
| 30 to 34 Years | 56 (2.9%) | 34 (2.3%) |
| 35 to 39 Years | 99 (5.1%) | 131 (9.0%) |
| 40 to 44 Years | 269 (14.0%) | 156 (10.7%) |
| 45 to 49 Years | 122 (6.3%) | 92 (6.3%) |
| 50 to 54 Years | 14 (0.7%) | 81 (5.5%) |
| 55 to 59 Years | 43 (2.2%) | 12 (0.8%) |
| 60 to 64 Years | 127 (6.6%) | 87 (5.9%) |
| 65 to 69 Years | 16 (0.8%) | 46 (3.2%) |
| 70 to 74 Years | 58 (3.0%) | 49 (3.4%) |
| 75 to 79 Years | 0 (0.0%) | 19 (1.3%) |
| 80 to 84 Years | 6 (0.3%) | 0 (0.0%) |
| 85 Years and over | 0 (0.0%) | 17 (1.2%) |
| Total | 1,924 (100.0%) | 1,462 (100.0%) |
Families and Households in Vado
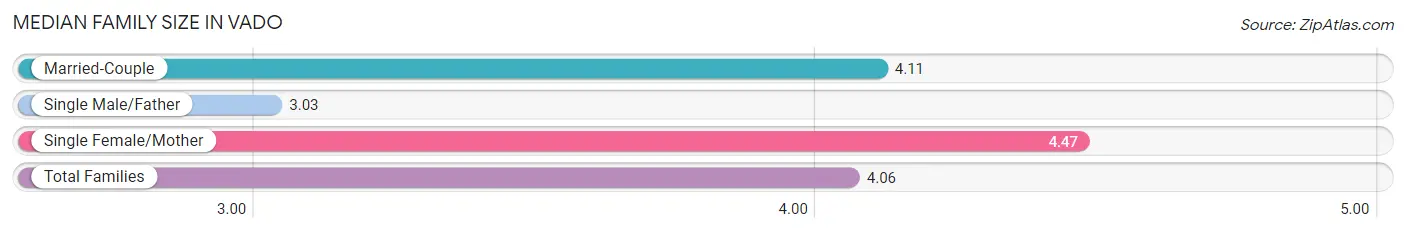
Median Family Size in Vado
The median family size in Vado is 4.06 persons per family, with single female/mother families (184 | 24.4%) accounting for the largest median family size of 4.47 persons per family. On the other hand, single male/father families (97 | 12.9%) represent the smallest median family size with 3.03 persons per family.
| Family Type | # Families | Family Size |
| Married-Couple | 472 (62.7%) | 4.11 |
| Single Male/Father | 97 (12.9%) | 3.03 |
| Single Female/Mother | 184 (24.4%) | 4.47 |
| Total Families | 753 (100.0%) | 4.06 |
Median Household Size in Vado
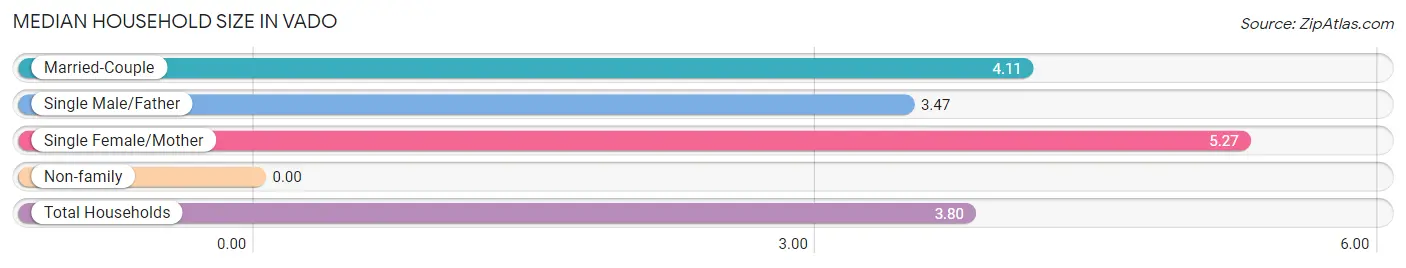
| Household Type | # Households | Household Size |
| Married-Couple | 472 (53.0%) | 4.11 |
| Single Male/Father | 97 (10.9%) | 3.47 |
| Single Female/Mother | 184 (20.6%) | 5.27 |
| Non-family | 138 (15.5%) | - |
| Total Households | 891 (100.0%) | 3.80 |
Household Size by Marriage Status in Vado
Out of a total of 891 households in Vado, 753 (84.5%) are family households, while 138 (15.5%) are nonfamily households. The most numerous type of family households are 4-person households, comprising 245, and the most common type of nonfamily households are 1-person households, comprising 138.
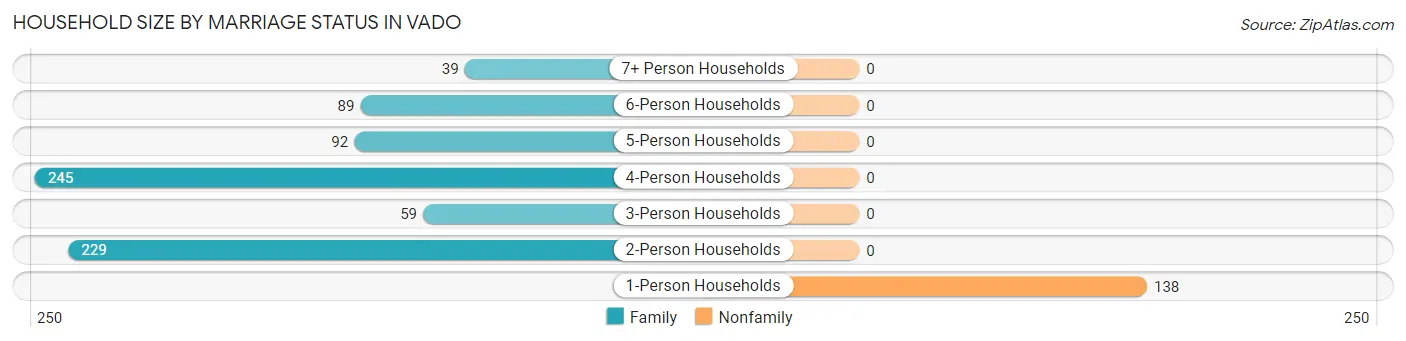
| Household Size | Family Households | Nonfamily Households |
| 1-Person Households | - | 138 (15.5%) |
| 2-Person Households | 229 (25.7%) | 0 (0.0%) |
| 3-Person Households | 59 (6.6%) | 0 (0.0%) |
| 4-Person Households | 245 (27.5%) | 0 (0.0%) |
| 5-Person Households | 92 (10.3%) | 0 (0.0%) |
| 6-Person Households | 89 (10.0%) | 0 (0.0%) |
| 7+ Person Households | 39 (4.4%) | 0 (0.0%) |
| Total | 753 (84.5%) | 138 (15.5%) |
Female Fertility in Vado
Fertility by Age in Vado
Average fertility rate in Vado is 30.0 births per 1,000 women. Women in the age bracket of 20 to 34 years have the highest fertility rate with 106.0 births per 1,000 women. Women in the age bracket of 20 to 34 years acount for 100.0% of all women with births.
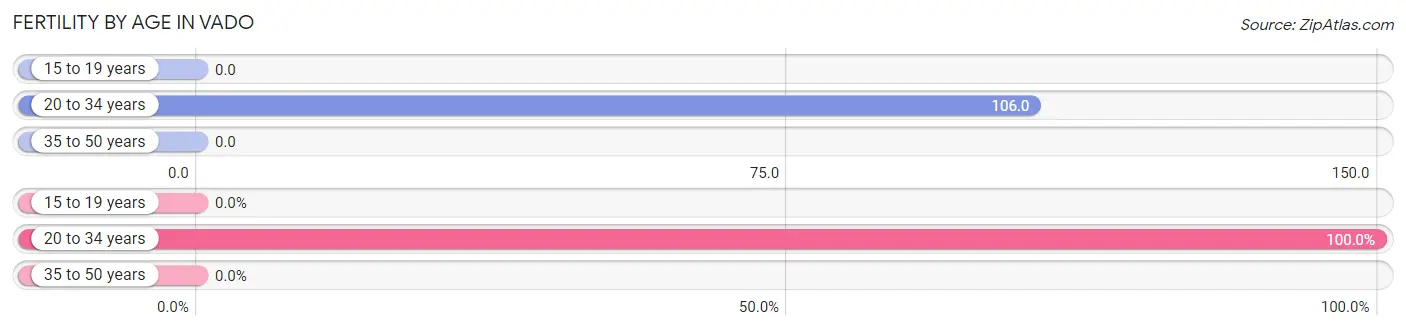
| Age Bracket | Women with Births | Births / 1,000 Women |
| 15 to 19 years | 0 (0.0%) | 0.0 |
| 20 to 34 years | 21 (100.0%) | 106.0 |
| 35 to 50 years | 0 (0.0%) | 0.0 |
| Total | 21 (100.0%) | 30.0 |
Fertility by Age by Marriage Status in Vado
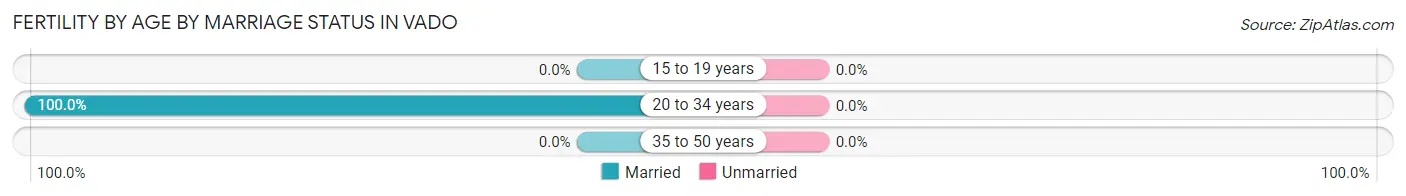
| Age Bracket | Married | Unmarried |
| 15 to 19 years | 0 (0.0%) | 0 (0.0%) |
| 20 to 34 years | 21 (100.0%) | 0 (0.0%) |
| 35 to 50 years | 0 (0.0%) | 0 (0.0%) |
| Total | 21 (100.0%) | 0 (0.0%) |
Fertility by Education in Vado
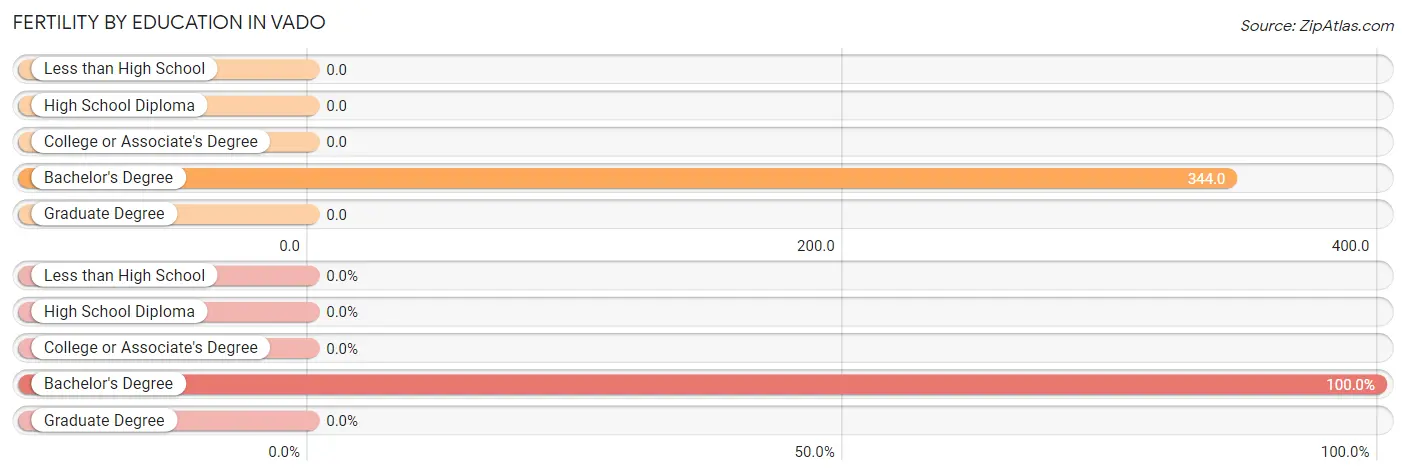
| Educational Attainment | Women with Births | Births / 1,000 Women |
| Less than High School | 0 (0.0%) | 0.0 |
| High School Diploma | 0 (0.0%) | 0.0 |
| College or Associate's Degree | 0 (0.0%) | 0.0 |
| Bachelor's Degree | 21 (100.0%) | 344.0 |
| Graduate Degree | 0 (0.0%) | 0.0 |
| Total | 21 (100.0%) | 30.0 |
Fertility by Education by Marriage Status in Vado
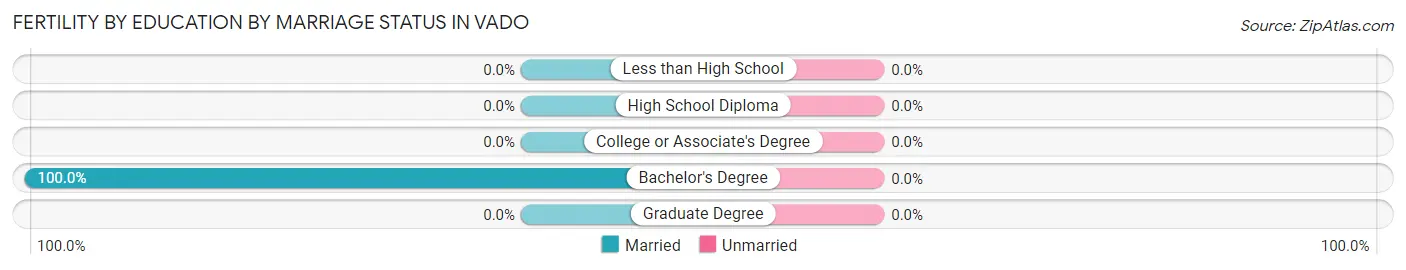
| Educational Attainment | Married | Unmarried |
| Less than High School | 0 (0.0%) | 0 (0.0%) |
| High School Diploma | 0 (0.0%) | 0 (0.0%) |
| College or Associate's Degree | 0 (0.0%) | 0 (0.0%) |
| Bachelor's Degree | 21 (100.0%) | 0 (0.0%) |
| Graduate Degree | 0 (0.0%) | 0 (0.0%) |
| Total | 21 (100.0%) | 0 (0.0%) |
Employment Characteristics in Vado
Employment by Class of Employer in Vado
Among the 1,246 employed individuals in Vado, private company employees (872 | 70.0%), state government employees (117 | 9.4%), and self-employed (not incorporated) (91 | 7.3%) make up the most common classes of employment.
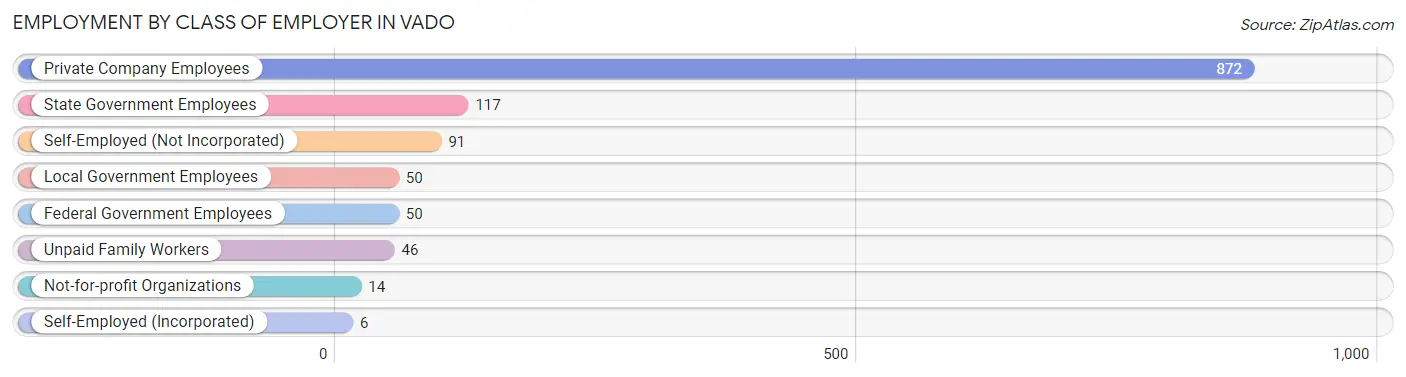
| Employer Class | # Employees | % Employees |
| Private Company Employees | 872 | 70.0% |
| Self-Employed (Incorporated) | 6 | 0.5% |
| Self-Employed (Not Incorporated) | 91 | 7.3% |
| Not-for-profit Organizations | 14 | 1.1% |
| Local Government Employees | 50 | 4.0% |
| State Government Employees | 117 | 9.4% |
| Federal Government Employees | 50 | 4.0% |
| Unpaid Family Workers | 46 | 3.7% |
| Total | 1,246 | 100.0% |
Employment Status by Age in Vado
According to the labor force statistics for Vado, out of the total population over 16 years of age (2,204), 60.5% or 1,333 individuals are in the labor force, with 6.5% or 87 of them unemployed. The age group with the highest labor force participation rate is 25 to 29 years, with 100.0% or 277 individuals in the labor force. Within the labor force, the 30 to 34 years age range has the highest percentage of unemployed individuals, with 54.8% or 40 of them being unemployed.
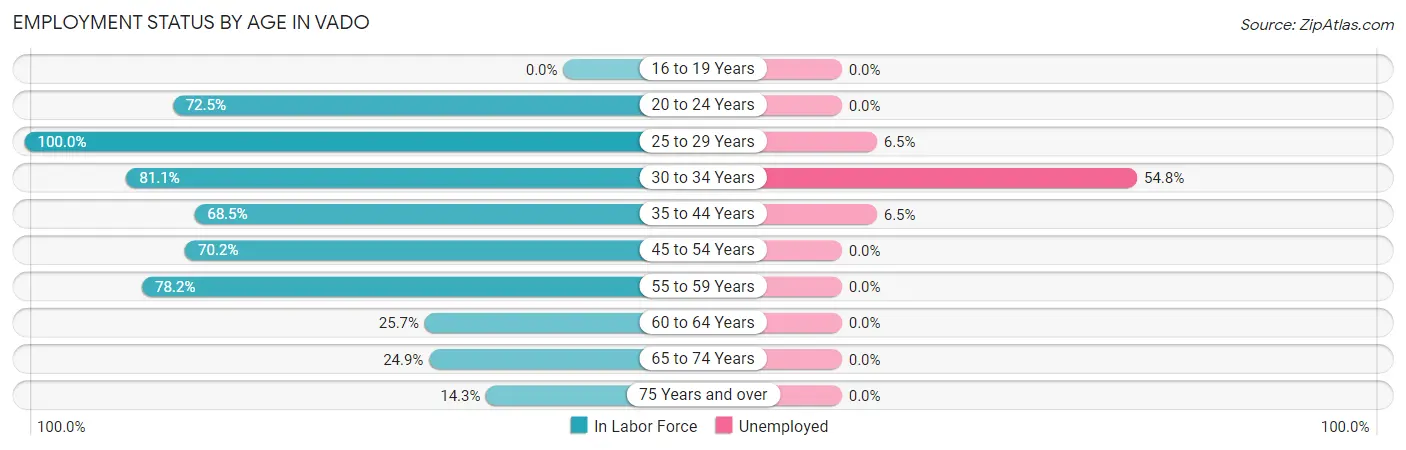
| Age Bracket | In Labor Force | Unemployed |
| 16 to 19 Years | 0 (0.0%) | 0 (0.0%) |
| 20 to 24 Years | 171 (72.5%) | 0 (0.0%) |
| 25 to 29 Years | 277 (100.0%) | 18 (6.5%) |
| 30 to 34 Years | 73 (81.1%) | 40 (54.8%) |
| 35 to 44 Years | 449 (68.5%) | 29 (6.5%) |
| 45 to 54 Years | 217 (70.2%) | 0 (0.0%) |
| 55 to 59 Years | 43 (78.2%) | 0 (0.0%) |
| 60 to 64 Years | 55 (25.7%) | 0 (0.0%) |
| 65 to 74 Years | 42 (24.9%) | 0 (0.0%) |
| 75 Years and over | 6 (14.3%) | 0 (0.0%) |
| Total | 1,333 (60.5%) | 87 (6.5%) |
Employment Status by Educational Attainment in Vado
According to labor force statistics for Vado, 69.6% of individuals (1,114) out of the total population between 25 and 64 years of age (1,600) are in the labor force, with 7.8% or 87 of them being unemployed. The group with the highest labor force participation rate are those with the educational attainment of college / associate degree, with 88.9% or 394 individuals in the labor force. Within the labor force, individuals with college / associate degree education have the highest percentage of unemployment, with 11.9% or 47 of them being unemployed.
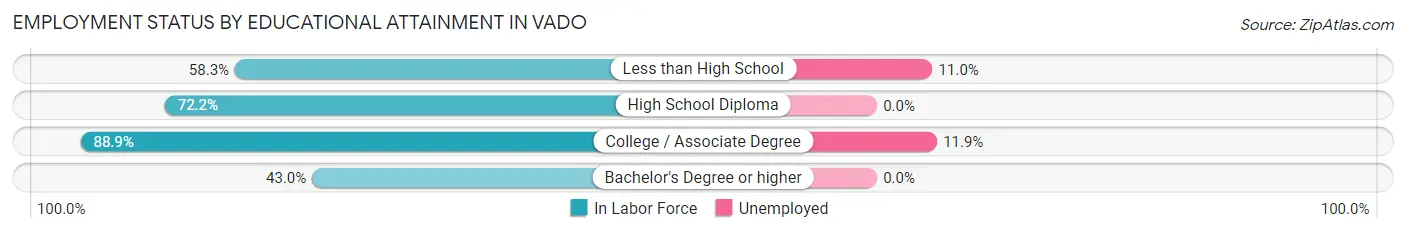
| Educational Attainment | In Labor Force | Unemployed |
| Less than High School | 362 (58.3%) | 68 (11.0%) |
| High School Diploma | 315 (72.2%) | 0 (0.0%) |
| College / Associate Degree | 394 (88.9%) | 53 (11.9%) |
| Bachelor's Degree or higher | 43 (43.0%) | 0 (0.0%) |
| Total | 1,114 (69.6%) | 125 (7.8%) |
Employment Occupations by Sex in Vado
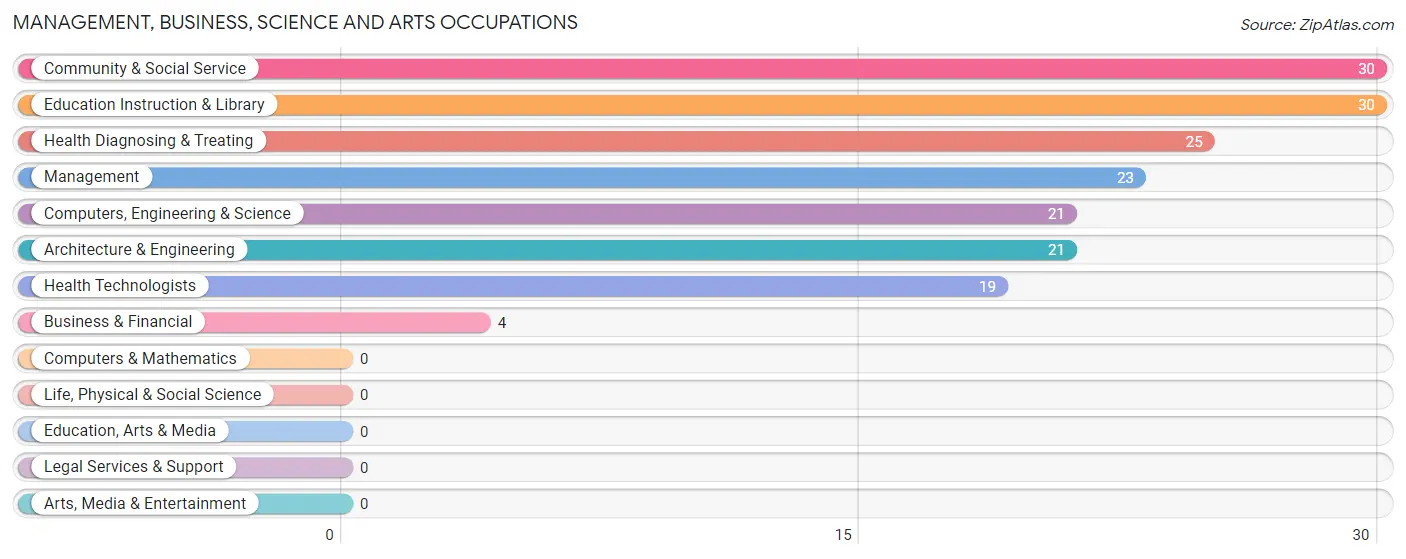
Management, Business, Science and Arts Occupations
The most common Management, Business, Science and Arts occupations in Vado are Community & Social Service (30 | 2.4%), Education Instruction & Library (30 | 2.4%), Health Diagnosing & Treating (25 | 2.0%), Management (23 | 1.8%), and Computers, Engineering & Science (21 | 1.7%).
Management, Business, Science and Arts Occupations by Sex
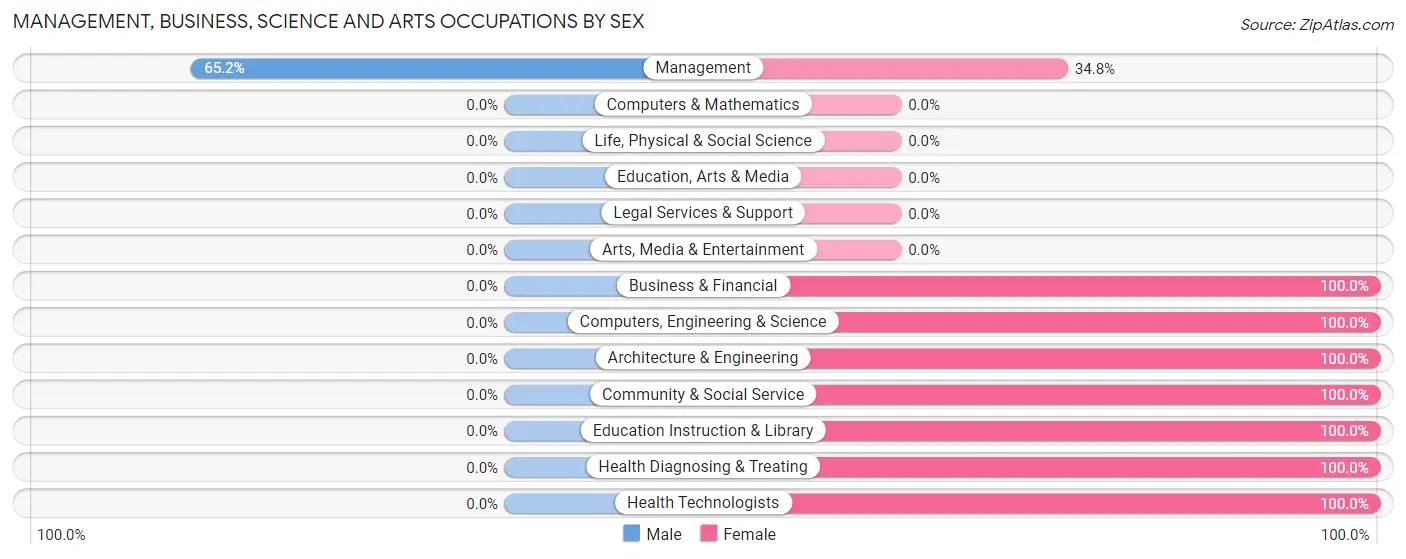
| Occupation | Male | Female |
| Management | 15 (65.2%) | 8 (34.8%) |
| Business & Financial | 0 (0.0%) | 4 (100.0%) |
| Computers, Engineering & Science | 0 (0.0%) | 21 (100.0%) |
| Computers & Mathematics | 0 (0.0%) | 0 (0.0%) |
| Architecture & Engineering | 0 (0.0%) | 21 (100.0%) |
| Life, Physical & Social Science | 0 (0.0%) | 0 (0.0%) |
| Community & Social Service | 0 (0.0%) | 30 (100.0%) |
| Education, Arts & Media | 0 (0.0%) | 0 (0.0%) |
| Legal Services & Support | 0 (0.0%) | 0 (0.0%) |
| Education Instruction & Library | 0 (0.0%) | 30 (100.0%) |
| Arts, Media & Entertainment | 0 (0.0%) | 0 (0.0%) |
| Health Diagnosing & Treating | 0 (0.0%) | 25 (100.0%) |
| Health Technologists | 0 (0.0%) | 19 (100.0%) |
| Total (Category) | 15 (14.6%) | 88 (85.4%) |
| Total (Overall) | 931 (74.7%) | 315 (25.3%) |
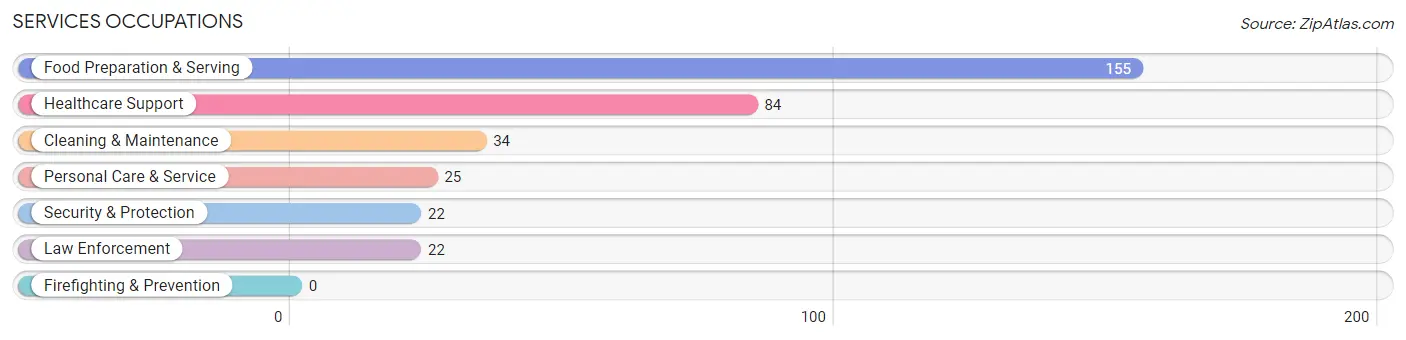
Services Occupations
The most common Services occupations in Vado are Food Preparation & Serving (155 | 12.4%), Healthcare Support (84 | 6.7%), Cleaning & Maintenance (34 | 2.7%), Personal Care & Service (25 | 2.0%), and Security & Protection (22 | 1.8%).
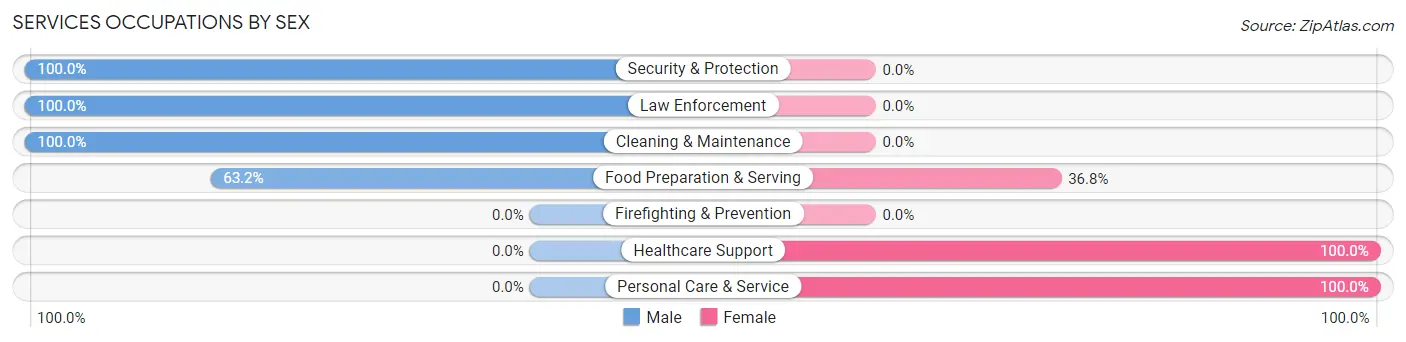
Services Occupations by Sex
Within the Services occupations in Vado, the most male-oriented occupations are Security & Protection (100.0%), Law Enforcement (100.0%), and Cleaning & Maintenance (100.0%), while the most female-oriented occupations are Healthcare Support (100.0%), Personal Care & Service (100.0%), and Food Preparation & Serving (36.8%).
| Occupation | Male | Female |
| Healthcare Support | 0 (0.0%) | 84 (100.0%) |
| Security & Protection | 22 (100.0%) | 0 (0.0%) |
| Firefighting & Prevention | 0 (0.0%) | 0 (0.0%) |
| Law Enforcement | 22 (100.0%) | 0 (0.0%) |
| Food Preparation & Serving | 98 (63.2%) | 57 (36.8%) |
| Cleaning & Maintenance | 34 (100.0%) | 0 (0.0%) |
| Personal Care & Service | 0 (0.0%) | 25 (100.0%) |
| Total (Category) | 154 (48.1%) | 166 (51.9%) |
| Total (Overall) | 931 (74.7%) | 315 (25.3%) |
Sales and Office Occupations
The most common Sales and Office occupations in Vado are Sales & Related (62 | 5.0%), and Office & Administration (40 | 3.2%).
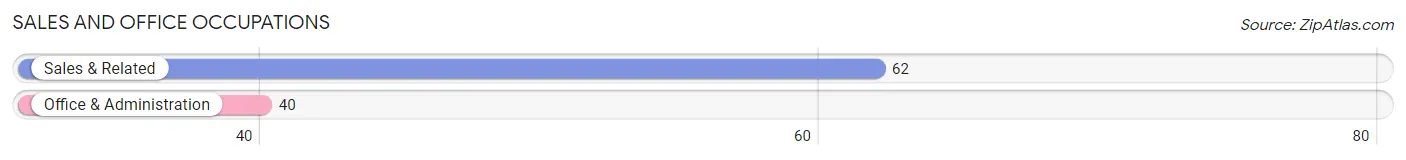
Sales and Office Occupations by Sex
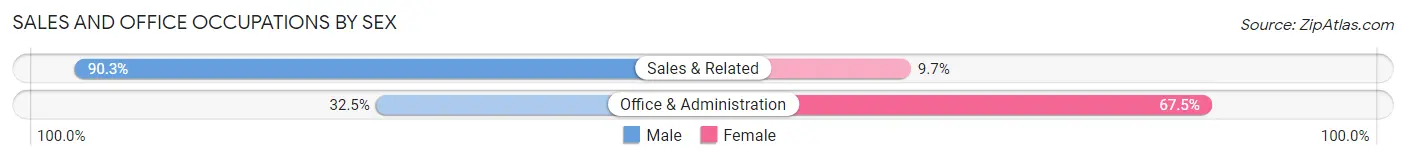
| Occupation | Male | Female |
| Sales & Related | 56 (90.3%) | 6 (9.7%) |
| Office & Administration | 13 (32.5%) | 27 (67.5%) |
| Total (Category) | 69 (67.6%) | 33 (32.4%) |
| Total (Overall) | 931 (74.7%) | 315 (25.3%) |
Natural Resources, Construction and Maintenance Occupations
The most common Natural Resources, Construction and Maintenance occupations in Vado are Construction & Extraction (316 | 25.4%), Installation, Maintenance & Repair (95 | 7.6%), and Farming, Fishing & Forestry (53 | 4.3%).
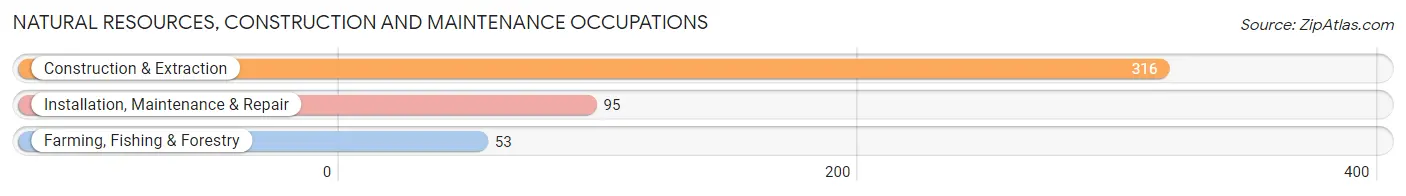
Natural Resources, Construction and Maintenance Occupations by Sex
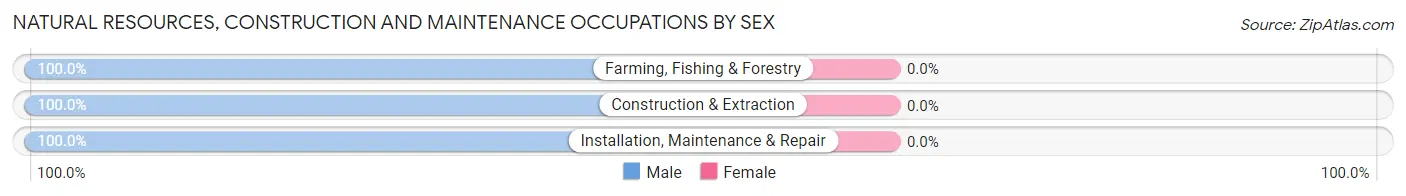
| Occupation | Male | Female |
| Farming, Fishing & Forestry | 53 (100.0%) | 0 (0.0%) |
| Construction & Extraction | 316 (100.0%) | 0 (0.0%) |
| Installation, Maintenance & Repair | 95 (100.0%) | 0 (0.0%) |
| Total (Category) | 464 (100.0%) | 0 (0.0%) |
| Total (Overall) | 931 (74.7%) | 315 (25.3%) |
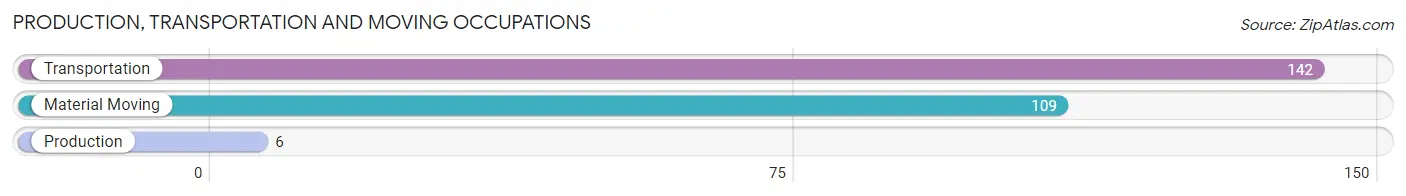
Production, Transportation and Moving Occupations
The most common Production, Transportation and Moving occupations in Vado are Transportation (142 | 11.4%), Material Moving (109 | 8.7%), and Production (6 | 0.5%).
Production, Transportation and Moving Occupations by Sex
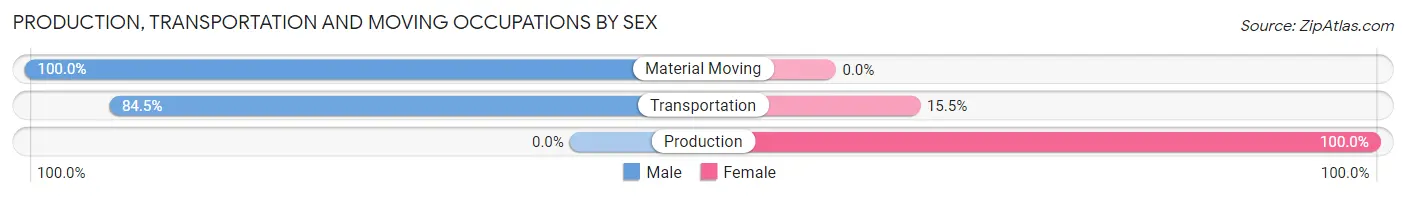
| Occupation | Male | Female |
| Production | 0 (0.0%) | 6 (100.0%) |
| Transportation | 120 (84.5%) | 22 (15.5%) |
| Material Moving | 109 (100.0%) | 0 (0.0%) |
| Total (Category) | 229 (89.1%) | 28 (10.9%) |
| Total (Overall) | 931 (74.7%) | 315 (25.3%) |
Employment Industries by Sex in Vado
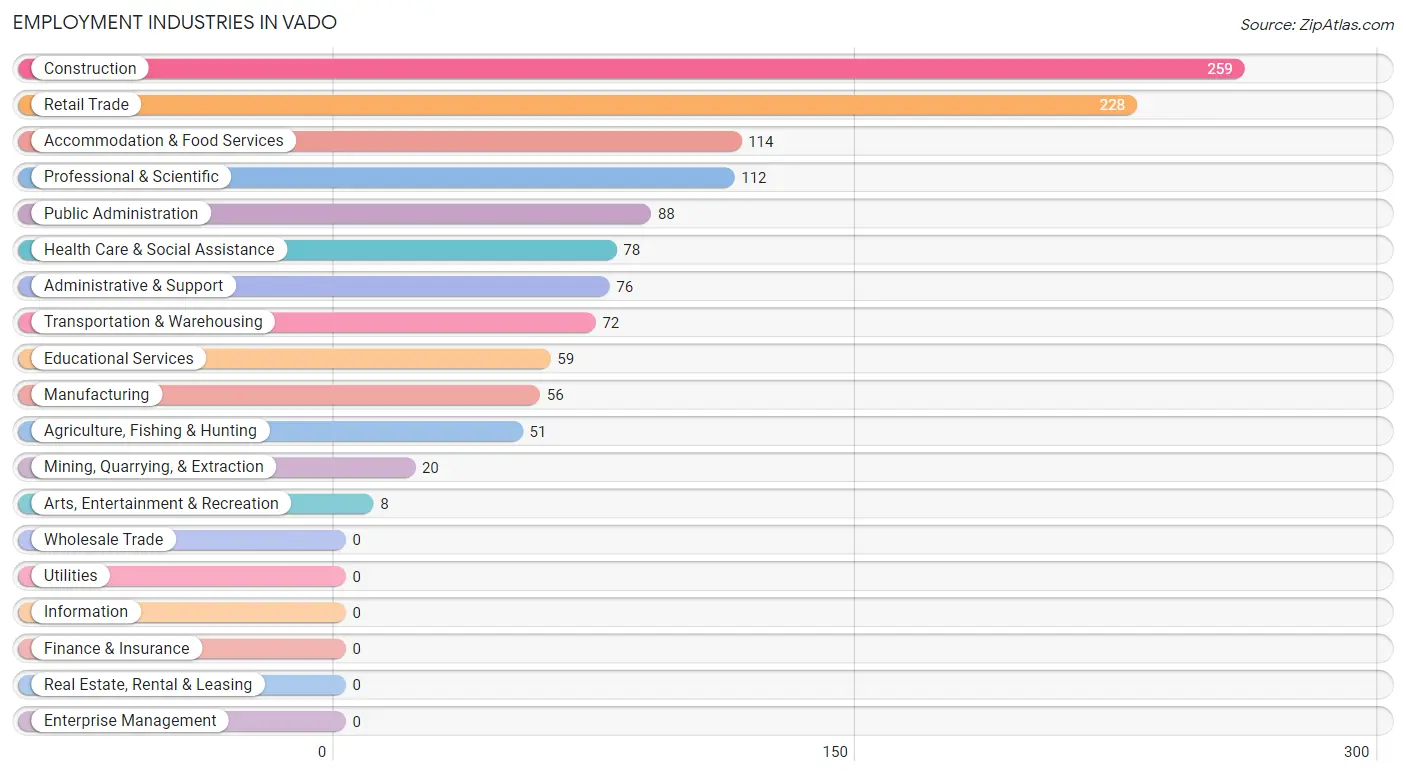
Employment Industries in Vado
The major employment industries in Vado include Construction (259 | 20.8%), Retail Trade (228 | 18.3%), Accommodation & Food Services (114 | 9.1%), Professional & Scientific (112 | 9.0%), and Public Administration (88 | 7.1%).
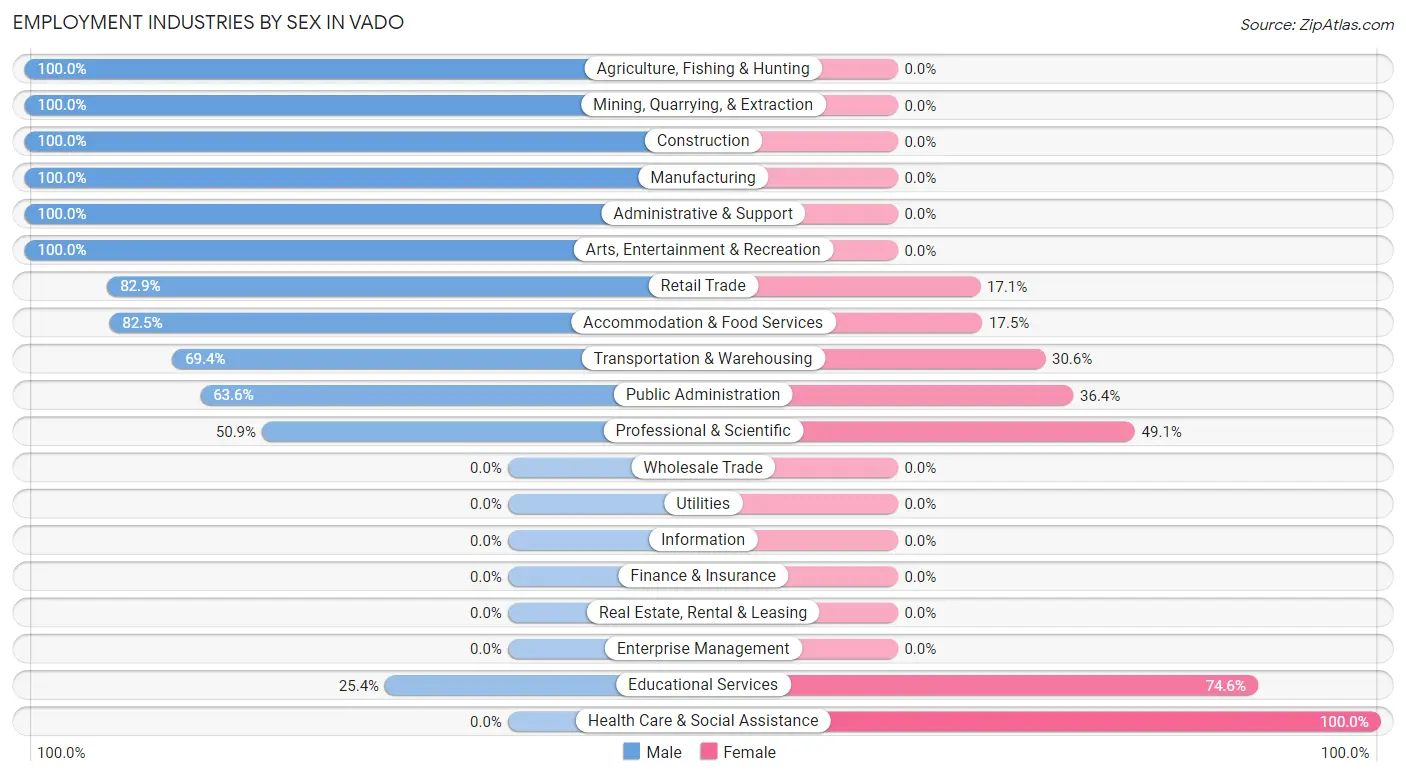
Employment Industries by Sex in Vado
The Vado industries that see more men than women are Agriculture, Fishing & Hunting (100.0%), Mining, Quarrying, & Extraction (100.0%), and Construction (100.0%), whereas the industries that tend to have a higher number of women are Health Care & Social Assistance (100.0%), Educational Services (74.6%), and Professional & Scientific (49.1%).
| Industry | Male | Female |
| Agriculture, Fishing & Hunting | 51 (100.0%) | 0 (0.0%) |
| Mining, Quarrying, & Extraction | 20 (100.0%) | 0 (0.0%) |
| Construction | 259 (100.0%) | 0 (0.0%) |
| Manufacturing | 56 (100.0%) | 0 (0.0%) |
| Wholesale Trade | 0 (0.0%) | 0 (0.0%) |
| Retail Trade | 189 (82.9%) | 39 (17.1%) |
| Transportation & Warehousing | 50 (69.4%) | 22 (30.6%) |
| Utilities | 0 (0.0%) | 0 (0.0%) |
| Information | 0 (0.0%) | 0 (0.0%) |
| Finance & Insurance | 0 (0.0%) | 0 (0.0%) |
| Real Estate, Rental & Leasing | 0 (0.0%) | 0 (0.0%) |
| Professional & Scientific | 57 (50.9%) | 55 (49.1%) |
| Enterprise Management | 0 (0.0%) | 0 (0.0%) |
| Administrative & Support | 76 (100.0%) | 0 (0.0%) |
| Educational Services | 15 (25.4%) | 44 (74.6%) |
| Health Care & Social Assistance | 0 (0.0%) | 78 (100.0%) |
| Arts, Entertainment & Recreation | 8 (100.0%) | 0 (0.0%) |
| Accommodation & Food Services | 94 (82.5%) | 20 (17.5%) |
| Public Administration | 56 (63.6%) | 32 (36.4%) |
| Total | 931 (74.7%) | 315 (25.3%) |
Education in Vado
School Enrollment in Vado
The most common levels of schooling among the 1,268 students in Vado are high school (420 | 33.1%), middle school (359 | 28.3%), and elementary school (270 | 21.3%).
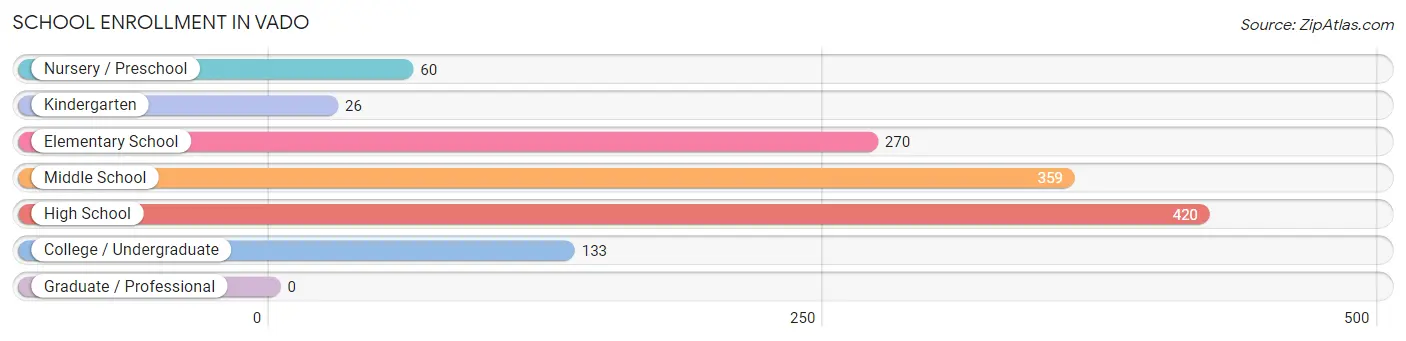
| School Level | # Students | % Students |
| Nursery / Preschool | 60 | 4.7% |
| Kindergarten | 26 | 2.1% |
| Elementary School | 270 | 21.3% |
| Middle School | 359 | 28.3% |
| High School | 420 | 33.1% |
| College / Undergraduate | 133 | 10.5% |
| Graduate / Professional | 0 | 0.0% |
| Total | 1,268 | 100.0% |
School Enrollment by Age by Funding Source in Vado
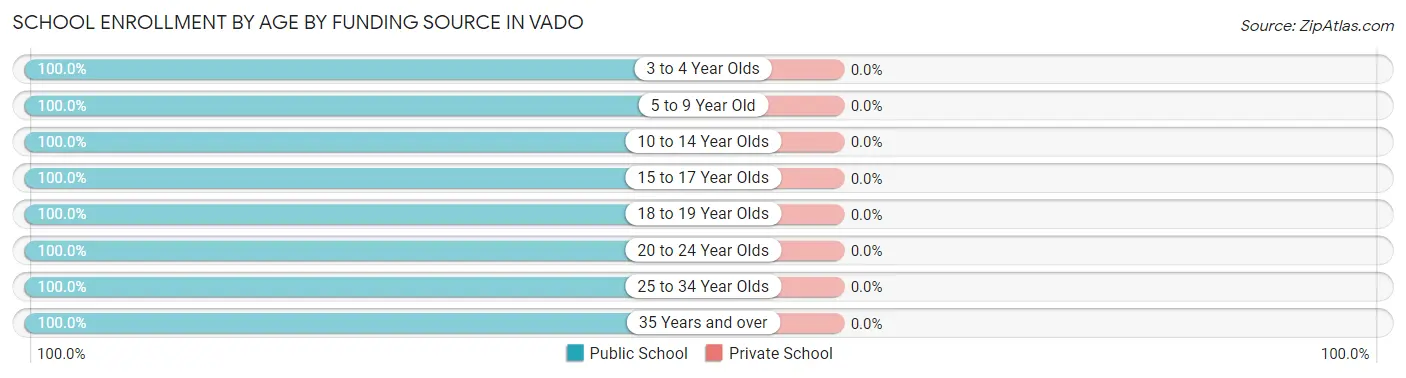
| Age Bracket | Public School | Private School |
| 3 to 4 Year Olds | 45 (100.0%) | 0 (0.0%) |
| 5 to 9 Year Old | 302 (100.0%) | 0 (0.0%) |
| 10 to 14 Year Olds | 464 (100.0%) | 0 (0.0%) |
| 15 to 17 Year Olds | 332 (100.0%) | 0 (0.0%) |
| 18 to 19 Year Olds | 17 (100.0%) | 0 (0.0%) |
| 20 to 24 Year Olds | 30 (100.0%) | 0 (0.0%) |
| 25 to 34 Year Olds | 71 (100.0%) | 0 (0.0%) |
| 35 Years and over | 7 (100.0%) | 0 (0.0%) |
| Total | 1,268 (100.0%) | 0 (0.0%) |
Educational Attainment by Field of Study in Vado
Arts & humanities (57 | 36.3%), engineering (43 | 27.4%), education (40 | 25.5%), and literature & languages (17 | 10.8%) are the most common fields of study among 157 individuals in Vado who have obtained a bachelor's degree or higher.
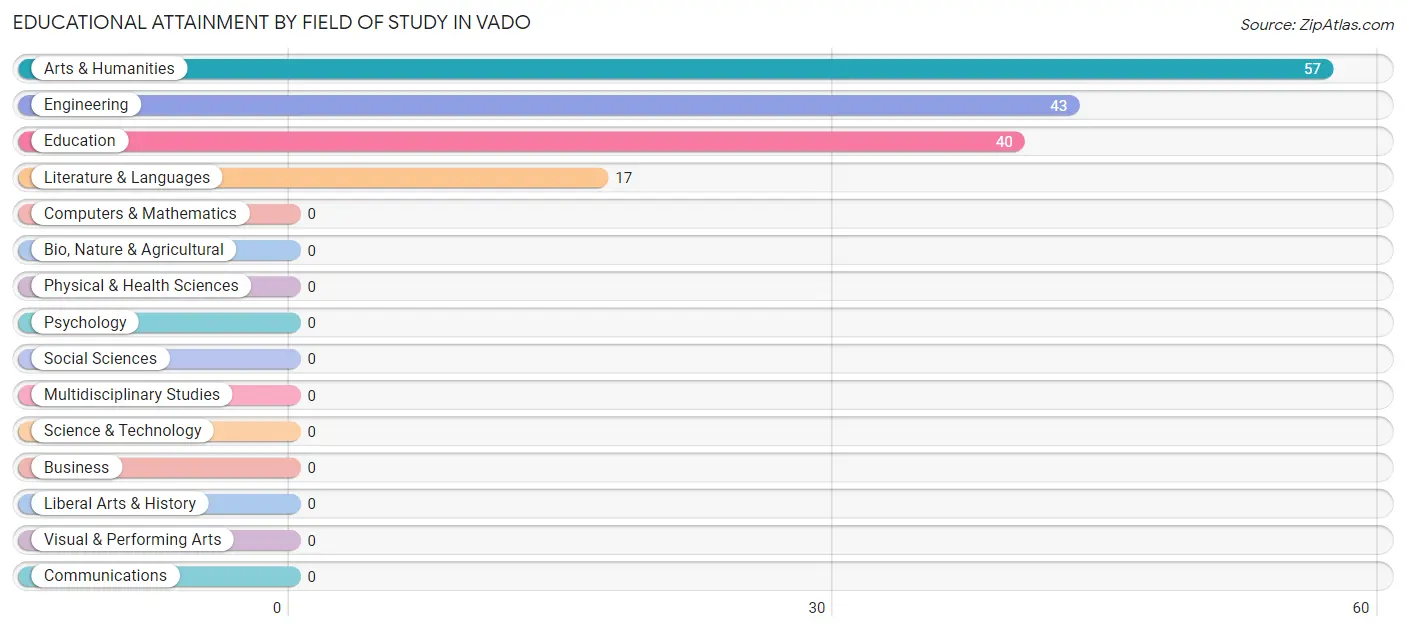
| Field of Study | # Graduates | % Graduates |
| Computers & Mathematics | 0 | 0.0% |
| Bio, Nature & Agricultural | 0 | 0.0% |
| Physical & Health Sciences | 0 | 0.0% |
| Psychology | 0 | 0.0% |
| Social Sciences | 0 | 0.0% |
| Engineering | 43 | 27.4% |
| Multidisciplinary Studies | 0 | 0.0% |
| Science & Technology | 0 | 0.0% |
| Business | 0 | 0.0% |
| Education | 40 | 25.5% |
| Literature & Languages | 17 | 10.8% |
| Liberal Arts & History | 0 | 0.0% |
| Visual & Performing Arts | 0 | 0.0% |
| Communications | 0 | 0.0% |
| Arts & Humanities | 57 | 36.3% |
| Total | 157 | 100.0% |
Transportation & Commute in Vado
Vehicle Availability by Sex in Vado
The most prevalent vehicle ownership categories in Vado are males with 3 vehicles (372, accounting for 40.0%) and females with 3 vehicles (68, making up 118.1%).
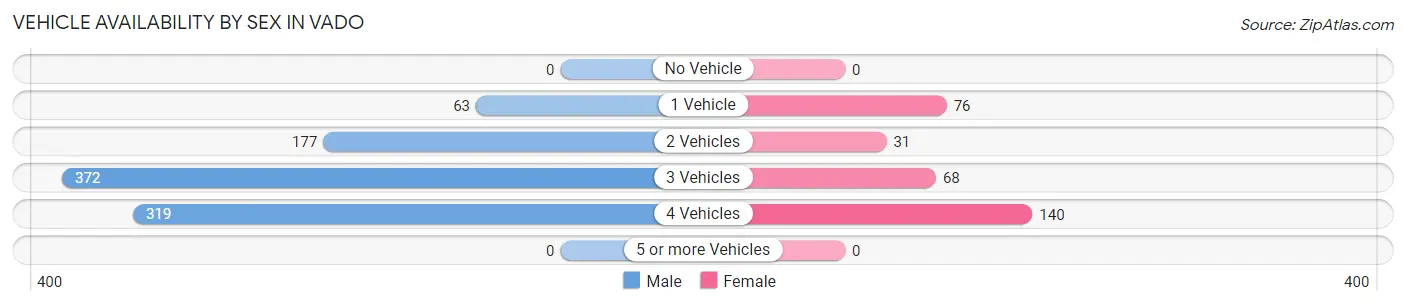
| Vehicles Available | Male | Female |
| No Vehicle | 0 (0.0%) | 0 (0.0%) |
| 1 Vehicle | 63 (6.8%) | 76 (24.1%) |
| 2 Vehicles | 177 (19.0%) | 31 (9.8%) |
| 3 Vehicles | 372 (40.0%) | 68 (21.6%) |
| 4 Vehicles | 319 (34.3%) | 140 (44.4%) |
| 5 or more Vehicles | 0 (0.0%) | 0 (0.0%) |
| Total | 931 (100.0%) | 315 (100.0%) |
Commute Time in Vado
The most frequently occuring commute durations in Vado are 30 to 34 minutes (363 commuters, 29.1%), 20 to 24 minutes (287 commuters, 23.0%), and 15 to 19 minutes (252 commuters, 20.2%).
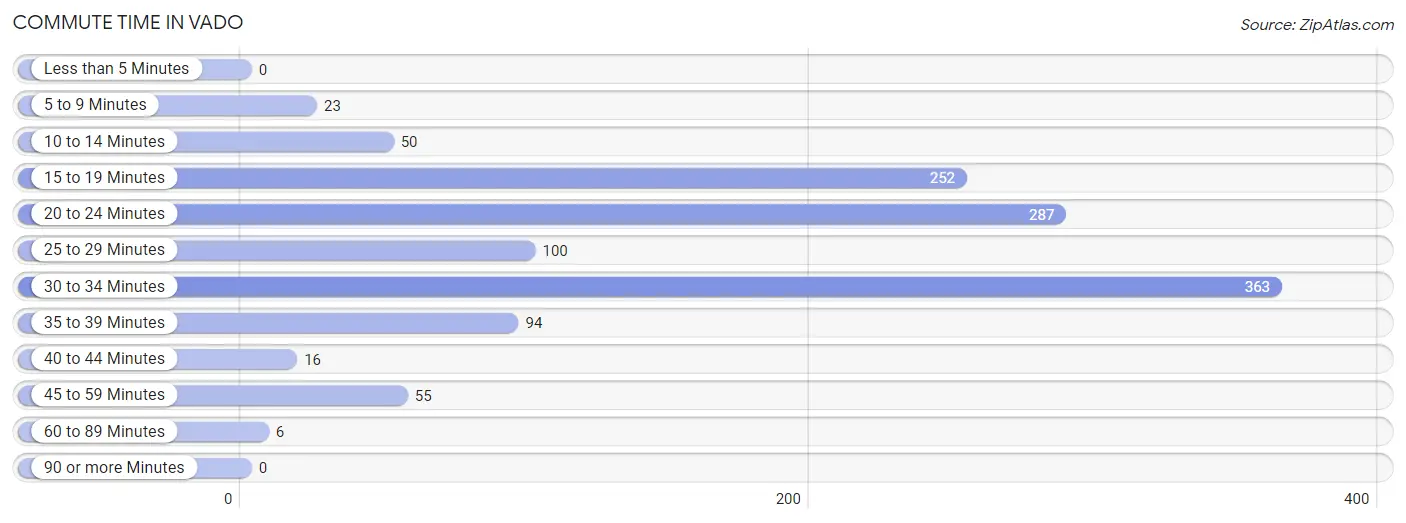
| Commute Time | # Commuters | % Commuters |
| Less than 5 Minutes | 0 | 0.0% |
| 5 to 9 Minutes | 23 | 1.8% |
| 10 to 14 Minutes | 50 | 4.0% |
| 15 to 19 Minutes | 252 | 20.2% |
| 20 to 24 Minutes | 287 | 23.0% |
| 25 to 29 Minutes | 100 | 8.0% |
| 30 to 34 Minutes | 363 | 29.1% |
| 35 to 39 Minutes | 94 | 7.5% |
| 40 to 44 Minutes | 16 | 1.3% |
| 45 to 59 Minutes | 55 | 4.4% |
| 60 to 89 Minutes | 6 | 0.5% |
| 90 or more Minutes | 0 | 0.0% |
Commute Time by Sex in Vado
The most common commute times in Vado are 30 to 34 minutes (269 commuters, 28.9%) for males and 30 to 34 minutes (94 commuters, 29.8%) for females.
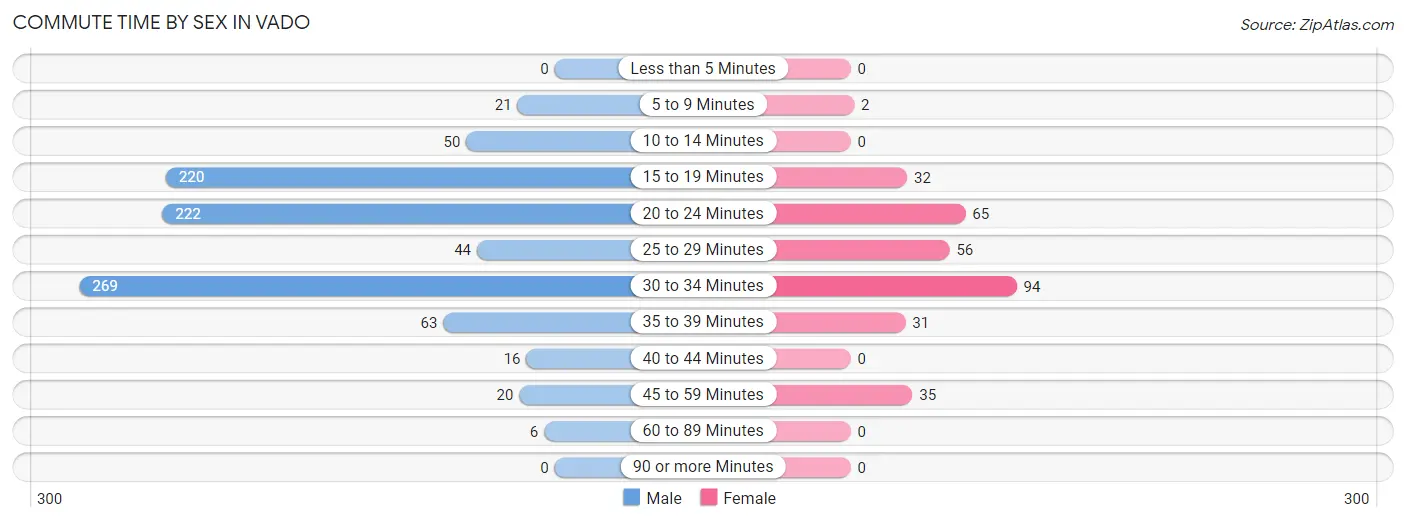
| Commute Time | Male | Female |
| Less than 5 Minutes | 0 (0.0%) | 0 (0.0%) |
| 5 to 9 Minutes | 21 (2.3%) | 2 (0.6%) |
| 10 to 14 Minutes | 50 (5.4%) | 0 (0.0%) |
| 15 to 19 Minutes | 220 (23.6%) | 32 (10.2%) |
| 20 to 24 Minutes | 222 (23.8%) | 65 (20.6%) |
| 25 to 29 Minutes | 44 (4.7%) | 56 (17.8%) |
| 30 to 34 Minutes | 269 (28.9%) | 94 (29.8%) |
| 35 to 39 Minutes | 63 (6.8%) | 31 (9.8%) |
| 40 to 44 Minutes | 16 (1.7%) | 0 (0.0%) |
| 45 to 59 Minutes | 20 (2.1%) | 35 (11.1%) |
| 60 to 89 Minutes | 6 (0.6%) | 0 (0.0%) |
| 90 or more Minutes | 0 (0.0%) | 0 (0.0%) |
Time of Departure to Work by Sex in Vado
The most frequent times of departure to work in Vado are 6:30 AM to 6:59 AM (258, 27.7%) for males and 6:00 AM to 6:29 AM (49, 15.6%) for females.
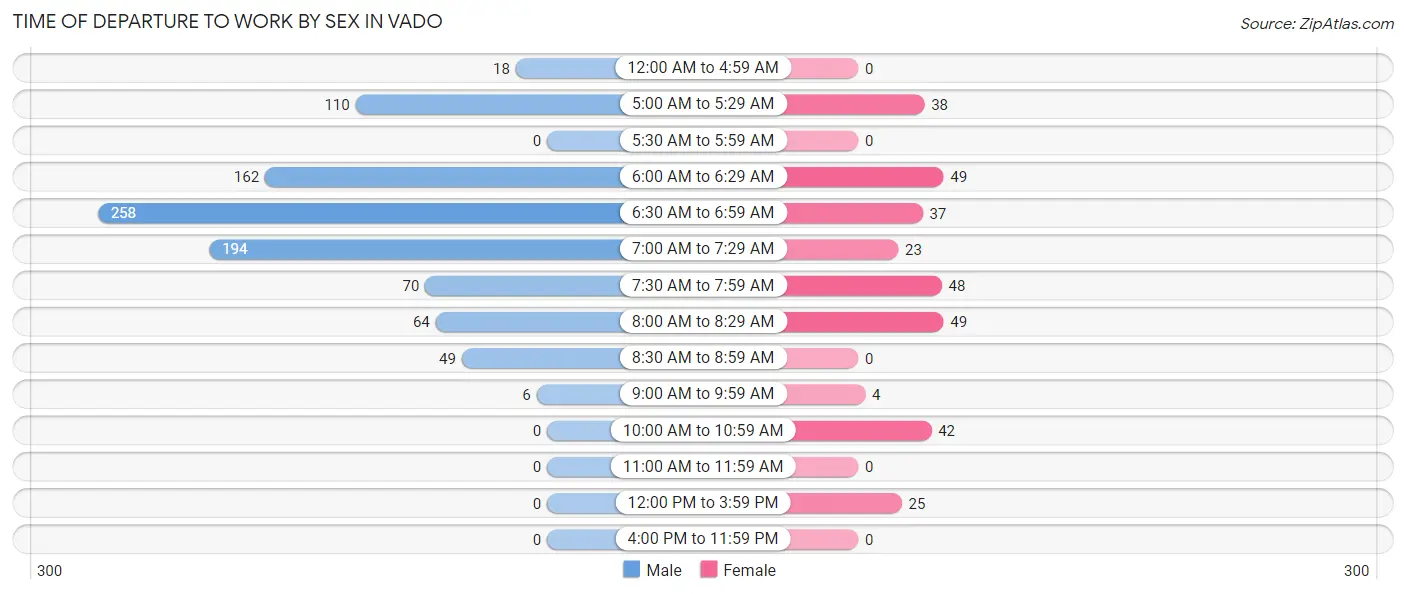
| Time of Departure | Male | Female |
| 12:00 AM to 4:59 AM | 18 (1.9%) | 0 (0.0%) |
| 5:00 AM to 5:29 AM | 110 (11.8%) | 38 (12.1%) |
| 5:30 AM to 5:59 AM | 0 (0.0%) | 0 (0.0%) |
| 6:00 AM to 6:29 AM | 162 (17.4%) | 49 (15.6%) |
| 6:30 AM to 6:59 AM | 258 (27.7%) | 37 (11.7%) |
| 7:00 AM to 7:29 AM | 194 (20.8%) | 23 (7.3%) |
| 7:30 AM to 7:59 AM | 70 (7.5%) | 48 (15.2%) |
| 8:00 AM to 8:29 AM | 64 (6.9%) | 49 (15.6%) |
| 8:30 AM to 8:59 AM | 49 (5.3%) | 0 (0.0%) |
| 9:00 AM to 9:59 AM | 6 (0.6%) | 4 (1.3%) |
| 10:00 AM to 10:59 AM | 0 (0.0%) | 42 (13.3%) |
| 11:00 AM to 11:59 AM | 0 (0.0%) | 0 (0.0%) |
| 12:00 PM to 3:59 PM | 0 (0.0%) | 25 (7.9%) |
| 4:00 PM to 11:59 PM | 0 (0.0%) | 0 (0.0%) |
| Total | 931 (100.0%) | 315 (100.0%) |
Housing Occupancy in Vado
Occupancy by Ownership in Vado
Of the total 891 dwellings in Vado, owner-occupied units account for 681 (76.4%), while renter-occupied units make up 210 (23.6%).
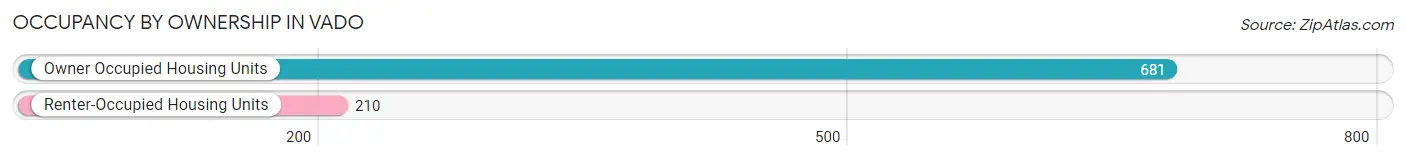
| Occupancy | # Housing Units | % Housing Units |
| Owner Occupied Housing Units | 681 | 76.4% |
| Renter-Occupied Housing Units | 210 | 23.6% |
| Total Occupied Housing Units | 891 | 100.0% |
Occupancy by Household Size in Vado
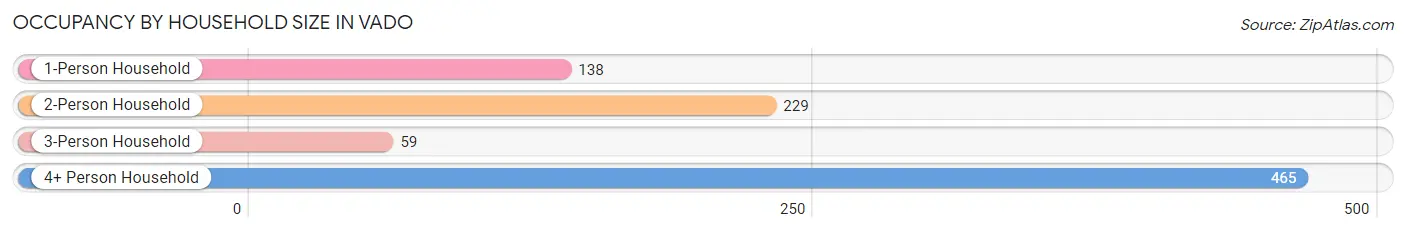
| Household Size | # Housing Units | % Housing Units |
| 1-Person Household | 138 | 15.5% |
| 2-Person Household | 229 | 25.7% |
| 3-Person Household | 59 | 6.6% |
| 4+ Person Household | 465 | 52.2% |
| Total Housing Units | 891 | 100.0% |
Occupancy by Ownership by Household Size in Vado
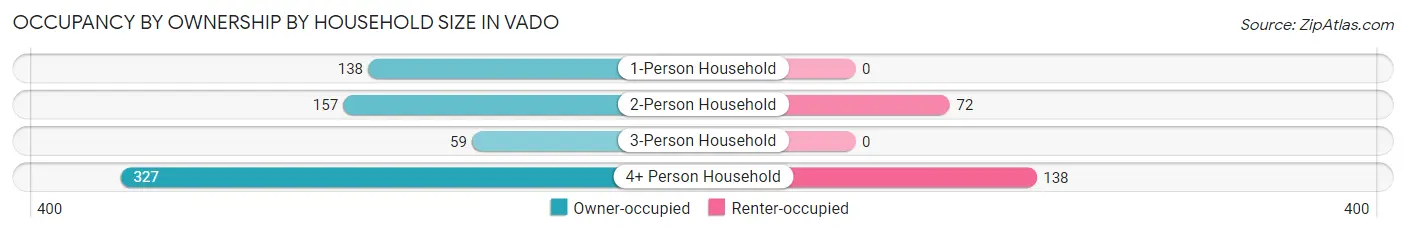
| Household Size | Owner-occupied | Renter-occupied |
| 1-Person Household | 138 (100.0%) | 0 (0.0%) |
| 2-Person Household | 157 (68.6%) | 72 (31.4%) |
| 3-Person Household | 59 (100.0%) | 0 (0.0%) |
| 4+ Person Household | 327 (70.3%) | 138 (29.7%) |
| Total Housing Units | 681 (76.4%) | 210 (23.6%) |
Occupancy by Educational Attainment in Vado
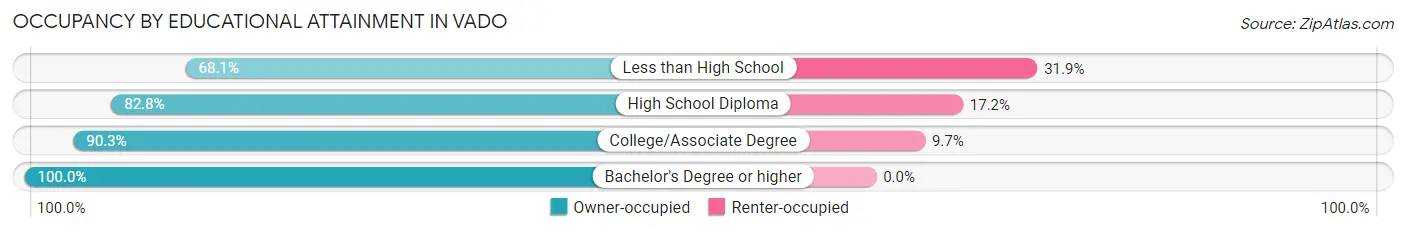
| Household Size | Owner-occupied | Renter-occupied |
| Less than High School | 339 (68.1%) | 159 (31.9%) |
| High School Diploma | 159 (82.8%) | 33 (17.2%) |
| College/Associate Degree | 168 (90.3%) | 18 (9.7%) |
| Bachelor's Degree or higher | 15 (100.0%) | 0 (0.0%) |
Occupancy by Age of Householder in Vado
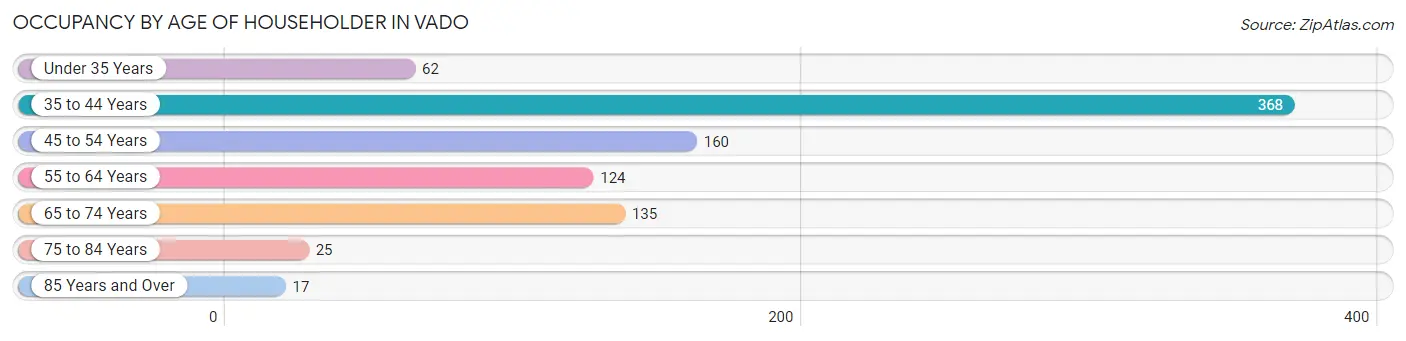
| Age Bracket | # Households | % Households |
| Under 35 Years | 62 | 7.0% |
| 35 to 44 Years | 368 | 41.3% |
| 45 to 54 Years | 160 | 18.0% |
| 55 to 64 Years | 124 | 13.9% |
| 65 to 74 Years | 135 | 15.1% |
| 75 to 84 Years | 25 | 2.8% |
| 85 Years and Over | 17 | 1.9% |
| Total | 891 | 100.0% |
Housing Finances in Vado
Median Income by Occupancy in Vado
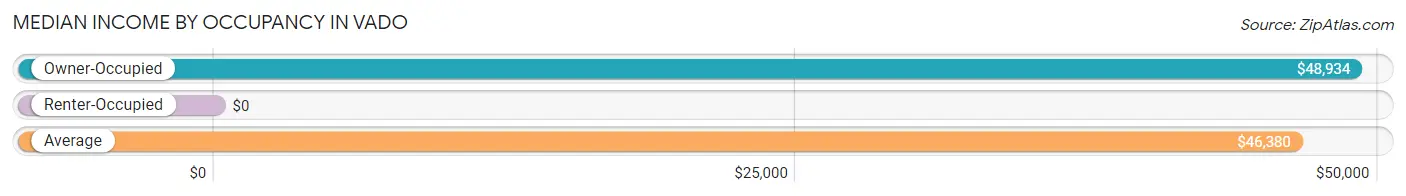
| Occupancy Type | # Households | Median Income |
| Owner-Occupied | 681 (76.4%) | $48,934 |
| Renter-Occupied | 210 (23.6%) | $0 |
| Average | 891 (100.0%) | $46,380 |
Occupancy by Householder Income Bracket in Vado
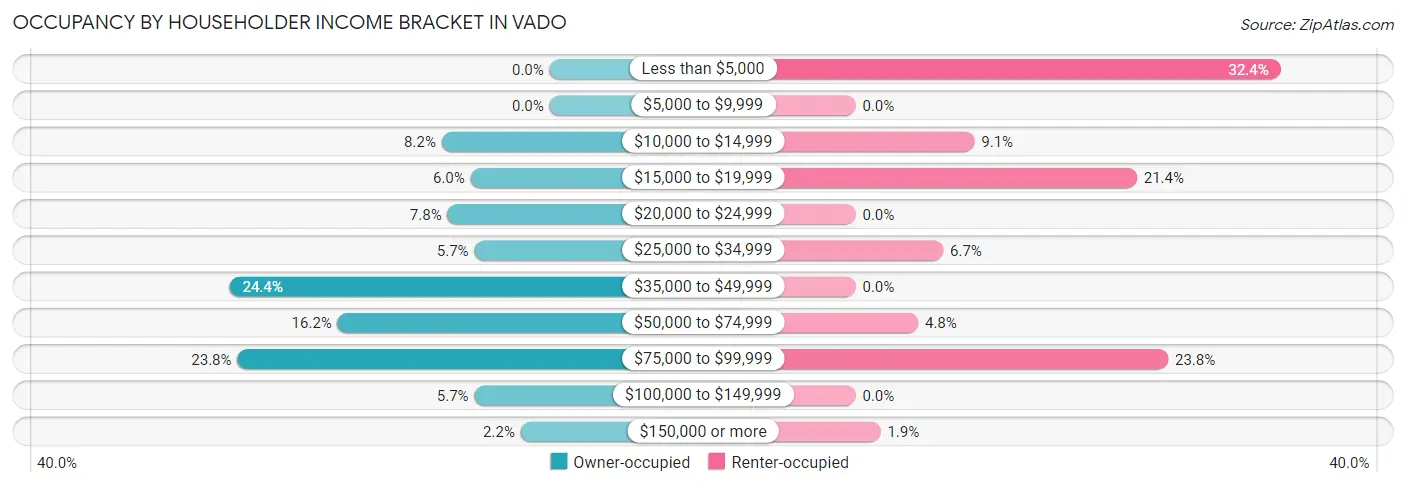
| Income Bracket | Owner-occupied | Renter-occupied |
| Less than $5,000 | 0 (0.0%) | 68 (32.4%) |
| $5,000 to $9,999 | 0 (0.0%) | 0 (0.0%) |
| $10,000 to $14,999 | 56 (8.2%) | 19 (9.0%) |
| $15,000 to $19,999 | 41 (6.0%) | 45 (21.4%) |
| $20,000 to $24,999 | 53 (7.8%) | 0 (0.0%) |
| $25,000 to $34,999 | 39 (5.7%) | 14 (6.7%) |
| $35,000 to $49,999 | 166 (24.4%) | 0 (0.0%) |
| $50,000 to $74,999 | 110 (16.2%) | 10 (4.8%) |
| $75,000 to $99,999 | 162 (23.8%) | 50 (23.8%) |
| $100,000 to $149,999 | 39 (5.7%) | 0 (0.0%) |
| $150,000 or more | 15 (2.2%) | 4 (1.9%) |
| Total | 681 (100.0%) | 210 (100.0%) |
Monthly Housing Cost Tiers in Vado
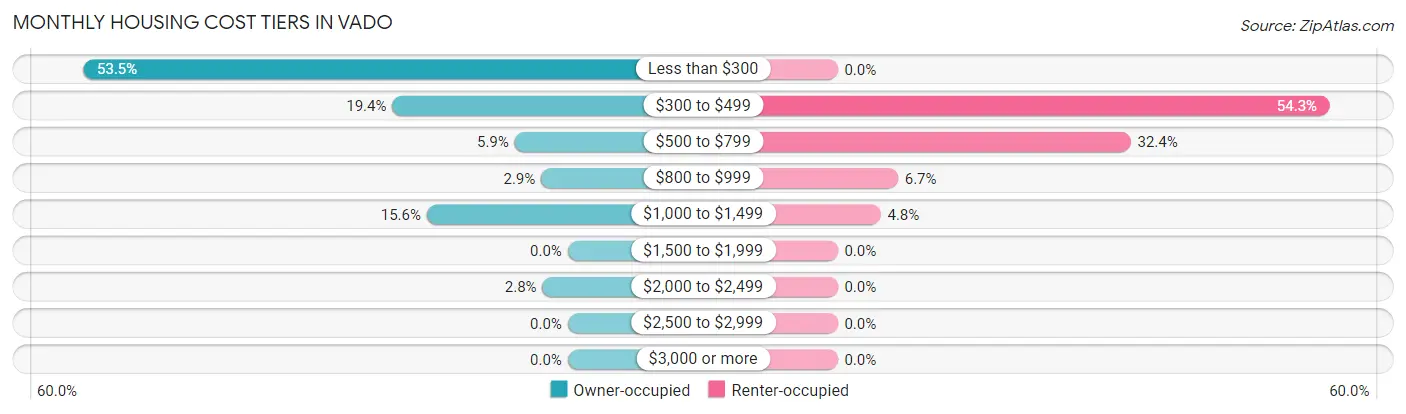
| Monthly Cost | Owner-occupied | Renter-occupied |
| Less than $300 | 364 (53.4%) | 0 (0.0%) |
| $300 to $499 | 132 (19.4%) | 114 (54.3%) |
| $500 to $799 | 40 (5.9%) | 68 (32.4%) |
| $800 to $999 | 20 (2.9%) | 14 (6.7%) |
| $1,000 to $1,499 | 106 (15.6%) | 10 (4.8%) |
| $1,500 to $1,999 | 0 (0.0%) | 0 (0.0%) |
| $2,000 to $2,499 | 19 (2.8%) | 0 (0.0%) |
| $2,500 to $2,999 | 0 (0.0%) | 0 (0.0%) |
| $3,000 or more | 0 (0.0%) | 0 (0.0%) |
| Total | 681 (100.0%) | 210 (100.0%) |
Physical Housing Characteristics in Vado
Housing Structures in Vado
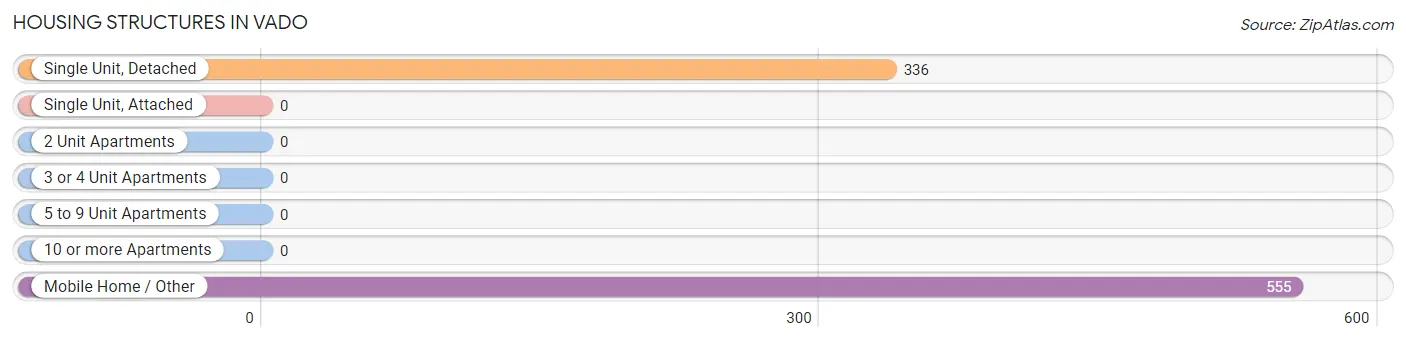
| Structure Type | # Housing Units | % Housing Units |
| Single Unit, Detached | 336 | 37.7% |
| Single Unit, Attached | 0 | 0.0% |
| 2 Unit Apartments | 0 | 0.0% |
| 3 or 4 Unit Apartments | 0 | 0.0% |
| 5 to 9 Unit Apartments | 0 | 0.0% |
| 10 or more Apartments | 0 | 0.0% |
| Mobile Home / Other | 555 | 62.3% |
| Total | 891 | 100.0% |
Housing Structures by Occupancy in Vado
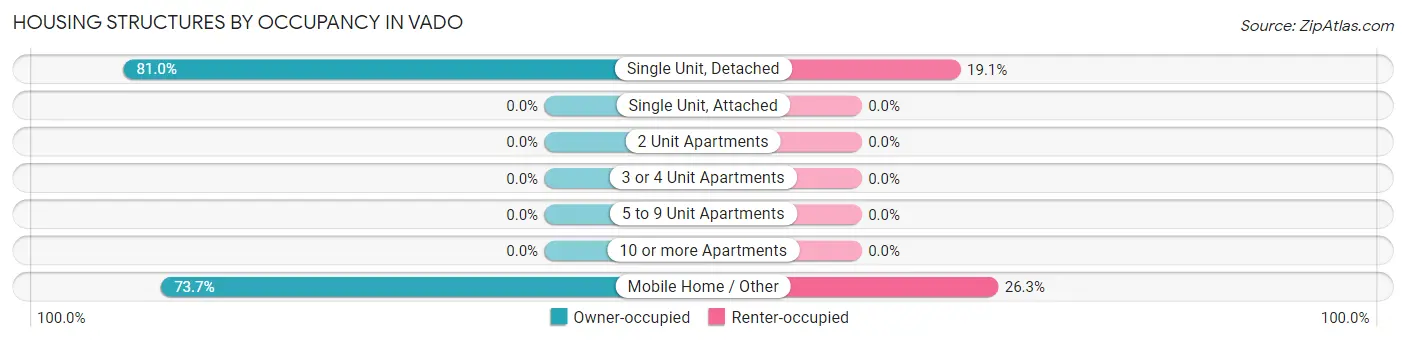
| Structure Type | Owner-occupied | Renter-occupied |
| Single Unit, Detached | 272 (80.9%) | 64 (19.1%) |
| Single Unit, Attached | 0 (0.0%) | 0 (0.0%) |
| 2 Unit Apartments | 0 (0.0%) | 0 (0.0%) |
| 3 or 4 Unit Apartments | 0 (0.0%) | 0 (0.0%) |
| 5 to 9 Unit Apartments | 0 (0.0%) | 0 (0.0%) |
| 10 or more Apartments | 0 (0.0%) | 0 (0.0%) |
| Mobile Home / Other | 409 (73.7%) | 146 (26.3%) |
| Total | 681 (76.4%) | 210 (23.6%) |
Housing Structures by Number of Rooms in Vado
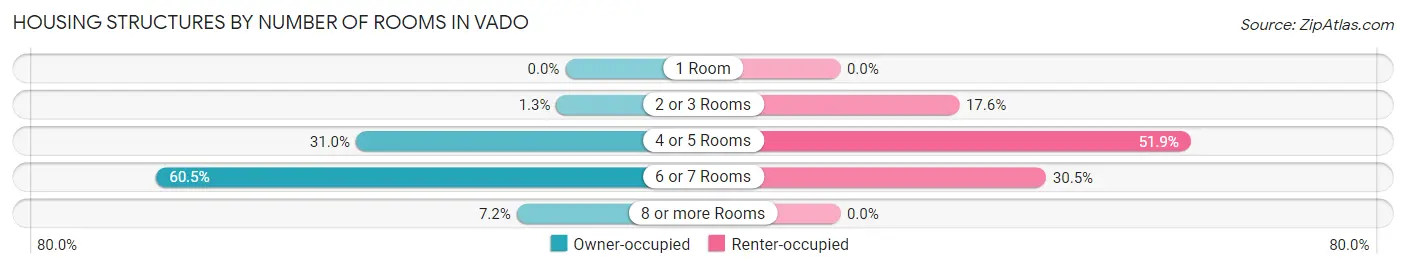
| Number of Rooms | Owner-occupied | Renter-occupied |
| 1 Room | 0 (0.0%) | 0 (0.0%) |
| 2 or 3 Rooms | 9 (1.3%) | 37 (17.6%) |
| 4 or 5 Rooms | 211 (31.0%) | 109 (51.9%) |
| 6 or 7 Rooms | 412 (60.5%) | 64 (30.5%) |
| 8 or more Rooms | 49 (7.2%) | 0 (0.0%) |
| Total | 681 (100.0%) | 210 (100.0%) |
Housing Structure by Heating Type in Vado
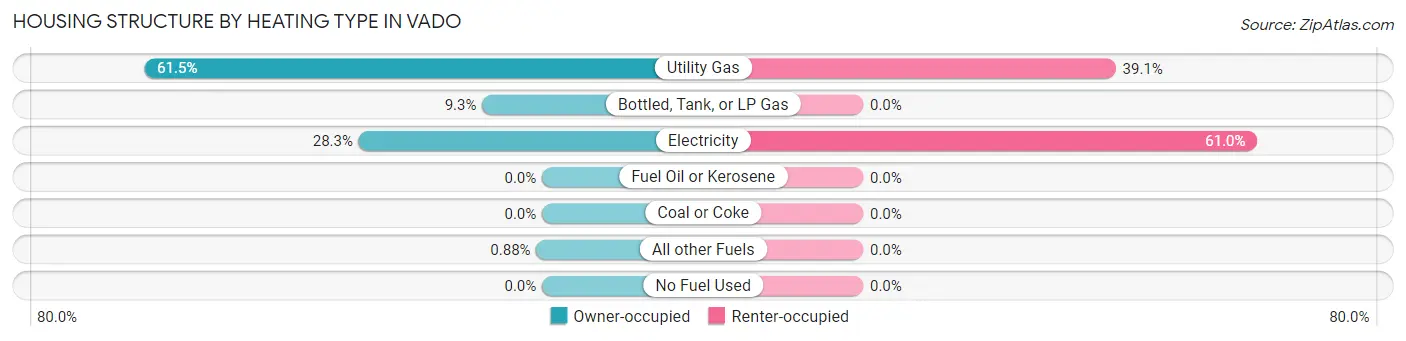
| Heating Type | Owner-occupied | Renter-occupied |
| Utility Gas | 419 (61.5%) | 82 (39.1%) |
| Bottled, Tank, or LP Gas | 63 (9.2%) | 0 (0.0%) |
| Electricity | 193 (28.3%) | 128 (61.0%) |
| Fuel Oil or Kerosene | 0 (0.0%) | 0 (0.0%) |
| Coal or Coke | 0 (0.0%) | 0 (0.0%) |
| All other Fuels | 6 (0.9%) | 0 (0.0%) |
| No Fuel Used | 0 (0.0%) | 0 (0.0%) |
| Total | 681 (100.0%) | 210 (100.0%) |
Household Vehicle Usage in Vado
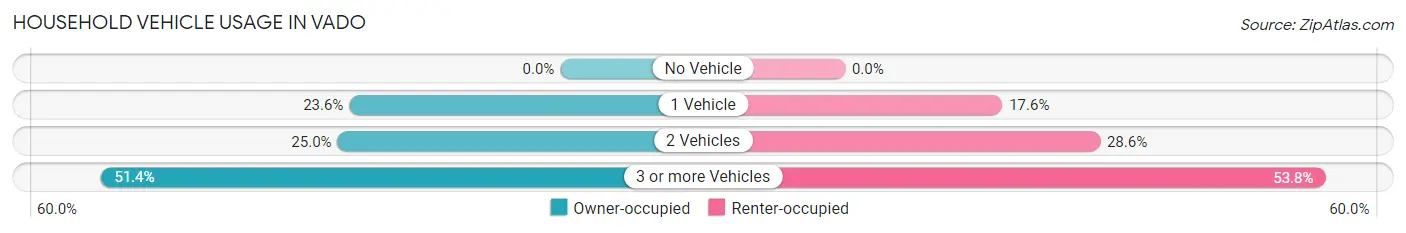
| Vehicles per Household | Owner-occupied | Renter-occupied |
| No Vehicle | 0 (0.0%) | 0 (0.0%) |
| 1 Vehicle | 161 (23.6%) | 37 (17.6%) |
| 2 Vehicles | 170 (25.0%) | 60 (28.6%) |
| 3 or more Vehicles | 350 (51.4%) | 113 (53.8%) |
| Total | 681 (100.0%) | 210 (100.0%) |
Real Estate & Mortgages in Vado
Real Estate and Mortgage Overview in Vado
| Characteristic | Without Mortgage | With Mortgage |
| Housing Units | 536 | 145 |
| Median Property Value | $95,600 | $173,100 |
| Median Household Income | $45,781 | $0 |
| Monthly Housing Costs | $247 | $0 |
| Real Estate Taxes | $455 | $0 |
Property Value by Mortgage Status in Vado
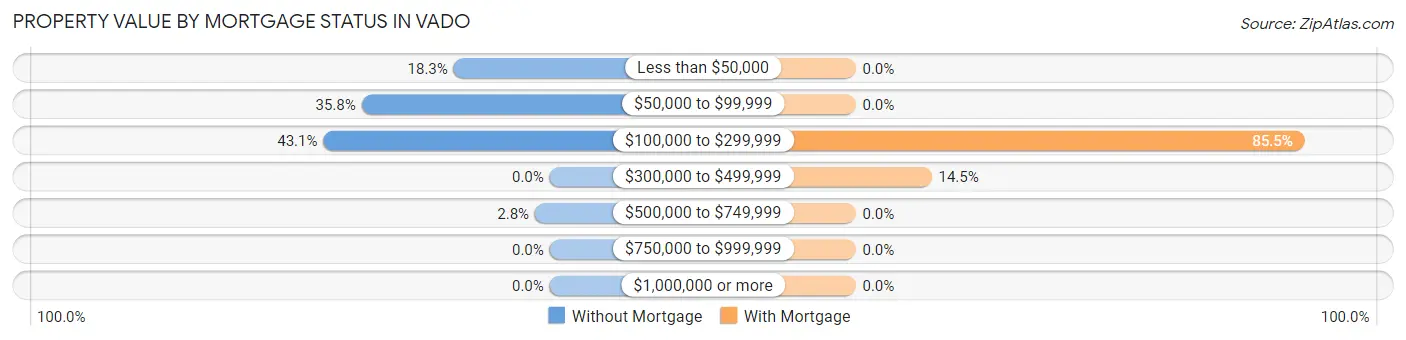
| Property Value | Without Mortgage | With Mortgage |
| Less than $50,000 | 98 (18.3%) | 0 (0.0%) |
| $50,000 to $99,999 | 192 (35.8%) | 0 (0.0%) |
| $100,000 to $299,999 | 231 (43.1%) | 124 (85.5%) |
| $300,000 to $499,999 | 0 (0.0%) | 21 (14.5%) |
| $500,000 to $749,999 | 15 (2.8%) | 0 (0.0%) |
| $750,000 to $999,999 | 0 (0.0%) | 0 (0.0%) |
| $1,000,000 or more | 0 (0.0%) | 0 (0.0%) |
| Total | 536 (100.0%) | 145 (100.0%) |
Household Income by Mortgage Status in Vado
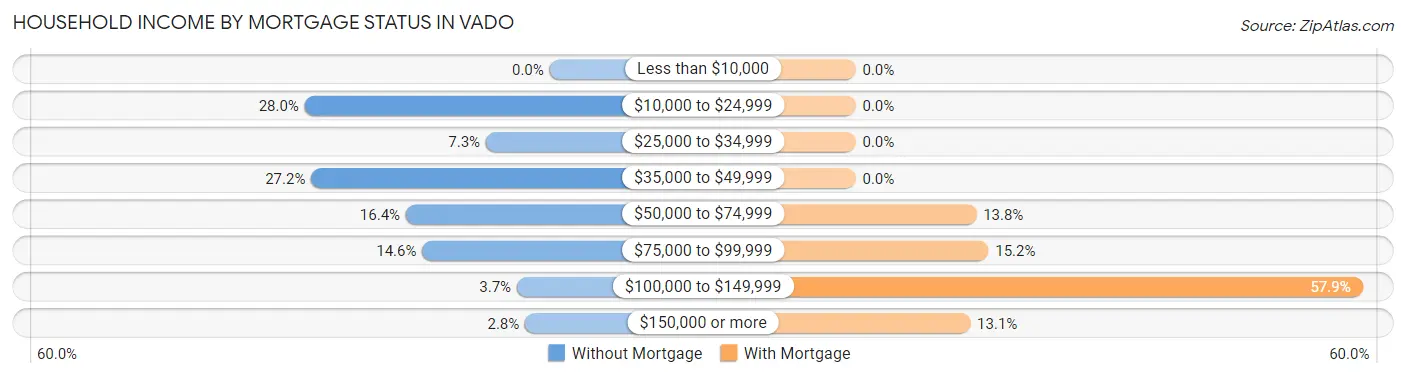
| Household Income | Without Mortgage | With Mortgage |
| Less than $10,000 | 0 (0.0%) | 0 (0.0%) |
| $10,000 to $24,999 | 150 (28.0%) | 0 (0.0%) |
| $25,000 to $34,999 | 39 (7.3%) | 0 (0.0%) |
| $35,000 to $49,999 | 146 (27.2%) | 0 (0.0%) |
| $50,000 to $74,999 | 88 (16.4%) | 20 (13.8%) |
| $75,000 to $99,999 | 78 (14.5%) | 22 (15.2%) |
| $100,000 to $149,999 | 20 (3.7%) | 84 (57.9%) |
| $150,000 or more | 15 (2.8%) | 19 (13.1%) |
| Total | 536 (100.0%) | 145 (100.0%) |
Property Value to Household Income Ratio in Vado
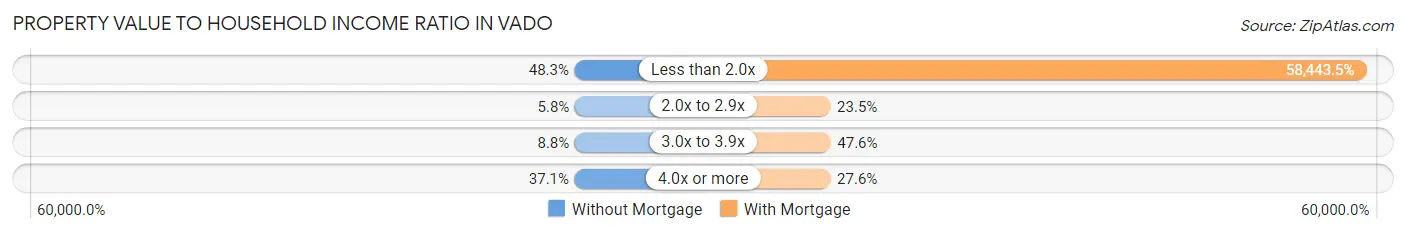
| Value-to-Income Ratio | Without Mortgage | With Mortgage |
| Less than 2.0x | 259 (48.3%) | 84,743 (58,443.4%) |
| 2.0x to 2.9x | 31 (5.8%) | 34 (23.4%) |
| 3.0x to 3.9x | 47 (8.8%) | 69 (47.6%) |
| 4.0x or more | 199 (37.1%) | 40 (27.6%) |
| Total | 536 (100.0%) | 145 (100.0%) |
Real Estate Taxes by Mortgage Status in Vado
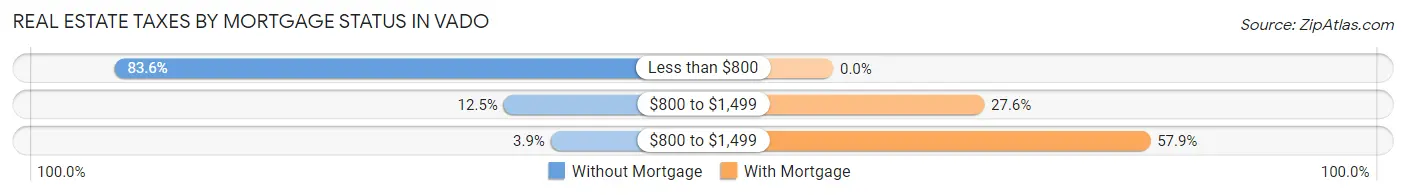
| Property Taxes | Without Mortgage | With Mortgage |
| Less than $800 | 448 (83.6%) | 0 (0.0%) |
| $800 to $1,499 | 67 (12.5%) | 40 (27.6%) |
| $800 to $1,499 | 21 (3.9%) | 84 (57.9%) |
| Total | 536 (100.0%) | 145 (100.0%) |
Health & Disability in Vado
Health Insurance Coverage by Age in Vado
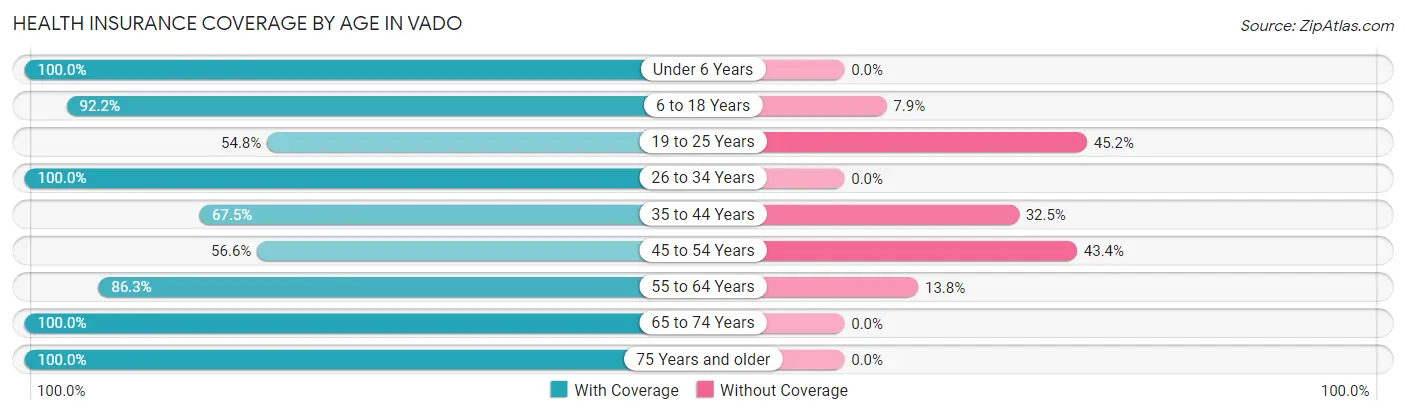
| Age Bracket | With Coverage | Without Coverage |
| Under 6 Years | 239 (100.0%) | 0 (0.0%) |
| 6 to 18 Years | 998 (92.1%) | 85 (7.9%) |
| 19 to 25 Years | 195 (54.8%) | 161 (45.2%) |
| 26 to 34 Years | 264 (100.0%) | 0 (0.0%) |
| 35 to 44 Years | 442 (67.5%) | 213 (32.5%) |
| 45 to 54 Years | 175 (56.6%) | 134 (43.4%) |
| 55 to 64 Years | 232 (86.3%) | 37 (13.8%) |
| 65 to 74 Years | 169 (100.0%) | 0 (0.0%) |
| 75 Years and older | 42 (100.0%) | 0 (0.0%) |
| Total | 2,756 (81.4%) | 630 (18.6%) |
Health Insurance Coverage by Citizenship Status in Vado
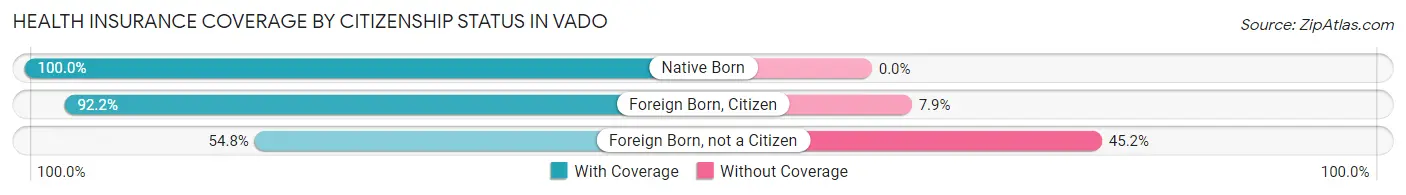
| Citizenship Status | With Coverage | Without Coverage |
| Native Born | 239 (100.0%) | 0 (0.0%) |
| Foreign Born, Citizen | 998 (92.1%) | 85 (7.9%) |
| Foreign Born, not a Citizen | 195 (54.8%) | 161 (45.2%) |
Health Insurance Coverage by Household Income in Vado
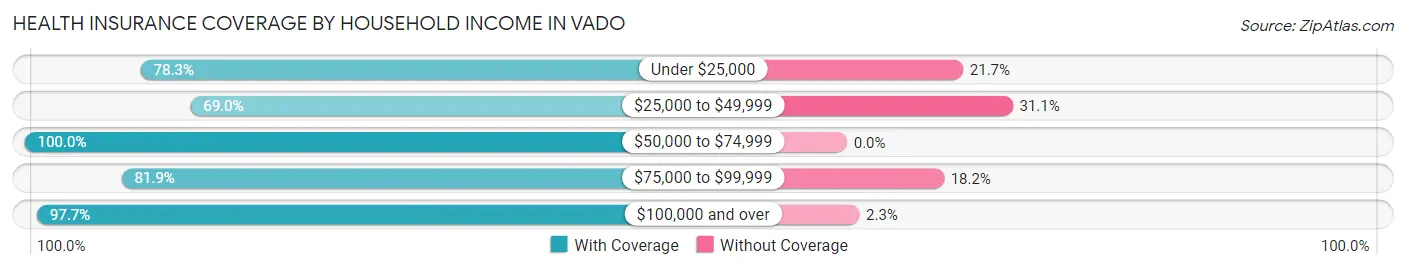
| Household Income | With Coverage | Without Coverage |
| Under $25,000 | 889 (78.3%) | 247 (21.7%) |
| $25,000 to $49,999 | 524 (69.0%) | 236 (31.0%) |
| $50,000 to $74,999 | 377 (100.0%) | 0 (0.0%) |
| $75,000 to $99,999 | 627 (81.9%) | 139 (18.1%) |
| $100,000 and over | 339 (97.7%) | 8 (2.3%) |
Public vs Private Health Insurance Coverage by Age in Vado
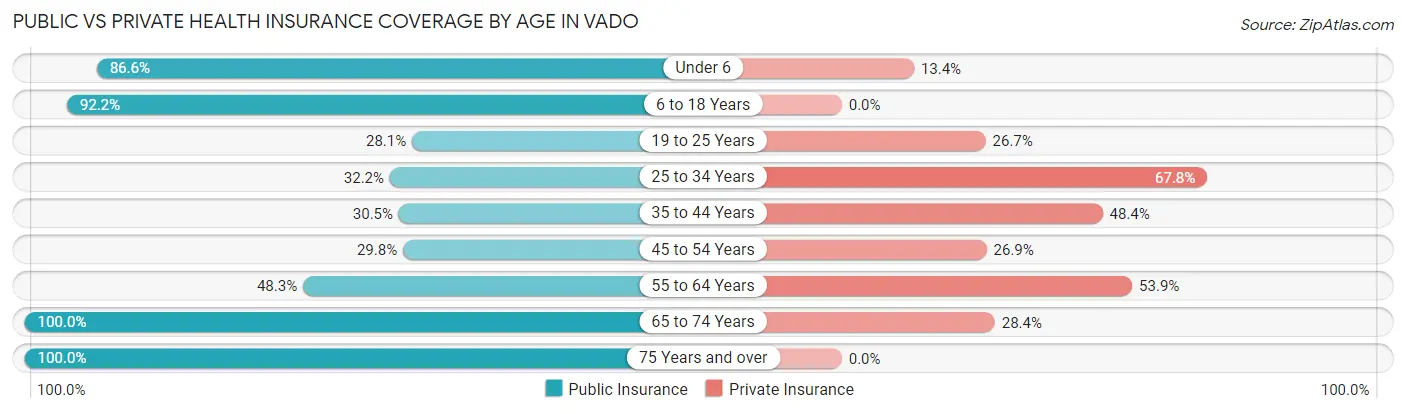
| Age Bracket | Public Insurance | Private Insurance |
| Under 6 | 207 (86.6%) | 32 (13.4%) |
| 6 to 18 Years | 998 (92.1%) | 0 (0.0%) |
| 19 to 25 Years | 100 (28.1%) | 95 (26.7%) |
| 25 to 34 Years | 85 (32.2%) | 179 (67.8%) |
| 35 to 44 Years | 200 (30.5%) | 317 (48.4%) |
| 45 to 54 Years | 92 (29.8%) | 83 (26.9%) |
| 55 to 64 Years | 130 (48.3%) | 145 (53.9%) |
| 65 to 74 Years | 169 (100.0%) | 48 (28.4%) |
| 75 Years and over | 42 (100.0%) | 0 (0.0%) |
| Total | 2,023 (59.8%) | 899 (26.6%) |
Disability Status by Sex by Age in Vado
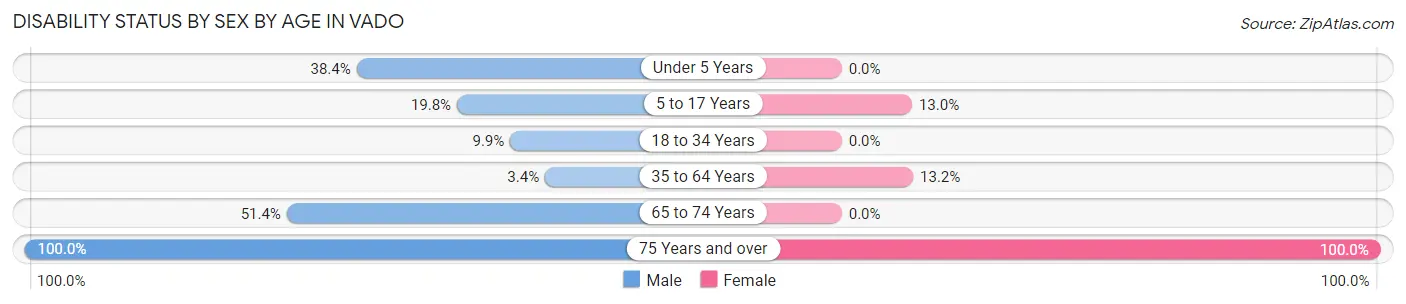
| Age Bracket | Male | Female |
| Under 5 Years | 43 (38.4%) | 0 (0.0%) |
| 5 to 17 Years | 129 (19.8%) | 58 (13.0%) |
| 18 to 34 Years | 40 (9.9%) | 0 (0.0%) |
| 35 to 64 Years | 23 (3.4%) | 74 (13.2%) |
| 65 to 74 Years | 38 (51.3%) | 0 (0.0%) |
| 75 Years and over | 6 (100.0%) | 36 (100.0%) |
Disability Class by Sex by Age in Vado
Disability Class: Hearing Difficulty
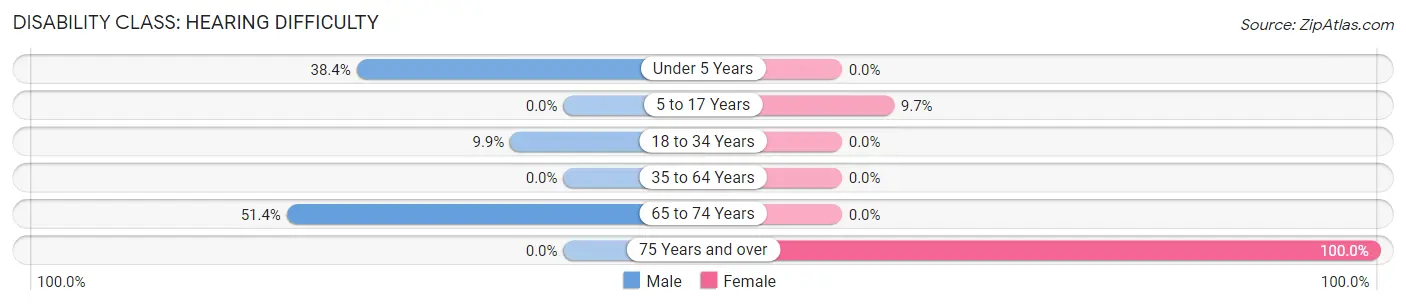
| Age Bracket | Male | Female |
| Under 5 Years | 43 (38.4%) | 0 (0.0%) |
| 5 to 17 Years | 0 (0.0%) | 43 (9.7%) |
| 18 to 34 Years | 40 (9.9%) | 0 (0.0%) |
| 35 to 64 Years | 0 (0.0%) | 0 (0.0%) |
| 65 to 74 Years | 38 (51.3%) | 0 (0.0%) |
| 75 Years and over | 0 (0.0%) | 36 (100.0%) |
Disability Class: Vision Difficulty
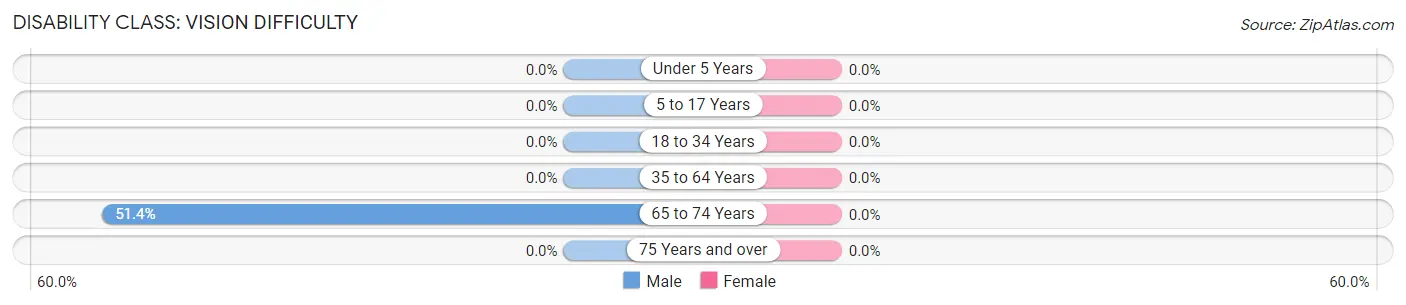
| Age Bracket | Male | Female |
| Under 5 Years | 0 (0.0%) | 0 (0.0%) |
| 5 to 17 Years | 0 (0.0%) | 0 (0.0%) |
| 18 to 34 Years | 0 (0.0%) | 0 (0.0%) |
| 35 to 64 Years | 0 (0.0%) | 0 (0.0%) |
| 65 to 74 Years | 38 (51.3%) | 0 (0.0%) |
| 75 Years and over | 0 (0.0%) | 0 (0.0%) |
Disability Class: Cognitive Difficulty
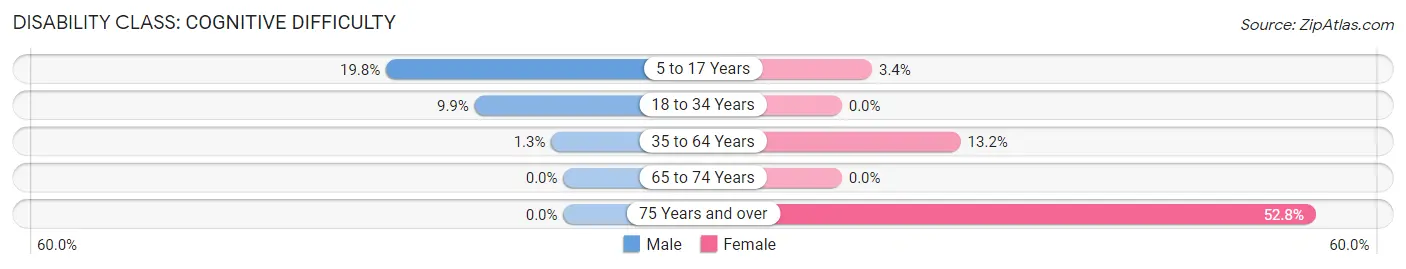
| Age Bracket | Male | Female |
| 5 to 17 Years | 129 (19.8%) | 15 (3.4%) |
| 18 to 34 Years | 40 (9.9%) | 0 (0.0%) |
| 35 to 64 Years | 9 (1.3%) | 74 (13.2%) |
| 65 to 74 Years | 0 (0.0%) | 0 (0.0%) |
| 75 Years and over | 0 (0.0%) | 19 (52.8%) |
Disability Class: Ambulatory Difficulty
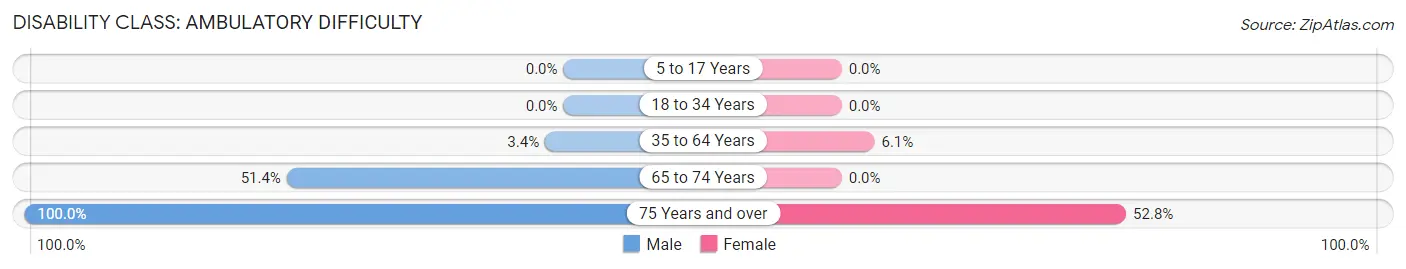
| Age Bracket | Male | Female |
| 5 to 17 Years | 0 (0.0%) | 0 (0.0%) |
| 18 to 34 Years | 0 (0.0%) | 0 (0.0%) |
| 35 to 64 Years | 23 (3.4%) | 34 (6.1%) |
| 65 to 74 Years | 38 (51.3%) | 0 (0.0%) |
| 75 Years and over | 6 (100.0%) | 19 (52.8%) |
Disability Class: Self-Care Difficulty
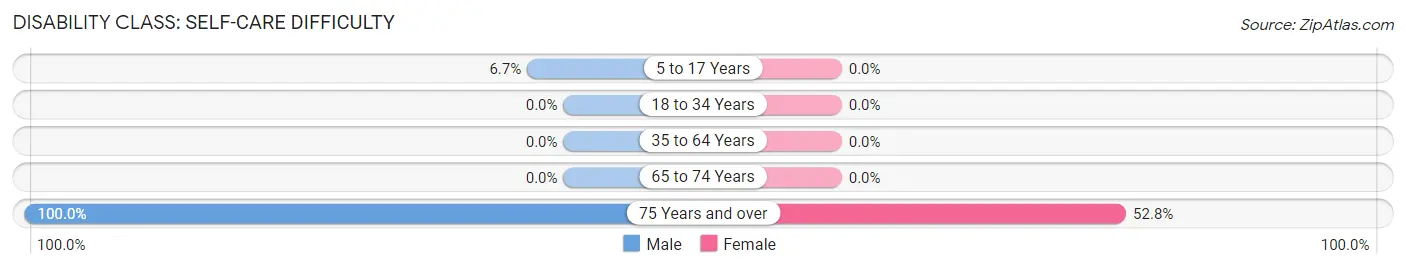
| Age Bracket | Male | Female |
| 5 to 17 Years | 44 (6.7%) | 0 (0.0%) |
| 18 to 34 Years | 0 (0.0%) | 0 (0.0%) |
| 35 to 64 Years | 0 (0.0%) | 0 (0.0%) |
| 65 to 74 Years | 0 (0.0%) | 0 (0.0%) |
| 75 Years and over | 6 (100.0%) | 19 (52.8%) |
Technology Access in Vado
Computing Device Access in Vado
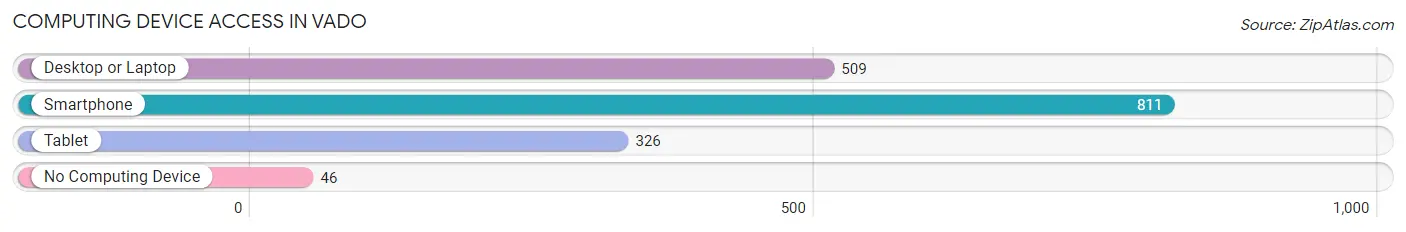
| Device Type | # Households | % Households |
| Desktop or Laptop | 509 | 57.1% |
| Smartphone | 811 | 91.0% |
| Tablet | 326 | 36.6% |
| No Computing Device | 46 | 5.2% |
| Total | 891 | 100.0% |
Internet Access in Vado
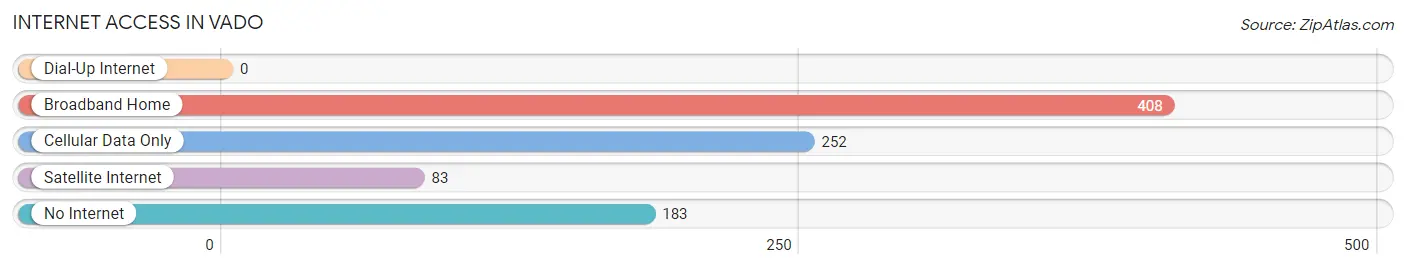
| Internet Type | # Households | % Households |
| Dial-Up Internet | 0 | 0.0% |
| Broadband Home | 408 | 45.8% |
| Cellular Data Only | 252 | 28.3% |
| Satellite Internet | 83 | 9.3% |
| No Internet | 183 | 20.5% |
| Total | 891 | 100.0% |
Vado Summary
Vado is a small unincorporated community located in Doña Ana County, New Mexico. It is situated on the banks of the Rio Grande, just south of the city of Las Cruces. The population of Vado was estimated to be 1,845 in 2019.
History
Vado was founded in the late 19th century by a group of Mexican settlers who were looking for a place to settle and farm. The area was originally known as El Vado de la Ribera, which translates to “the ford of the river”. The settlers built a small adobe church, which still stands today, and the community grew from there.
In the early 20th century, the area was home to a large number of Mexican-American families who worked in the local agricultural industry. The community was also home to a number of small businesses, including a general store, a blacksmith shop, and a saloon.
In the 1950s, the area began to experience rapid growth due to the construction of Interstate 10, which runs through the area. This led to an influx of new residents and businesses, and the population of Vado began to grow.
Geography
Vado is located in the Chihuahuan Desert, which is characterized by hot, dry summers and mild winters. The area is mostly flat, with some rolling hills in the surrounding area. The Rio Grande runs through the area, providing a source of water for the community.
The climate in Vado is arid, with temperatures ranging from the mid-90s in the summer to the mid-50s in the winter. The area receives an average of 8.5 inches of precipitation per year, most of which falls in the summer months.
Economy
The economy of Vado is largely based on agriculture. The area is home to a number of farms, which produce a variety of crops, including cotton, alfalfa, and pecans. The area is also home to a number of small businesses, including restaurants, convenience stores, and auto repair shops.
Demographics
As of 2019, the population of Vado was estimated to be 1,845. The population is predominantly Hispanic, with a small percentage of other ethnicities. The median household income in Vado is $30,000, and the median home value is $90,000. The unemployment rate in Vado is 8.2%, which is slightly higher than the national average.
Common Questions
What is Per Capita Income in Vado?
Per Capita income in Vado is $14,262.
What is the Median Family Income in Vado?
Median Family Income in Vado is $47,474.
What is the Median Household income in Vado?
Median Household Income in Vado is $46,380.
What is Income or Wage Gap in Vado?
Income or Wage Gap in Vado is 37.1%.
Women in Vado earn 62.9 cents for every dollar earned by a man.
What is Family Income Deficit in Vado?
Family Income Deficit in Vado is $20,586.
Families that are below poverty line in Vado earn $20,586 less on average than the poverty threshold level.
What is Inequality or Gini Index in Vado?
Inequality or Gini Index in Vado is 0.40.
What is the Total Population of Vado?
Total Population of Vado is 3,386.
What is the Total Male Population of Vado?
Total Male Population of Vado is 1,924.
What is the Total Female Population of Vado?
Total Female Population of Vado is 1,462.
What is the Ratio of Males per 100 Females in Vado?
There are 131.60 Males per 100 Females in Vado.
What is the Ratio of Females per 100 Males in Vado?
There are 75.99 Females per 100 Males in Vado.
What is the Median Population Age in Vado?
Median Population Age in Vado is 26.8 Years.
What is the Average Family Size in Vado
Average Family Size in Vado is 4.1 People.
What is the Average Household Size in Vado
Average Household Size in Vado is 3.8 People.
How Large is the Labor Force in Vado?
There are 1,333 People in the Labor Forcein in Vado.
What is the Percentage of People in the Labor Force in Vado?
60.5% of People are in the Labor Force in Vado.
What is the Unemployment Rate in Vado?
Unemployment Rate in Vado is 6.5%.