Tyrone, NM Map & Demographics
Tyrone Map
Tyrone Overview
$43,864
PER CAPITA INCOME
$107,917
AVG FAMILY INCOME
$52,989
AVG HOUSEHOLD INCOME
0.61
INEQUALITY / GINI INDEX
716
TOTAL POPULATION
381
MALE POPULATION
335
FEMALE POPULATION
113.73
MALES / 100 FEMALES
87.93
FEMALES / 100 MALES
34.4
MEDIAN AGE
4.2
AVG FAMILY SIZE
2.6
AVG HOUSEHOLD SIZE
278
LABOR FORCE [ PEOPLE ]
59.7%
PERCENT IN LABOR FORCE
7.6%
UNEMPLOYMENT RATE
Tyrone Zip Codes
Tyrone Area Codes
Income in Tyrone
Income Overview in Tyrone
Per Capita Income in Tyrone is $43,864, while median incomes of families and households are $107,917 and $52,989 respectively.
| Characteristic | Number | Measure |
| Per Capita Income | 716 | $43,864 |
| Median Family Income | 139 | $107,917 |
| Mean Family Income | 139 | $93,006 |
| Median Household Income | 277 | $52,989 |
| Mean Household Income | 277 | $111,846 |
| Income Deficit | 139 | $0 |
| Wage / Income Gap (%) | 716 | 0.00% |
| Wage / Income Gap ($) | 716 | 100.00¢ per $1 |
| Gini / Inequality Index | 716 | 0.61 |
Earnings by Sex in Tyrone
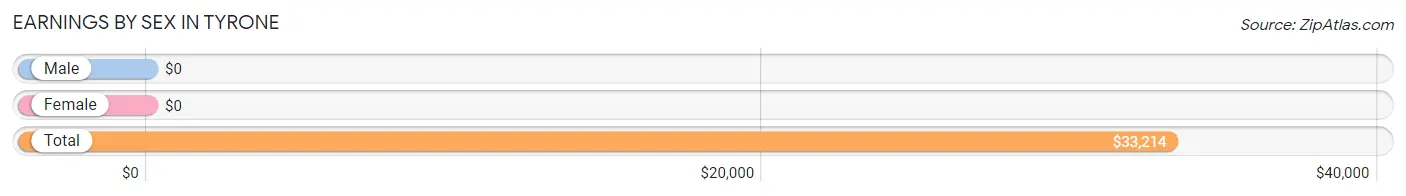
| Sex | Number | Average Earnings |
| Male | 175 (58.3%) | $0 |
| Female | 125 (41.7%) | $0 |
| Total | 300 (100.0%) | $33,214 |
Earnings by Sex by Income Bracket in Tyrone
The most common earnings brackets in Tyrone are $100,000+ for men (80 | 45.7%) and $12,500 to $14,999 for women (31 | 24.8%).
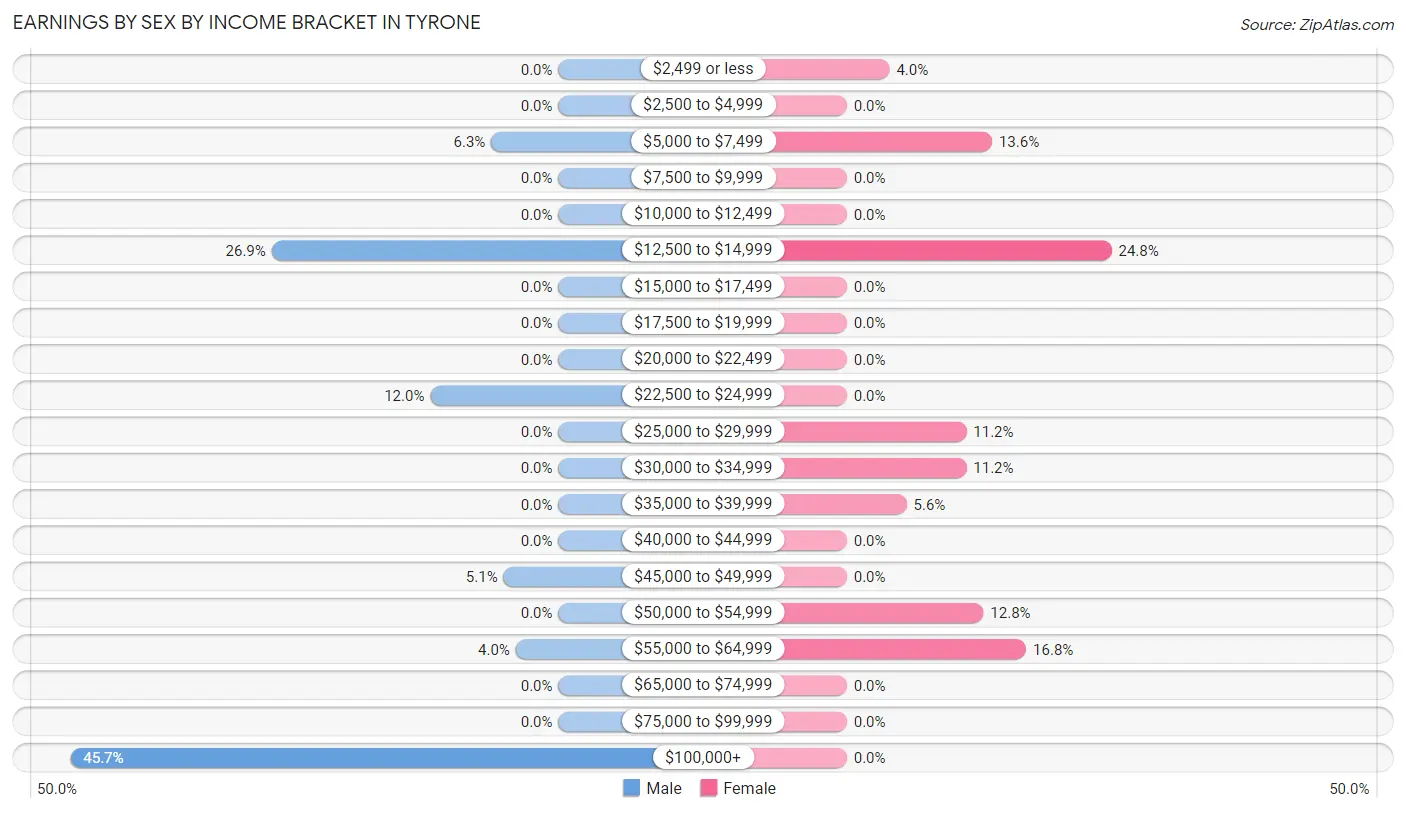
| Income | Male | Female |
| $2,499 or less | 0 (0.0%) | 5 (4.0%) |
| $2,500 to $4,999 | 0 (0.0%) | 0 (0.0%) |
| $5,000 to $7,499 | 11 (6.3%) | 17 (13.6%) |
| $7,500 to $9,999 | 0 (0.0%) | 0 (0.0%) |
| $10,000 to $12,499 | 0 (0.0%) | 0 (0.0%) |
| $12,500 to $14,999 | 47 (26.9%) | 31 (24.8%) |
| $15,000 to $17,499 | 0 (0.0%) | 0 (0.0%) |
| $17,500 to $19,999 | 0 (0.0%) | 0 (0.0%) |
| $20,000 to $22,499 | 0 (0.0%) | 0 (0.0%) |
| $22,500 to $24,999 | 21 (12.0%) | 0 (0.0%) |
| $25,000 to $29,999 | 0 (0.0%) | 14 (11.2%) |
| $30,000 to $34,999 | 0 (0.0%) | 14 (11.2%) |
| $35,000 to $39,999 | 0 (0.0%) | 7 (5.6%) |
| $40,000 to $44,999 | 0 (0.0%) | 0 (0.0%) |
| $45,000 to $49,999 | 9 (5.1%) | 0 (0.0%) |
| $50,000 to $54,999 | 0 (0.0%) | 16 (12.8%) |
| $55,000 to $64,999 | 7 (4.0%) | 21 (16.8%) |
| $65,000 to $74,999 | 0 (0.0%) | 0 (0.0%) |
| $75,000 to $99,999 | 0 (0.0%) | 0 (0.0%) |
| $100,000+ | 80 (45.7%) | 0 (0.0%) |
| Total | 175 (100.0%) | 125 (100.0%) |
Earnings by Sex by Educational Attainment in Tyrone
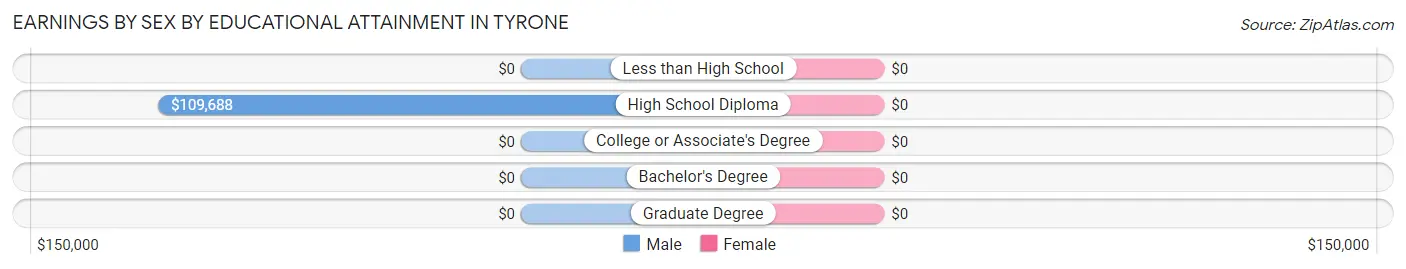
| Educational Attainment | Male Income | Female Income |
| Less than High School | - | - |
| High School Diploma | $109,688 | $0 |
| College or Associate's Degree | - | - |
| Bachelor's Degree | - | - |
| Graduate Degree | - | - |
| Total | $109,180 | $0 |
Family Income in Tyrone
Family Income Brackets in Tyrone
According to the Tyrone family income data, there are 45 families falling into the $150,000 to $199,999 income range, which is the most common income bracket and makes up 32.4% of all families.
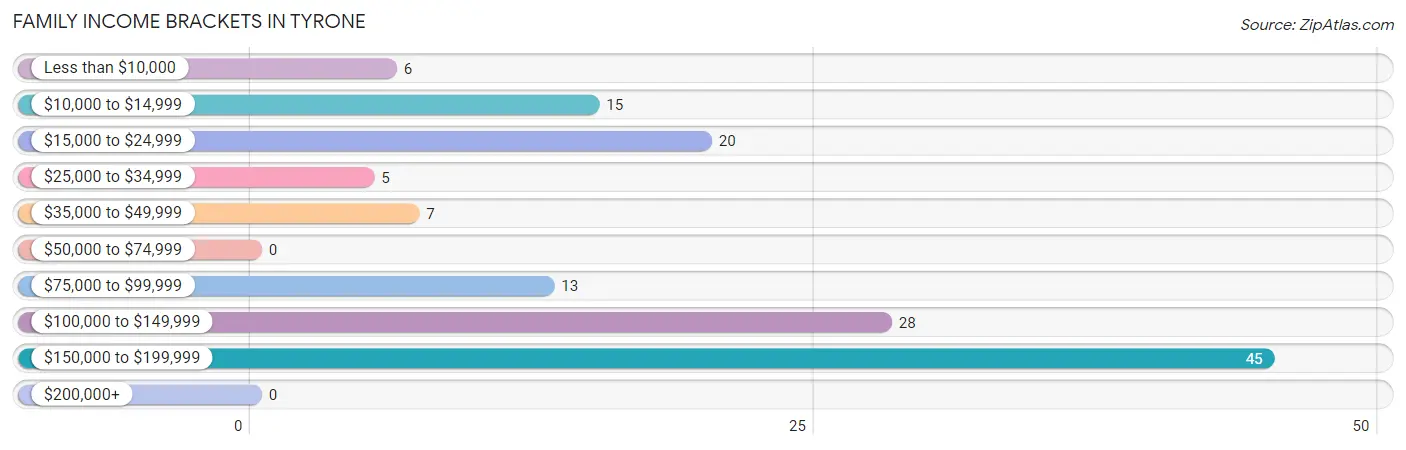
| Income Bracket | # Families | % Families |
| Less than $10,000 | 6 | 4.3% |
| $10,000 to $14,999 | 15 | 10.8% |
| $15,000 to $24,999 | 20 | 14.4% |
| $25,000 to $34,999 | 5 | 3.6% |
| $35,000 to $49,999 | 7 | 5.0% |
| $50,000 to $74,999 | 0 | 0.0% |
| $75,000 to $99,999 | 13 | 9.4% |
| $100,000 to $149,999 | 28 | 20.1% |
| $150,000 to $199,999 | 45 | 32.4% |
| $200,000+ | 0 | 0.0% |
Family Income by Famaliy Size in Tyrone
2-person families (78 | 56.1%) account for the highest median family income in Tyrone with $108,214 per family, while 2-person families (78 | 56.1%) have the highest median income of $54,107 per family member.
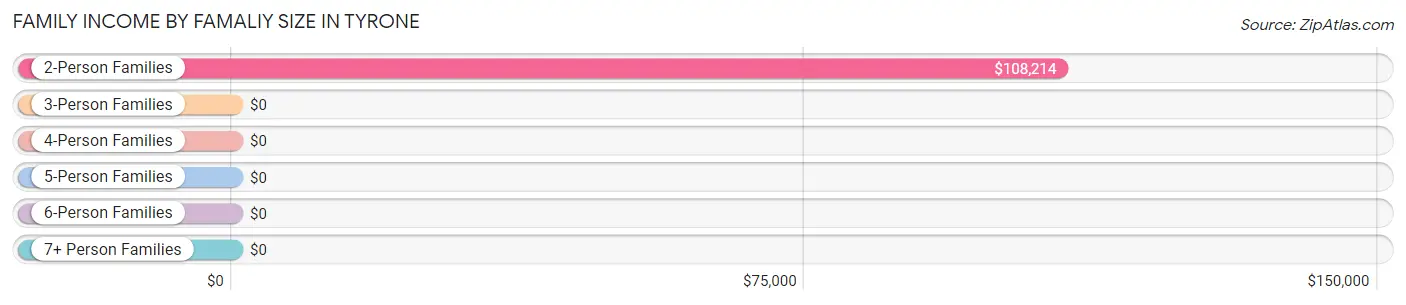
| Income Bracket | # Families | Median Income |
| 2-Person Families | 78 (56.1%) | $108,214 |
| 3-Person Families | 14 (10.1%) | $0 |
| 4-Person Families | 0 (0.0%) | $0 |
| 5-Person Families | 34 (24.5%) | $0 |
| 6-Person Families | 13 (9.3%) | $0 |
| 7+ Person Families | 0 (0.0%) | $0 |
| Total | 139 (100.0%) | $107,917 |
Family Income by Number of Earners in Tyrone
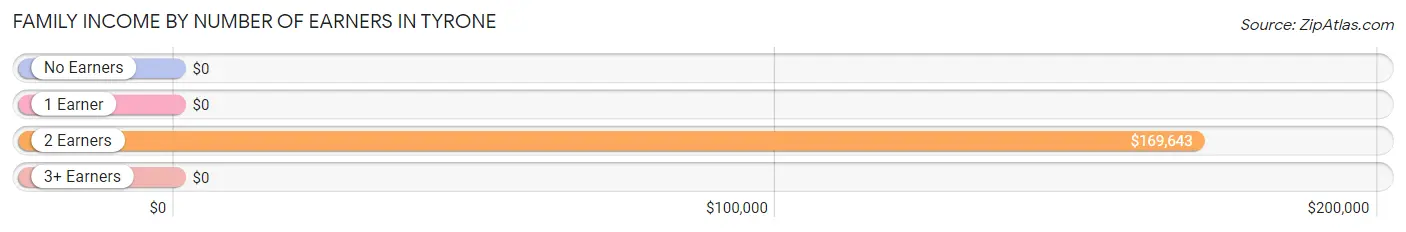
| Number of Earners | # Families | Median Income |
| No Earners | 31 (22.3%) | $0 |
| 1 Earner | 56 (40.3%) | $0 |
| 2 Earners | 38 (27.3%) | $169,643 |
| 3+ Earners | 14 (10.1%) | $0 |
| Total | 139 (100.0%) | $107,917 |
Household Income in Tyrone
Household Income Brackets in Tyrone
With 51 households falling in the category, the $35,000 to $49,999 income range is the most frequent in Tyrone, accounting for 18.4% of all households. In contrast, only 5 households (1.8%) fall into the $25,000 to $34,999 income bracket, making it the least populous group.
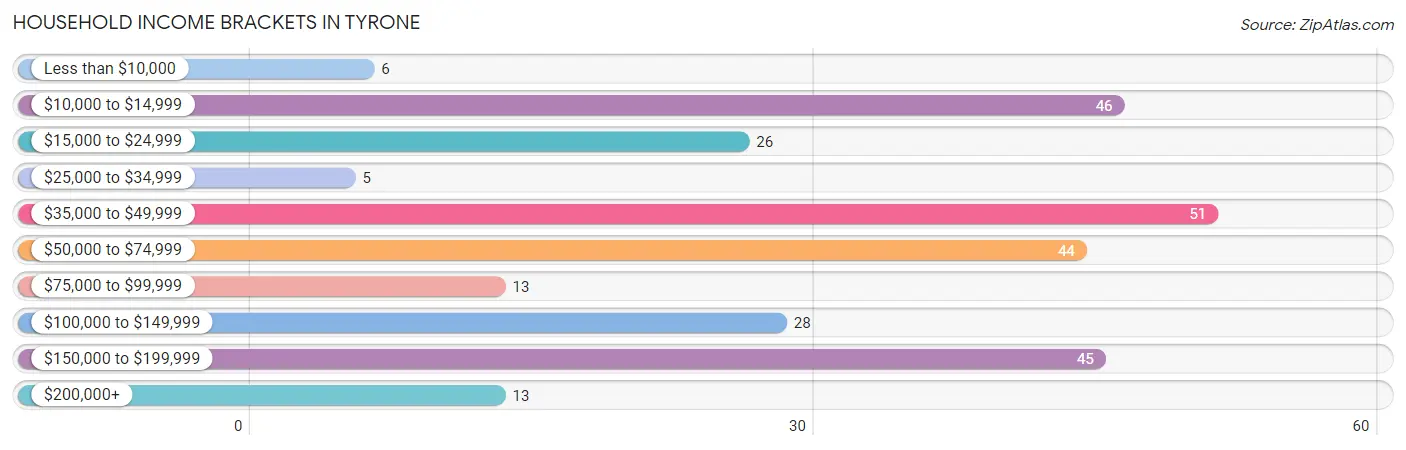
| Income Bracket | # Households | % Households |
| Less than $10,000 | 6 | 2.2% |
| $10,000 to $14,999 | 46 | 16.6% |
| $15,000 to $24,999 | 26 | 9.4% |
| $25,000 to $34,999 | 5 | 1.8% |
| $35,000 to $49,999 | 51 | 18.4% |
| $50,000 to $74,999 | 44 | 15.9% |
| $75,000 to $99,999 | 13 | 4.7% |
| $100,000 to $149,999 | 28 | 10.1% |
| $150,000 to $199,999 | 45 | 16.2% |
| $200,000+ | 13 | 4.7% |
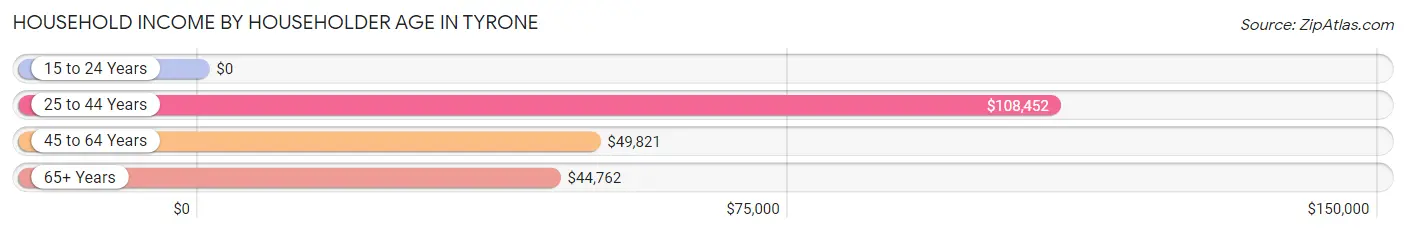
Household Income by Householder Age in Tyrone
The median household income in Tyrone is $52,989, with the highest median household income of $108,452 found in the 25 to 44 years age bracket for the primary householder. A total of 82 households (29.6%) fall into this category.
| Income Bracket | # Households | Median Income |
| 15 to 24 Years | 0 (0.0%) | $0 |
| 25 to 44 Years | 82 (29.6%) | $108,452 |
| 45 to 64 Years | 135 (48.7%) | $49,821 |
| 65+ Years | 60 (21.7%) | $44,762 |
| Total | 277 (100.0%) | $52,989 |
Poverty in Tyrone
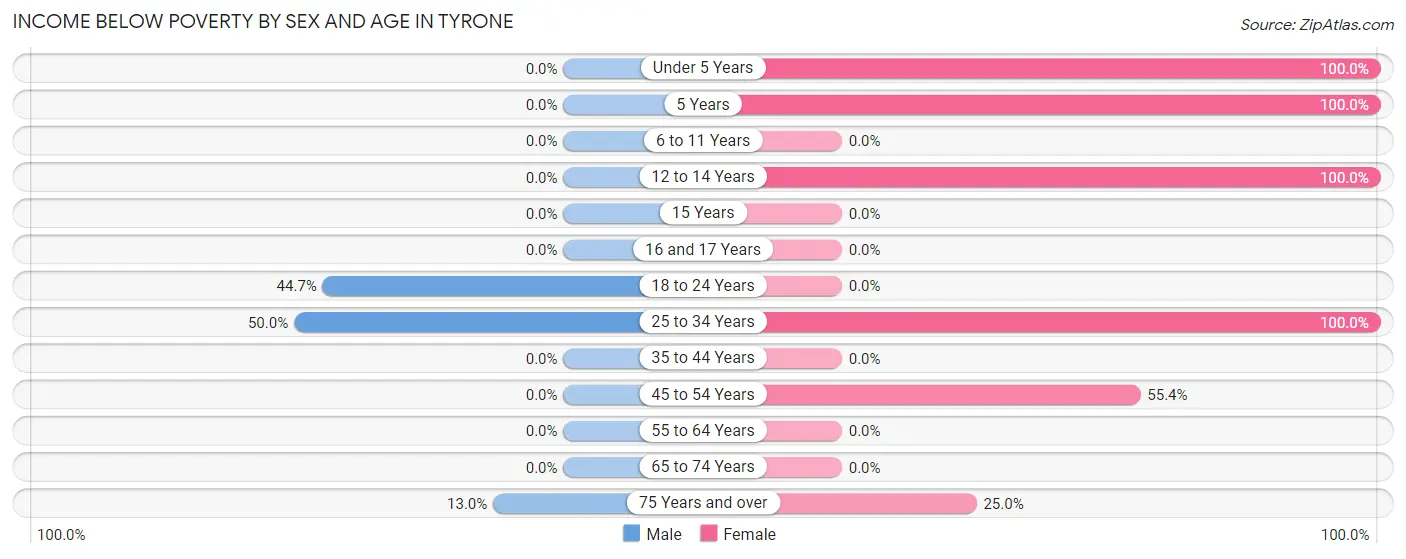
Income Below Poverty by Sex and Age in Tyrone
With 12.6% poverty level for males and 49.8% for females among the residents of Tyrone, 25 to 34 year old males and under 5 year old females are the most vulnerable to poverty, with 21 males (50.0%) and 42 females (100.0%) in their respective age groups living below the poverty level.
| Age Bracket | Male | Female |
| Under 5 Years | 0 (0.0%) | 42 (100.0%) |
| 5 Years | 0 (0.0%) | 27 (100.0%) |
| 6 to 11 Years | 0 (0.0%) | 0 (0.0%) |
| 12 to 14 Years | 0 (0.0%) | 26 (100.0%) |
| 15 Years | 0 (0.0%) | 0 (0.0%) |
| 16 and 17 Years | 0 (0.0%) | 0 (0.0%) |
| 18 to 24 Years | 21 (44.7%) | 0 (0.0%) |
| 25 to 34 Years | 21 (50.0%) | 20 (100.0%) |
| 35 to 44 Years | 0 (0.0%) | 0 (0.0%) |
| 45 to 54 Years | 0 (0.0%) | 46 (55.4%) |
| 55 to 64 Years | 0 (0.0%) | 0 (0.0%) |
| 65 to 74 Years | 0 (0.0%) | 0 (0.0%) |
| 75 Years and over | 6 (13.0%) | 6 (25.0%) |
| Total | 48 (12.6%) | 167 (49.8%) |
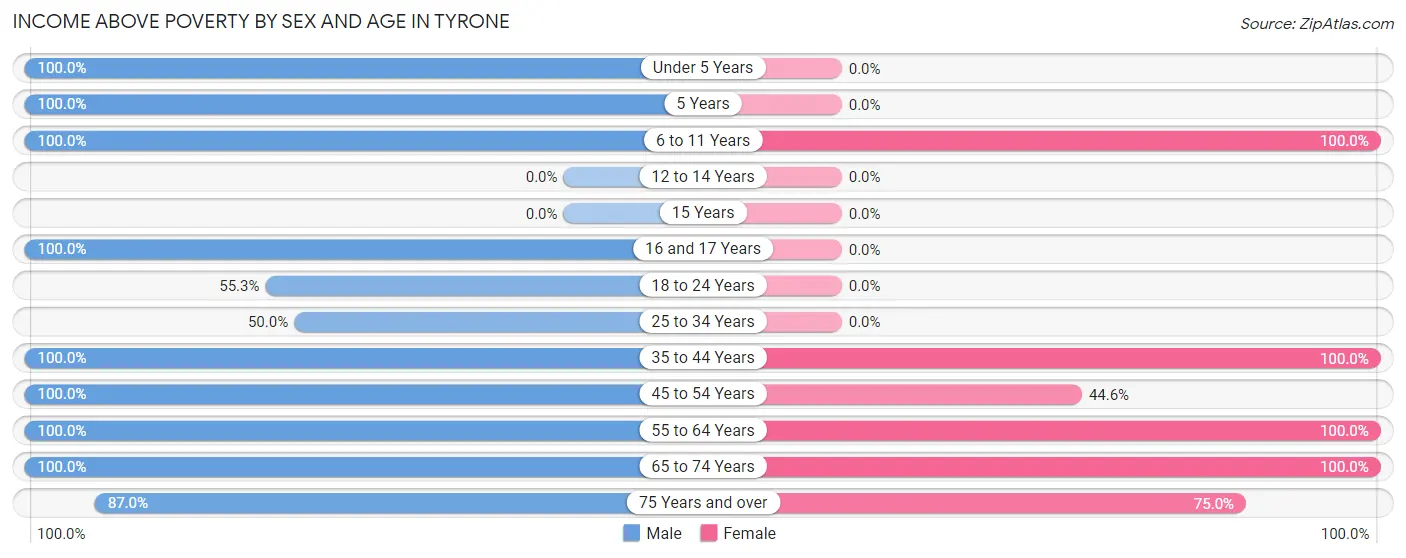
Income Above Poverty by Sex and Age in Tyrone
According to the poverty statistics in Tyrone, males aged under 5 years and females aged 6 to 11 years are the age groups that are most secure financially, with 100.0% of males and 100.0% of females in these age groups living above the poverty line.
| Age Bracket | Male | Female |
| Under 5 Years | 85 (100.0%) | 0 (0.0%) |
| 5 Years | 18 (100.0%) | 0 (0.0%) |
| 6 to 11 Years | 36 (100.0%) | 16 (100.0%) |
| 12 to 14 Years | 0 (0.0%) | 0 (0.0%) |
| 15 Years | 0 (0.0%) | 0 (0.0%) |
| 16 and 17 Years | 11 (100.0%) | 0 (0.0%) |
| 18 to 24 Years | 26 (55.3%) | 0 (0.0%) |
| 25 to 34 Years | 21 (50.0%) | 0 (0.0%) |
| 35 to 44 Years | 30 (100.0%) | 62 (100.0%) |
| 45 to 54 Years | 33 (100.0%) | 37 (44.6%) |
| 55 to 64 Years | 9 (100.0%) | 30 (100.0%) |
| 65 to 74 Years | 24 (100.0%) | 5 (100.0%) |
| 75 Years and over | 40 (87.0%) | 18 (75.0%) |
| Total | 333 (87.4%) | 168 (50.1%) |
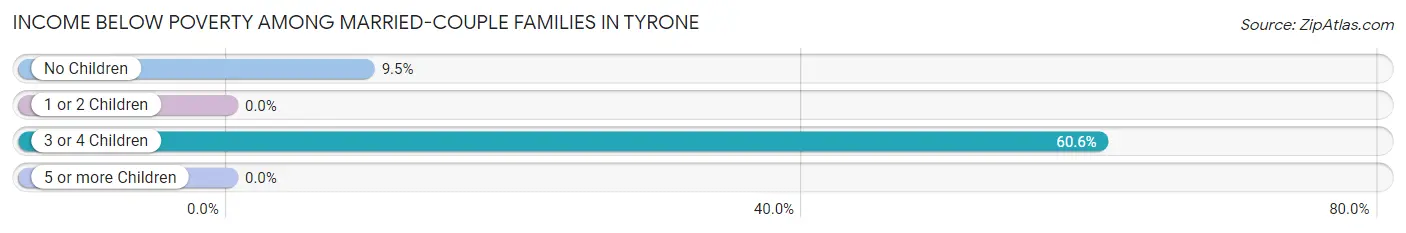
Income Below Poverty Among Married-Couple Families in Tyrone
The poverty statistics for married-couple families in Tyrone show that 21.0% or 26 of the total 124 families live below the poverty line. Families with 3 or 4 children have the highest poverty rate of 60.6%, comprising of 20 families. On the other hand, families with 1 or 2 children have the lowest poverty rate of 0.0%, which includes 0 families.
| Children | Above Poverty | Below Poverty |
| No Children | 57 (90.5%) | 6 (9.5%) |
| 1 or 2 Children | 28 (100.0%) | 0 (0.0%) |
| 3 or 4 Children | 13 (39.4%) | 20 (60.6%) |
| 5 or more Children | 0 (0.0%) | 0 (0.0%) |
| Total | 98 (79.0%) | 26 (21.0%) |
Income Below Poverty Among Single-Parent Households in Tyrone
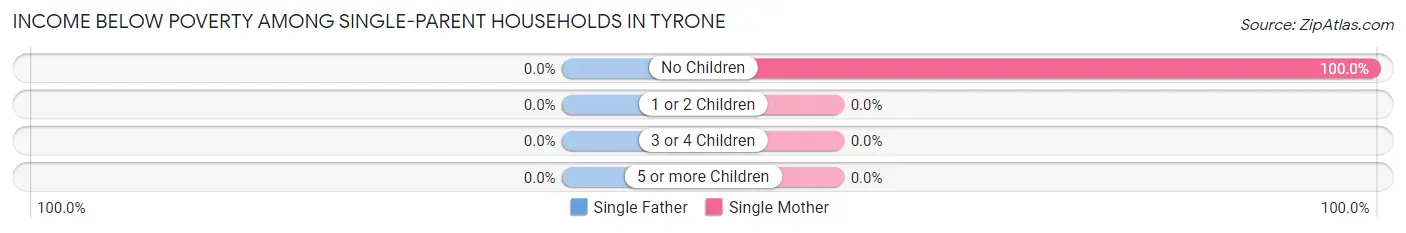
| Children | Single Father | Single Mother |
| No Children | 0 (0.0%) | 15 (100.0%) |
| 1 or 2 Children | 0 (0.0%) | 0 (0.0%) |
| 3 or 4 Children | 0 (0.0%) | 0 (0.0%) |
| 5 or more Children | 0 (0.0%) | 0 (0.0%) |
| Total | 0 (0.0%) | 15 (100.0%) |
Income Below Poverty Among Married-Couple vs Single-Parent Households in Tyrone
The poverty data for Tyrone shows that 26 of the married-couple family households (21.0%) and 15 of the single-parent households (100.0%) are living below the poverty level. Within the married-couple family households, those with 3 or 4 children have the highest poverty rate, with 20 households (60.6%) falling below the poverty line. Among the single-parent households, those with no children have the highest poverty rate, with 15 household (100.0%) living below poverty.
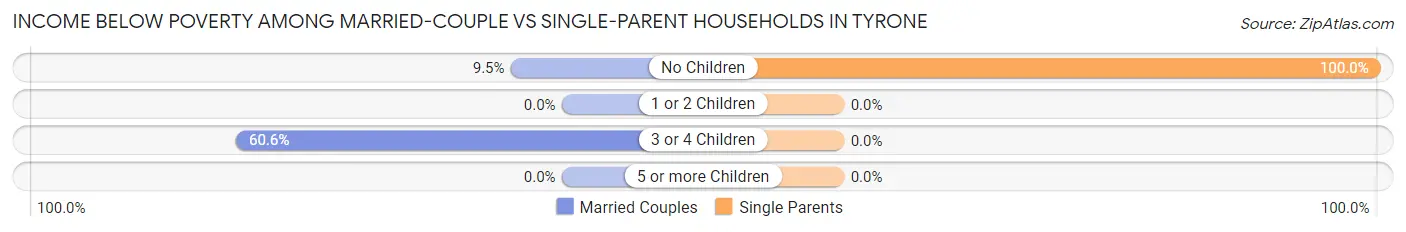
| Children | Married-Couple Families | Single-Parent Households |
| No Children | 6 (9.5%) | 15 (100.0%) |
| 1 or 2 Children | 0 (0.0%) | 0 (0.0%) |
| 3 or 4 Children | 20 (60.6%) | 0 (0.0%) |
| 5 or more Children | 0 (0.0%) | 0 (0.0%) |
| Total | 26 (21.0%) | 15 (100.0%) |
Race in Tyrone
The most populous races in Tyrone are White / Caucasian (545 | 76.1%), Hispanic or Latino (399 | 55.7%), and Two or more Races (143 | 20.0%).
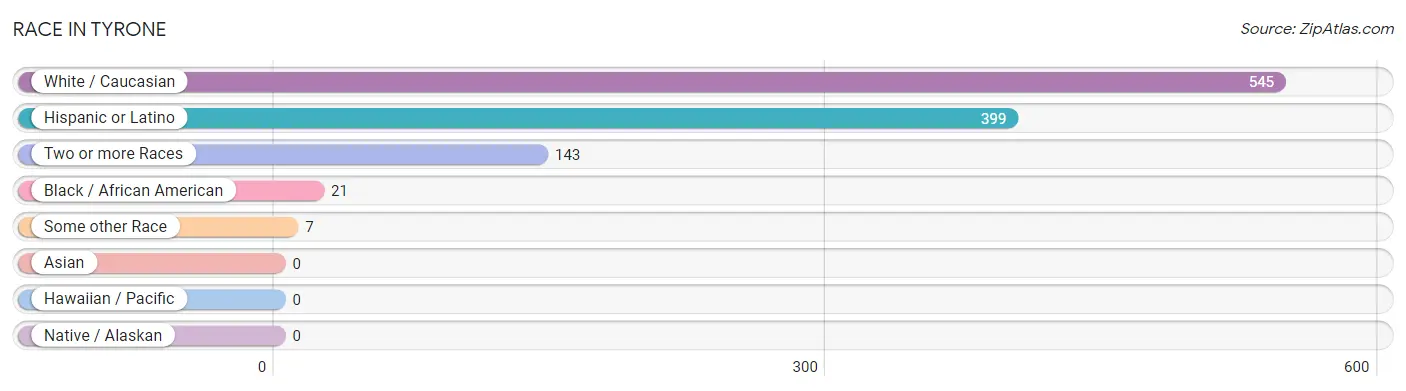
| Race | # Population | % Population |
| Asian | 0 | 0.0% |
| Black / African American | 21 | 2.9% |
| Hawaiian / Pacific | 0 | 0.0% |
| Hispanic or Latino | 399 | 55.7% |
| Native / Alaskan | 0 | 0.0% |
| White / Caucasian | 545 | 76.1% |
| Two or more Races | 143 | 20.0% |
| Some other Race | 7 | 1.0% |
| Total | 716 | 100.0% |
Ancestry in Tyrone
The most populous ancestries reported in Tyrone are Mexican (399 | 55.7%), German (81 | 11.3%), French (56 | 7.8%), Italian (50 | 7.0%), and English (43 | 6.0%), together accounting for 87.9% of all Tyrone residents.
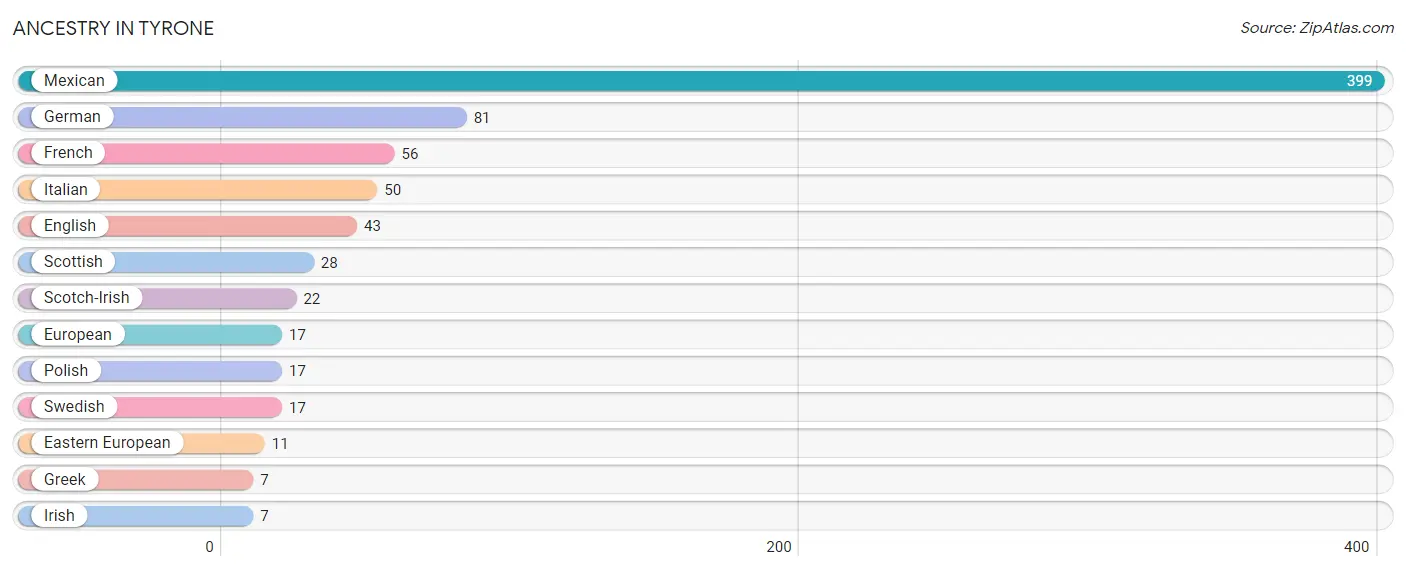
| Ancestry | # Population | % Population |
| Eastern European | 11 | 1.5% |
| English | 43 | 6.0% |
| European | 17 | 2.4% |
| French | 56 | 7.8% |
| German | 81 | 11.3% |
| Greek | 7 | 1.0% |
| Irish | 7 | 1.0% |
| Italian | 50 | 7.0% |
| Mexican | 399 | 55.7% |
| Polish | 17 | 2.4% |
| Scotch-Irish | 22 | 3.1% |
| Scottish | 28 | 3.9% |
| Swedish | 17 | 2.4% | View All 13 Rows |
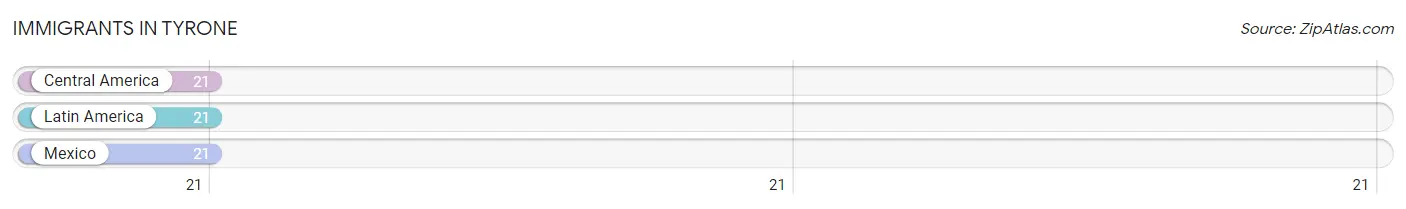
Immigrants in Tyrone
The most numerous immigrant groups reported in Tyrone came from Central America (21 | 2.9%), Latin America (21 | 2.9%), and Mexico (21 | 2.9%), together accounting for 8.8% of all Tyrone residents.
| Immigration Origin | # Population | % Population |
| Central America | 21 | 2.9% |
| Latin America | 21 | 2.9% |
| Mexico | 21 | 2.9% | View All 3 Rows |
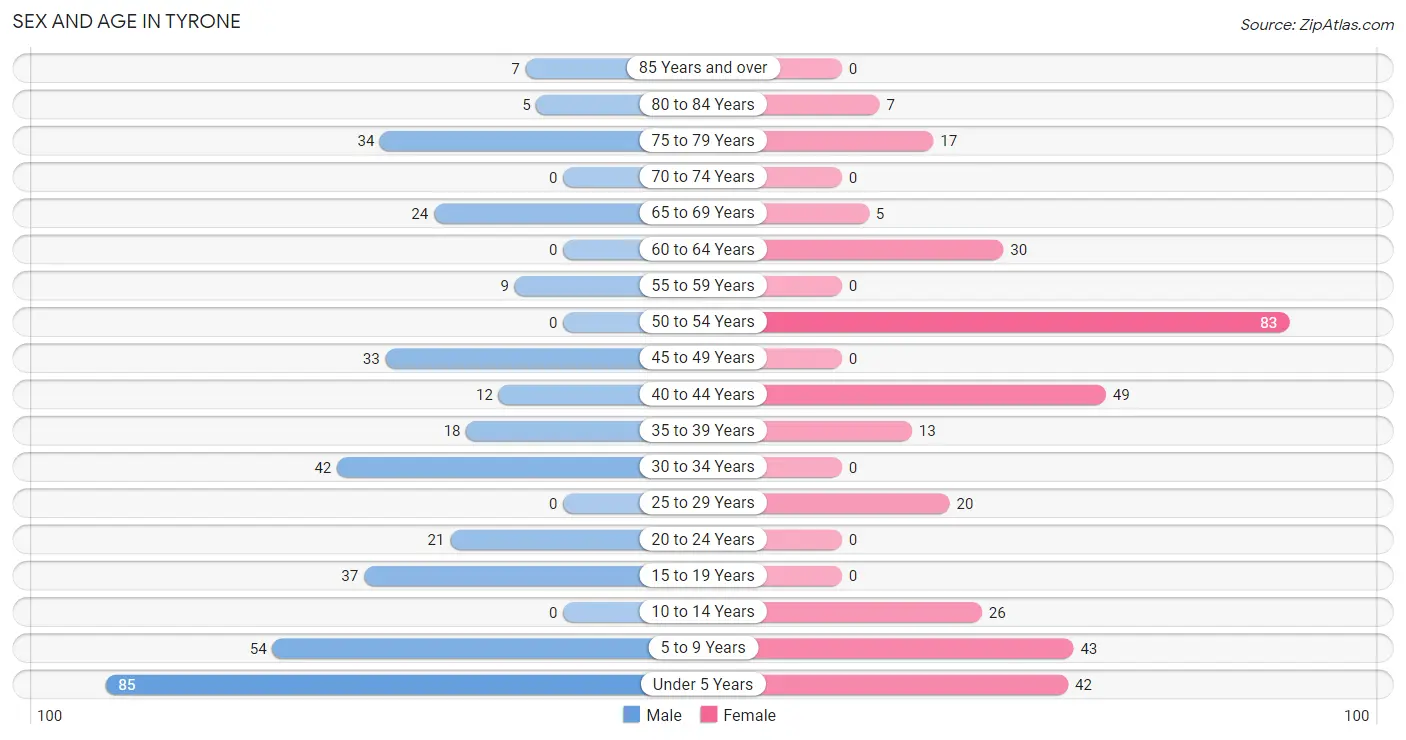
Sex and Age in Tyrone
Sex and Age in Tyrone
The most populous age groups in Tyrone are Under 5 Years (85 | 22.3%) for men and 50 to 54 Years (83 | 24.8%) for women.
| Age Bracket | Male | Female |
| Under 5 Years | 85 (22.3%) | 42 (12.5%) |
| 5 to 9 Years | 54 (14.2%) | 43 (12.8%) |
| 10 to 14 Years | 0 (0.0%) | 26 (7.8%) |
| 15 to 19 Years | 37 (9.7%) | 0 (0.0%) |
| 20 to 24 Years | 21 (5.5%) | 0 (0.0%) |
| 25 to 29 Years | 0 (0.0%) | 20 (6.0%) |
| 30 to 34 Years | 42 (11.0%) | 0 (0.0%) |
| 35 to 39 Years | 18 (4.7%) | 13 (3.9%) |
| 40 to 44 Years | 12 (3.2%) | 49 (14.6%) |
| 45 to 49 Years | 33 (8.7%) | 0 (0.0%) |
| 50 to 54 Years | 0 (0.0%) | 83 (24.8%) |
| 55 to 59 Years | 9 (2.4%) | 0 (0.0%) |
| 60 to 64 Years | 0 (0.0%) | 30 (9.0%) |
| 65 to 69 Years | 24 (6.3%) | 5 (1.5%) |
| 70 to 74 Years | 0 (0.0%) | 0 (0.0%) |
| 75 to 79 Years | 34 (8.9%) | 17 (5.1%) |
| 80 to 84 Years | 5 (1.3%) | 7 (2.1%) |
| 85 Years and over | 7 (1.8%) | 0 (0.0%) |
| Total | 381 (100.0%) | 335 (100.0%) |
Families and Households in Tyrone
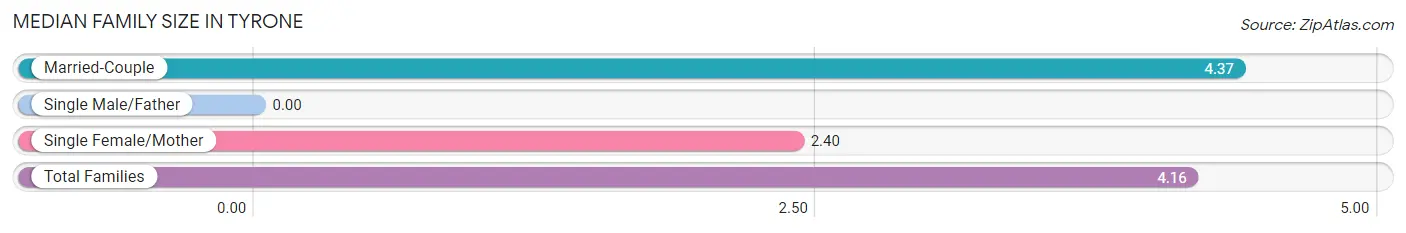
Median Family Size in Tyrone
| Family Type | # Families | Family Size |
| Married-Couple | 124 (89.2%) | 4.37 |
| Single Male/Father | 0 (0.0%) | - |
| Single Female/Mother | 15 (10.8%) | 2.40 |
| Total Families | 139 (100.0%) | 4.16 |
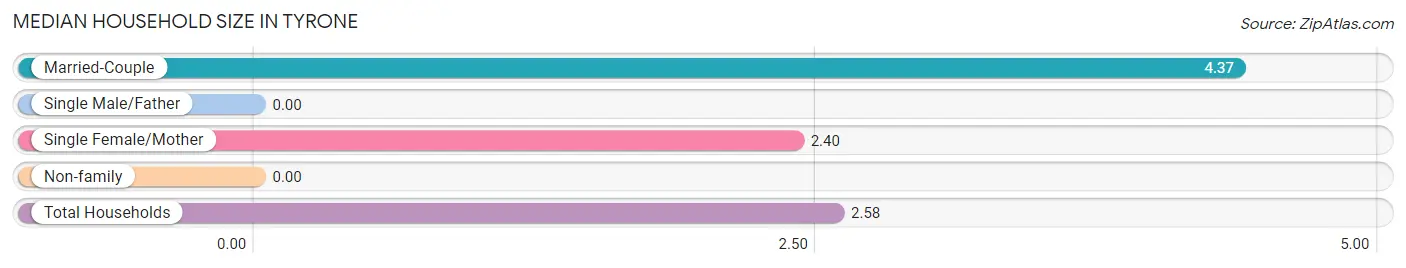
Median Household Size in Tyrone
| Household Type | # Households | Household Size |
| Married-Couple | 124 (44.8%) | 4.37 |
| Single Male/Father | 0 (0.0%) | - |
| Single Female/Mother | 15 (5.4%) | 2.40 |
| Non-family | 138 (49.8%) | - |
| Total Households | 277 (100.0%) | 2.58 |
Household Size by Marriage Status in Tyrone
Out of a total of 277 households in Tyrone, 139 (50.2%) are family households, while 138 (49.8%) are nonfamily households. The most numerous type of family households are 2-person households, comprising 78, and the most common type of nonfamily households are 1-person households, comprising 138.
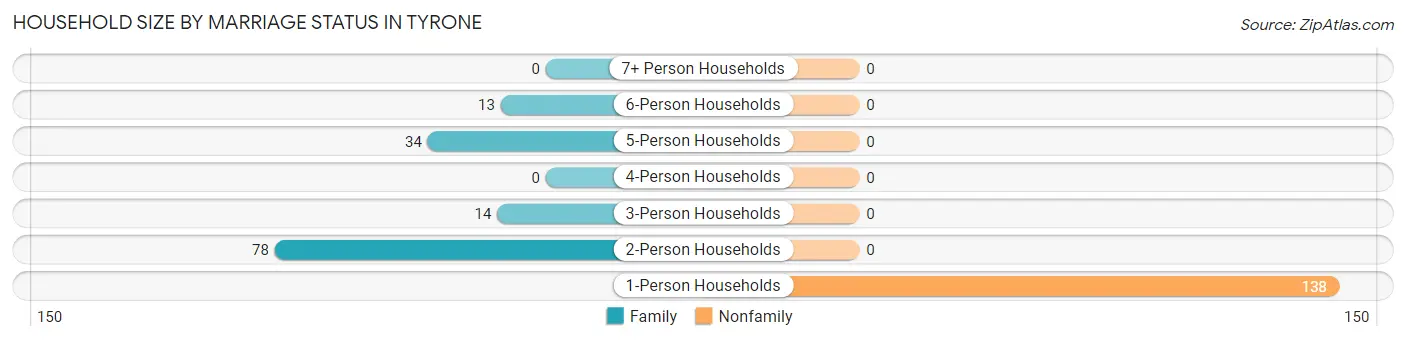
| Household Size | Family Households | Nonfamily Households |
| 1-Person Households | - | 138 (49.8%) |
| 2-Person Households | 78 (28.2%) | 0 (0.0%) |
| 3-Person Households | 14 (5.1%) | 0 (0.0%) |
| 4-Person Households | 0 (0.0%) | 0 (0.0%) |
| 5-Person Households | 34 (12.3%) | 0 (0.0%) |
| 6-Person Households | 13 (4.7%) | 0 (0.0%) |
| 7+ Person Households | 0 (0.0%) | 0 (0.0%) |
| Total | 139 (50.2%) | 138 (49.8%) |
Female Fertility in Tyrone
Fertility by Age in Tyrone
| Age Bracket | Women with Births | Births / 1,000 Women |
| 15 to 19 years | 0 (0.0%) | 0.0 |
| 20 to 34 years | 0 (0.0%) | 0.0 |
| 35 to 50 years | 0 (0.0%) | 0.0 |
| Total | 0 (0.0%) | 0.0 |
Fertility by Age by Marriage Status in Tyrone
| Age Bracket | Married | Unmarried |
| 15 to 19 years | 0 (0.0%) | 0 (0.0%) |
| 20 to 34 years | 0 (0.0%) | 0 (0.0%) |
| 35 to 50 years | 0 (0.0%) | 0 (0.0%) |
| Total | 0 (0.0%) | 0 (0.0%) |
Fertility by Education in Tyrone
| Educational Attainment | Women with Births | Births / 1,000 Women |
| Less than High School | 0 (0.0%) | 0.0 |
| High School Diploma | 0 (0.0%) | 0.0 |
| College or Associate's Degree | 0 (0.0%) | 0.0 |
| Bachelor's Degree | 0 (0.0%) | 0.0 |
| Graduate Degree | 0 (0.0%) | 0.0 |
| Total | 0 (0.0%) | 0.0 |
Fertility by Education by Marriage Status in Tyrone
| Educational Attainment | Married | Unmarried |
| Less than High School | 0 (0.0%) | 0 (0.0%) |
| High School Diploma | 0 (0.0%) | 0 (0.0%) |
| College or Associate's Degree | 0 (0.0%) | 0 (0.0%) |
| Bachelor's Degree | 0 (0.0%) | 0 (0.0%) |
| Graduate Degree | 0 (0.0%) | 0 (0.0%) |
| Total | 0 (0.0%) | 0 (0.0%) |
Employment Characteristics in Tyrone
Employment by Class of Employer in Tyrone
Among the 257 employed individuals in Tyrone, private company employees (173 | 67.3%), federal government employees (50 | 19.5%), and local government employees (14 | 5.4%) make up the most common classes of employment.
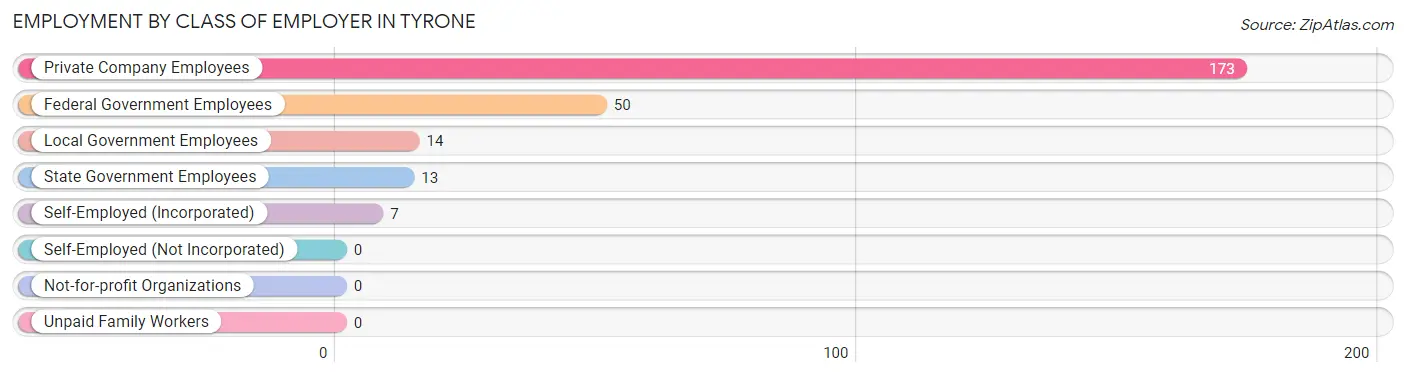
| Employer Class | # Employees | % Employees |
| Private Company Employees | 173 | 67.3% |
| Self-Employed (Incorporated) | 7 | 2.7% |
| Self-Employed (Not Incorporated) | 0 | 0.0% |
| Not-for-profit Organizations | 0 | 0.0% |
| Local Government Employees | 14 | 5.4% |
| State Government Employees | 13 | 5.1% |
| Federal Government Employees | 50 | 19.5% |
| Unpaid Family Workers | 0 | 0.0% |
| Total | 257 | 100.0% |
Employment Status by Age in Tyrone
According to the labor force statistics for Tyrone, out of the total population over 16 years of age (466), 59.7% or 278 individuals are in the labor force, with 7.6% or 21 of them unemployed. The age group with the highest labor force participation rate is 16 to 19 years, with 100.0% or 37 individuals in the labor force. Within the labor force, the 35 to 44 years age range has the highest percentage of unemployed individuals, with 26.6% or 21 of them being unemployed.
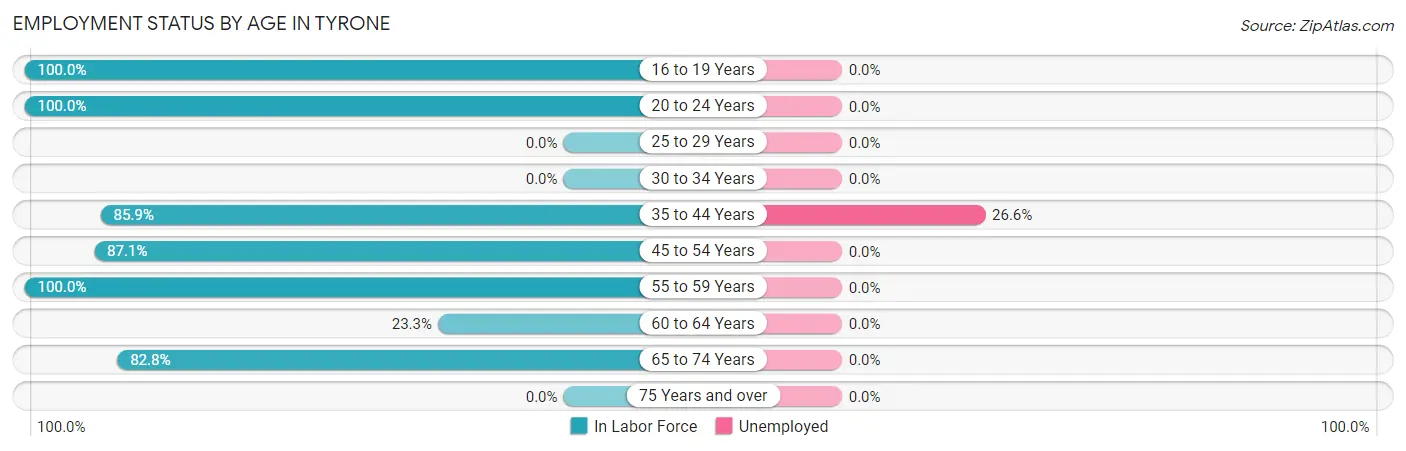
| Age Bracket | In Labor Force | Unemployed |
| 16 to 19 Years | 37 (100.0%) | 0 (0.0%) |
| 20 to 24 Years | 21 (100.0%) | 0 (0.0%) |
| 25 to 29 Years | 0 (0.0%) | 0 (0.0%) |
| 30 to 34 Years | 0 (0.0%) | 0 (0.0%) |
| 35 to 44 Years | 79 (85.9%) | 21 (26.6%) |
| 45 to 54 Years | 101 (87.1%) | 0 (0.0%) |
| 55 to 59 Years | 9 (100.0%) | 0 (0.0%) |
| 60 to 64 Years | 7 (23.3%) | 0 (0.0%) |
| 65 to 74 Years | 24 (82.8%) | 0 (0.0%) |
| 75 Years and over | 0 (0.0%) | 0 (0.0%) |
| Total | 278 (59.7%) | 21 (7.6%) |
Employment Status by Educational Attainment in Tyrone
According to labor force statistics for Tyrone, 63.4% of individuals (196) out of the total population between 25 and 64 years of age (309) are in the labor force, with 10.7% or 21 of them being unemployed. The group with the highest labor force participation rate are those with the educational attainment of college / associate degree, with 67.7% or 86 individuals in the labor force. Within the labor force, individuals with less than high school education have the highest percentage of unemployment, with 100.0% or 21 of them being unemployed.
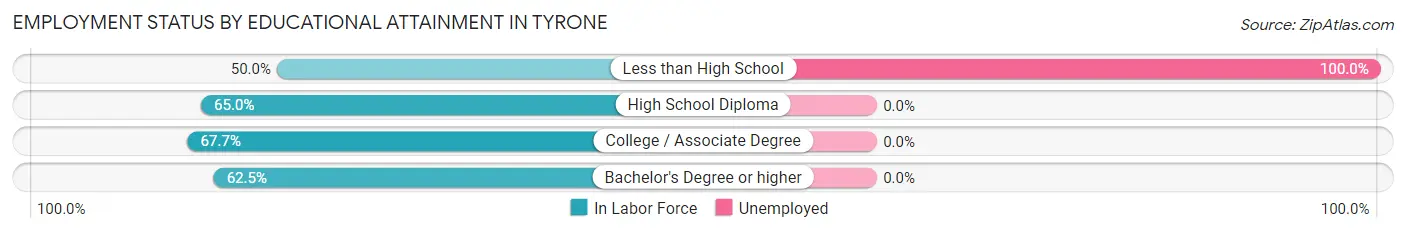
| Educational Attainment | In Labor Force | Unemployed |
| Less than High School | 21 (50.0%) | 42 (100.0%) |
| High School Diploma | 39 (65.0%) | 0 (0.0%) |
| College / Associate Degree | 86 (67.7%) | 0 (0.0%) |
| Bachelor's Degree or higher | 50 (62.5%) | 0 (0.0%) |
| Total | 196 (63.4%) | 33 (10.7%) |
Employment Occupations by Sex in Tyrone
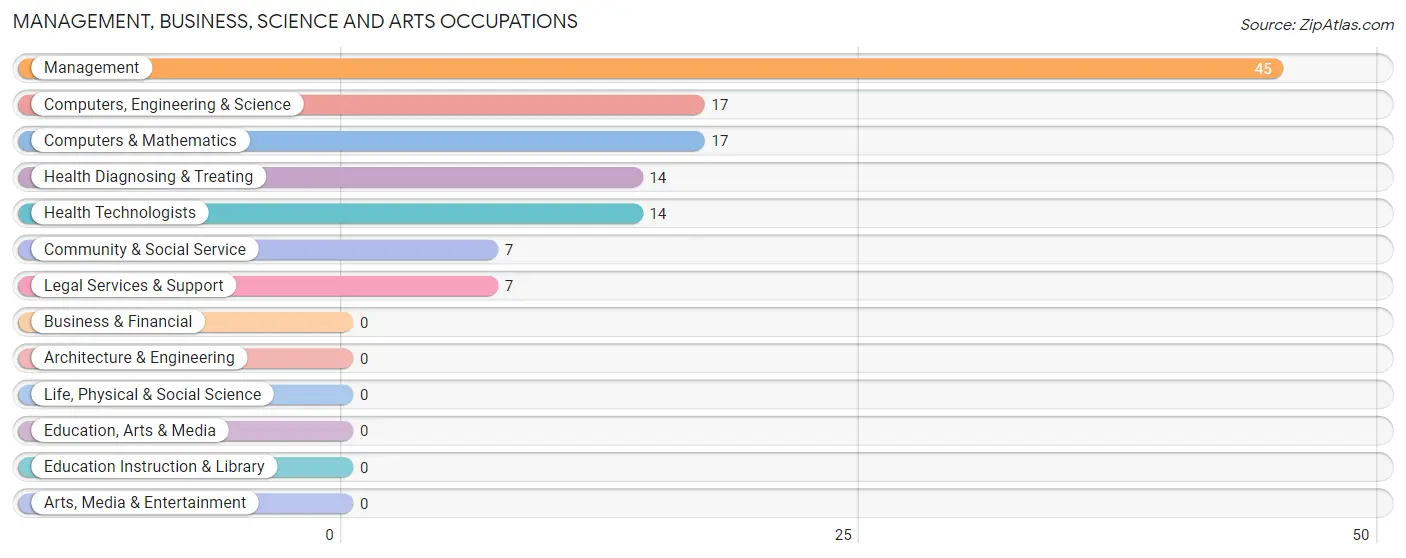
Management, Business, Science and Arts Occupations
The most common Management, Business, Science and Arts occupations in Tyrone are Management (45 | 17.5%), Computers, Engineering & Science (17 | 6.6%), Computers & Mathematics (17 | 6.6%), Health Diagnosing & Treating (14 | 5.4%), and Health Technologists (14 | 5.4%).
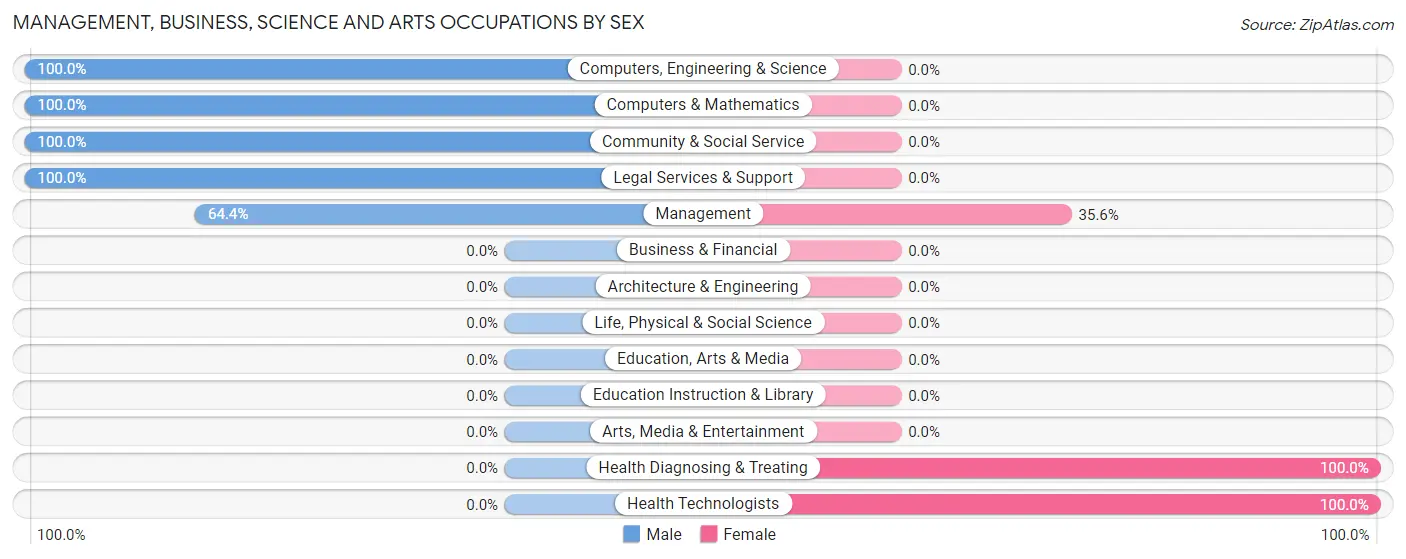
Management, Business, Science and Arts Occupations by Sex
Within the Management, Business, Science and Arts occupations in Tyrone, the most male-oriented occupations are Computers, Engineering & Science (100.0%), Computers & Mathematics (100.0%), and Community & Social Service (100.0%), while the most female-oriented occupations are Health Diagnosing & Treating (100.0%), Health Technologists (100.0%), and Management (35.6%).
| Occupation | Male | Female |
| Management | 29 (64.4%) | 16 (35.6%) |
| Business & Financial | 0 (0.0%) | 0 (0.0%) |
| Computers, Engineering & Science | 17 (100.0%) | 0 (0.0%) |
| Computers & Mathematics | 17 (100.0%) | 0 (0.0%) |
| Architecture & Engineering | 0 (0.0%) | 0 (0.0%) |
| Life, Physical & Social Science | 0 (0.0%) | 0 (0.0%) |
| Community & Social Service | 7 (100.0%) | 0 (0.0%) |
| Education, Arts & Media | 0 (0.0%) | 0 (0.0%) |
| Legal Services & Support | 7 (100.0%) | 0 (0.0%) |
| Education Instruction & Library | 0 (0.0%) | 0 (0.0%) |
| Arts, Media & Entertainment | 0 (0.0%) | 0 (0.0%) |
| Health Diagnosing & Treating | 0 (0.0%) | 14 (100.0%) |
| Health Technologists | 0 (0.0%) | 14 (100.0%) |
| Total (Category) | 53 (63.9%) | 30 (36.1%) |
| Total (Overall) | 154 (59.9%) | 103 (40.1%) |
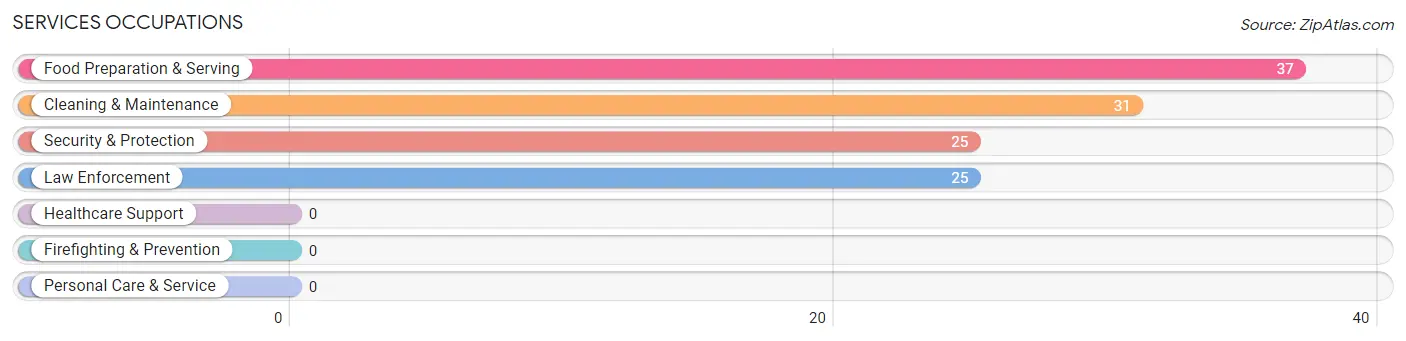
Services Occupations
The most common Services occupations in Tyrone are Food Preparation & Serving (37 | 14.4%), Cleaning & Maintenance (31 | 12.1%), Security & Protection (25 | 9.7%), and Law Enforcement (25 | 9.7%).
Services Occupations by Sex
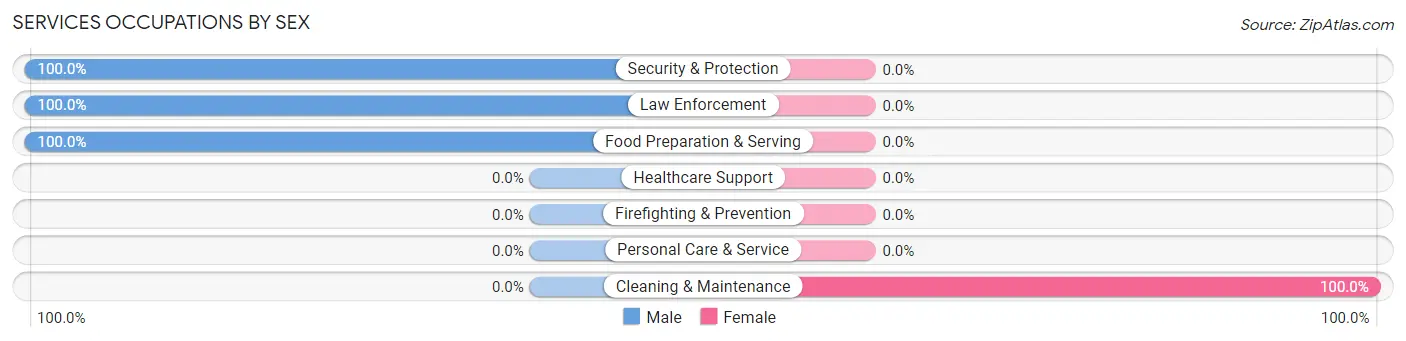
| Occupation | Male | Female |
| Healthcare Support | 0 (0.0%) | 0 (0.0%) |
| Security & Protection | 25 (100.0%) | 0 (0.0%) |
| Firefighting & Prevention | 0 (0.0%) | 0 (0.0%) |
| Law Enforcement | 25 (100.0%) | 0 (0.0%) |
| Food Preparation & Serving | 37 (100.0%) | 0 (0.0%) |
| Cleaning & Maintenance | 0 (0.0%) | 31 (100.0%) |
| Personal Care & Service | 0 (0.0%) | 0 (0.0%) |
| Total (Category) | 62 (66.7%) | 31 (33.3%) |
| Total (Overall) | 154 (59.9%) | 103 (40.1%) |
Sales and Office Occupations
The most common Sales and Office occupations in Tyrone are , and Office & Administration (81 | 31.5%).
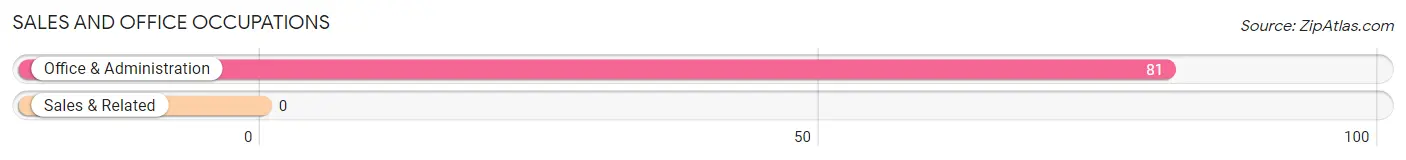
Sales and Office Occupations by Sex
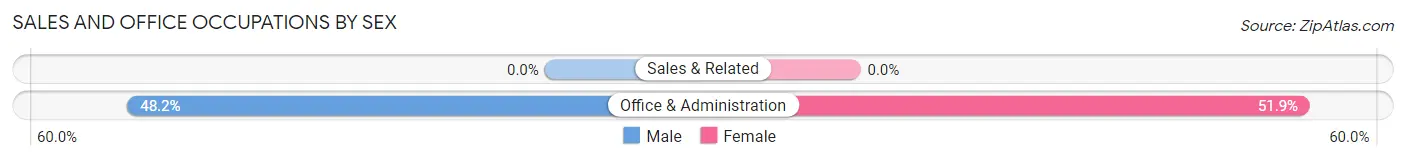
| Occupation | Male | Female |
| Sales & Related | 0 (0.0%) | 0 (0.0%) |
| Office & Administration | 39 (48.1%) | 42 (51.8%) |
| Total (Category) | 39 (48.1%) | 42 (51.8%) |
| Total (Overall) | 154 (59.9%) | 103 (40.1%) |
Natural Resources, Construction and Maintenance Occupations
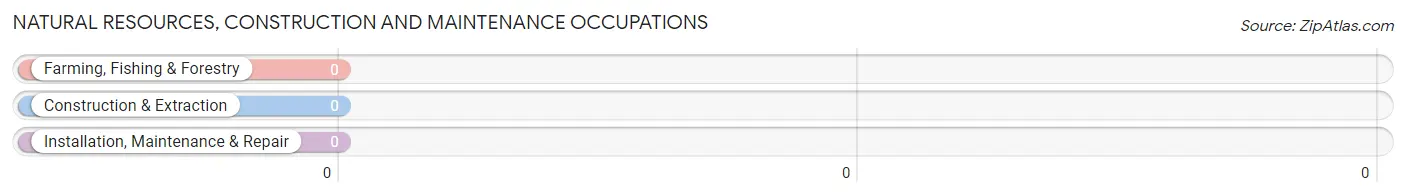
Natural Resources, Construction and Maintenance Occupations by Sex
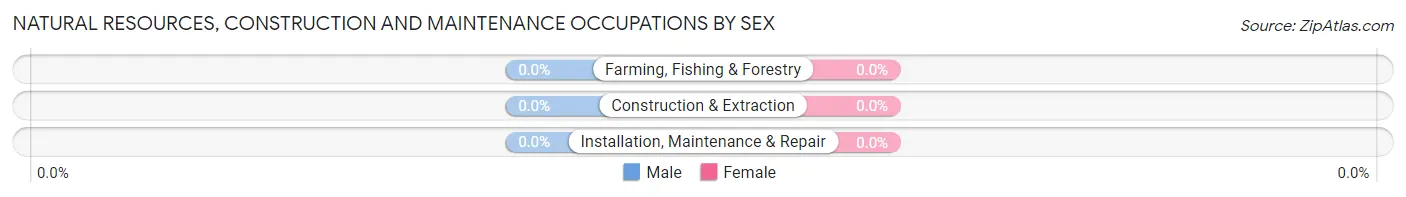
| Occupation | Male | Female |
| Farming, Fishing & Forestry | 0 (0.0%) | 0 (0.0%) |
| Construction & Extraction | 0 (0.0%) | 0 (0.0%) |
| Installation, Maintenance & Repair | 0 (0.0%) | 0 (0.0%) |
| Total (Category) | 0 (0.0%) | 0 (0.0%) |
| Total (Overall) | 154 (59.9%) | 103 (40.1%) |
Production, Transportation and Moving Occupations
Production, Transportation and Moving Occupations by Sex
| Occupation | Male | Female |
| Production | 0 (0.0%) | 0 (0.0%) |
| Transportation | 0 (0.0%) | 0 (0.0%) |
| Material Moving | 0 (0.0%) | 0 (0.0%) |
| Total (Category) | 0 (0.0%) | 0 (0.0%) |
| Total (Overall) | 154 (59.9%) | 103 (40.1%) |
Employment Industries by Sex in Tyrone
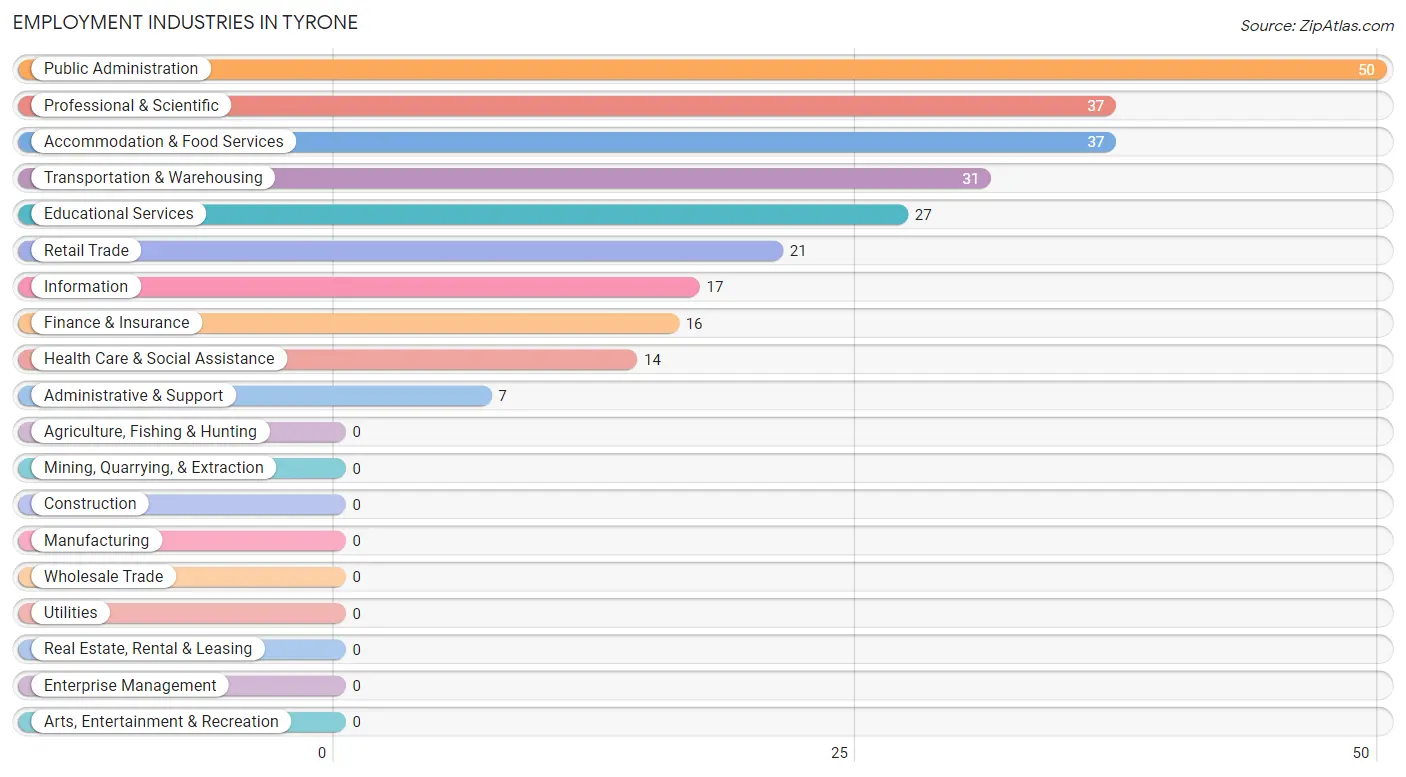
Employment Industries in Tyrone
The major employment industries in Tyrone include Public Administration (50 | 19.5%), Professional & Scientific (37 | 14.4%), Accommodation & Food Services (37 | 14.4%), Transportation & Warehousing (31 | 12.1%), and Educational Services (27 | 10.5%).
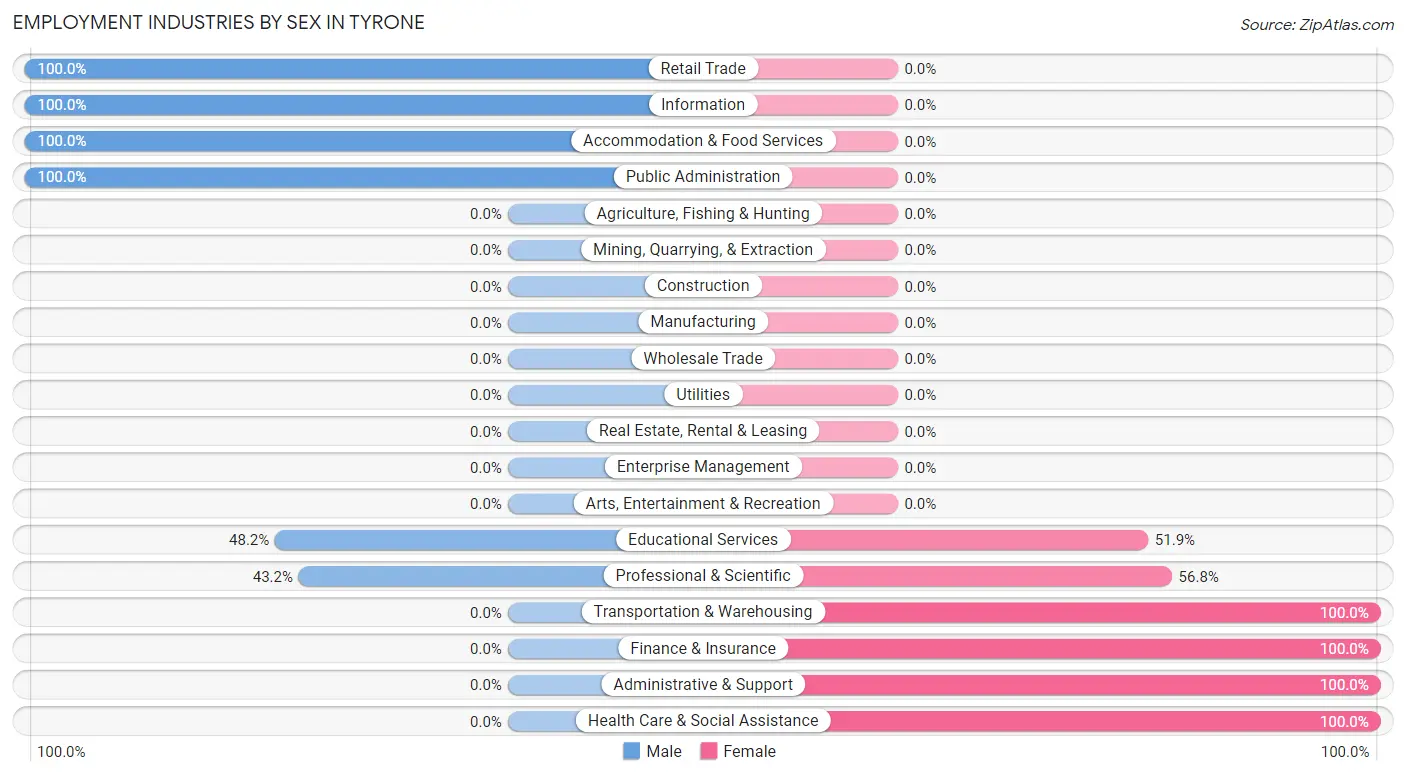
Employment Industries by Sex in Tyrone
The Tyrone industries that see more men than women are Retail Trade (100.0%), Information (100.0%), and Accommodation & Food Services (100.0%), whereas the industries that tend to have a higher number of women are Transportation & Warehousing (100.0%), Finance & Insurance (100.0%), and Administrative & Support (100.0%).
| Industry | Male | Female |
| Agriculture, Fishing & Hunting | 0 (0.0%) | 0 (0.0%) |
| Mining, Quarrying, & Extraction | 0 (0.0%) | 0 (0.0%) |
| Construction | 0 (0.0%) | 0 (0.0%) |
| Manufacturing | 0 (0.0%) | 0 (0.0%) |
| Wholesale Trade | 0 (0.0%) | 0 (0.0%) |
| Retail Trade | 21 (100.0%) | 0 (0.0%) |
| Transportation & Warehousing | 0 (0.0%) | 31 (100.0%) |
| Utilities | 0 (0.0%) | 0 (0.0%) |
| Information | 17 (100.0%) | 0 (0.0%) |
| Finance & Insurance | 0 (0.0%) | 16 (100.0%) |
| Real Estate, Rental & Leasing | 0 (0.0%) | 0 (0.0%) |
| Professional & Scientific | 16 (43.2%) | 21 (56.8%) |
| Enterprise Management | 0 (0.0%) | 0 (0.0%) |
| Administrative & Support | 0 (0.0%) | 7 (100.0%) |
| Educational Services | 13 (48.1%) | 14 (51.8%) |
| Health Care & Social Assistance | 0 (0.0%) | 14 (100.0%) |
| Arts, Entertainment & Recreation | 0 (0.0%) | 0 (0.0%) |
| Accommodation & Food Services | 37 (100.0%) | 0 (0.0%) |
| Public Administration | 50 (100.0%) | 0 (0.0%) |
| Total | 154 (59.9%) | 103 (40.1%) |
Education in Tyrone
School Enrollment in Tyrone
The most common levels of schooling among the 235 students in Tyrone are nursery / preschool (80 | 34.0%), elementary school (52 | 22.1%), and college / undergraduate (39 | 16.6%).
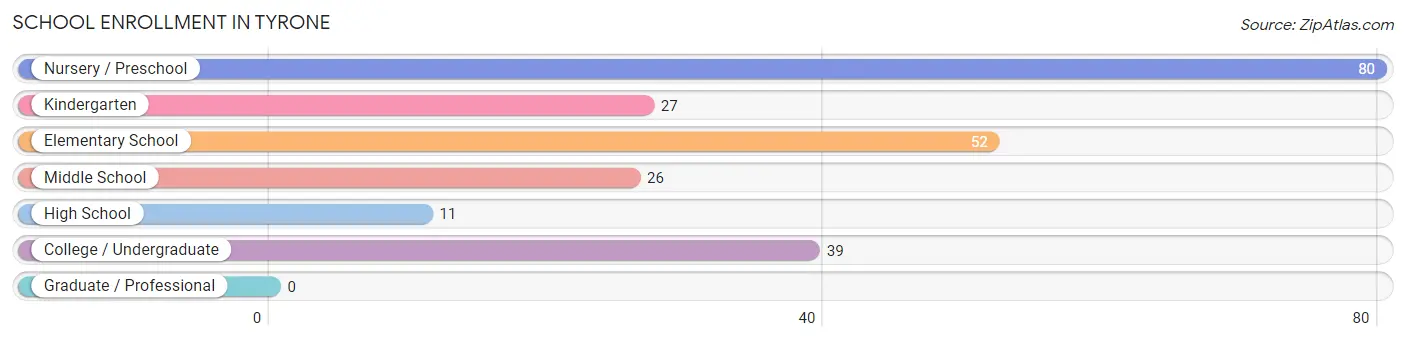
| School Level | # Students | % Students |
| Nursery / Preschool | 80 | 34.0% |
| Kindergarten | 27 | 11.5% |
| Elementary School | 52 | 22.1% |
| Middle School | 26 | 11.1% |
| High School | 11 | 4.7% |
| College / Undergraduate | 39 | 16.6% |
| Graduate / Professional | 0 | 0.0% |
| Total | 235 | 100.0% |
School Enrollment by Age by Funding Source in Tyrone
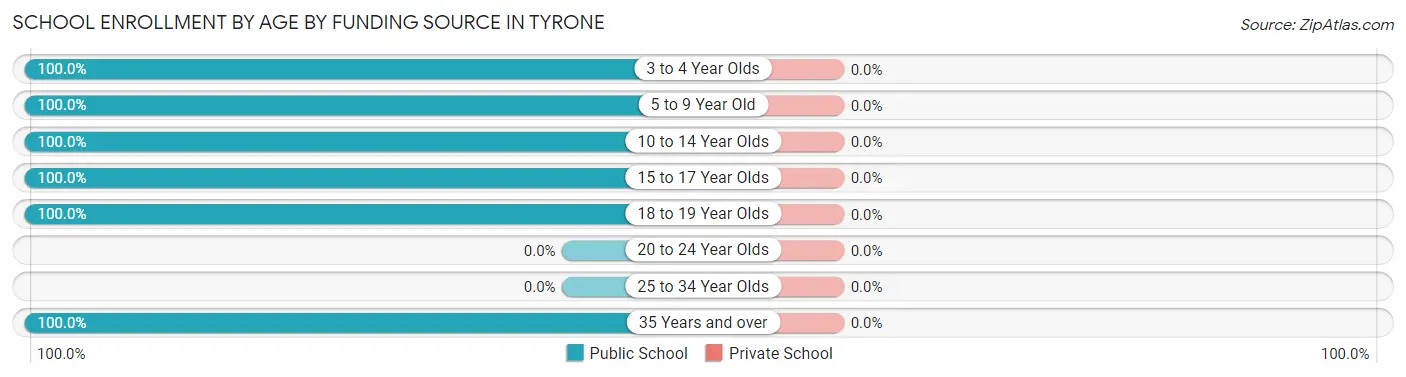
| Age Bracket | Public School | Private School |
| 3 to 4 Year Olds | 80 (100.0%) | 0 (0.0%) |
| 5 to 9 Year Old | 79 (100.0%) | 0 (0.0%) |
| 10 to 14 Year Olds | 26 (100.0%) | 0 (0.0%) |
| 15 to 17 Year Olds | 11 (100.0%) | 0 (0.0%) |
| 18 to 19 Year Olds | 26 (100.0%) | 0 (0.0%) |
| 20 to 24 Year Olds | 0 (0.0%) | 0 (0.0%) |
| 25 to 34 Year Olds | 0 (0.0%) | 0 (0.0%) |
| 35 Years and over | 13 (100.0%) | 0 (0.0%) |
| Total | 235 (100.0%) | 0 (0.0%) |
Educational Attainment by Field of Study in Tyrone
Business (30 | 30.9%), arts & humanities (20 | 20.6%), physical & health sciences (16 | 16.5%), science & technology (14 | 14.4%), and literature & languages (7 | 7.2%) are the most common fields of study among 97 individuals in Tyrone who have obtained a bachelor's degree or higher.
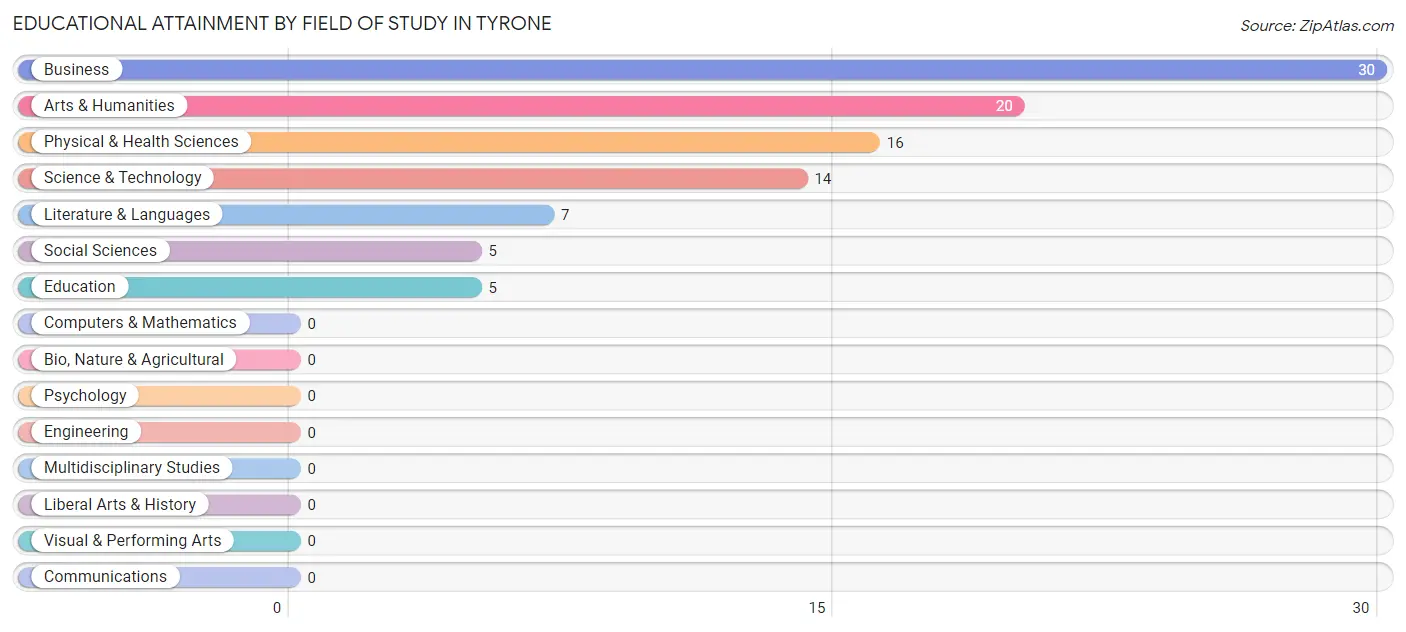
| Field of Study | # Graduates | % Graduates |
| Computers & Mathematics | 0 | 0.0% |
| Bio, Nature & Agricultural | 0 | 0.0% |
| Physical & Health Sciences | 16 | 16.5% |
| Psychology | 0 | 0.0% |
| Social Sciences | 5 | 5.1% |
| Engineering | 0 | 0.0% |
| Multidisciplinary Studies | 0 | 0.0% |
| Science & Technology | 14 | 14.4% |
| Business | 30 | 30.9% |
| Education | 5 | 5.1% |
| Literature & Languages | 7 | 7.2% |
| Liberal Arts & History | 0 | 0.0% |
| Visual & Performing Arts | 0 | 0.0% |
| Communications | 0 | 0.0% |
| Arts & Humanities | 20 | 20.6% |
| Total | 97 | 100.0% |
Transportation & Commute in Tyrone
Vehicle Availability by Sex in Tyrone
The most prevalent vehicle ownership categories in Tyrone are males with 2 vehicles (79, accounting for 51.3%) and females with 2 vehicles (14, making up 76.7%).
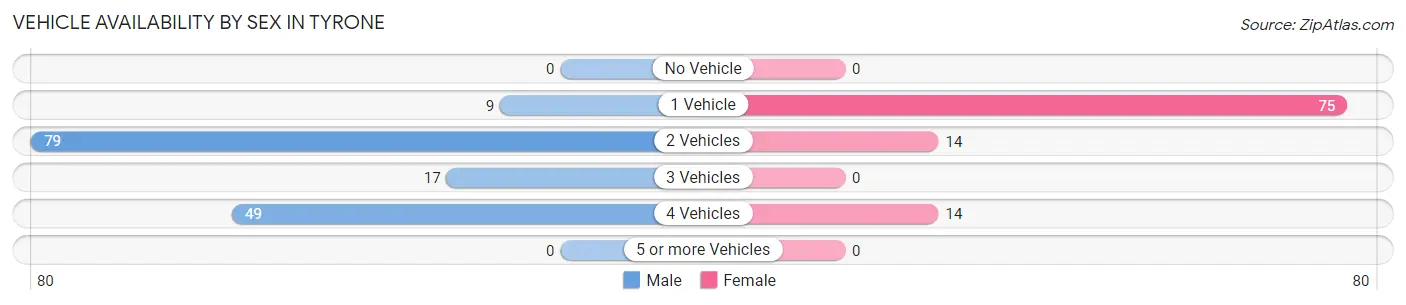
| Vehicles Available | Male | Female |
| No Vehicle | 0 (0.0%) | 0 (0.0%) |
| 1 Vehicle | 9 (5.8%) | 75 (72.8%) |
| 2 Vehicles | 79 (51.3%) | 14 (13.6%) |
| 3 Vehicles | 17 (11.0%) | 0 (0.0%) |
| 4 Vehicles | 49 (31.8%) | 14 (13.6%) |
| 5 or more Vehicles | 0 (0.0%) | 0 (0.0%) |
| Total | 154 (100.0%) | 103 (100.0%) |
Commute Time in Tyrone
The most frequently occuring commute durations in Tyrone are 60 to 89 minutes (67 commuters, 34.9%), 10 to 14 minutes (51 commuters, 26.6%), and 20 to 24 minutes (31 commuters, 16.2%).
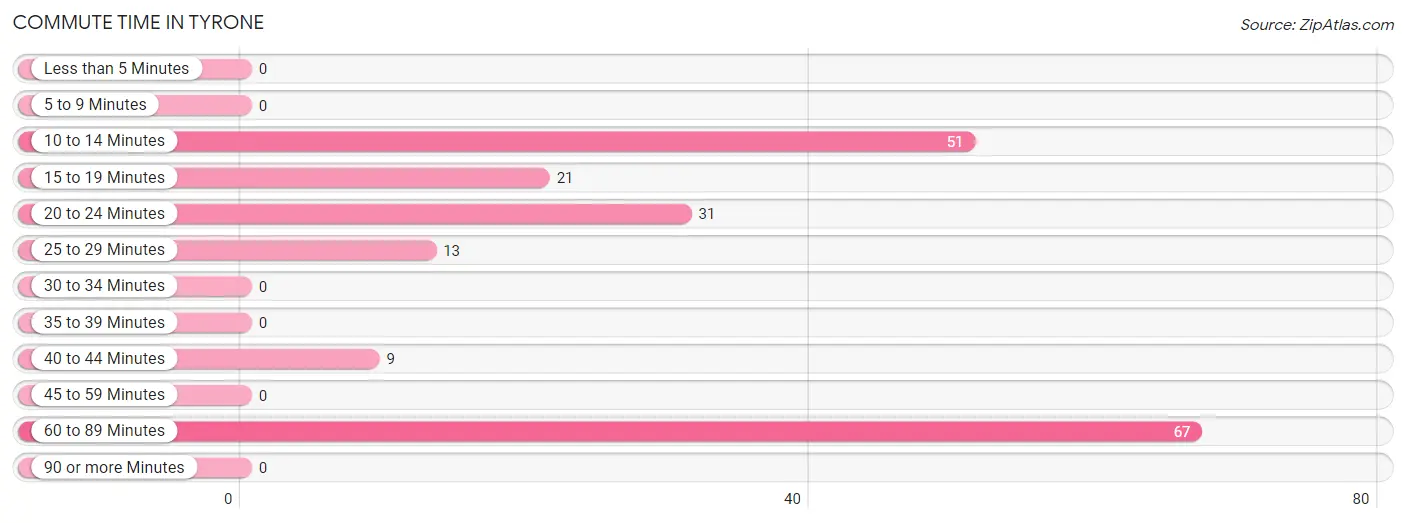
| Commute Time | # Commuters | % Commuters |
| Less than 5 Minutes | 0 | 0.0% |
| 5 to 9 Minutes | 0 | 0.0% |
| 10 to 14 Minutes | 51 | 26.6% |
| 15 to 19 Minutes | 21 | 10.9% |
| 20 to 24 Minutes | 31 | 16.2% |
| 25 to 29 Minutes | 13 | 6.8% |
| 30 to 34 Minutes | 0 | 0.0% |
| 35 to 39 Minutes | 0 | 0.0% |
| 40 to 44 Minutes | 9 | 4.7% |
| 45 to 59 Minutes | 0 | 0.0% |
| 60 to 89 Minutes | 67 | 34.9% |
| 90 or more Minutes | 0 | 0.0% |
Commute Time by Sex in Tyrone
The most common commute times in Tyrone are 60 to 89 minutes (67 commuters, 45.6%) for males and 20 to 24 minutes (31 commuters, 68.9%) for females.
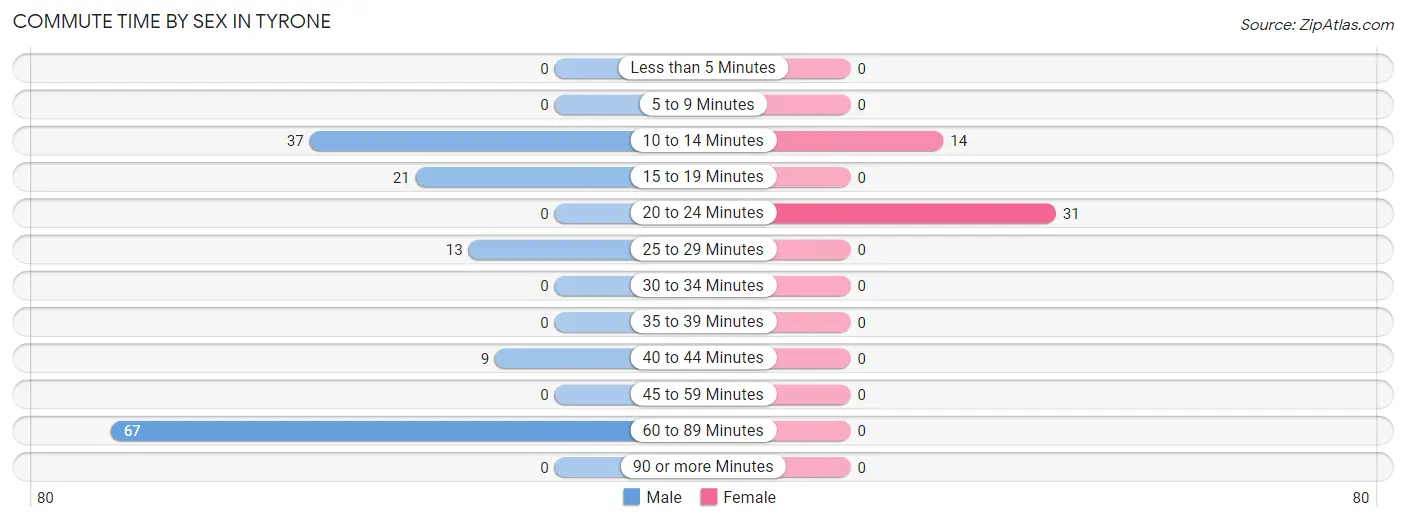
| Commute Time | Male | Female |
| Less than 5 Minutes | 0 (0.0%) | 0 (0.0%) |
| 5 to 9 Minutes | 0 (0.0%) | 0 (0.0%) |
| 10 to 14 Minutes | 37 (25.2%) | 14 (31.1%) |
| 15 to 19 Minutes | 21 (14.3%) | 0 (0.0%) |
| 20 to 24 Minutes | 0 (0.0%) | 31 (68.9%) |
| 25 to 29 Minutes | 13 (8.8%) | 0 (0.0%) |
| 30 to 34 Minutes | 0 (0.0%) | 0 (0.0%) |
| 35 to 39 Minutes | 0 (0.0%) | 0 (0.0%) |
| 40 to 44 Minutes | 9 (6.1%) | 0 (0.0%) |
| 45 to 59 Minutes | 0 (0.0%) | 0 (0.0%) |
| 60 to 89 Minutes | 67 (45.6%) | 0 (0.0%) |
| 90 or more Minutes | 0 (0.0%) | 0 (0.0%) |
Time of Departure to Work by Sex in Tyrone
The most frequent times of departure to work in Tyrone are 10:00 AM to 10:59 AM (37, 25.2%) for males and 7:30 AM to 7:59 AM (45, 100.0%) for females.
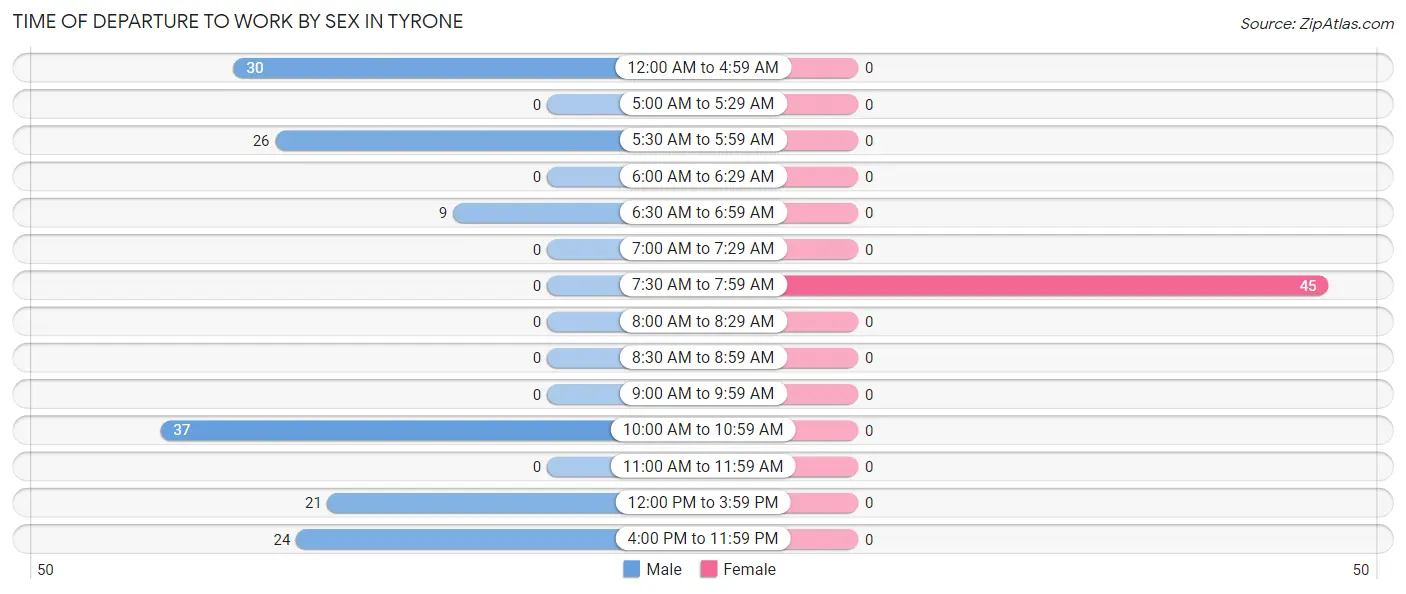
| Time of Departure | Male | Female |
| 12:00 AM to 4:59 AM | 30 (20.4%) | 0 (0.0%) |
| 5:00 AM to 5:29 AM | 0 (0.0%) | 0 (0.0%) |
| 5:30 AM to 5:59 AM | 26 (17.7%) | 0 (0.0%) |
| 6:00 AM to 6:29 AM | 0 (0.0%) | 0 (0.0%) |
| 6:30 AM to 6:59 AM | 9 (6.1%) | 0 (0.0%) |
| 7:00 AM to 7:29 AM | 0 (0.0%) | 0 (0.0%) |
| 7:30 AM to 7:59 AM | 0 (0.0%) | 45 (100.0%) |
| 8:00 AM to 8:29 AM | 0 (0.0%) | 0 (0.0%) |
| 8:30 AM to 8:59 AM | 0 (0.0%) | 0 (0.0%) |
| 9:00 AM to 9:59 AM | 0 (0.0%) | 0 (0.0%) |
| 10:00 AM to 10:59 AM | 37 (25.2%) | 0 (0.0%) |
| 11:00 AM to 11:59 AM | 0 (0.0%) | 0 (0.0%) |
| 12:00 PM to 3:59 PM | 21 (14.3%) | 0 (0.0%) |
| 4:00 PM to 11:59 PM | 24 (16.3%) | 0 (0.0%) |
| Total | 147 (100.0%) | 45 (100.0%) |
Housing Occupancy in Tyrone
Occupancy by Ownership in Tyrone
Of the total 277 dwellings in Tyrone, owner-occupied units account for 219 (79.1%), while renter-occupied units make up 58 (20.9%).
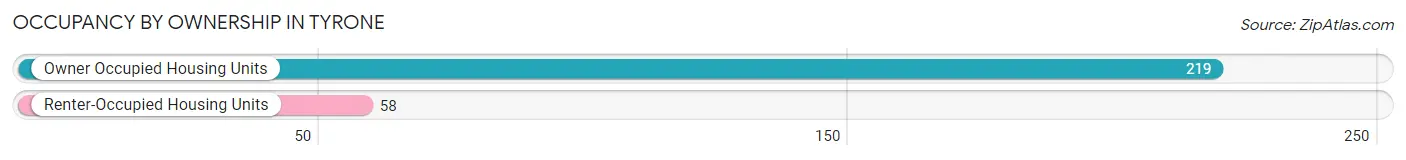
| Occupancy | # Housing Units | % Housing Units |
| Owner Occupied Housing Units | 219 | 79.1% |
| Renter-Occupied Housing Units | 58 | 20.9% |
| Total Occupied Housing Units | 277 | 100.0% |
Occupancy by Household Size in Tyrone
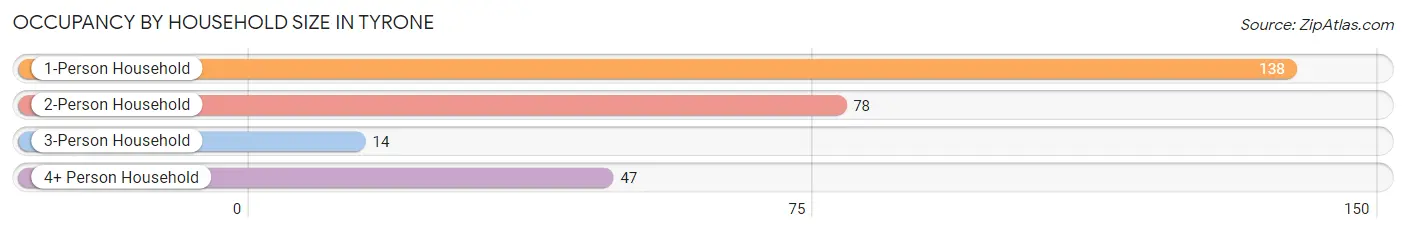
| Household Size | # Housing Units | % Housing Units |
| 1-Person Household | 138 | 49.8% |
| 2-Person Household | 78 | 28.2% |
| 3-Person Household | 14 | 5.1% |
| 4+ Person Household | 47 | 17.0% |
| Total Housing Units | 277 | 100.0% |
Occupancy by Ownership by Household Size in Tyrone
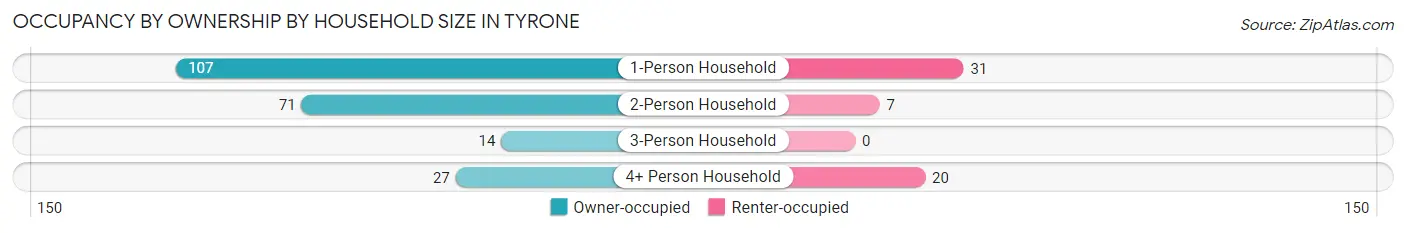
| Household Size | Owner-occupied | Renter-occupied |
| 1-Person Household | 107 (77.5%) | 31 (22.5%) |
| 2-Person Household | 71 (91.0%) | 7 (9.0%) |
| 3-Person Household | 14 (100.0%) | 0 (0.0%) |
| 4+ Person Household | 27 (57.5%) | 20 (42.5%) |
| Total Housing Units | 219 (79.1%) | 58 (20.9%) |
Occupancy by Educational Attainment in Tyrone
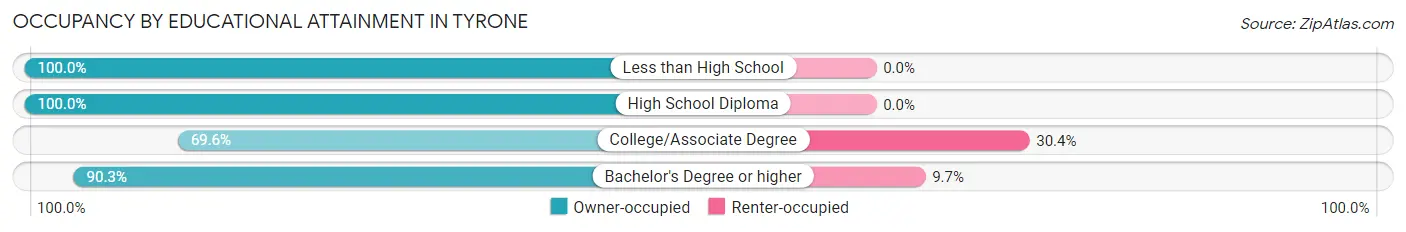
| Household Size | Owner-occupied | Renter-occupied |
| Less than High School | 21 (100.0%) | 0 (0.0%) |
| High School Diploma | 16 (100.0%) | 0 (0.0%) |
| College/Associate Degree | 117 (69.6%) | 51 (30.4%) |
| Bachelor's Degree or higher | 65 (90.3%) | 7 (9.7%) |
Occupancy by Age of Householder in Tyrone
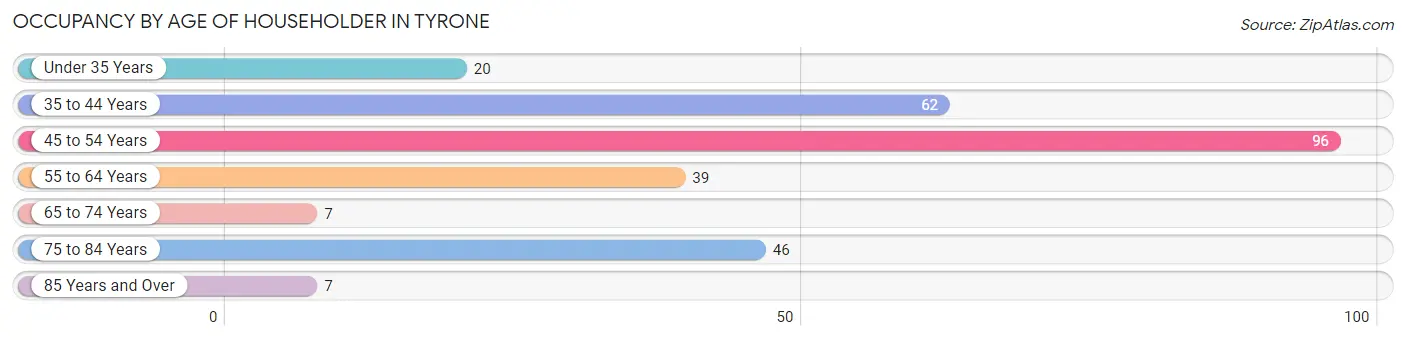
| Age Bracket | # Households | % Households |
| Under 35 Years | 20 | 7.2% |
| 35 to 44 Years | 62 | 22.4% |
| 45 to 54 Years | 96 | 34.7% |
| 55 to 64 Years | 39 | 14.1% |
| 65 to 74 Years | 7 | 2.5% |
| 75 to 84 Years | 46 | 16.6% |
| 85 Years and Over | 7 | 2.5% |
| Total | 277 | 100.0% |
Housing Finances in Tyrone
Median Income by Occupancy in Tyrone
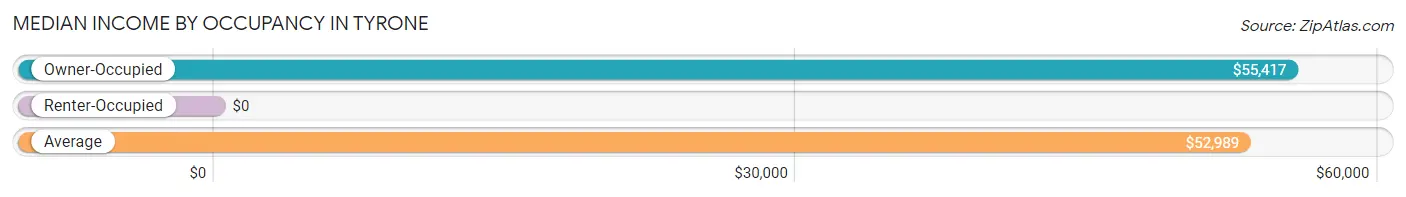
| Occupancy Type | # Households | Median Income |
| Owner-Occupied | 219 (79.1%) | $55,417 |
| Renter-Occupied | 58 (20.9%) | $0 |
| Average | 277 (100.0%) | $52,989 |
Occupancy by Householder Income Bracket in Tyrone
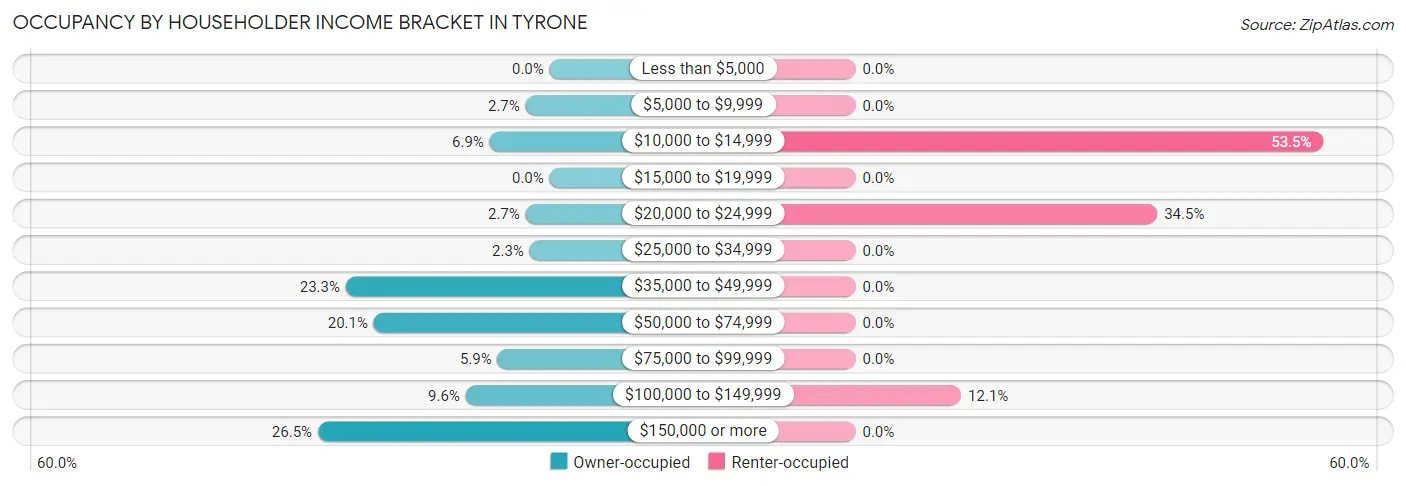
| Income Bracket | Owner-occupied | Renter-occupied |
| Less than $5,000 | 0 (0.0%) | 0 (0.0%) |
| $5,000 to $9,999 | 6 (2.7%) | 0 (0.0%) |
| $10,000 to $14,999 | 15 (6.9%) | 31 (53.4%) |
| $15,000 to $19,999 | 0 (0.0%) | 0 (0.0%) |
| $20,000 to $24,999 | 6 (2.7%) | 20 (34.5%) |
| $25,000 to $34,999 | 5 (2.3%) | 0 (0.0%) |
| $35,000 to $49,999 | 51 (23.3%) | 0 (0.0%) |
| $50,000 to $74,999 | 44 (20.1%) | 0 (0.0%) |
| $75,000 to $99,999 | 13 (5.9%) | 0 (0.0%) |
| $100,000 to $149,999 | 21 (9.6%) | 7 (12.1%) |
| $150,000 or more | 58 (26.5%) | 0 (0.0%) |
| Total | 219 (100.0%) | 58 (100.0%) |
Monthly Housing Cost Tiers in Tyrone
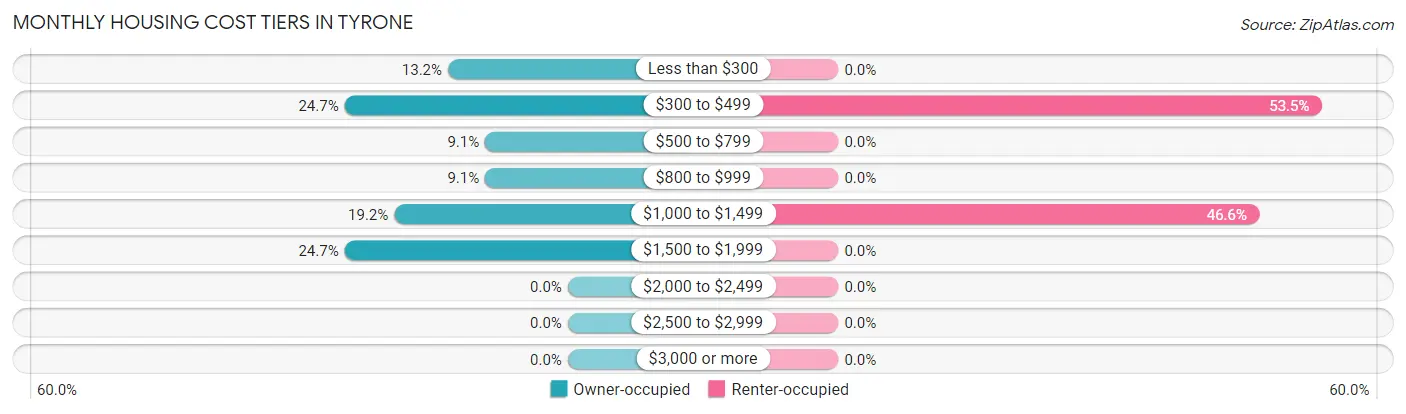
| Monthly Cost | Owner-occupied | Renter-occupied |
| Less than $300 | 29 (13.2%) | 0 (0.0%) |
| $300 to $499 | 54 (24.7%) | 31 (53.4%) |
| $500 to $799 | 20 (9.1%) | 0 (0.0%) |
| $800 to $999 | 20 (9.1%) | 0 (0.0%) |
| $1,000 to $1,499 | 42 (19.2%) | 27 (46.6%) |
| $1,500 to $1,999 | 54 (24.7%) | 0 (0.0%) |
| $2,000 to $2,499 | 0 (0.0%) | 0 (0.0%) |
| $2,500 to $2,999 | 0 (0.0%) | 0 (0.0%) |
| $3,000 or more | 0 (0.0%) | 0 (0.0%) |
| Total | 219 (100.0%) | 58 (100.0%) |
Physical Housing Characteristics in Tyrone
Housing Structures in Tyrone
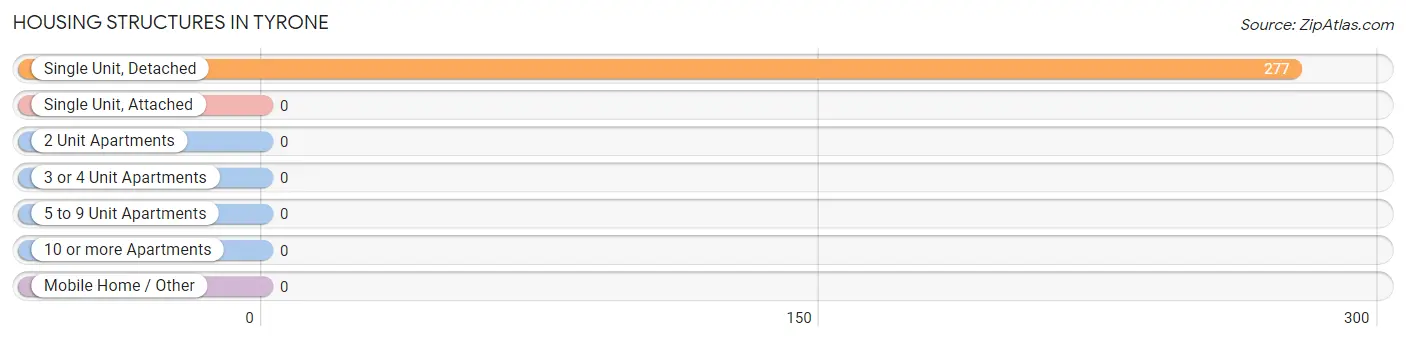
| Structure Type | # Housing Units | % Housing Units |
| Single Unit, Detached | 277 | 100.0% |
| Single Unit, Attached | 0 | 0.0% |
| 2 Unit Apartments | 0 | 0.0% |
| 3 or 4 Unit Apartments | 0 | 0.0% |
| 5 to 9 Unit Apartments | 0 | 0.0% |
| 10 or more Apartments | 0 | 0.0% |
| Mobile Home / Other | 0 | 0.0% |
| Total | 277 | 100.0% |
Housing Structures by Occupancy in Tyrone
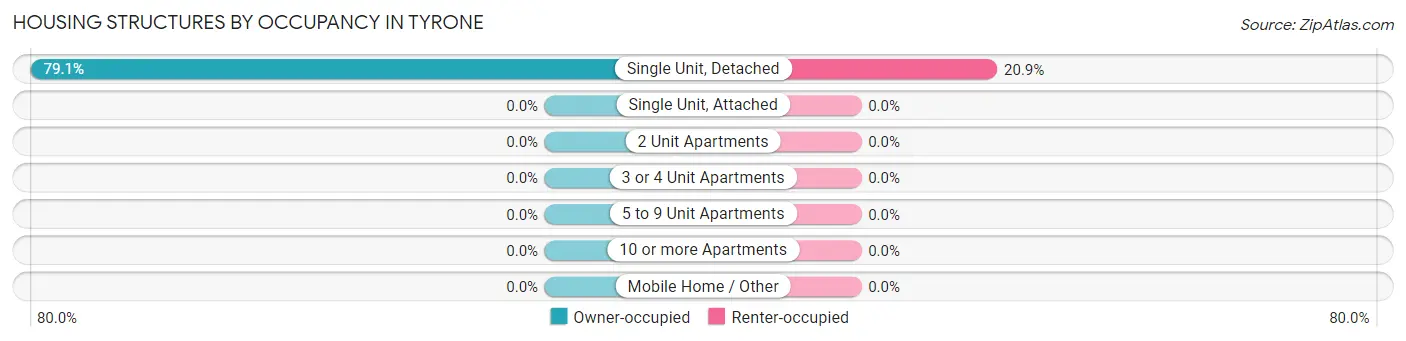
| Structure Type | Owner-occupied | Renter-occupied |
| Single Unit, Detached | 219 (79.1%) | 58 (20.9%) |
| Single Unit, Attached | 0 (0.0%) | 0 (0.0%) |
| 2 Unit Apartments | 0 (0.0%) | 0 (0.0%) |
| 3 or 4 Unit Apartments | 0 (0.0%) | 0 (0.0%) |
| 5 to 9 Unit Apartments | 0 (0.0%) | 0 (0.0%) |
| 10 or more Apartments | 0 (0.0%) | 0 (0.0%) |
| Mobile Home / Other | 0 (0.0%) | 0 (0.0%) |
| Total | 219 (79.1%) | 58 (20.9%) |
Housing Structures by Number of Rooms in Tyrone
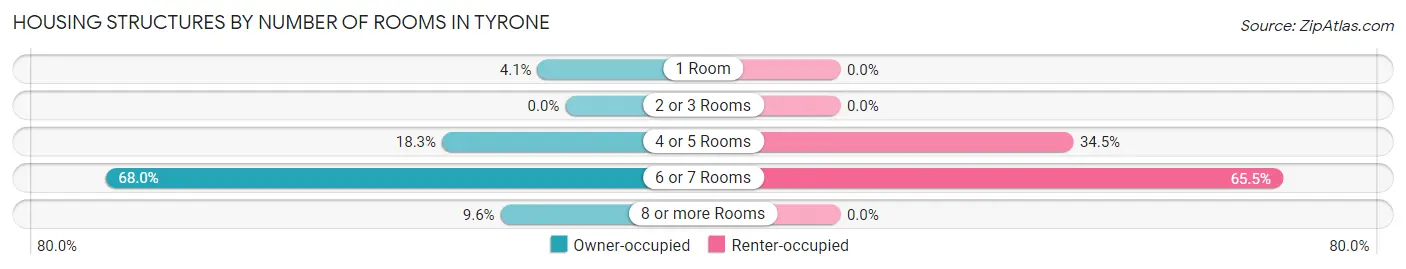
| Number of Rooms | Owner-occupied | Renter-occupied |
| 1 Room | 9 (4.1%) | 0 (0.0%) |
| 2 or 3 Rooms | 0 (0.0%) | 0 (0.0%) |
| 4 or 5 Rooms | 40 (18.3%) | 20 (34.5%) |
| 6 or 7 Rooms | 149 (68.0%) | 38 (65.5%) |
| 8 or more Rooms | 21 (9.6%) | 0 (0.0%) |
| Total | 219 (100.0%) | 58 (100.0%) |
Housing Structure by Heating Type in Tyrone
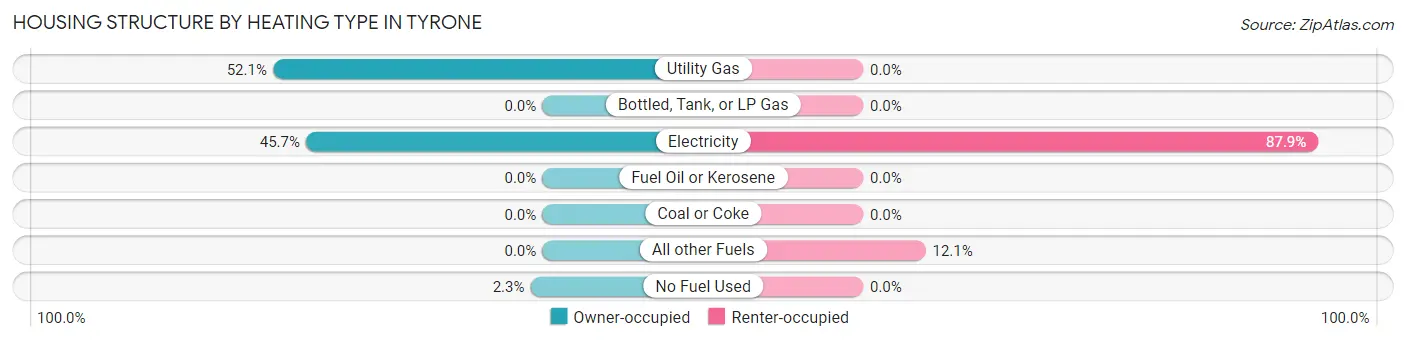
| Heating Type | Owner-occupied | Renter-occupied |
| Utility Gas | 114 (52.0%) | 0 (0.0%) |
| Bottled, Tank, or LP Gas | 0 (0.0%) | 0 (0.0%) |
| Electricity | 100 (45.7%) | 51 (87.9%) |
| Fuel Oil or Kerosene | 0 (0.0%) | 0 (0.0%) |
| Coal or Coke | 0 (0.0%) | 0 (0.0%) |
| All other Fuels | 0 (0.0%) | 7 (12.1%) |
| No Fuel Used | 5 (2.3%) | 0 (0.0%) |
| Total | 219 (100.0%) | 58 (100.0%) |
Household Vehicle Usage in Tyrone
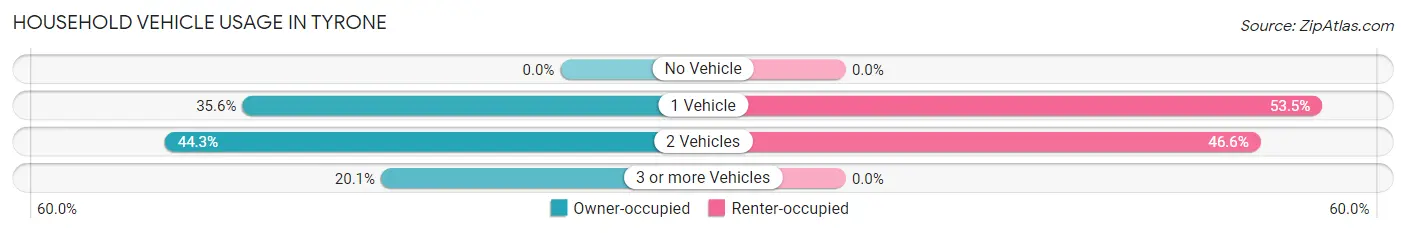
| Vehicles per Household | Owner-occupied | Renter-occupied |
| No Vehicle | 0 (0.0%) | 0 (0.0%) |
| 1 Vehicle | 78 (35.6%) | 31 (53.4%) |
| 2 Vehicles | 97 (44.3%) | 27 (46.6%) |
| 3 or more Vehicles | 44 (20.1%) | 0 (0.0%) |
| Total | 219 (100.0%) | 58 (100.0%) |
Real Estate & Mortgages in Tyrone
Real Estate and Mortgage Overview in Tyrone
| Characteristic | Without Mortgage | With Mortgage |
| Housing Units | 96 | 123 |
| Median Property Value | $171,300 | $164,400 |
| Median Household Income | - | - |
| Monthly Housing Costs | $320 | $0 |
| Real Estate Taxes | $871 | $5 |
Property Value by Mortgage Status in Tyrone
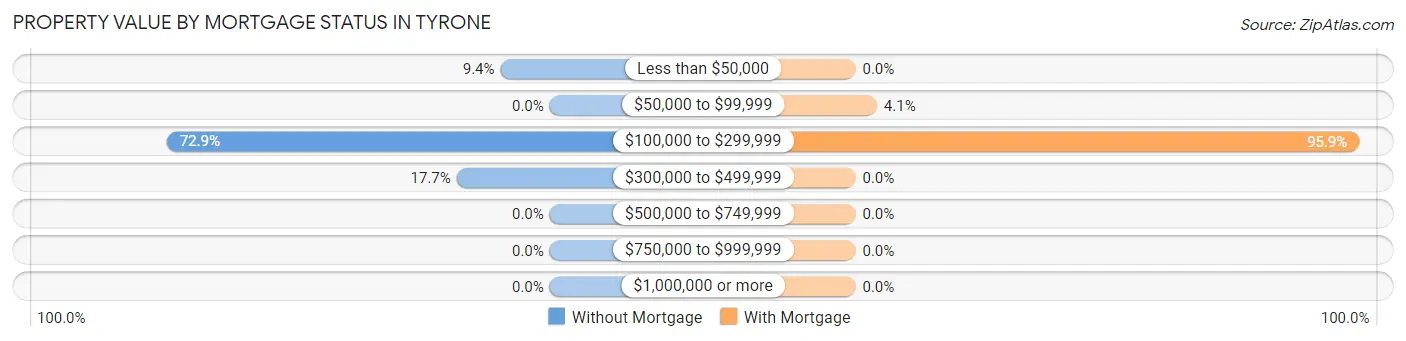
| Property Value | Without Mortgage | With Mortgage |
| Less than $50,000 | 9 (9.4%) | 0 (0.0%) |
| $50,000 to $99,999 | 0 (0.0%) | 5 (4.1%) |
| $100,000 to $299,999 | 70 (72.9%) | 118 (95.9%) |
| $300,000 to $499,999 | 17 (17.7%) | 0 (0.0%) |
| $500,000 to $749,999 | 0 (0.0%) | 0 (0.0%) |
| $750,000 to $999,999 | 0 (0.0%) | 0 (0.0%) |
| $1,000,000 or more | 0 (0.0%) | 0 (0.0%) |
| Total | 96 (100.0%) | 123 (100.0%) |
Household Income by Mortgage Status in Tyrone
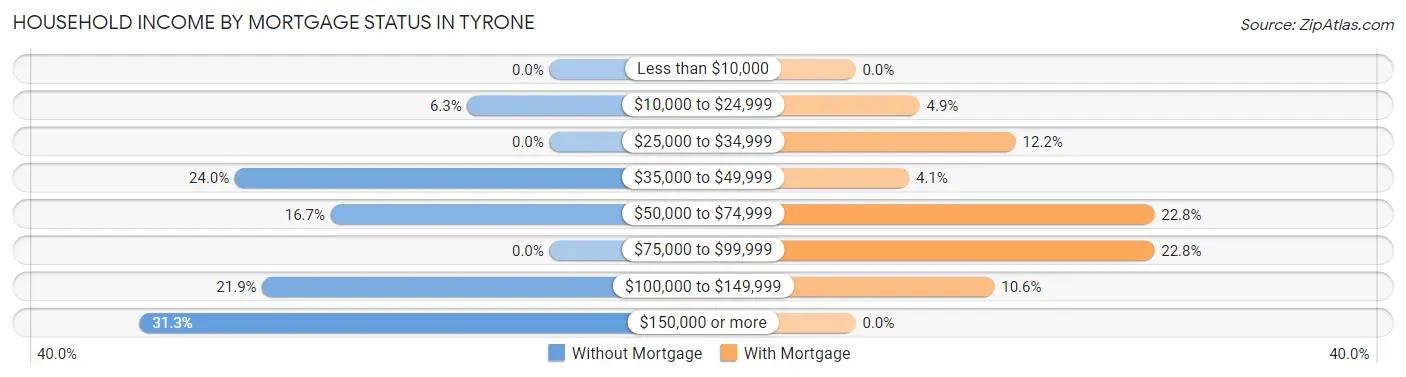
| Household Income | Without Mortgage | With Mortgage |
| Less than $10,000 | 0 (0.0%) | 0 (0.0%) |
| $10,000 to $24,999 | 6 (6.2%) | 6 (4.9%) |
| $25,000 to $34,999 | 0 (0.0%) | 15 (12.2%) |
| $35,000 to $49,999 | 23 (24.0%) | 5 (4.1%) |
| $50,000 to $74,999 | 16 (16.7%) | 28 (22.8%) |
| $75,000 to $99,999 | 0 (0.0%) | 28 (22.8%) |
| $100,000 to $149,999 | 21 (21.9%) | 13 (10.6%) |
| $150,000 or more | 30 (31.2%) | 0 (0.0%) |
| Total | 96 (100.0%) | 123 (100.0%) |
Property Value to Household Income Ratio in Tyrone
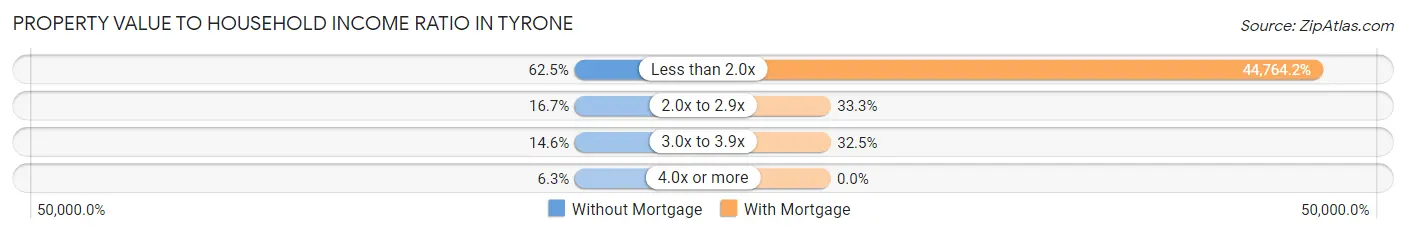
| Value-to-Income Ratio | Without Mortgage | With Mortgage |
| Less than 2.0x | 60 (62.5%) | 55,060 (44,764.2%) |
| 2.0x to 2.9x | 16 (16.7%) | 41 (33.3%) |
| 3.0x to 3.9x | 14 (14.6%) | 40 (32.5%) |
| 4.0x or more | 6 (6.2%) | 0 (0.0%) |
| Total | 96 (100.0%) | 123 (100.0%) |
Real Estate Taxes by Mortgage Status in Tyrone
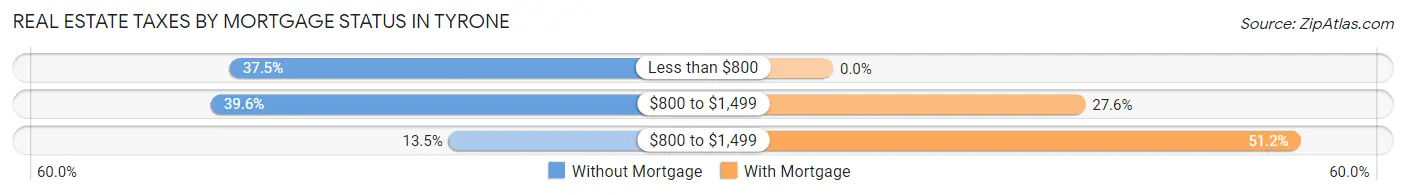
| Property Taxes | Without Mortgage | With Mortgage |
| Less than $800 | 36 (37.5%) | 0 (0.0%) |
| $800 to $1,499 | 38 (39.6%) | 34 (27.6%) |
| $800 to $1,499 | 13 (13.5%) | 63 (51.2%) |
| Total | 96 (100.0%) | 123 (100.0%) |
Health & Disability in Tyrone
Health Insurance Coverage by Age in Tyrone
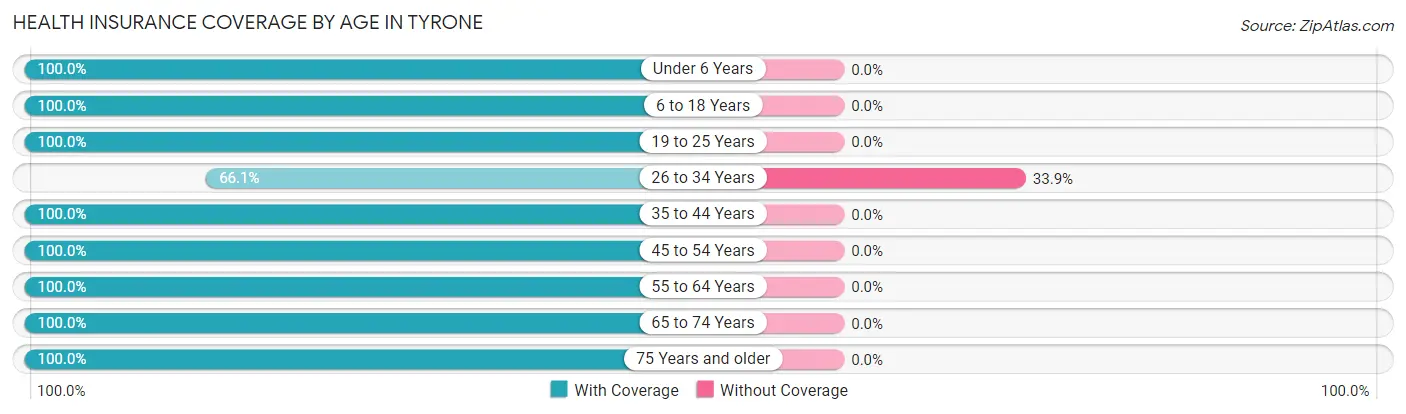
| Age Bracket | With Coverage | Without Coverage |
| Under 6 Years | 172 (100.0%) | 0 (0.0%) |
| 6 to 18 Years | 115 (100.0%) | 0 (0.0%) |
| 19 to 25 Years | 21 (100.0%) | 0 (0.0%) |
| 26 to 34 Years | 41 (66.1%) | 21 (33.9%) |
| 35 to 44 Years | 92 (100.0%) | 0 (0.0%) |
| 45 to 54 Years | 116 (100.0%) | 0 (0.0%) |
| 55 to 64 Years | 39 (100.0%) | 0 (0.0%) |
| 65 to 74 Years | 29 (100.0%) | 0 (0.0%) |
| 75 Years and older | 70 (100.0%) | 0 (0.0%) |
| Total | 695 (97.1%) | 21 (2.9%) |
Health Insurance Coverage by Citizenship Status in Tyrone
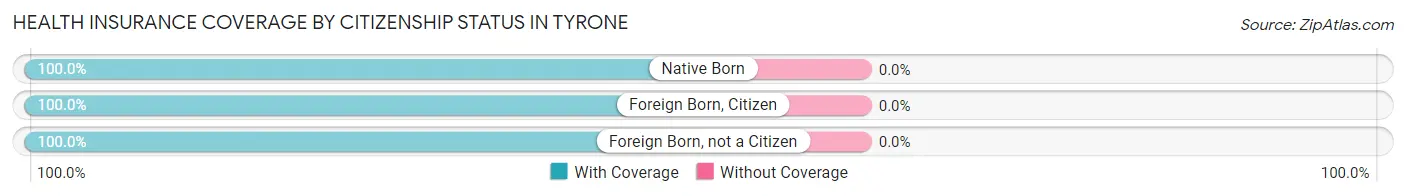
| Citizenship Status | With Coverage | Without Coverage |
| Native Born | 172 (100.0%) | 0 (0.0%) |
| Foreign Born, Citizen | 115 (100.0%) | 0 (0.0%) |
| Foreign Born, not a Citizen | 21 (100.0%) | 0 (0.0%) |
Health Insurance Coverage by Household Income in Tyrone
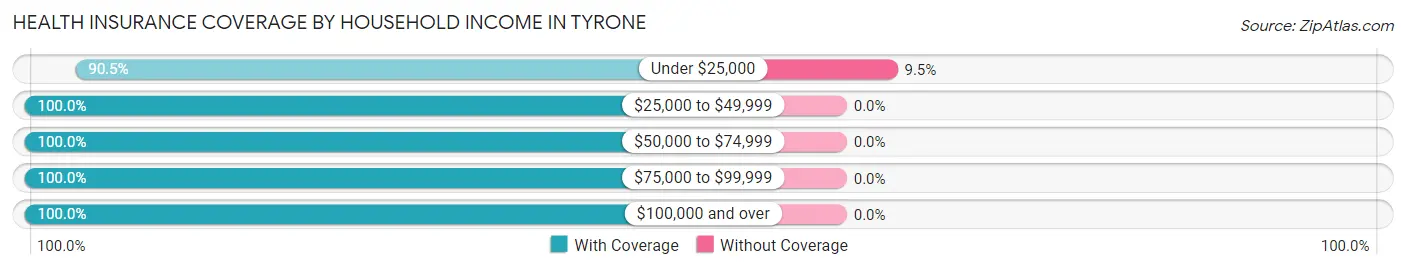
| Household Income | With Coverage | Without Coverage |
| Under $25,000 | 200 (90.5%) | 21 (9.5%) |
| $25,000 to $49,999 | 67 (100.0%) | 0 (0.0%) |
| $50,000 to $74,999 | 44 (100.0%) | 0 (0.0%) |
| $75,000 to $99,999 | 135 (100.0%) | 0 (0.0%) |
| $100,000 and over | 249 (100.0%) | 0 (0.0%) |
Public vs Private Health Insurance Coverage by Age in Tyrone
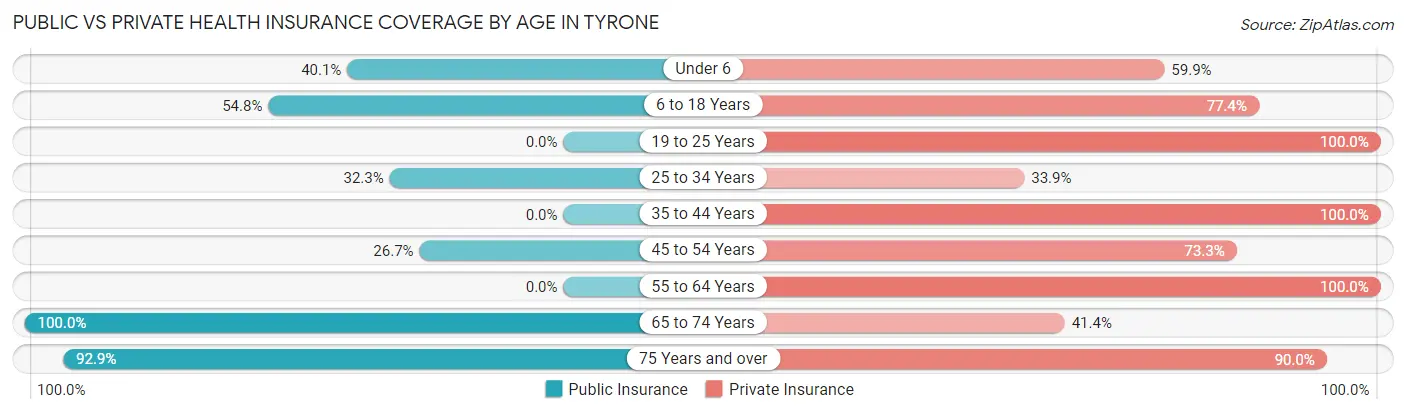
| Age Bracket | Public Insurance | Private Insurance |
| Under 6 | 69 (40.1%) | 103 (59.9%) |
| 6 to 18 Years | 63 (54.8%) | 89 (77.4%) |
| 19 to 25 Years | 0 (0.0%) | 21 (100.0%) |
| 25 to 34 Years | 20 (32.3%) | 21 (33.9%) |
| 35 to 44 Years | 0 (0.0%) | 92 (100.0%) |
| 45 to 54 Years | 31 (26.7%) | 85 (73.3%) |
| 55 to 64 Years | 0 (0.0%) | 39 (100.0%) |
| 65 to 74 Years | 29 (100.0%) | 12 (41.4%) |
| 75 Years and over | 65 (92.9%) | 63 (90.0%) |
| Total | 277 (38.7%) | 525 (73.3%) |
Disability Status by Sex by Age in Tyrone
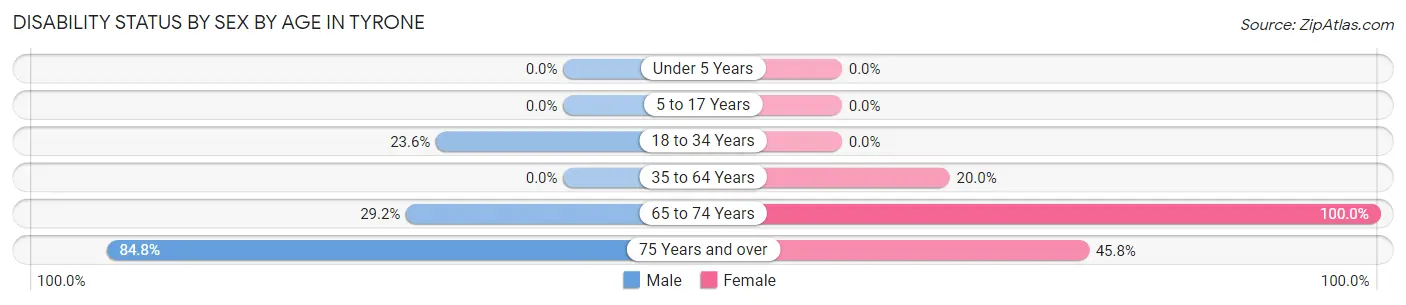
| Age Bracket | Male | Female |
| Under 5 Years | 0 (0.0%) | 0 (0.0%) |
| 5 to 17 Years | 0 (0.0%) | 0 (0.0%) |
| 18 to 34 Years | 21 (23.6%) | 0 (0.0%) |
| 35 to 64 Years | 0 (0.0%) | 35 (20.0%) |
| 65 to 74 Years | 7 (29.2%) | 5 (100.0%) |
| 75 Years and over | 39 (84.8%) | 11 (45.8%) |
Disability Class by Sex by Age in Tyrone
Disability Class: Hearing Difficulty
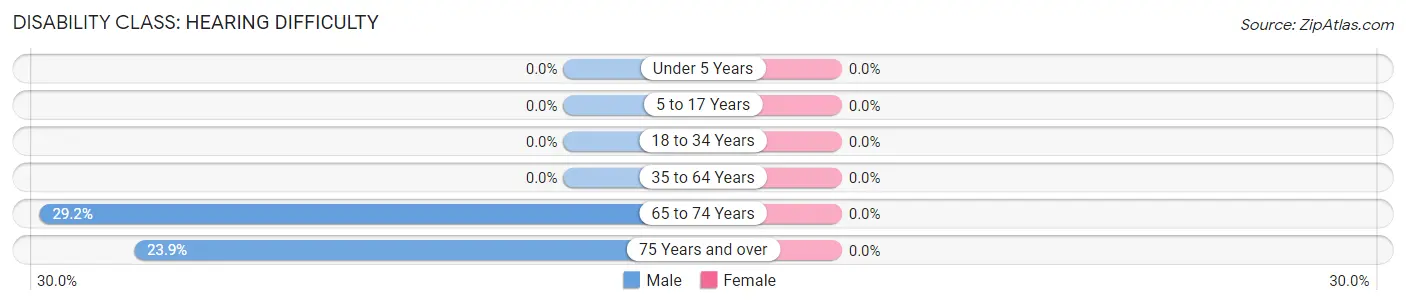
| Age Bracket | Male | Female |
| Under 5 Years | 0 (0.0%) | 0 (0.0%) |
| 5 to 17 Years | 0 (0.0%) | 0 (0.0%) |
| 18 to 34 Years | 0 (0.0%) | 0 (0.0%) |
| 35 to 64 Years | 0 (0.0%) | 0 (0.0%) |
| 65 to 74 Years | 7 (29.2%) | 0 (0.0%) |
| 75 Years and over | 11 (23.9%) | 0 (0.0%) |
Disability Class: Vision Difficulty
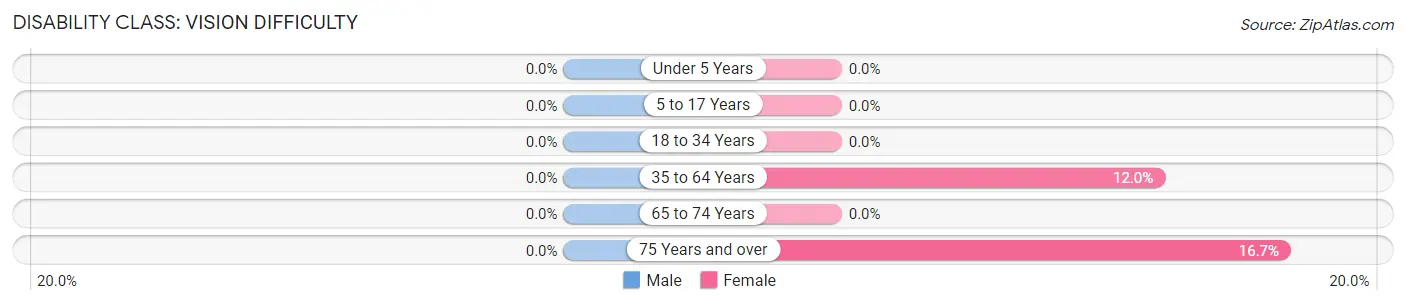
| Age Bracket | Male | Female |
| Under 5 Years | 0 (0.0%) | 0 (0.0%) |
| 5 to 17 Years | 0 (0.0%) | 0 (0.0%) |
| 18 to 34 Years | 0 (0.0%) | 0 (0.0%) |
| 35 to 64 Years | 0 (0.0%) | 21 (12.0%) |
| 65 to 74 Years | 0 (0.0%) | 0 (0.0%) |
| 75 Years and over | 0 (0.0%) | 4 (16.7%) |
Disability Class: Cognitive Difficulty
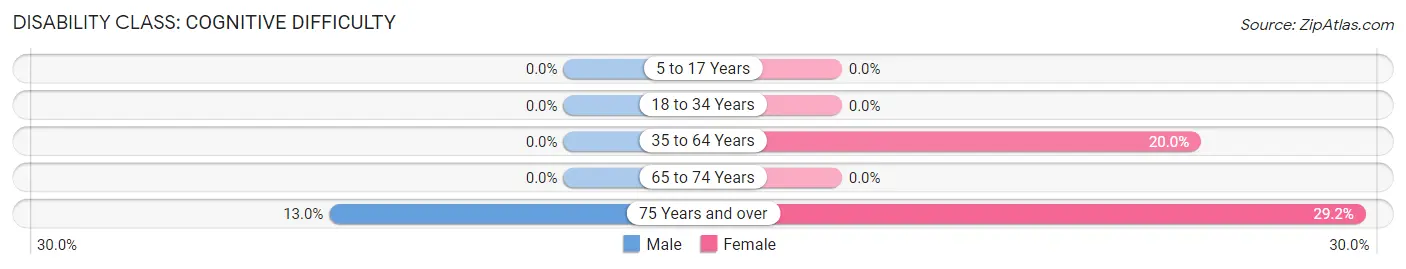
| Age Bracket | Male | Female |
| 5 to 17 Years | 0 (0.0%) | 0 (0.0%) |
| 18 to 34 Years | 0 (0.0%) | 0 (0.0%) |
| 35 to 64 Years | 0 (0.0%) | 35 (20.0%) |
| 65 to 74 Years | 0 (0.0%) | 0 (0.0%) |
| 75 Years and over | 6 (13.0%) | 7 (29.2%) |
Disability Class: Ambulatory Difficulty
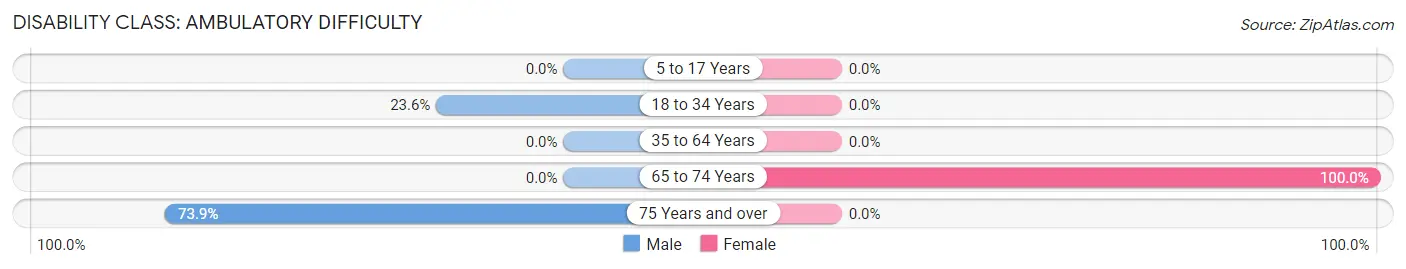
| Age Bracket | Male | Female |
| 5 to 17 Years | 0 (0.0%) | 0 (0.0%) |
| 18 to 34 Years | 21 (23.6%) | 0 (0.0%) |
| 35 to 64 Years | 0 (0.0%) | 0 (0.0%) |
| 65 to 74 Years | 0 (0.0%) | 5 (100.0%) |
| 75 Years and over | 34 (73.9%) | 0 (0.0%) |
Disability Class: Self-Care Difficulty
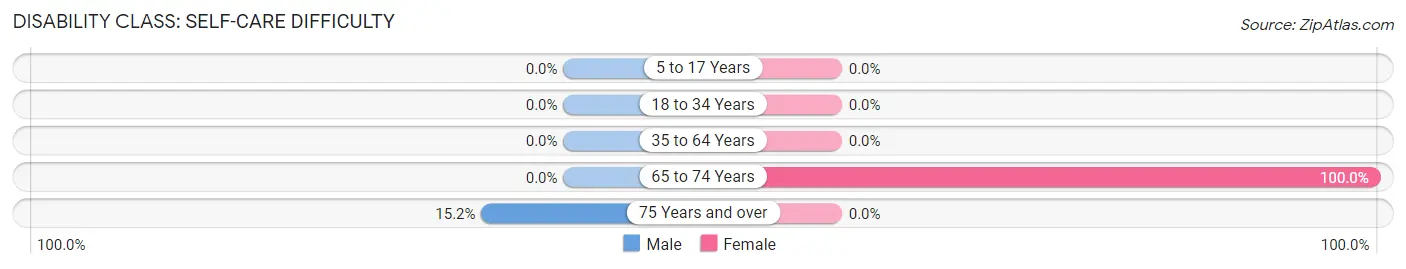
| Age Bracket | Male | Female |
| 5 to 17 Years | 0 (0.0%) | 0 (0.0%) |
| 18 to 34 Years | 0 (0.0%) | 0 (0.0%) |
| 35 to 64 Years | 0 (0.0%) | 0 (0.0%) |
| 65 to 74 Years | 0 (0.0%) | 5 (100.0%) |
| 75 Years and over | 7 (15.2%) | 0 (0.0%) |
Technology Access in Tyrone
Computing Device Access in Tyrone
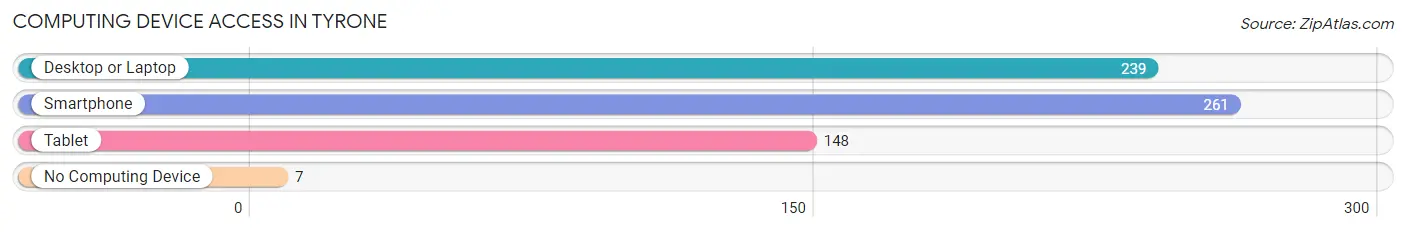
| Device Type | # Households | % Households |
| Desktop or Laptop | 239 | 86.3% |
| Smartphone | 261 | 94.2% |
| Tablet | 148 | 53.4% |
| No Computing Device | 7 | 2.5% |
| Total | 277 | 100.0% |
Internet Access in Tyrone
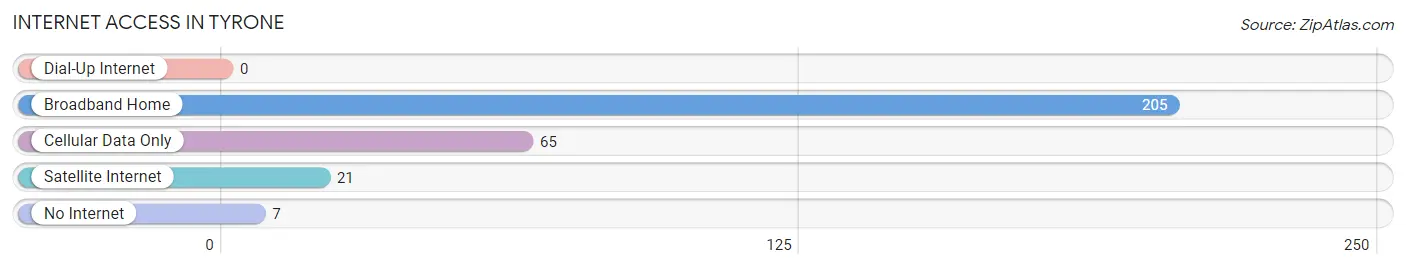
| Internet Type | # Households | % Households |
| Dial-Up Internet | 0 | 0.0% |
| Broadband Home | 205 | 74.0% |
| Cellular Data Only | 65 | 23.5% |
| Satellite Internet | 21 | 7.6% |
| No Internet | 7 | 2.5% |
| Total | 277 | 100.0% |
Tyrone Summary
Tyrone is a small unincorporated community located in the southeastern corner of New Mexico, in the United States. It is situated in the foothills of the Sacramento Mountains, approximately 20 miles south of the city of Carlsbad. The town is located in Eddy County, and is part of the Carlsbad-Artesia Micropolitan Statistical Area.
History
Tyrone was founded in the late 19th century by a group of ranchers and farmers who were looking for a place to settle and raise their families. The town was named after the nearby Tyrone Mine, which was discovered in 1883. The mine was named after the nearby Tyrone Mountain, which was named after the Irish county of Tyrone.
The town of Tyrone was officially established in 1891, and the first post office was opened in 1892. The town quickly grew, and by the early 1900s, it had become a bustling community with a population of over 500 people.
The town was home to a variety of businesses, including a hotel, a general store, a blacksmith shop, a saloon, and a school. The town also had a newspaper, the Tyrone Times, which was published from 1902 to 1910.
In the early 20th century, the town began to decline as the mining industry in the area began to decline. By the 1950s, the population had dropped to just over 200 people.
Geography
Tyrone is located in the southeastern corner of New Mexico, in the foothills of the Sacramento Mountains. The town is situated at an elevation of 4,400 feet above sea level.
The town is located in Eddy County, and is part of the Carlsbad-Artesia Micropolitan Statistical Area. The nearest cities are Carlsbad, which is located 20 miles to the north, and Artesia, which is located 25 miles to the east.
The climate in Tyrone is semi-arid, with hot summers and mild winters. The average annual temperature is 64°F, and the average annual precipitation is 12.5 inches.
Economy
Tyrone is a small, rural community with a population of just over 200 people. The town is home to a variety of businesses, including a gas station, a convenience store, a restaurant, and a few small shops.
The town is also home to a number of small farms and ranches, which produce a variety of crops and livestock. The town is also home to a number of oil and gas wells, which provide jobs for many of the town's residents.
Demographics
As of the 2010 census, the population of Tyrone was 203 people. The racial makeup of the town was 94.6% White, 0.5% African American, 0.5% Native American, 0.5% Asian, and 3.9% from other races.
The median household income in Tyrone was $31,250, and the median family income was $37,500. The per capita income was $14,846. About 16.7% of the population was below the poverty line.
Conclusion
Tyrone is a small, rural community located in the southeastern corner of New Mexico. The town was founded in the late 19th century by a group of ranchers and farmers, and it quickly grew into a bustling community. The town is home to a variety of businesses, including a gas station, a convenience store, a restaurant, and a few small shops. The town is also home to a number of small farms and ranches, which produce a variety of crops and livestock. The population of Tyrone is 203 people, and the median household income is $31,250.
Common Questions
What is Per Capita Income in Tyrone?
Per Capita income in Tyrone is $43,864.
What is the Median Family Income in Tyrone?
Median Family Income in Tyrone is $107,917.
What is the Median Household income in Tyrone?
Median Household Income in Tyrone is $52,989.
What is Inequality or Gini Index in Tyrone?
Inequality or Gini Index in Tyrone is 0.61.
What is the Total Population of Tyrone?
Total Population of Tyrone is 716.
What is the Total Male Population of Tyrone?
Total Male Population of Tyrone is 381.
What is the Total Female Population of Tyrone?
Total Female Population of Tyrone is 335.
What is the Ratio of Males per 100 Females in Tyrone?
There are 113.73 Males per 100 Females in Tyrone.
What is the Ratio of Females per 100 Males in Tyrone?
There are 87.93 Females per 100 Males in Tyrone.
What is the Median Population Age in Tyrone?
Median Population Age in Tyrone is 34.4 Years.
What is the Average Family Size in Tyrone
Average Family Size in Tyrone is 4.2 People.
What is the Average Household Size in Tyrone
Average Household Size in Tyrone is 2.6 People.
How Large is the Labor Force in Tyrone?
There are 278 People in the Labor Forcein in Tyrone.
What is the Percentage of People in the Labor Force in Tyrone?
59.7% of People are in the Labor Force in Tyrone.
What is the Unemployment Rate in Tyrone?
Unemployment Rate in Tyrone is 7.6%.