Truth Or Consequences, NM Map & Demographics
Truth Or Consequences Map
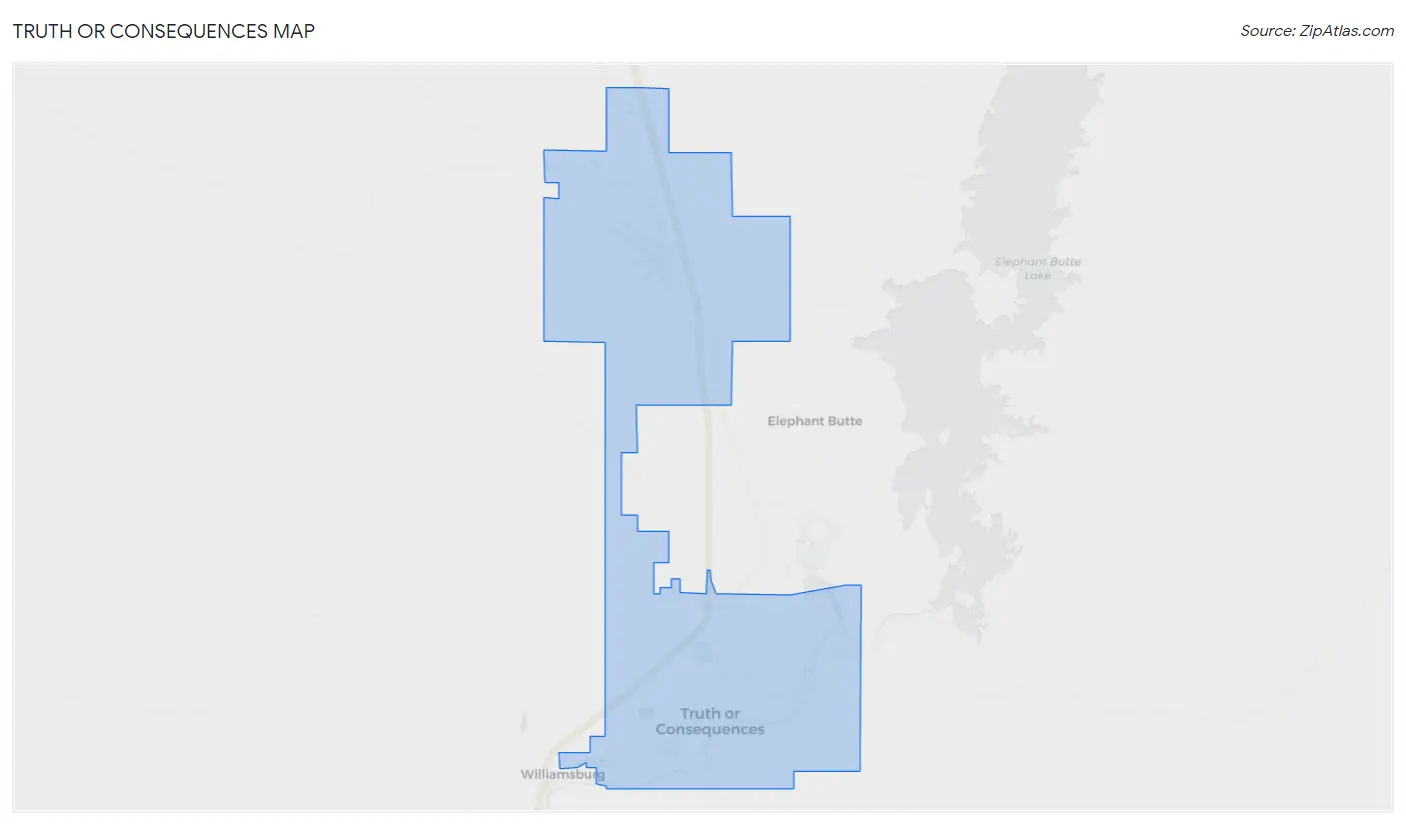
Truth Or Consequences Overview
$21,986
PER CAPITA INCOME
$59,750
AVG FAMILY INCOME
$28,685
AVG HOUSEHOLD INCOME
12.7%
WAGE / INCOME GAP [ % ]
87.3¢/ $1
WAGE / INCOME GAP [ $ ]
0.48
INEQUALITY / GINI INDEX
6,030
TOTAL POPULATION
3,113
MALE POPULATION
2,917
FEMALE POPULATION
106.72
MALES / 100 FEMALES
93.70
FEMALES / 100 MALES
42.7
MEDIAN AGE
3.2
AVG FAMILY SIZE
2.3
AVG HOUSEHOLD SIZE
2,171
LABOR FORCE [ PEOPLE ]
45.4%
PERCENT IN LABOR FORCE
2.9%
UNEMPLOYMENT RATE
Truth Or Consequences Zip Codes
Truth Or Consequences Area Codes
Income in Truth Or Consequences
Income Overview in Truth Or Consequences
Per Capita Income in Truth Or Consequences is $21,986, while median incomes of families and households are $59,750 and $28,685 respectively.
| Characteristic | Number | Measure |
| Per Capita Income | 6,030 | $21,986 |
| Median Family Income | 1,213 | $59,750 |
| Mean Family Income | 1,213 | $68,848 |
| Median Household Income | 2,545 | $28,685 |
| Mean Household Income | 2,545 | $49,651 |
| Income Deficit | 1,213 | $0 |
| Wage / Income Gap (%) | 6,030 | 12.74% |
| Wage / Income Gap ($) | 6,030 | 87.26¢ per $1 |
| Gini / Inequality Index | 6,030 | 0.48 |
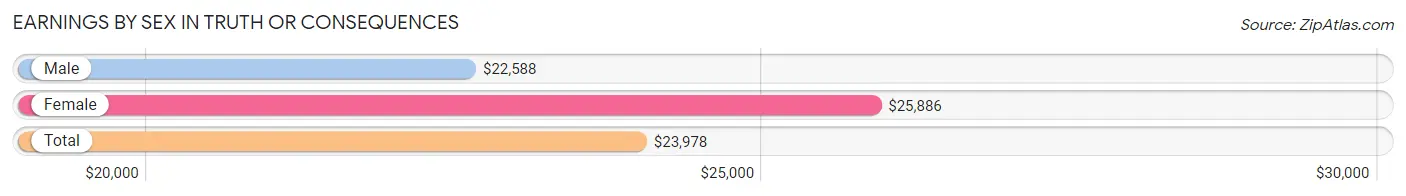
Earnings by Sex in Truth Or Consequences
Average Earnings in Truth Or Consequences are $23,978, $22,588 for men and $25,886 for women, a difference of 12.7%.
| Sex | Number | Average Earnings |
| Male | 1,213 (50.3%) | $22,588 |
| Female | 1,197 (49.7%) | $25,886 |
| Total | 2,410 (100.0%) | $23,978 |
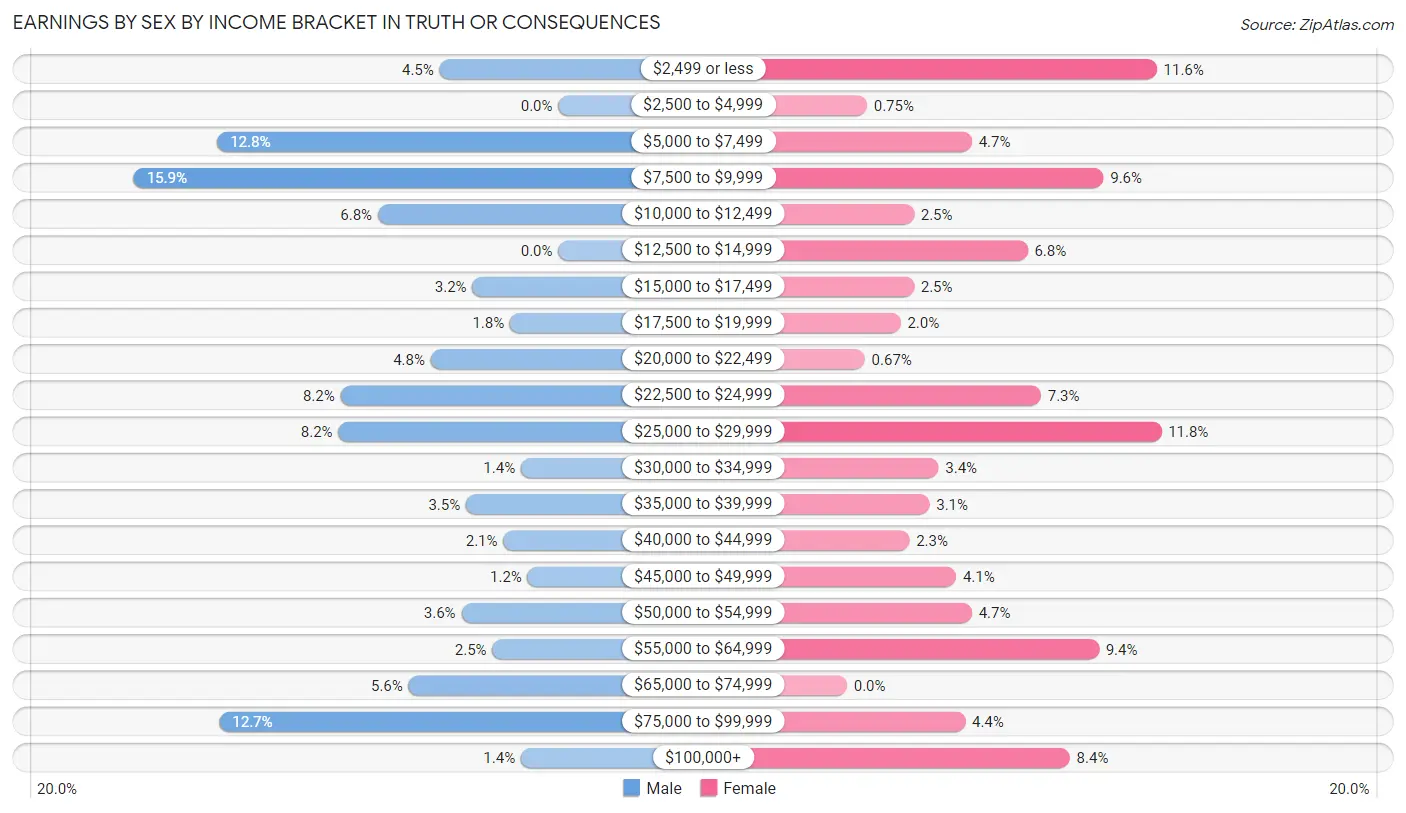
Earnings by Sex by Income Bracket in Truth Or Consequences
The most common earnings brackets in Truth Or Consequences are $7,500 to $9,999 for men (193 | 15.9%) and $25,000 to $29,999 for women (141 | 11.8%).
| Income | Male | Female |
| $2,499 or less | 54 (4.4%) | 139 (11.6%) |
| $2,500 to $4,999 | 0 (0.0%) | 9 (0.7%) |
| $5,000 to $7,499 | 155 (12.8%) | 56 (4.7%) |
| $7,500 to $9,999 | 193 (15.9%) | 115 (9.6%) |
| $10,000 to $12,499 | 82 (6.8%) | 30 (2.5%) |
| $12,500 to $14,999 | 0 (0.0%) | 81 (6.8%) |
| $15,000 to $17,499 | 39 (3.2%) | 30 (2.5%) |
| $17,500 to $19,999 | 22 (1.8%) | 24 (2.0%) |
| $20,000 to $22,499 | 58 (4.8%) | 8 (0.7%) |
| $22,500 to $24,999 | 99 (8.2%) | 87 (7.3%) |
| $25,000 to $29,999 | 100 (8.2%) | 141 (11.8%) |
| $30,000 to $34,999 | 17 (1.4%) | 41 (3.4%) |
| $35,000 to $39,999 | 42 (3.5%) | 37 (3.1%) |
| $40,000 to $44,999 | 25 (2.1%) | 28 (2.3%) |
| $45,000 to $49,999 | 14 (1.1%) | 49 (4.1%) |
| $50,000 to $54,999 | 44 (3.6%) | 56 (4.7%) |
| $55,000 to $64,999 | 30 (2.5%) | 113 (9.4%) |
| $65,000 to $74,999 | 68 (5.6%) | 0 (0.0%) |
| $75,000 to $99,999 | 154 (12.7%) | 53 (4.4%) |
| $100,000+ | 17 (1.4%) | 100 (8.4%) |
| Total | 1,213 (100.0%) | 1,197 (100.0%) |
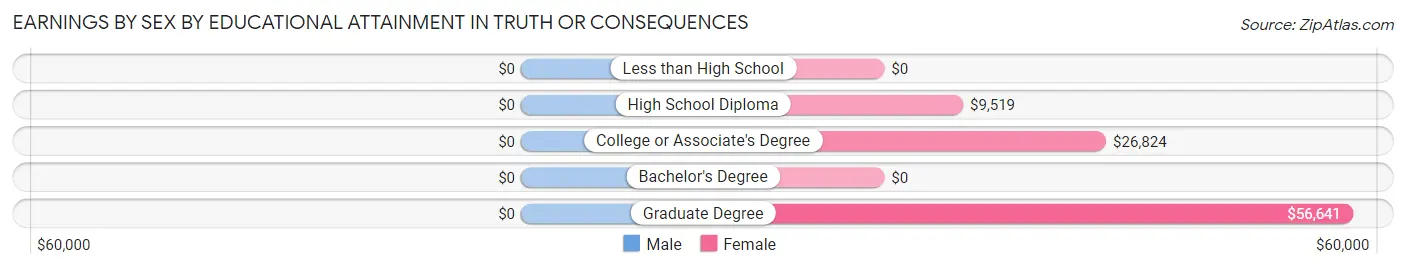
Earnings by Sex by Educational Attainment in Truth Or Consequences
| Educational Attainment | Male Income | Female Income |
| Less than High School | - | - |
| High School Diploma | - | - |
| College or Associate's Degree | - | - |
| Bachelor's Degree | - | - |
| Graduate Degree | - | - |
| Total | $23,182 | $26,467 |
Family Income in Truth Or Consequences
Family Income Brackets in Truth Or Consequences
According to the Truth Or Consequences family income data, there are 323 families falling into the $100,000 to $149,999 income range, which is the most common income bracket and makes up 26.6% of all families.
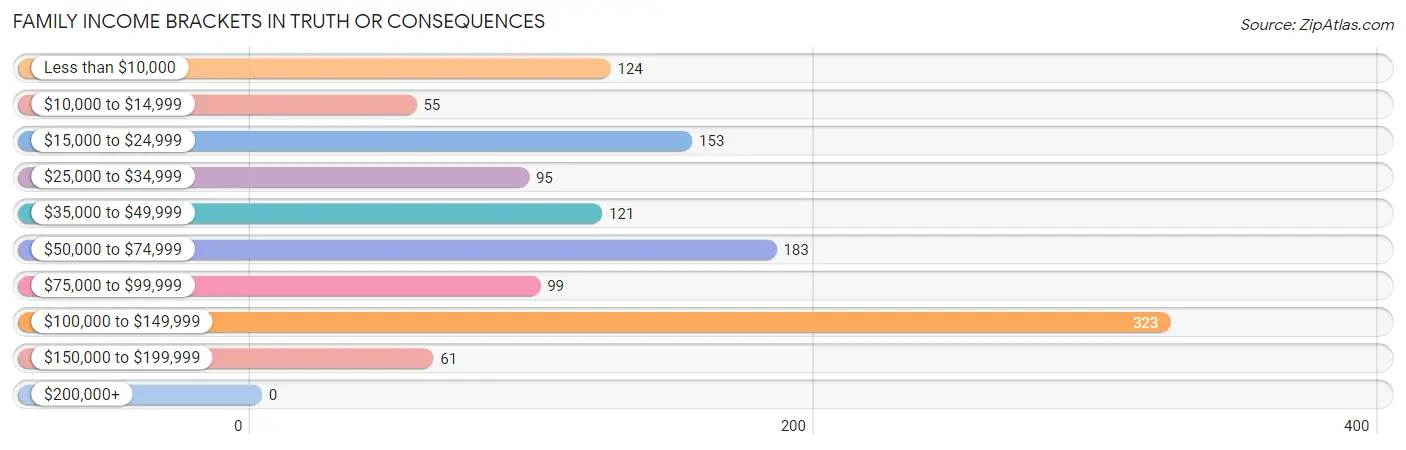
| Income Bracket | # Families | % Families |
| Less than $10,000 | 124 | 10.2% |
| $10,000 to $14,999 | 55 | 4.5% |
| $15,000 to $24,999 | 153 | 12.6% |
| $25,000 to $34,999 | 95 | 7.8% |
| $35,000 to $49,999 | 121 | 10.0% |
| $50,000 to $74,999 | 183 | 15.1% |
| $75,000 to $99,999 | 99 | 8.2% |
| $100,000 to $149,999 | 323 | 26.6% |
| $150,000 to $199,999 | 61 | 5.0% |
| $200,000+ | 0 | 0.0% |
Family Income by Famaliy Size in Truth Or Consequences
4-person families (137 | 11.3%) account for the highest median family income in Truth Or Consequences with $112,827 per family, while 2-person families (718 | 59.2%) have the highest median income of $29,000 per family member.
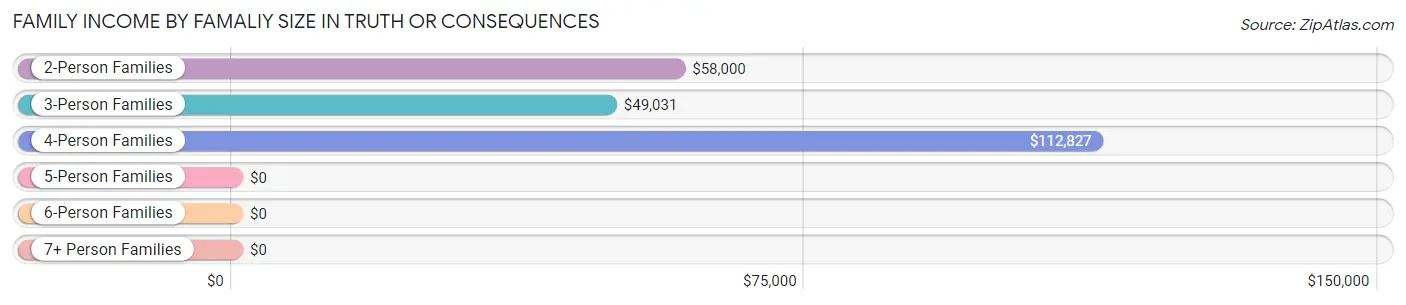
| Income Bracket | # Families | Median Income |
| 2-Person Families | 718 (59.2%) | $58,000 |
| 3-Person Families | 218 (18.0%) | $49,031 |
| 4-Person Families | 137 (11.3%) | $112,827 |
| 5-Person Families | 52 (4.3%) | $0 |
| 6-Person Families | 88 (7.2%) | $0 |
| 7+ Person Families | 0 (0.0%) | $0 |
| Total | 1,213 (100.0%) | $59,750 |
Family Income by Number of Earners in Truth Or Consequences
The median family income in Truth Or Consequences is $59,750, with families comprising 2 earners (393) having the highest median family income of $137,561, while families with 1 earner (517) have the lowest median family income of $32,684, accounting for 32.4% and 42.6% of families, respectively.
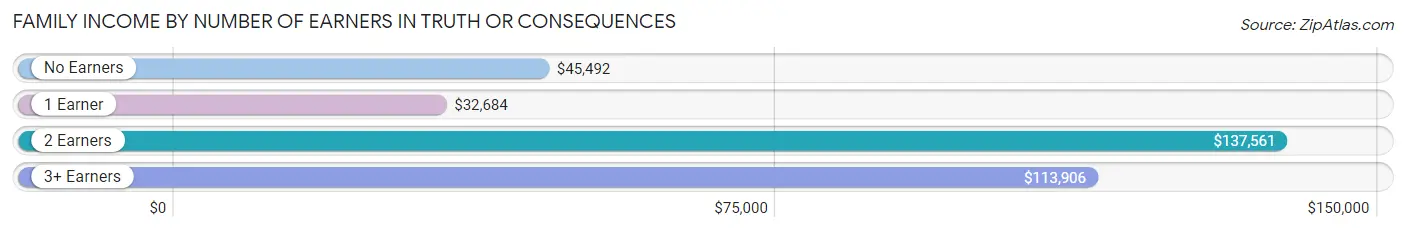
| Number of Earners | # Families | Median Income |
| No Earners | 251 (20.7%) | $45,492 |
| 1 Earner | 517 (42.6%) | $32,684 |
| 2 Earners | 393 (32.4%) | $137,561 |
| 3+ Earners | 52 (4.3%) | $113,906 |
| Total | 1,213 (100.0%) | $59,750 |
Household Income in Truth Or Consequences
Household Income Brackets in Truth Or Consequences
With 534 households falling in the category, the $15,000 to $24,999 income range is the most frequent in Truth Or Consequences, accounting for 21.0% of all households.
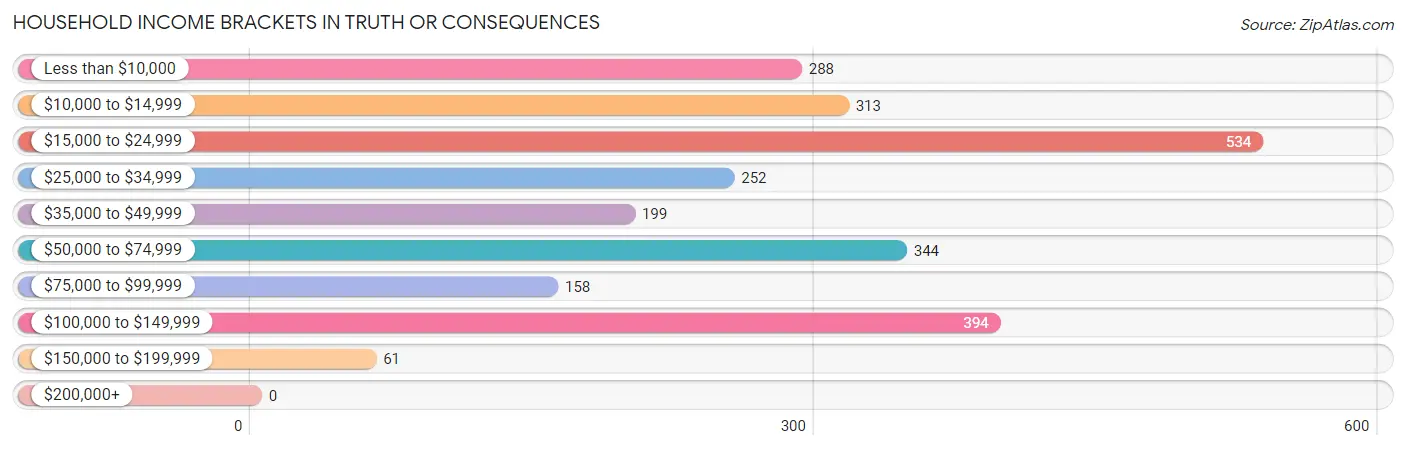
| Income Bracket | # Households | % Households |
| Less than $10,000 | 288 | 11.3% |
| $10,000 to $14,999 | 313 | 12.3% |
| $15,000 to $24,999 | 534 | 21.0% |
| $25,000 to $34,999 | 252 | 9.9% |
| $35,000 to $49,999 | 199 | 7.8% |
| $50,000 to $74,999 | 344 | 13.5% |
| $75,000 to $99,999 | 158 | 6.2% |
| $100,000 to $149,999 | 394 | 15.5% |
| $150,000 to $199,999 | 61 | 2.4% |
| $200,000+ | 0 | 0.0% |
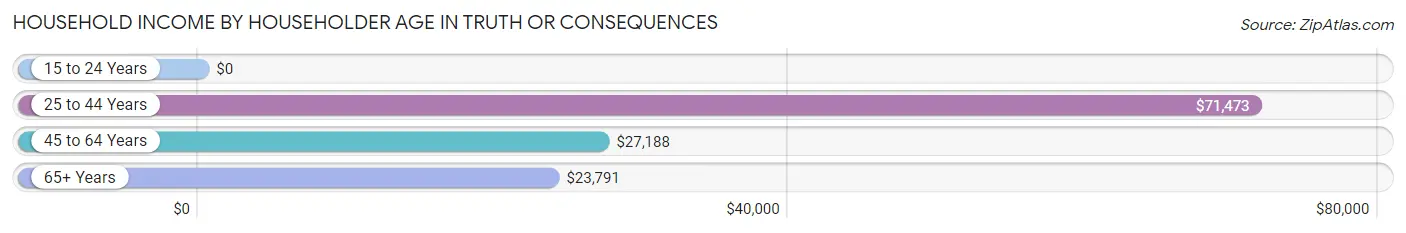
Household Income by Householder Age in Truth Or Consequences
The median household income in Truth Or Consequences is $28,685, with the highest median household income of $71,473 found in the 25 to 44 years age bracket for the primary householder. A total of 711 households (27.9%) fall into this category. Meanwhile, the 15 to 24 years age bracket for the primary householder has the lowest median household income of $0, with 47 households (1.8%) in this group.
| Income Bracket | # Households | Median Income |
| 15 to 24 Years | 47 (1.8%) | $0 |
| 25 to 44 Years | 711 (27.9%) | $71,473 |
| 45 to 64 Years | 748 (29.4%) | $27,188 |
| 65+ Years | 1,039 (40.8%) | $23,791 |
| Total | 2,545 (100.0%) | $28,685 |
Poverty in Truth Or Consequences
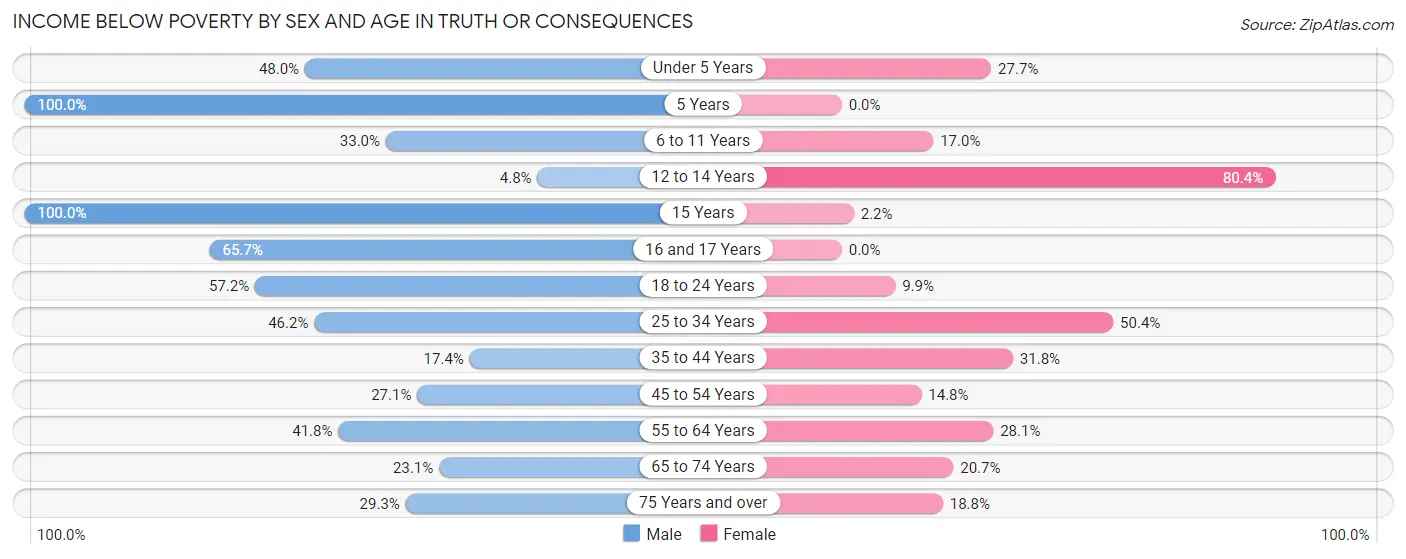
Income Below Poverty by Sex and Age in Truth Or Consequences
With 34.6% poverty level for males and 24.9% for females among the residents of Truth Or Consequences, 5 year old males and 12 to 14 year old females are the most vulnerable to poverty, with 37 males (100.0%) and 78 females (80.4%) in their respective age groups living below the poverty level.
| Age Bracket | Male | Female |
| Under 5 Years | 94 (48.0%) | 28 (27.7%) |
| 5 Years | 37 (100.0%) | 0 (0.0%) |
| 6 to 11 Years | 86 (33.0%) | 37 (17.0%) |
| 12 to 14 Years | 5 (4.8%) | 78 (80.4%) |
| 15 Years | 55 (100.0%) | 4 (2.2%) |
| 16 and 17 Years | 44 (65.7%) | 0 (0.0%) |
| 18 to 24 Years | 99 (57.2%) | 11 (9.9%) |
| 25 to 34 Years | 172 (46.2%) | 68 (50.4%) |
| 35 to 44 Years | 88 (17.4%) | 188 (31.8%) |
| 45 to 54 Years | 96 (27.1%) | 44 (14.8%) |
| 55 to 64 Years | 99 (41.8%) | 95 (28.1%) |
| 65 to 74 Years | 84 (23.1%) | 100 (20.7%) |
| 75 Years and over | 84 (29.3%) | 33 (18.8%) |
| Total | 1,043 (34.6%) | 686 (24.9%) |
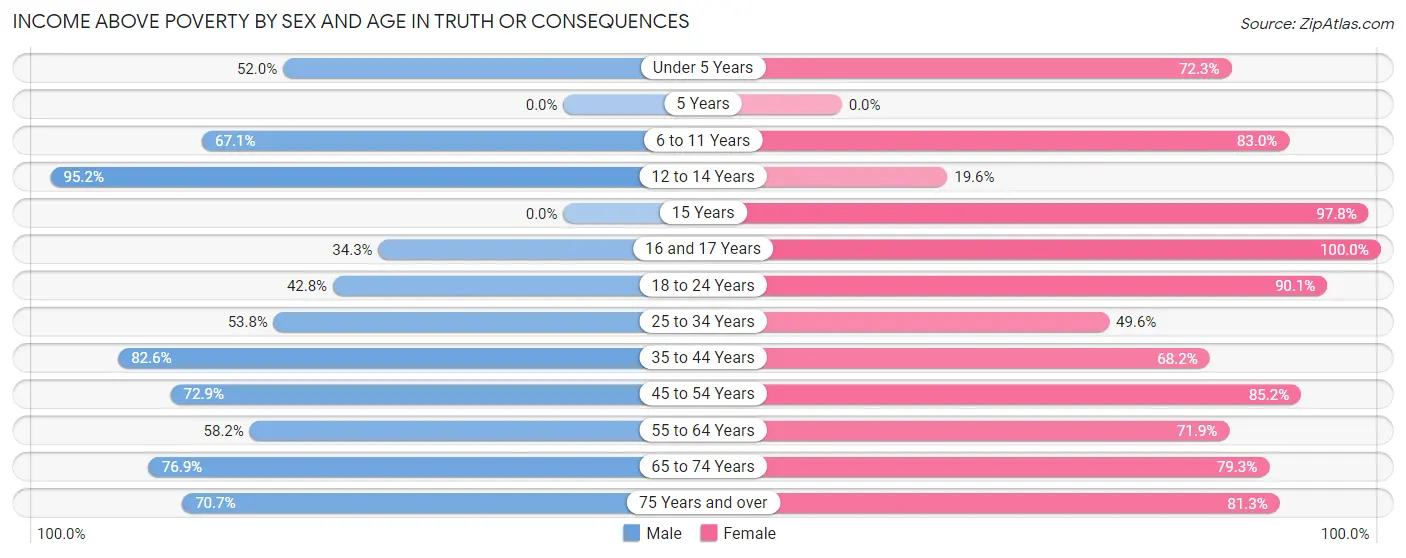
Income Above Poverty by Sex and Age in Truth Or Consequences
According to the poverty statistics in Truth Or Consequences, males aged 12 to 14 years and females aged 16 and 17 years are the age groups that are most secure financially, with 95.2% of males and 100.0% of females in these age groups living above the poverty line.
| Age Bracket | Male | Female |
| Under 5 Years | 102 (52.0%) | 73 (72.3%) |
| 5 Years | 0 (0.0%) | 0 (0.0%) |
| 6 to 11 Years | 175 (67.0%) | 181 (83.0%) |
| 12 to 14 Years | 99 (95.2%) | 19 (19.6%) |
| 15 Years | 0 (0.0%) | 176 (97.8%) |
| 16 and 17 Years | 23 (34.3%) | 28 (100.0%) |
| 18 to 24 Years | 74 (42.8%) | 100 (90.1%) |
| 25 to 34 Years | 200 (53.8%) | 67 (49.6%) |
| 35 to 44 Years | 418 (82.6%) | 404 (68.2%) |
| 45 to 54 Years | 258 (72.9%) | 254 (85.2%) |
| 55 to 64 Years | 138 (58.2%) | 243 (71.9%) |
| 65 to 74 Years | 280 (76.9%) | 383 (79.3%) |
| 75 Years and over | 203 (70.7%) | 143 (81.2%) |
| Total | 1,970 (65.4%) | 2,071 (75.1%) |
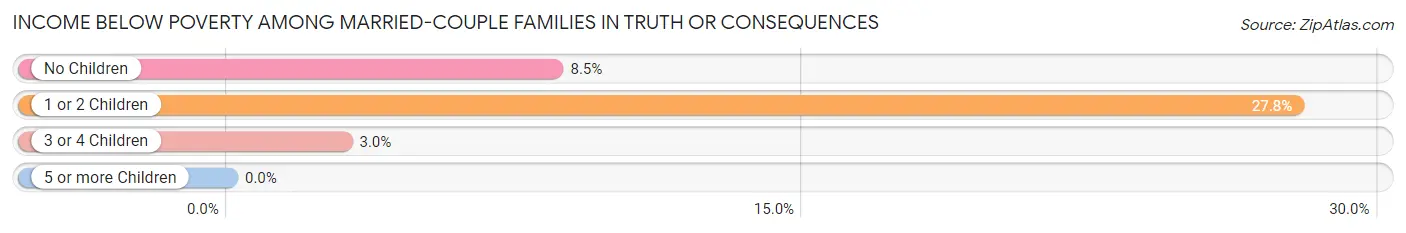
Income Below Poverty Among Married-Couple Families in Truth Or Consequences
The poverty statistics for married-couple families in Truth Or Consequences show that 12.6% or 104 of the total 826 families live below the poverty line. Families with 1 or 2 children have the highest poverty rate of 27.8%, comprising of 54 families. On the other hand, families with 3 or 4 children have the lowest poverty rate of 3.0%, which includes 2 families.
| Children | Above Poverty | Below Poverty |
| No Children | 517 (91.5%) | 48 (8.5%) |
| 1 or 2 Children | 140 (72.2%) | 54 (27.8%) |
| 3 or 4 Children | 65 (97.0%) | 2 (3.0%) |
| 5 or more Children | 0 (0.0%) | 0 (0.0%) |
| Total | 722 (87.4%) | 104 (12.6%) |
Income Below Poverty Among Single-Parent Households in Truth Or Consequences
According to the poverty data in Truth Or Consequences, 22.7% or 30 single-father households and 54.5% or 139 single-mother households are living below the poverty line. Among single-father households, those with no children have the highest poverty rate, with 30 households (100.0%) experiencing poverty. Likewise, among single-mother households, those with 3 or 4 children have the highest poverty rate, with 37 households (100.0%) falling below the poverty line.
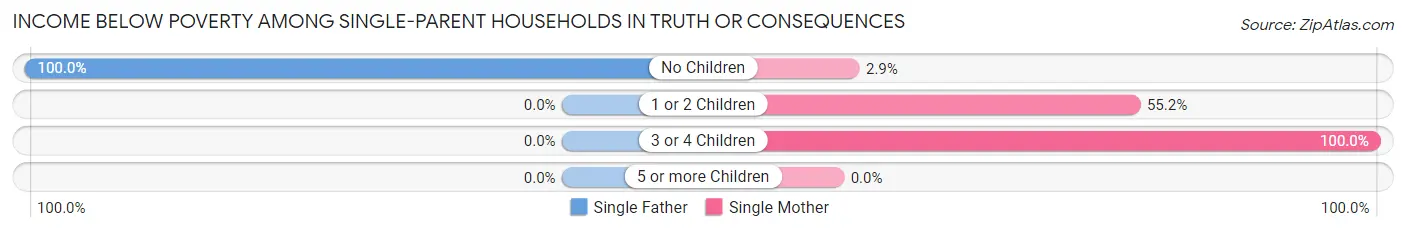
| Children | Single Father | Single Mother |
| No Children | 30 (100.0%) | 1 (2.9%) |
| 1 or 2 Children | 0 (0.0%) | 101 (55.2%) |
| 3 or 4 Children | 0 (0.0%) | 37 (100.0%) |
| 5 or more Children | 0 (0.0%) | 0 (0.0%) |
| Total | 30 (22.7%) | 139 (54.5%) |
Income Below Poverty Among Married-Couple vs Single-Parent Households in Truth Or Consequences
The poverty data for Truth Or Consequences shows that 104 of the married-couple family households (12.6%) and 169 of the single-parent households (43.7%) are living below the poverty level. Within the married-couple family households, those with 1 or 2 children have the highest poverty rate, with 54 households (27.8%) falling below the poverty line. Among the single-parent households, those with 3 or 4 children have the highest poverty rate, with 37 household (100.0%) living below poverty.
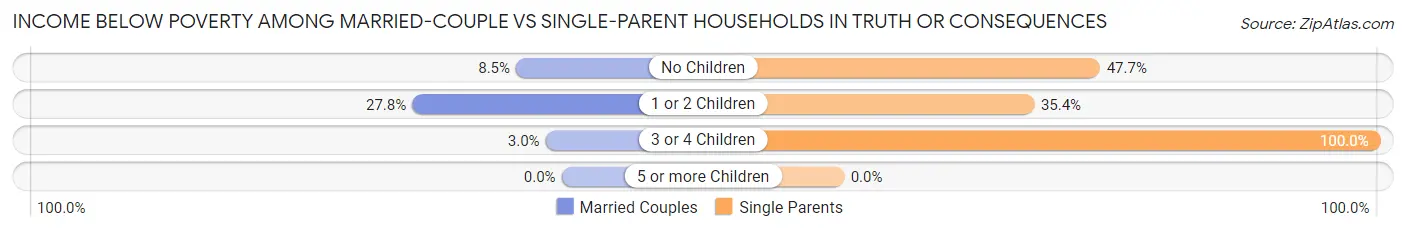
| Children | Married-Couple Families | Single-Parent Households |
| No Children | 48 (8.5%) | 31 (47.7%) |
| 1 or 2 Children | 54 (27.8%) | 101 (35.4%) |
| 3 or 4 Children | 2 (3.0%) | 37 (100.0%) |
| 5 or more Children | 0 (0.0%) | 0 (0.0%) |
| Total | 104 (12.6%) | 169 (43.7%) |
Race in Truth Or Consequences
The most populous races in Truth Or Consequences are White / Caucasian (4,449 | 73.8%), Hispanic or Latino (2,221 | 36.8%), and Two or more Races (876 | 14.5%).
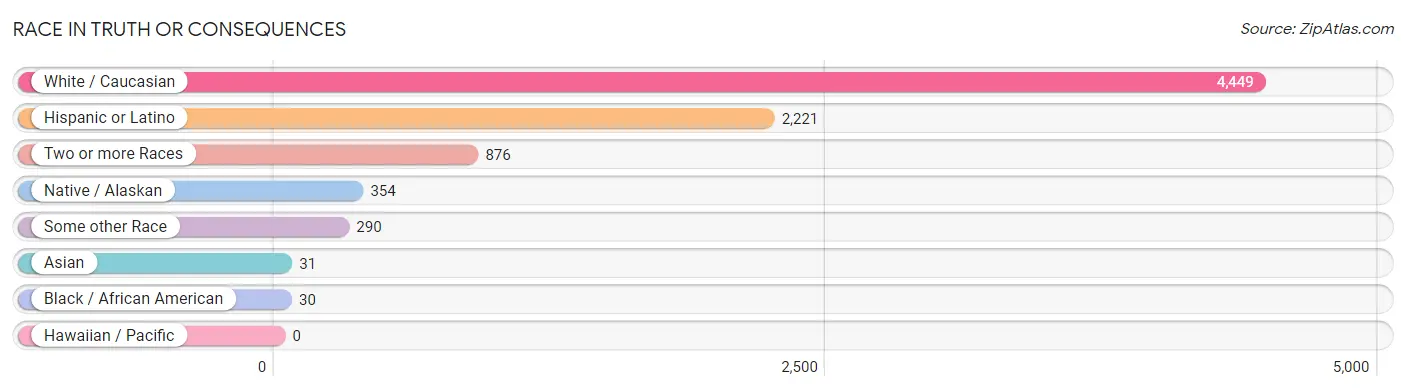
| Race | # Population | % Population |
| Asian | 31 | 0.5% |
| Black / African American | 30 | 0.5% |
| Hawaiian / Pacific | 0 | 0.0% |
| Hispanic or Latino | 2,221 | 36.8% |
| Native / Alaskan | 354 | 5.9% |
| White / Caucasian | 4,449 | 73.8% |
| Two or more Races | 876 | 14.5% |
| Some other Race | 290 | 4.8% |
| Total | 6,030 | 100.0% |
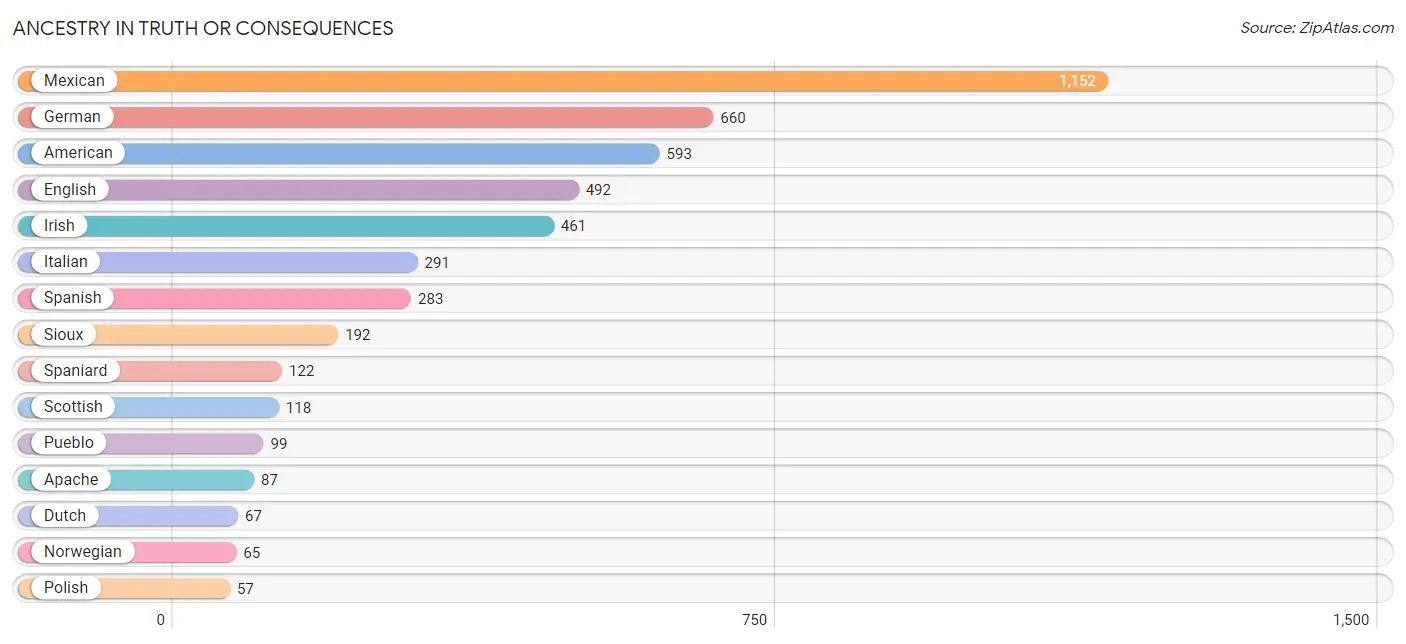
Ancestry in Truth Or Consequences
The most populous ancestries reported in Truth Or Consequences are Mexican (1,152 | 19.1%), German (660 | 11.0%), American (593 | 9.8%), English (492 | 8.2%), and Irish (461 | 7.6%), together accounting for 55.7% of all Truth Or Consequences residents.
| Ancestry | # Population | % Population |
| Alaskan Athabascan | 7 | 0.1% |
| Alsatian | 9 | 0.2% |
| American | 593 | 9.8% |
| Apache | 87 | 1.4% |
| Bhutanese | 14 | 0.2% |
| Blackfeet | 5 | 0.1% |
| British | 14 | 0.2% |
| Canadian | 10 | 0.2% |
| Czech | 23 | 0.4% |
| Danish | 14 | 0.2% |
| Dutch | 67 | 1.1% |
| Eastern European | 6 | 0.1% |
| English | 492 | 8.2% |
| European | 37 | 0.6% |
| Finnish | 8 | 0.1% |
| French | 52 | 0.9% |
| French Canadian | 14 | 0.2% |
| German | 660 | 11.0% |
| Greek | 6 | 0.1% |
| Iranian | 8 | 0.1% |
| Irish | 461 | 7.6% |
| Italian | 291 | 4.8% |
| Korean | 17 | 0.3% |
| Lithuanian | 5 | 0.1% |
| Mexican | 1,152 | 19.1% |
| Navajo | 7 | 0.1% |
| Northern European | 13 | 0.2% |
| Norwegian | 65 | 1.1% |
| Polish | 57 | 0.9% |
| Pueblo | 99 | 1.6% |
| Puerto Rican | 22 | 0.4% |
| Romanian | 5 | 0.1% |
| Russian | 14 | 0.2% |
| Scandinavian | 16 | 0.3% |
| Scotch-Irish | 5 | 0.1% |
| Scottish | 118 | 2.0% |
| Sioux | 192 | 3.2% |
| Spaniard | 122 | 2.0% |
| Spanish | 283 | 4.7% |
| Spanish American | 9 | 0.2% |
| Swedish | 40 | 0.7% |
| Ukrainian | 5 | 0.1% |
| Welsh | 5 | 0.1% | View All 43 Rows |
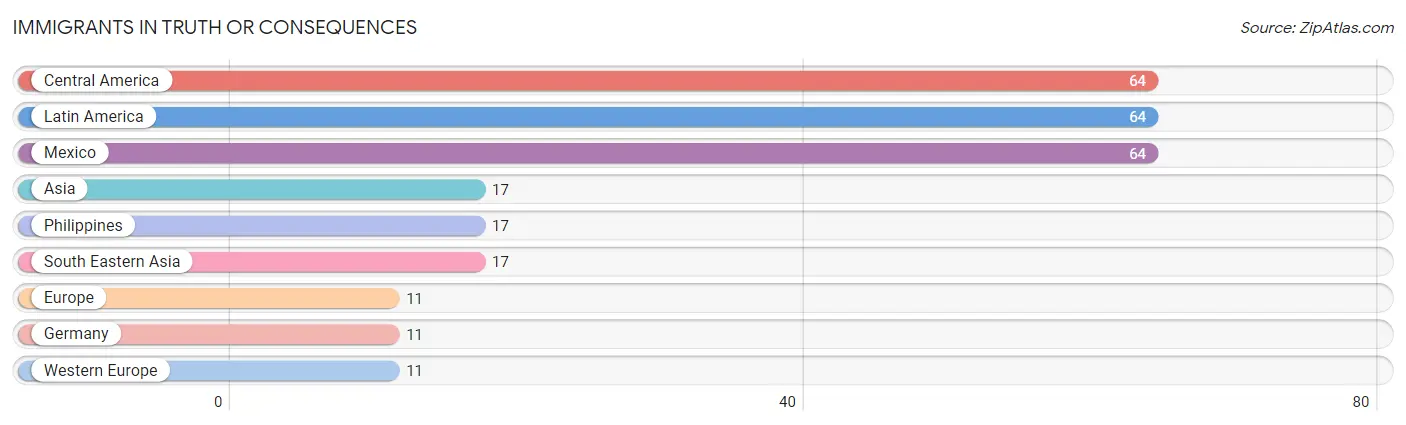
Immigrants in Truth Or Consequences
The most numerous immigrant groups reported in Truth Or Consequences came from Central America (64 | 1.1%), Latin America (64 | 1.1%), Mexico (64 | 1.1%), Asia (17 | 0.3%), and Philippines (17 | 0.3%), together accounting for 3.7% of all Truth Or Consequences residents.
| Immigration Origin | # Population | % Population |
| Asia | 17 | 0.3% |
| Central America | 64 | 1.1% |
| Europe | 11 | 0.2% |
| Germany | 11 | 0.2% |
| Latin America | 64 | 1.1% |
| Mexico | 64 | 1.1% |
| Philippines | 17 | 0.3% |
| South Eastern Asia | 17 | 0.3% |
| Western Europe | 11 | 0.2% | View All 9 Rows |
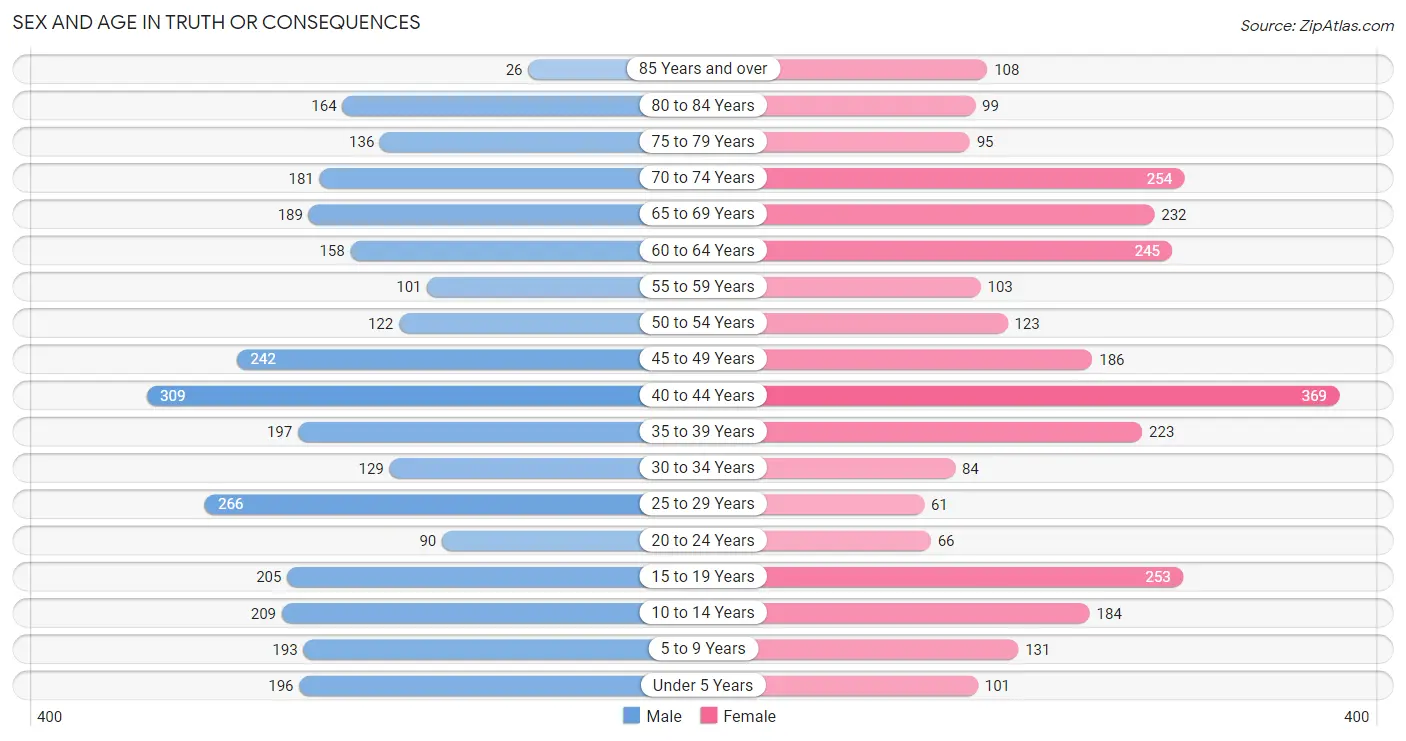
Sex and Age in Truth Or Consequences
Sex and Age in Truth Or Consequences
The most populous age groups in Truth Or Consequences are 40 to 44 Years (309 | 9.9%) for men and 40 to 44 Years (369 | 12.7%) for women.
| Age Bracket | Male | Female |
| Under 5 Years | 196 (6.3%) | 101 (3.5%) |
| 5 to 9 Years | 193 (6.2%) | 131 (4.5%) |
| 10 to 14 Years | 209 (6.7%) | 184 (6.3%) |
| 15 to 19 Years | 205 (6.6%) | 253 (8.7%) |
| 20 to 24 Years | 90 (2.9%) | 66 (2.3%) |
| 25 to 29 Years | 266 (8.5%) | 61 (2.1%) |
| 30 to 34 Years | 129 (4.1%) | 84 (2.9%) |
| 35 to 39 Years | 197 (6.3%) | 223 (7.6%) |
| 40 to 44 Years | 309 (9.9%) | 369 (12.7%) |
| 45 to 49 Years | 242 (7.8%) | 186 (6.4%) |
| 50 to 54 Years | 122 (3.9%) | 123 (4.2%) |
| 55 to 59 Years | 101 (3.2%) | 103 (3.5%) |
| 60 to 64 Years | 158 (5.1%) | 245 (8.4%) |
| 65 to 69 Years | 189 (6.1%) | 232 (8.0%) |
| 70 to 74 Years | 181 (5.8%) | 254 (8.7%) |
| 75 to 79 Years | 136 (4.4%) | 95 (3.3%) |
| 80 to 84 Years | 164 (5.3%) | 99 (3.4%) |
| 85 Years and over | 26 (0.8%) | 108 (3.7%) |
| Total | 3,113 (100.0%) | 2,917 (100.0%) |
Families and Households in Truth Or Consequences
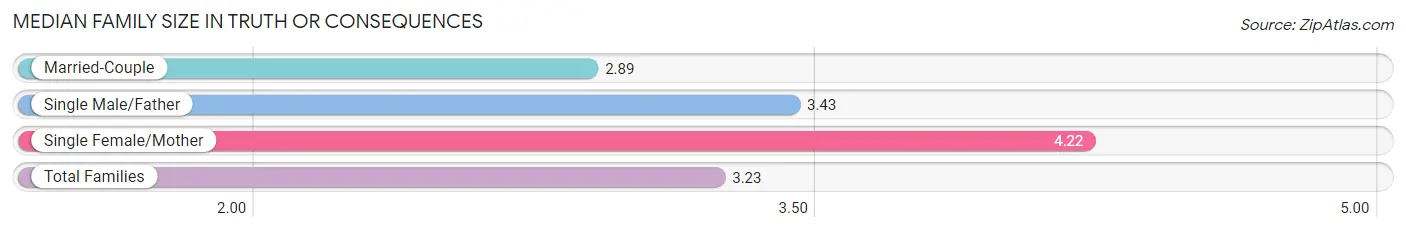
Median Family Size in Truth Or Consequences
The median family size in Truth Or Consequences is 3.23 persons per family, with single female/mother families (255 | 21.0%) accounting for the largest median family size of 4.22 persons per family. On the other hand, married-couple families (826 | 68.1%) represent the smallest median family size with 2.89 persons per family.
| Family Type | # Families | Family Size |
| Married-Couple | 826 (68.1%) | 2.89 |
| Single Male/Father | 132 (10.9%) | 3.43 |
| Single Female/Mother | 255 (21.0%) | 4.22 |
| Total Families | 1,213 (100.0%) | 3.23 |
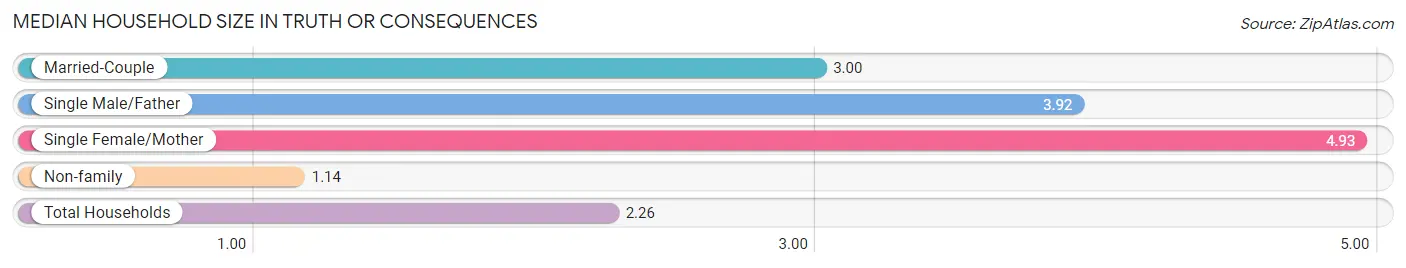
Median Household Size in Truth Or Consequences
The median household size in Truth Or Consequences is 2.26 persons per household, with single female/mother households (255 | 10.0%) accounting for the largest median household size of 4.93 persons per household. non-family households (1,332 | 52.3%) represent the smallest median household size with 1.14 persons per household.
| Household Type | # Households | Household Size |
| Married-Couple | 826 (32.5%) | 3.00 |
| Single Male/Father | 132 (5.2%) | 3.92 |
| Single Female/Mother | 255 (10.0%) | 4.93 |
| Non-family | 1,332 (52.3%) | 1.14 |
| Total Households | 2,545 (100.0%) | 2.26 |
Household Size by Marriage Status in Truth Or Consequences
Out of a total of 2,545 households in Truth Or Consequences, 1,213 (47.7%) are family households, while 1,332 (52.3%) are nonfamily households. The most numerous type of family households are 2-person households, comprising 661, and the most common type of nonfamily households are 1-person households, comprising 1,184.
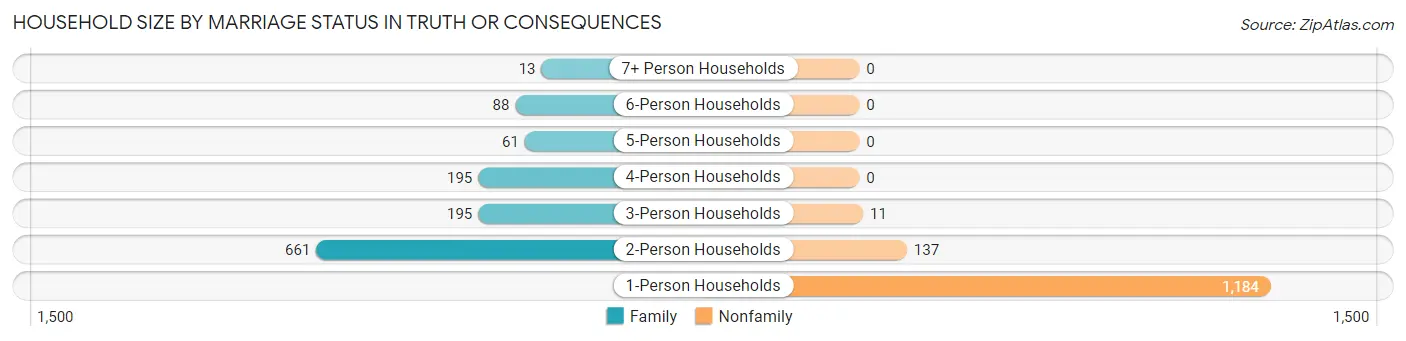
| Household Size | Family Households | Nonfamily Households |
| 1-Person Households | - | 1,184 (46.5%) |
| 2-Person Households | 661 (26.0%) | 137 (5.4%) |
| 3-Person Households | 195 (7.7%) | 11 (0.4%) |
| 4-Person Households | 195 (7.7%) | 0 (0.0%) |
| 5-Person Households | 61 (2.4%) | 0 (0.0%) |
| 6-Person Households | 88 (3.5%) | 0 (0.0%) |
| 7+ Person Households | 13 (0.5%) | 0 (0.0%) |
| Total | 1,213 (47.7%) | 1,332 (52.3%) |
Female Fertility in Truth Or Consequences
Fertility by Age in Truth Or Consequences
Average fertility rate in Truth Or Consequences is 48.0 births per 1,000 women. Women in the age bracket of 35 to 50 years have the highest fertility rate with 66.0 births per 1,000 women. Women in the age bracket of 35 to 50 years acount for 85.0% of all women with births.
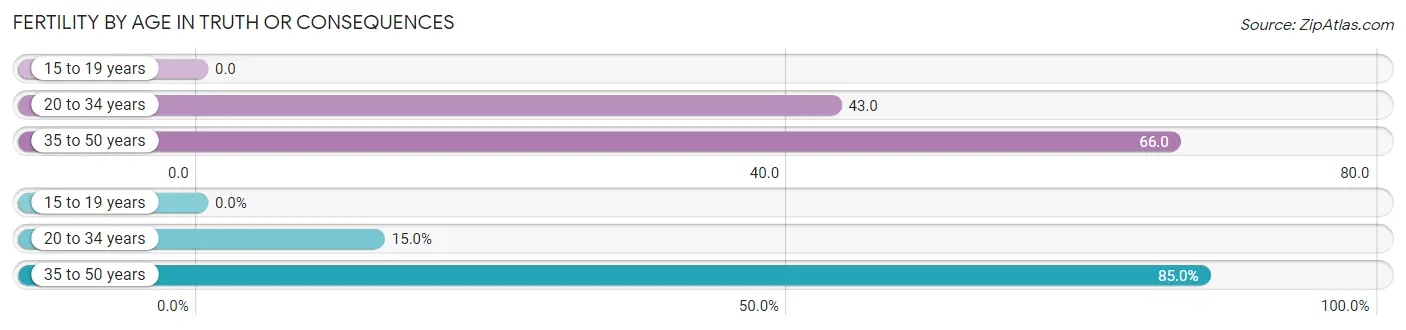
| Age Bracket | Women with Births | Births / 1,000 Women |
| 15 to 19 years | 0 (0.0%) | 0.0 |
| 20 to 34 years | 9 (15.0%) | 43.0 |
| 35 to 50 years | 51 (85.0%) | 66.0 |
| Total | 60 (100.0%) | 48.0 |
Fertility by Age by Marriage Status in Truth Or Consequences
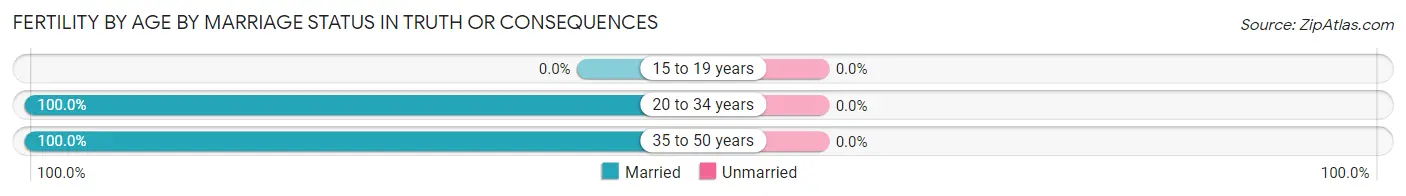
| Age Bracket | Married | Unmarried |
| 15 to 19 years | 0 (0.0%) | 0 (0.0%) |
| 20 to 34 years | 9 (100.0%) | 0 (0.0%) |
| 35 to 50 years | 51 (100.0%) | 0 (0.0%) |
| Total | 60 (100.0%) | 0 (0.0%) |
Fertility by Education in Truth Or Consequences
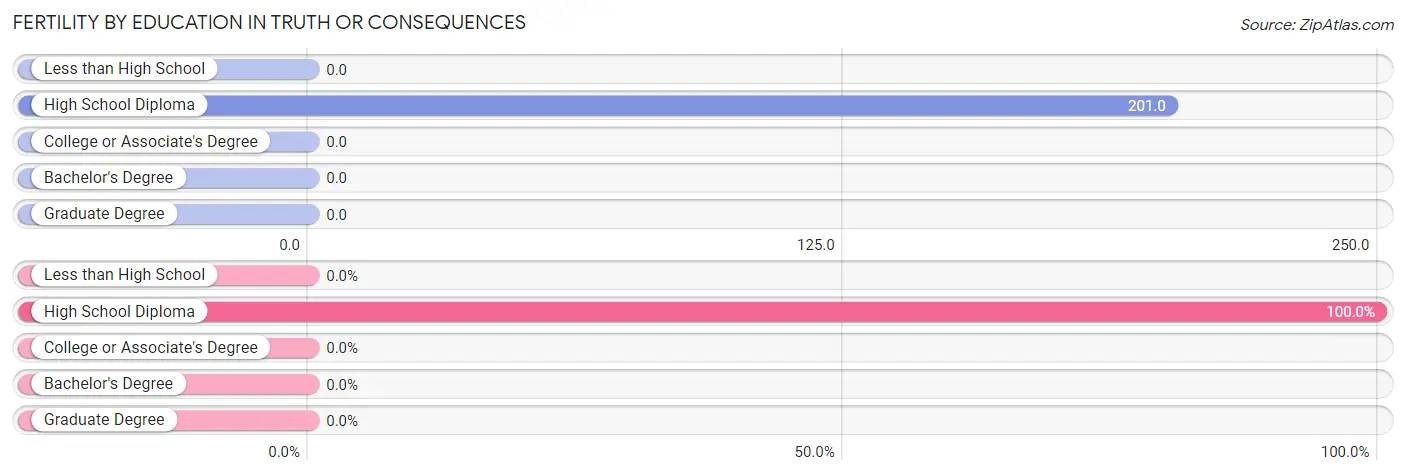
| Educational Attainment | Women with Births | Births / 1,000 Women |
| Less than High School | 0 (0.0%) | 0.0 |
| High School Diploma | 60 (100.0%) | 201.0 |
| College or Associate's Degree | 0 (0.0%) | 0.0 |
| Bachelor's Degree | 0 (0.0%) | 0.0 |
| Graduate Degree | 0 (0.0%) | 0.0 |
| Total | 60 (100.0%) | 48.0 |
Fertility by Education by Marriage Status in Truth Or Consequences
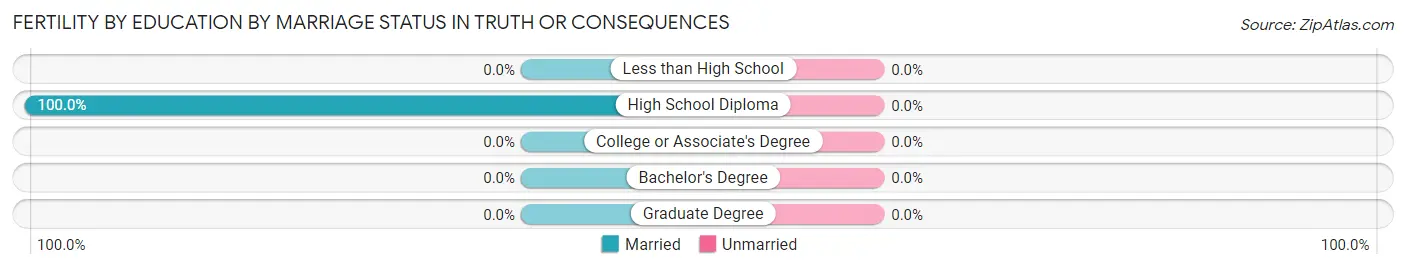
| Educational Attainment | Married | Unmarried |
| Less than High School | 0 (0.0%) | 0 (0.0%) |
| High School Diploma | 60 (100.0%) | 0 (0.0%) |
| College or Associate's Degree | 0 (0.0%) | 0 (0.0%) |
| Bachelor's Degree | 0 (0.0%) | 0 (0.0%) |
| Graduate Degree | 0 (0.0%) | 0 (0.0%) |
| Total | 60 (100.0%) | 0 (0.0%) |
Employment Characteristics in Truth Or Consequences
Employment by Class of Employer in Truth Or Consequences
Among the 2,105 employed individuals in Truth Or Consequences, private company employees (1,054 | 50.1%), local government employees (374 | 17.8%), and self-employed (not incorporated) (269 | 12.8%) make up the most common classes of employment.
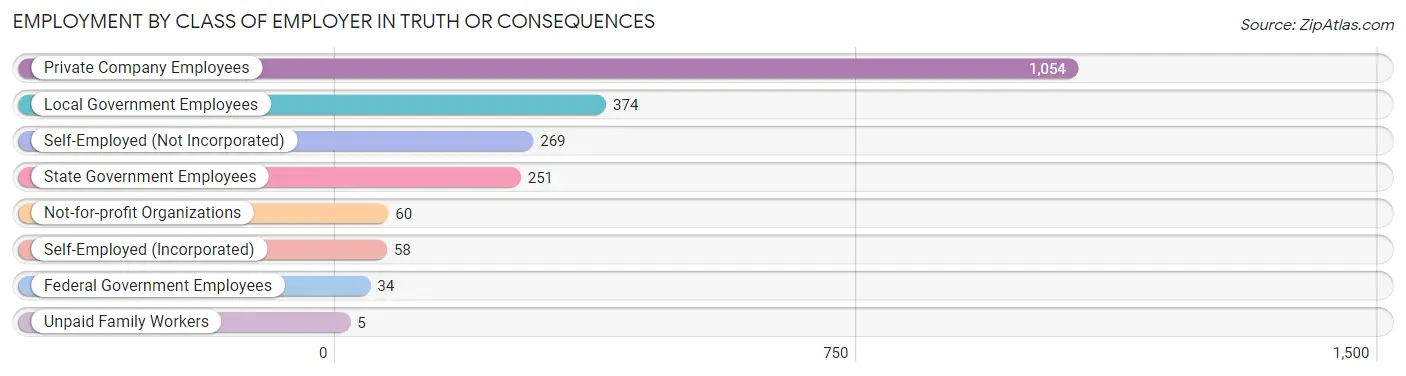
| Employer Class | # Employees | % Employees |
| Private Company Employees | 1,054 | 50.1% |
| Self-Employed (Incorporated) | 58 | 2.8% |
| Self-Employed (Not Incorporated) | 269 | 12.8% |
| Not-for-profit Organizations | 60 | 2.9% |
| Local Government Employees | 374 | 17.8% |
| State Government Employees | 251 | 11.9% |
| Federal Government Employees | 34 | 1.6% |
| Unpaid Family Workers | 5 | 0.2% |
| Total | 2,105 | 100.0% |
Employment Status by Age in Truth Or Consequences
According to the labor force statistics for Truth Or Consequences, out of the total population over 16 years of age (4,781), 45.4% or 2,171 individuals are in the labor force, with 2.9% or 63 of them unemployed. The age group with the highest labor force participation rate is 20 to 24 years, with 100.0% or 156 individuals in the labor force. Within the labor force, the 65 to 74 years age range has the highest percentage of unemployed individuals, with 33.8% or 49 of them being unemployed.
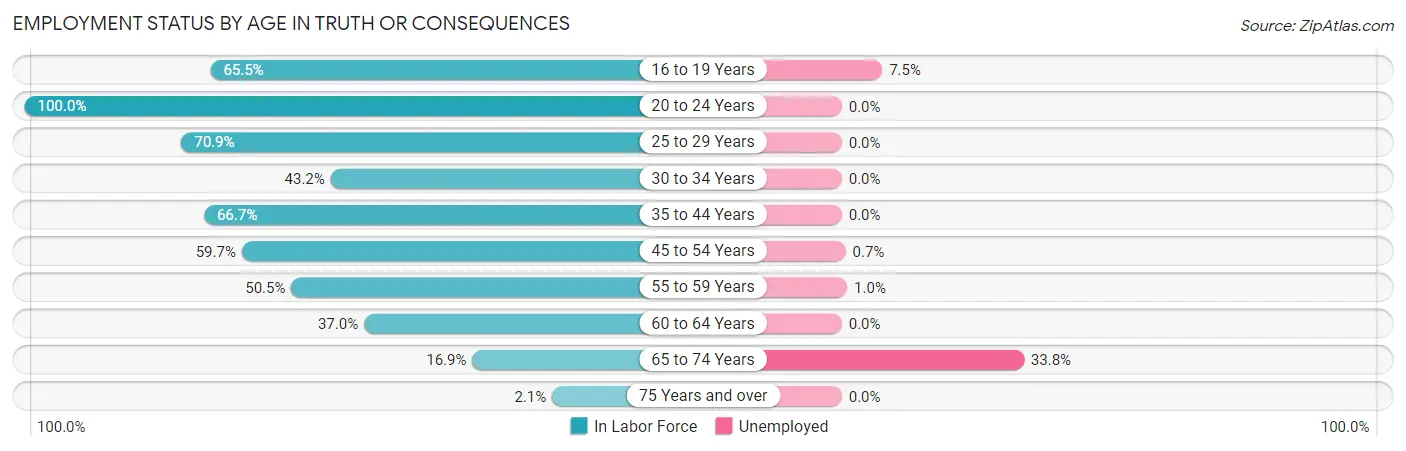
| Age Bracket | In Labor Force | Unemployed |
| 16 to 19 Years | 146 (65.5%) | 11 (7.5%) |
| 20 to 24 Years | 156 (100.0%) | 0 (0.0%) |
| 25 to 29 Years | 232 (70.9%) | 0 (0.0%) |
| 30 to 34 Years | 92 (43.2%) | 0 (0.0%) |
| 35 to 44 Years | 732 (66.7%) | 0 (0.0%) |
| 45 to 54 Years | 402 (59.7%) | 3 (0.7%) |
| 55 to 59 Years | 103 (50.5%) | 1 (1.0%) |
| 60 to 64 Years | 149 (37.0%) | 0 (0.0%) |
| 65 to 74 Years | 145 (16.9%) | 49 (33.8%) |
| 75 Years and over | 13 (2.1%) | 0 (0.0%) |
| Total | 2,171 (45.4%) | 63 (2.9%) |
Employment Status by Educational Attainment in Truth Or Consequences
According to labor force statistics for Truth Or Consequences, 58.6% of individuals (1,710) out of the total population between 25 and 64 years of age (2,918) are in the labor force, with 0.2% or 3 of them being unemployed. The group with the highest labor force participation rate are those with the educational attainment of bachelor's degree or higher, with 90.6% or 556 individuals in the labor force. Within the labor force, individuals with college / associate degree education have the highest percentage of unemployment, with 0.6% or 3 of them being unemployed.
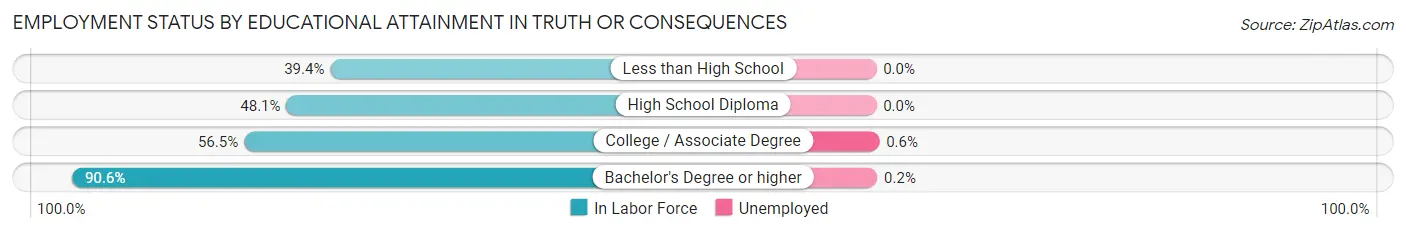
| Educational Attainment | In Labor Force | Unemployed |
| Less than High School | 109 (39.4%) | 0 (0.0%) |
| High School Diploma | 577 (48.1%) | 0 (0.0%) |
| College / Associate Degree | 468 (56.5%) | 5 (0.6%) |
| Bachelor's Degree or higher | 556 (90.6%) | 1 (0.2%) |
| Total | 1,710 (58.6%) | 6 (0.2%) |
Employment Occupations by Sex in Truth Or Consequences
Management, Business, Science and Arts Occupations
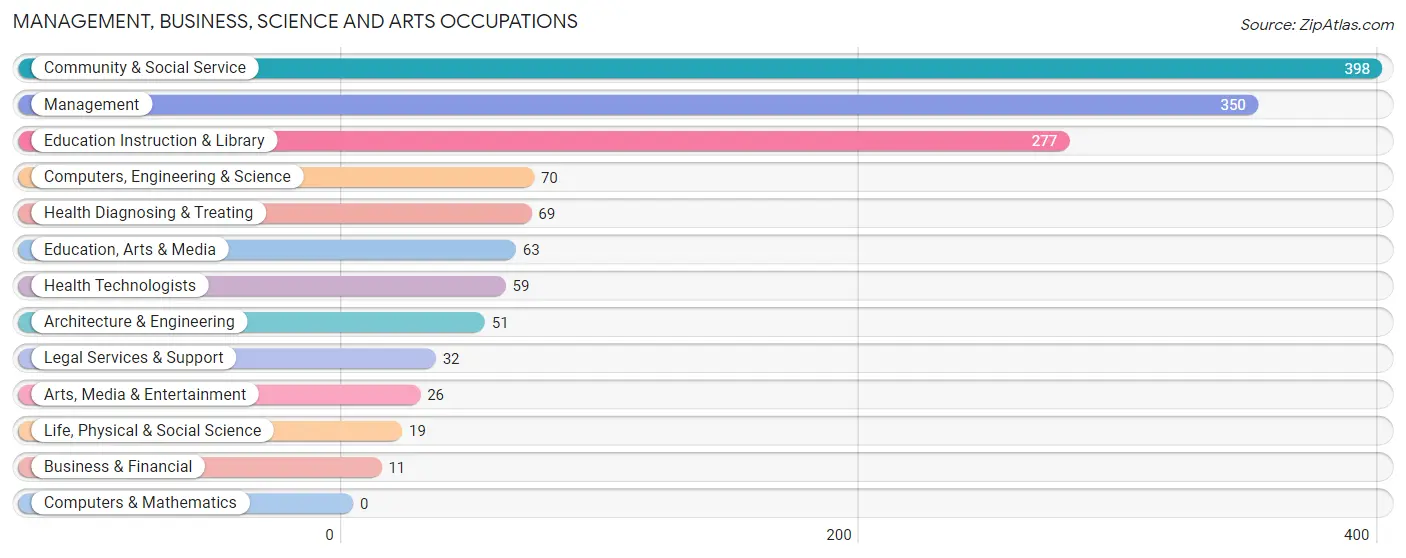
The most common Management, Business, Science and Arts occupations in Truth Or Consequences are Community & Social Service (398 | 18.9%), Management (350 | 16.6%), Education Instruction & Library (277 | 13.2%), Computers, Engineering & Science (70 | 3.3%), and Health Diagnosing & Treating (69 | 3.3%).
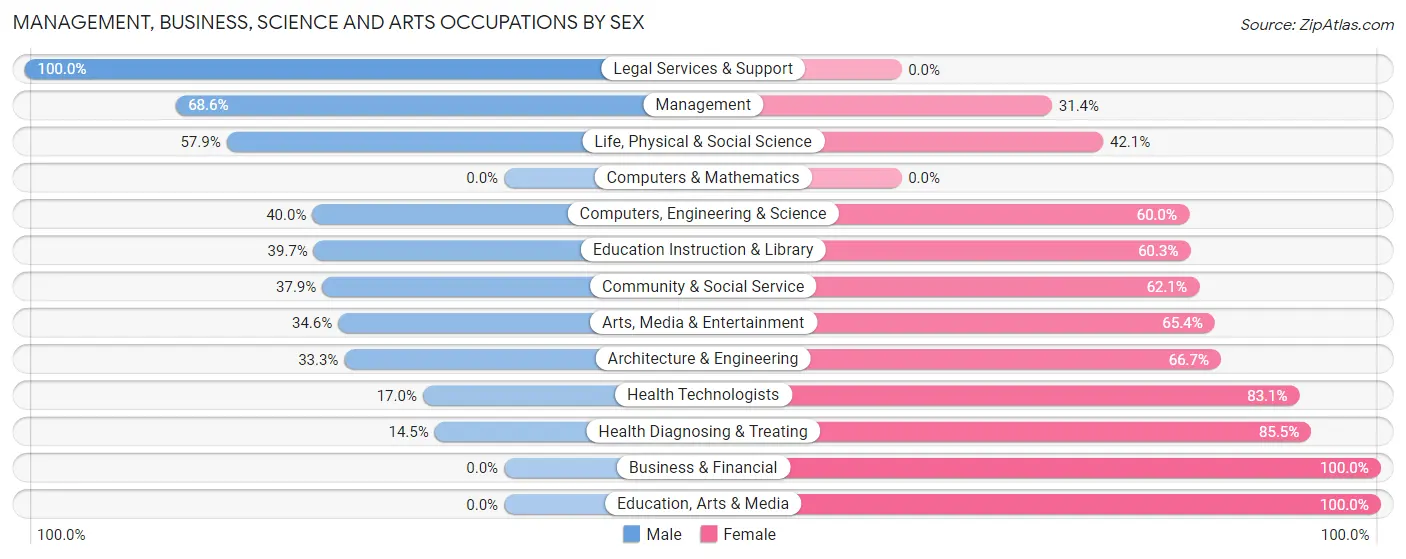
Management, Business, Science and Arts Occupations by Sex
Within the Management, Business, Science and Arts occupations in Truth Or Consequences, the most male-oriented occupations are Legal Services & Support (100.0%), Management (68.6%), and Life, Physical & Social Science (57.9%), while the most female-oriented occupations are Business & Financial (100.0%), Education, Arts & Media (100.0%), and Health Diagnosing & Treating (85.5%).
| Occupation | Male | Female |
| Management | 240 (68.6%) | 110 (31.4%) |
| Business & Financial | 0 (0.0%) | 11 (100.0%) |
| Computers, Engineering & Science | 28 (40.0%) | 42 (60.0%) |
| Computers & Mathematics | 0 (0.0%) | 0 (0.0%) |
| Architecture & Engineering | 17 (33.3%) | 34 (66.7%) |
| Life, Physical & Social Science | 11 (57.9%) | 8 (42.1%) |
| Community & Social Service | 151 (37.9%) | 247 (62.1%) |
| Education, Arts & Media | 0 (0.0%) | 63 (100.0%) |
| Legal Services & Support | 32 (100.0%) | 0 (0.0%) |
| Education Instruction & Library | 110 (39.7%) | 167 (60.3%) |
| Arts, Media & Entertainment | 9 (34.6%) | 17 (65.4%) |
| Health Diagnosing & Treating | 10 (14.5%) | 59 (85.5%) |
| Health Technologists | 10 (17.0%) | 49 (83.1%) |
| Total (Category) | 429 (47.8%) | 469 (52.2%) |
| Total (Overall) | 1,048 (49.8%) | 1,058 (50.2%) |
Services Occupations
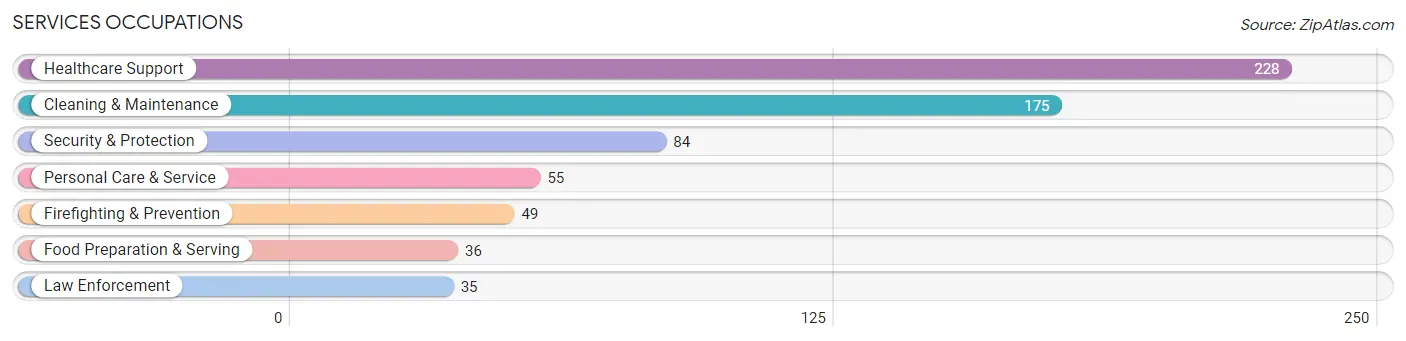
The most common Services occupations in Truth Or Consequences are Healthcare Support (228 | 10.8%), Cleaning & Maintenance (175 | 8.3%), Security & Protection (84 | 4.0%), Personal Care & Service (55 | 2.6%), and Firefighting & Prevention (49 | 2.3%).
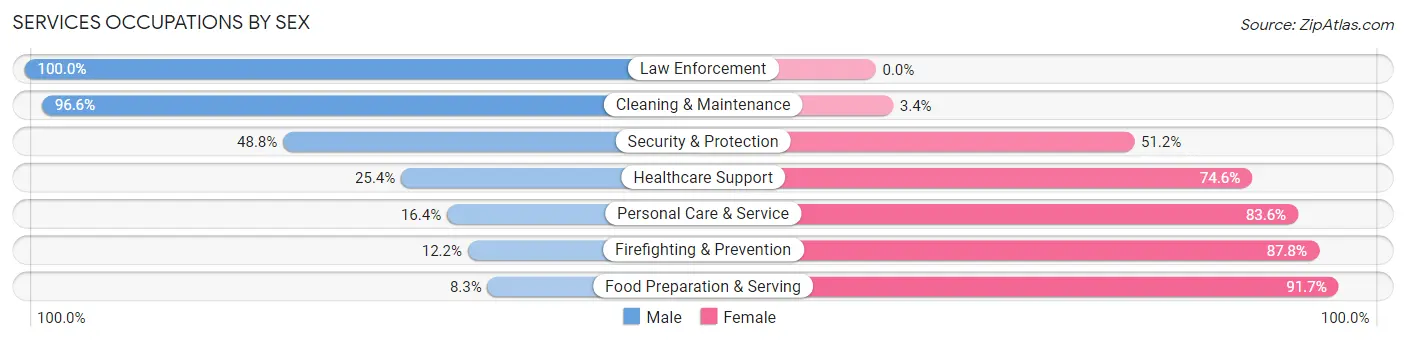
Services Occupations by Sex
Within the Services occupations in Truth Or Consequences, the most male-oriented occupations are Law Enforcement (100.0%), Cleaning & Maintenance (96.6%), and Security & Protection (48.8%), while the most female-oriented occupations are Food Preparation & Serving (91.7%), Firefighting & Prevention (87.8%), and Personal Care & Service (83.6%).
| Occupation | Male | Female |
| Healthcare Support | 58 (25.4%) | 170 (74.6%) |
| Security & Protection | 41 (48.8%) | 43 (51.2%) |
| Firefighting & Prevention | 6 (12.2%) | 43 (87.8%) |
| Law Enforcement | 35 (100.0%) | 0 (0.0%) |
| Food Preparation & Serving | 3 (8.3%) | 33 (91.7%) |
| Cleaning & Maintenance | 169 (96.6%) | 6 (3.4%) |
| Personal Care & Service | 9 (16.4%) | 46 (83.6%) |
| Total (Category) | 280 (48.4%) | 298 (51.6%) |
| Total (Overall) | 1,048 (49.8%) | 1,058 (50.2%) |
Sales and Office Occupations
The most common Sales and Office occupations in Truth Or Consequences are Sales & Related (273 | 13.0%), and Office & Administration (101 | 4.8%).

Sales and Office Occupations by Sex

| Occupation | Male | Female |
| Sales & Related | 146 (53.5%) | 127 (46.5%) |
| Office & Administration | 5 (5.0%) | 96 (95.1%) |
| Total (Category) | 151 (40.4%) | 223 (59.6%) |
| Total (Overall) | 1,048 (49.8%) | 1,058 (50.2%) |
Natural Resources, Construction and Maintenance Occupations
The most common Natural Resources, Construction and Maintenance occupations in Truth Or Consequences are Installation, Maintenance & Repair (51 | 2.4%), and Construction & Extraction (24 | 1.1%).
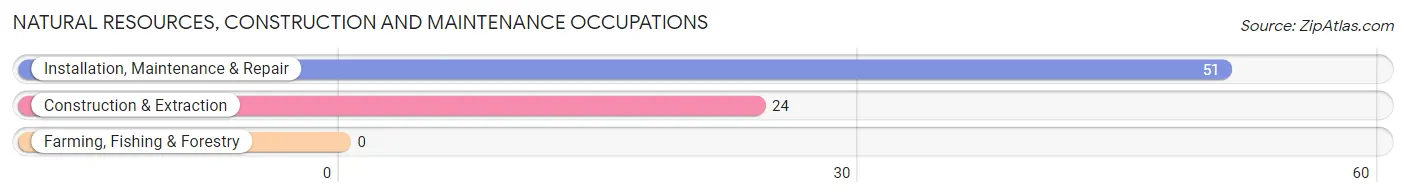
Natural Resources, Construction and Maintenance Occupations by Sex

| Occupation | Male | Female |
| Farming, Fishing & Forestry | 0 (0.0%) | 0 (0.0%) |
| Construction & Extraction | 24 (100.0%) | 0 (0.0%) |
| Installation, Maintenance & Repair | 51 (100.0%) | 0 (0.0%) |
| Total (Category) | 75 (100.0%) | 0 (0.0%) |
| Total (Overall) | 1,048 (49.8%) | 1,058 (50.2%) |
Production, Transportation and Moving Occupations
The most common Production, Transportation and Moving occupations in Truth Or Consequences are Material Moving (82 | 3.9%), Transportation (68 | 3.2%), and Production (31 | 1.5%).
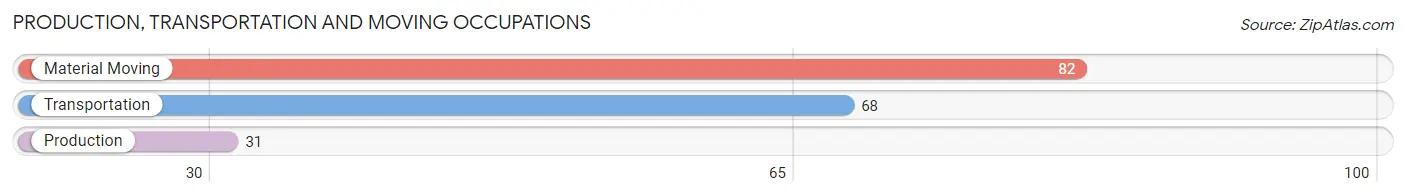
Production, Transportation and Moving Occupations by Sex
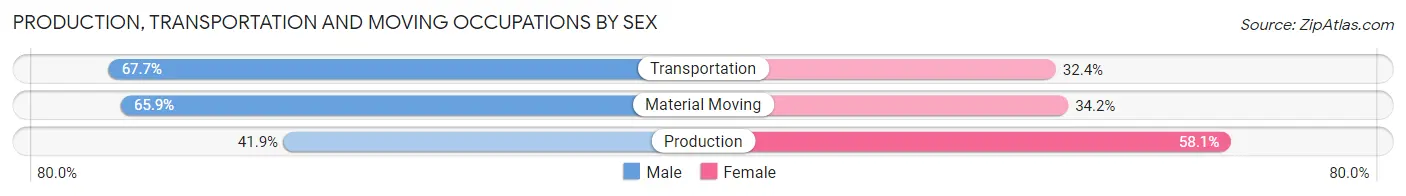
| Occupation | Male | Female |
| Production | 13 (41.9%) | 18 (58.1%) |
| Transportation | 46 (67.6%) | 22 (32.4%) |
| Material Moving | 54 (65.8%) | 28 (34.2%) |
| Total (Category) | 113 (62.4%) | 68 (37.6%) |
| Total (Overall) | 1,048 (49.8%) | 1,058 (50.2%) |
Employment Industries by Sex in Truth Or Consequences
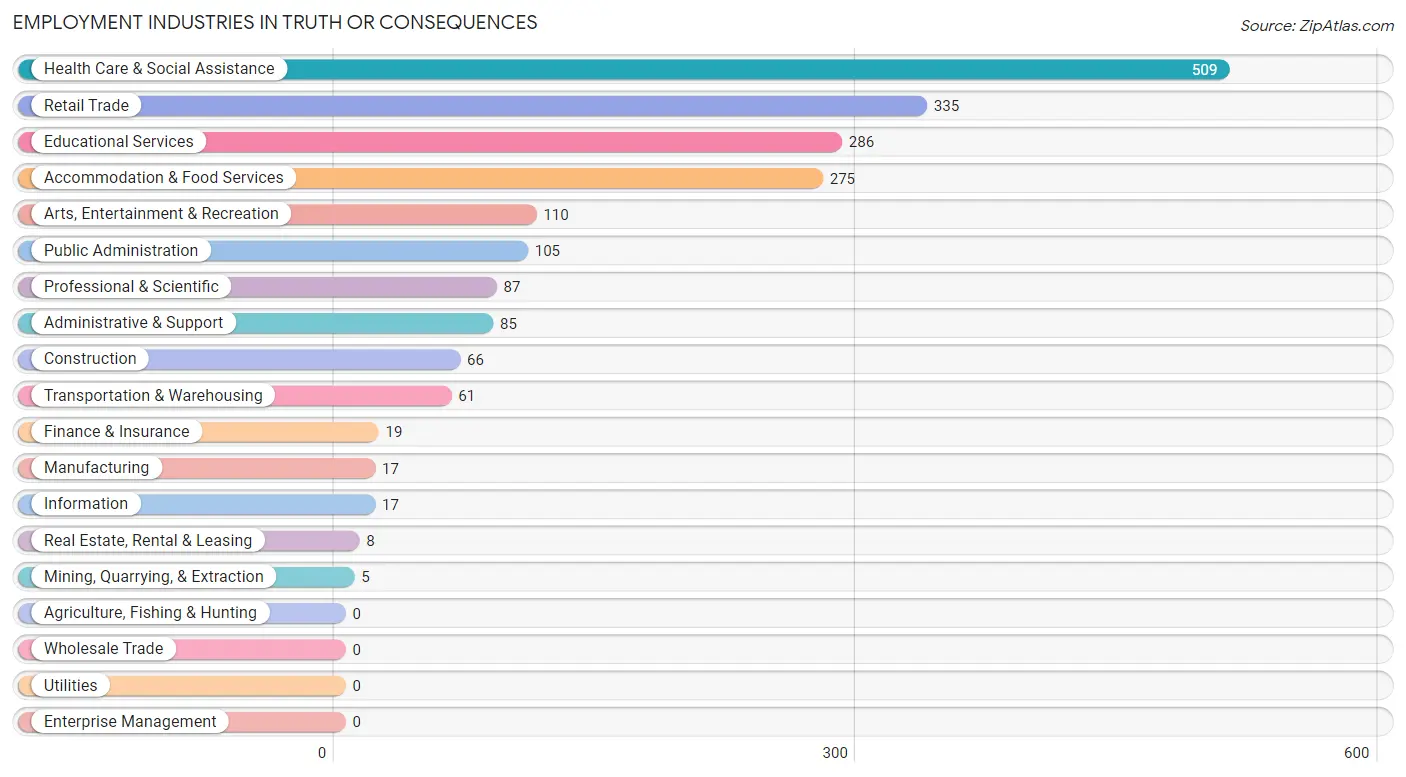
Employment Industries in Truth Or Consequences
The major employment industries in Truth Or Consequences include Health Care & Social Assistance (509 | 24.2%), Retail Trade (335 | 15.9%), Educational Services (286 | 13.6%), Accommodation & Food Services (275 | 13.1%), and Arts, Entertainment & Recreation (110 | 5.2%).
Employment Industries by Sex in Truth Or Consequences
The Truth Or Consequences industries that see more men than women are Mining, Quarrying, & Extraction (100.0%), Construction (100.0%), and Information (100.0%), whereas the industries that tend to have a higher number of women are Finance & Insurance (100.0%), Real Estate, Rental & Leasing (100.0%), and Health Care & Social Assistance (87.2%).
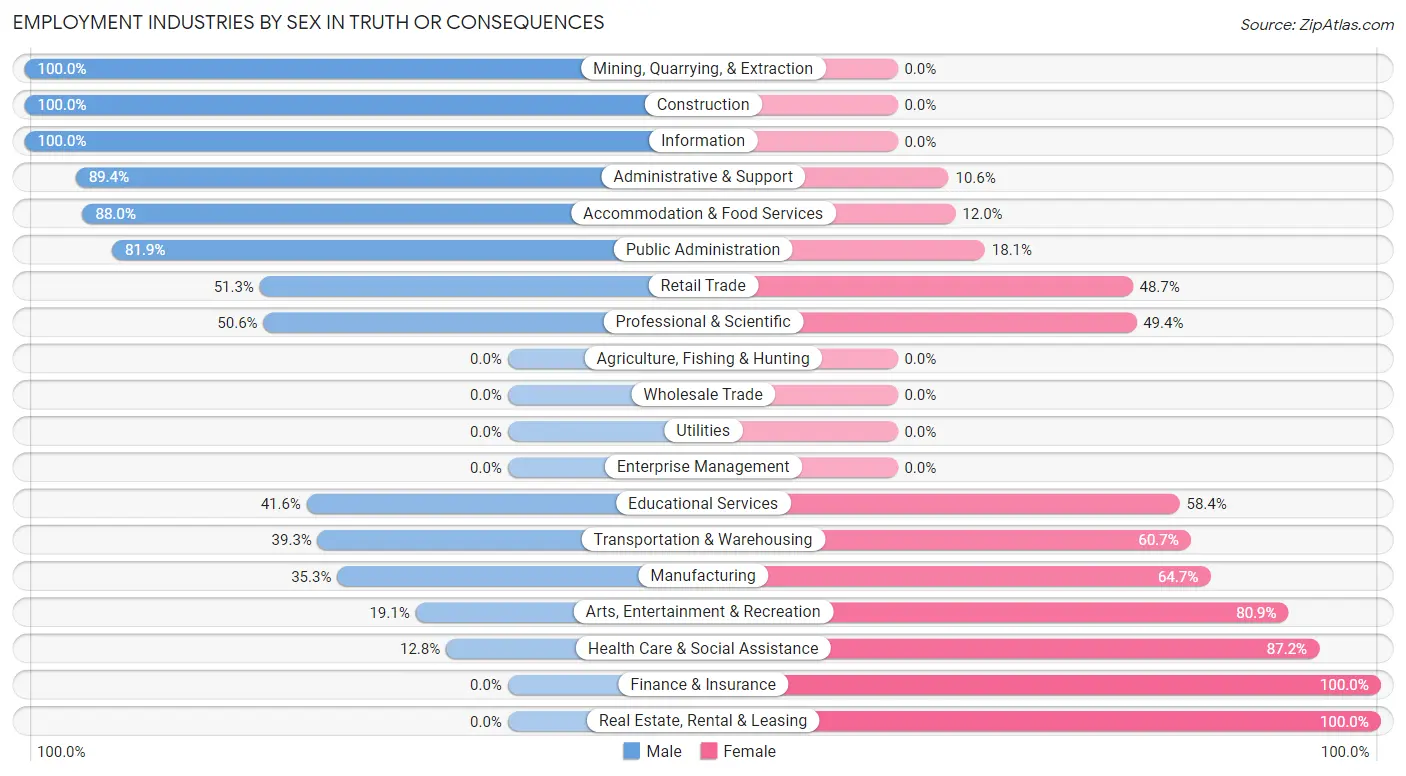
| Industry | Male | Female |
| Agriculture, Fishing & Hunting | 0 (0.0%) | 0 (0.0%) |
| Mining, Quarrying, & Extraction | 5 (100.0%) | 0 (0.0%) |
| Construction | 66 (100.0%) | 0 (0.0%) |
| Manufacturing | 6 (35.3%) | 11 (64.7%) |
| Wholesale Trade | 0 (0.0%) | 0 (0.0%) |
| Retail Trade | 172 (51.3%) | 163 (48.7%) |
| Transportation & Warehousing | 24 (39.3%) | 37 (60.7%) |
| Utilities | 0 (0.0%) | 0 (0.0%) |
| Information | 17 (100.0%) | 0 (0.0%) |
| Finance & Insurance | 0 (0.0%) | 19 (100.0%) |
| Real Estate, Rental & Leasing | 0 (0.0%) | 8 (100.0%) |
| Professional & Scientific | 44 (50.6%) | 43 (49.4%) |
| Enterprise Management | 0 (0.0%) | 0 (0.0%) |
| Administrative & Support | 76 (89.4%) | 9 (10.6%) |
| Educational Services | 119 (41.6%) | 167 (58.4%) |
| Health Care & Social Assistance | 65 (12.8%) | 444 (87.2%) |
| Arts, Entertainment & Recreation | 21 (19.1%) | 89 (80.9%) |
| Accommodation & Food Services | 242 (88.0%) | 33 (12.0%) |
| Public Administration | 86 (81.9%) | 19 (18.1%) |
| Total | 1,048 (49.8%) | 1,058 (50.2%) |
Education in Truth Or Consequences
School Enrollment in Truth Or Consequences
The most common levels of schooling among the 1,239 students in Truth Or Consequences are high school (514 | 41.5%), elementary school (267 | 21.5%), and middle school (241 | 19.5%).
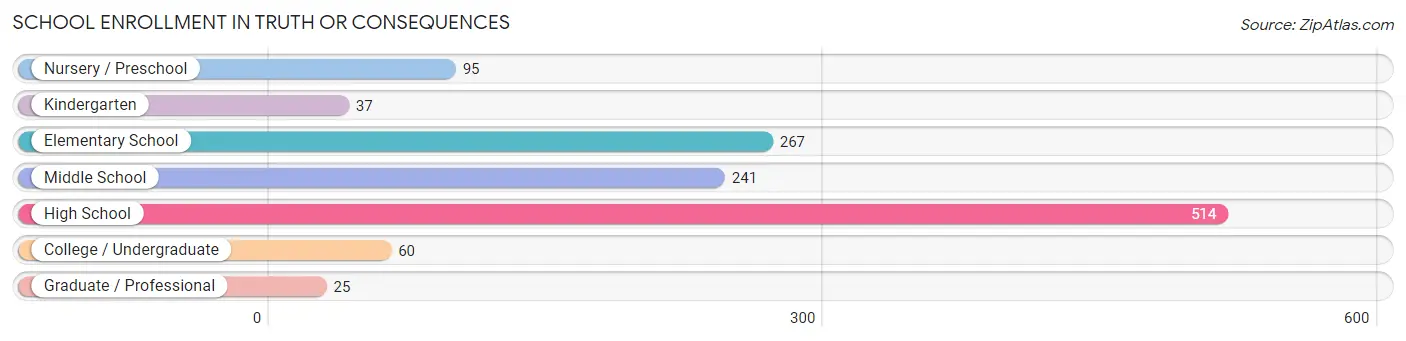
| School Level | # Students | % Students |
| Nursery / Preschool | 95 | 7.7% |
| Kindergarten | 37 | 3.0% |
| Elementary School | 267 | 21.5% |
| Middle School | 241 | 19.5% |
| High School | 514 | 41.5% |
| College / Undergraduate | 60 | 4.8% |
| Graduate / Professional | 25 | 2.0% |
| Total | 1,239 | 100.0% |
School Enrollment by Age by Funding Source in Truth Or Consequences
Out of a total of 1,239 students who are enrolled in schools in Truth Or Consequences, 375 (30.3%) attend a private institution, while the remaining 864 (69.7%) are enrolled in public schools. The age group of 15 to 17 year olds has the highest likelihood of being enrolled in private schools, with 220 (66.7% in the age bracket) enrolled. Conversely, the age group of 3 to 4 year olds has the lowest likelihood of being enrolled in a private school, with 80 (100.0% in the age bracket) attending a public institution.
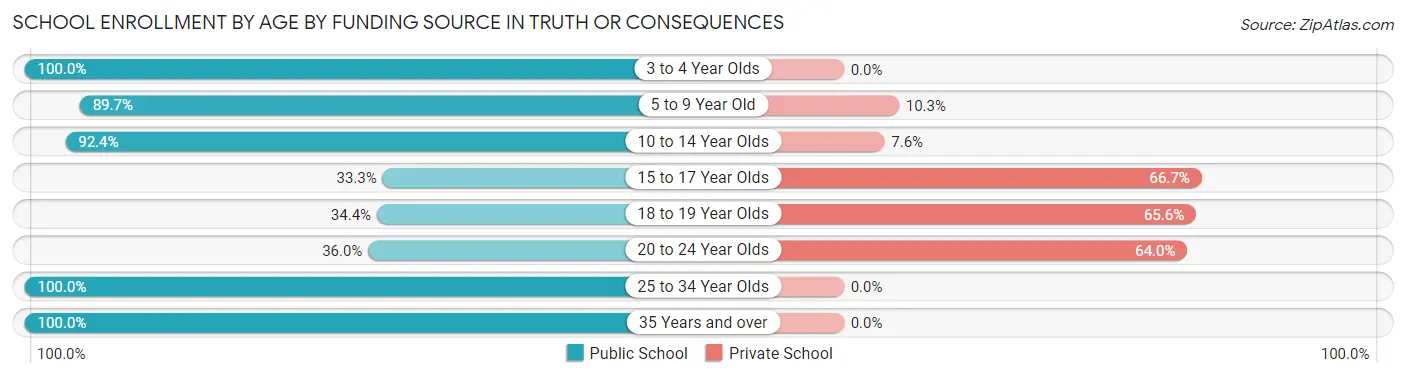
| Age Bracket | Public School | Private School |
| 3 to 4 Year Olds | 80 (100.0%) | 0 (0.0%) |
| 5 to 9 Year Old | 262 (89.7%) | 30 (10.3%) |
| 10 to 14 Year Olds | 317 (92.4%) | 26 (7.6%) |
| 15 to 17 Year Olds | 110 (33.3%) | 220 (66.7%) |
| 18 to 19 Year Olds | 44 (34.4%) | 84 (65.6%) |
| 20 to 24 Year Olds | 9 (36.0%) | 16 (64.0%) |
| 25 to 34 Year Olds | 9 (100.0%) | 0 (0.0%) |
| 35 Years and over | 32 (100.0%) | 0 (0.0%) |
| Total | 864 (69.7%) | 375 (30.3%) |
Educational Attainment by Field of Study in Truth Or Consequences
Education (276 | 24.4%), science & technology (193 | 17.1%), literature & languages (130 | 11.5%), psychology (103 | 9.1%), and arts & humanities (87 | 7.7%) are the most common fields of study among 1,130 individuals in Truth Or Consequences who have obtained a bachelor's degree or higher.
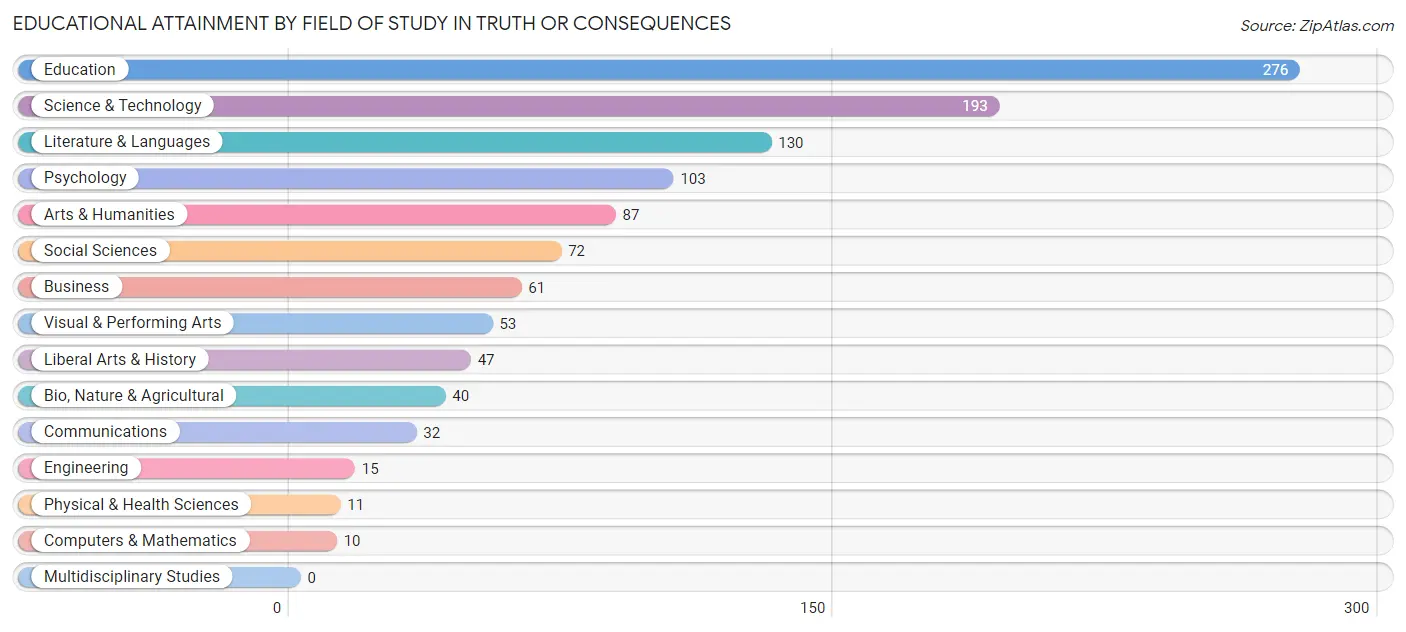
| Field of Study | # Graduates | % Graduates |
| Computers & Mathematics | 10 | 0.9% |
| Bio, Nature & Agricultural | 40 | 3.5% |
| Physical & Health Sciences | 11 | 1.0% |
| Psychology | 103 | 9.1% |
| Social Sciences | 72 | 6.4% |
| Engineering | 15 | 1.3% |
| Multidisciplinary Studies | 0 | 0.0% |
| Science & Technology | 193 | 17.1% |
| Business | 61 | 5.4% |
| Education | 276 | 24.4% |
| Literature & Languages | 130 | 11.5% |
| Liberal Arts & History | 47 | 4.2% |
| Visual & Performing Arts | 53 | 4.7% |
| Communications | 32 | 2.8% |
| Arts & Humanities | 87 | 7.7% |
| Total | 1,130 | 100.0% |
Transportation & Commute in Truth Or Consequences
Vehicle Availability by Sex in Truth Or Consequences
The most prevalent vehicle ownership categories in Truth Or Consequences are males with 2 vehicles (542, accounting for 51.7%) and females with 2 vehicles (520, making up 51.3%).
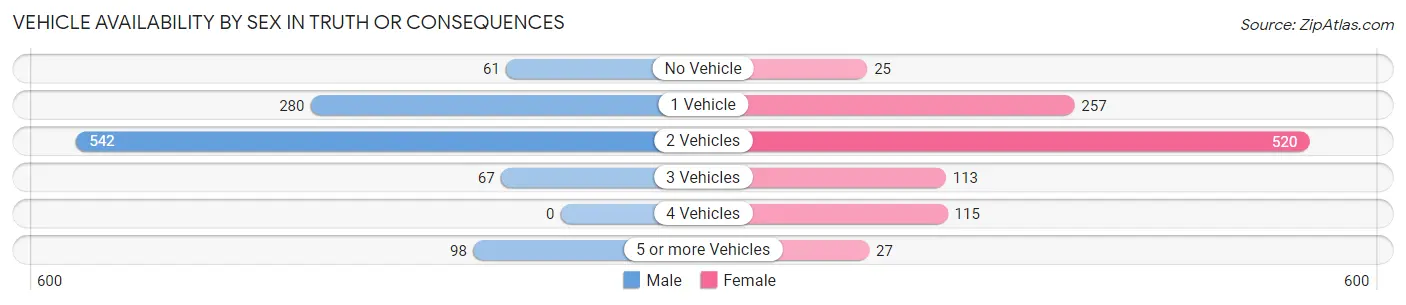
| Vehicles Available | Male | Female |
| No Vehicle | 61 (5.8%) | 25 (2.4%) |
| 1 Vehicle | 280 (26.7%) | 257 (24.3%) |
| 2 Vehicles | 542 (51.7%) | 520 (49.2%) |
| 3 Vehicles | 67 (6.4%) | 113 (10.7%) |
| 4 Vehicles | 0 (0.0%) | 115 (10.9%) |
| 5 or more Vehicles | 98 (9.3%) | 27 (2.5%) |
| Total | 1,048 (100.0%) | 1,057 (100.0%) |
Commute Time in Truth Or Consequences
The most frequently occuring commute durations in Truth Or Consequences are 5 to 9 minutes (675 commuters, 34.0%), 10 to 14 minutes (435 commuters, 21.9%), and less than 5 minutes (352 commuters, 17.7%).
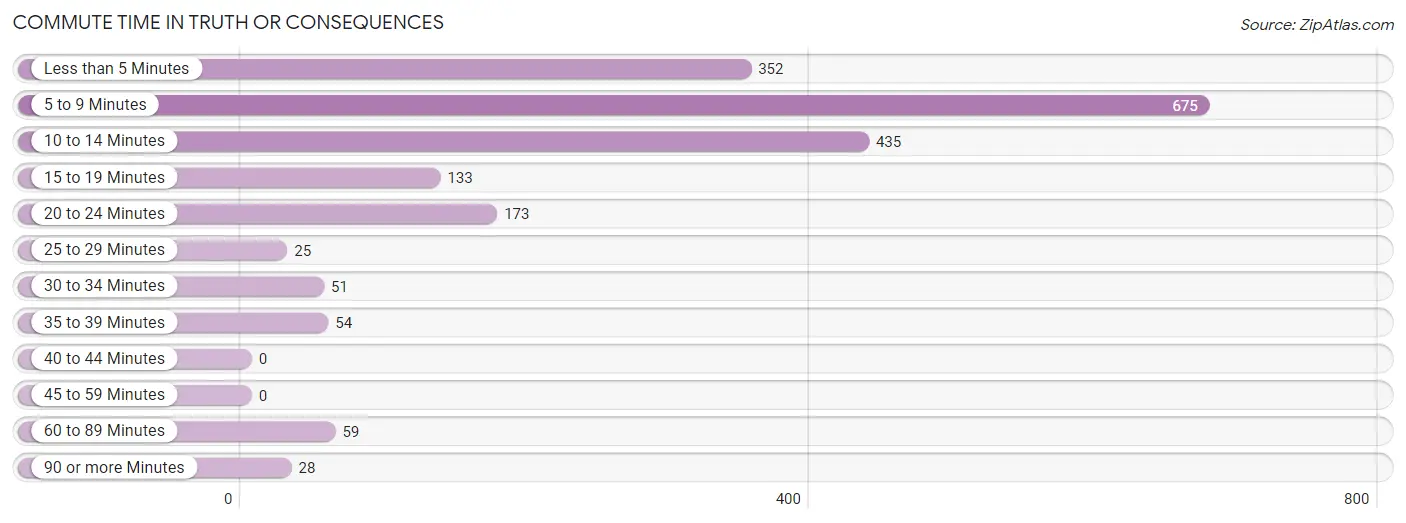
| Commute Time | # Commuters | % Commuters |
| Less than 5 Minutes | 352 | 17.7% |
| 5 to 9 Minutes | 675 | 34.0% |
| 10 to 14 Minutes | 435 | 21.9% |
| 15 to 19 Minutes | 133 | 6.7% |
| 20 to 24 Minutes | 173 | 8.7% |
| 25 to 29 Minutes | 25 | 1.3% |
| 30 to 34 Minutes | 51 | 2.6% |
| 35 to 39 Minutes | 54 | 2.7% |
| 40 to 44 Minutes | 0 | 0.0% |
| 45 to 59 Minutes | 0 | 0.0% |
| 60 to 89 Minutes | 59 | 3.0% |
| 90 or more Minutes | 28 | 1.4% |
Commute Time by Sex in Truth Or Consequences
The most common commute times in Truth Or Consequences are 10 to 14 minutes (322 commuters, 32.2%) for males and 5 to 9 minutes (485 commuters, 49.2%) for females.
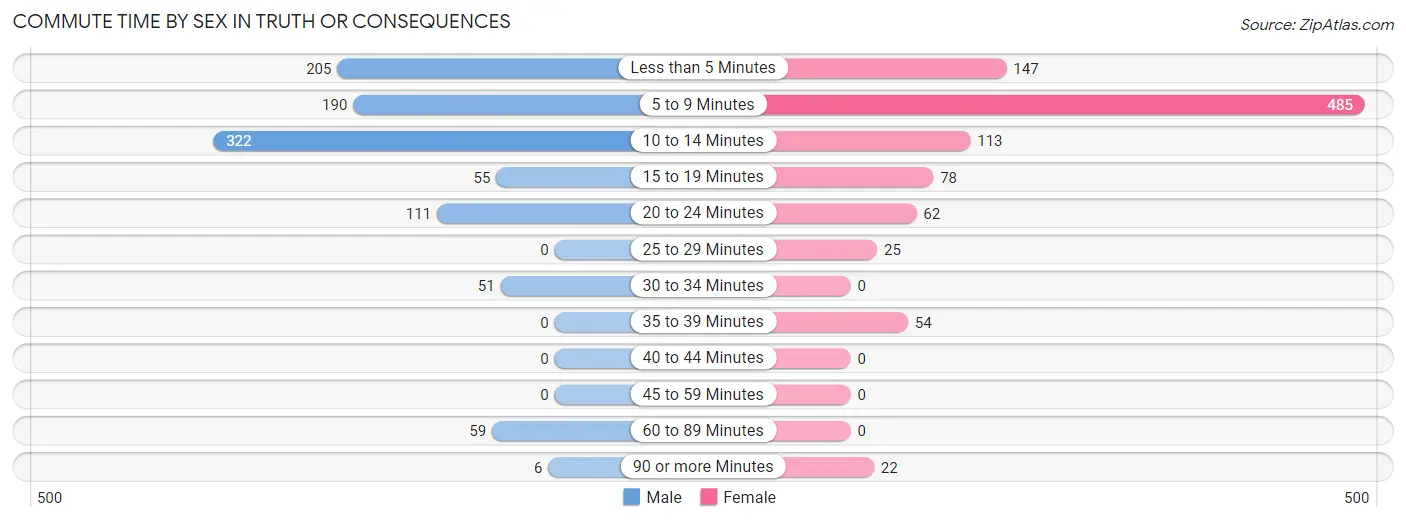
| Commute Time | Male | Female |
| Less than 5 Minutes | 205 (20.5%) | 147 (14.9%) |
| 5 to 9 Minutes | 190 (19.0%) | 485 (49.2%) |
| 10 to 14 Minutes | 322 (32.2%) | 113 (11.5%) |
| 15 to 19 Minutes | 55 (5.5%) | 78 (7.9%) |
| 20 to 24 Minutes | 111 (11.1%) | 62 (6.3%) |
| 25 to 29 Minutes | 0 (0.0%) | 25 (2.5%) |
| 30 to 34 Minutes | 51 (5.1%) | 0 (0.0%) |
| 35 to 39 Minutes | 0 (0.0%) | 54 (5.5%) |
| 40 to 44 Minutes | 0 (0.0%) | 0 (0.0%) |
| 45 to 59 Minutes | 0 (0.0%) | 0 (0.0%) |
| 60 to 89 Minutes | 59 (5.9%) | 0 (0.0%) |
| 90 or more Minutes | 6 (0.6%) | 22 (2.2%) |
Time of Departure to Work by Sex in Truth Or Consequences
The most frequent times of departure to work in Truth Or Consequences are 7:00 AM to 7:29 AM (232, 23.2%) for males and 7:30 AM to 7:59 AM (358, 36.3%) for females.
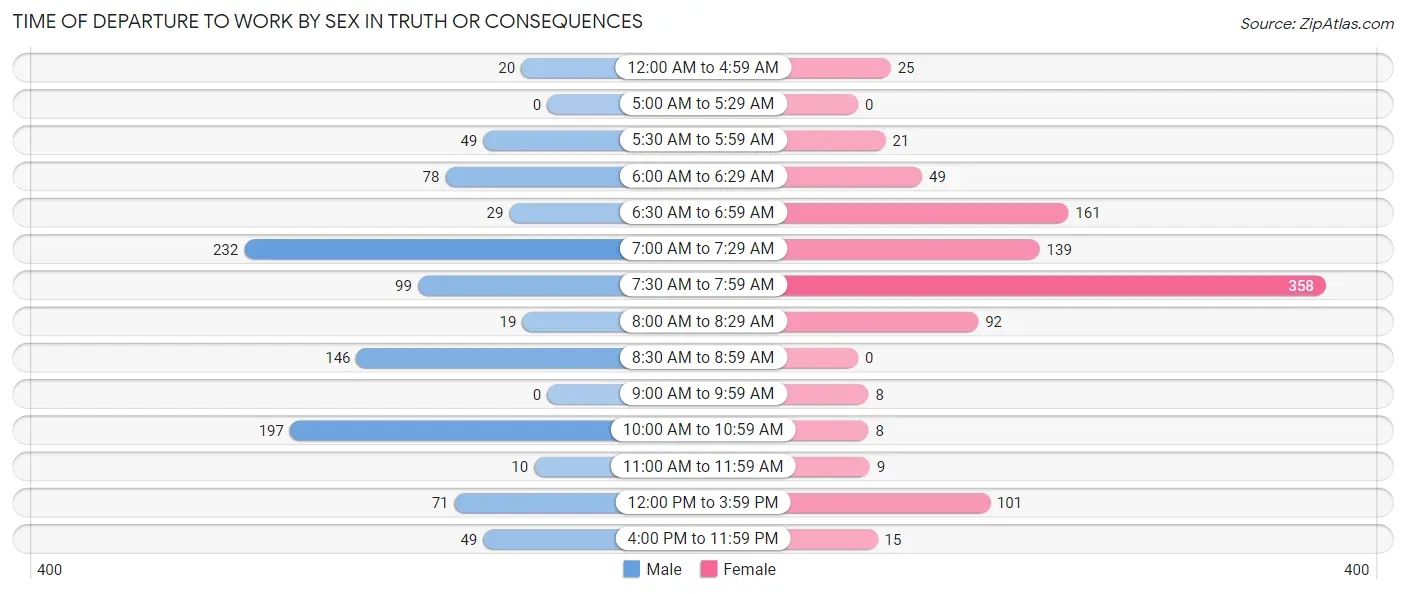
| Time of Departure | Male | Female |
| 12:00 AM to 4:59 AM | 20 (2.0%) | 25 (2.5%) |
| 5:00 AM to 5:29 AM | 0 (0.0%) | 0 (0.0%) |
| 5:30 AM to 5:59 AM | 49 (4.9%) | 21 (2.1%) |
| 6:00 AM to 6:29 AM | 78 (7.8%) | 49 (5.0%) |
| 6:30 AM to 6:59 AM | 29 (2.9%) | 161 (16.3%) |
| 7:00 AM to 7:29 AM | 232 (23.2%) | 139 (14.1%) |
| 7:30 AM to 7:59 AM | 99 (9.9%) | 358 (36.3%) |
| 8:00 AM to 8:29 AM | 19 (1.9%) | 92 (9.3%) |
| 8:30 AM to 8:59 AM | 146 (14.6%) | 0 (0.0%) |
| 9:00 AM to 9:59 AM | 0 (0.0%) | 8 (0.8%) |
| 10:00 AM to 10:59 AM | 197 (19.7%) | 8 (0.8%) |
| 11:00 AM to 11:59 AM | 10 (1.0%) | 9 (0.9%) |
| 12:00 PM to 3:59 PM | 71 (7.1%) | 101 (10.2%) |
| 4:00 PM to 11:59 PM | 49 (4.9%) | 15 (1.5%) |
| Total | 999 (100.0%) | 986 (100.0%) |
Housing Occupancy in Truth Or Consequences
Occupancy by Ownership in Truth Or Consequences
Of the total 2,545 dwellings in Truth Or Consequences, owner-occupied units account for 1,579 (62.0%), while renter-occupied units make up 966 (38.0%).
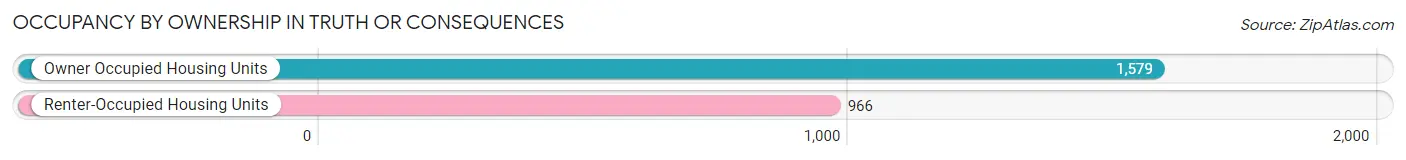
| Occupancy | # Housing Units | % Housing Units |
| Owner Occupied Housing Units | 1,579 | 62.0% |
| Renter-Occupied Housing Units | 966 | 38.0% |
| Total Occupied Housing Units | 2,545 | 100.0% |
Occupancy by Household Size in Truth Or Consequences
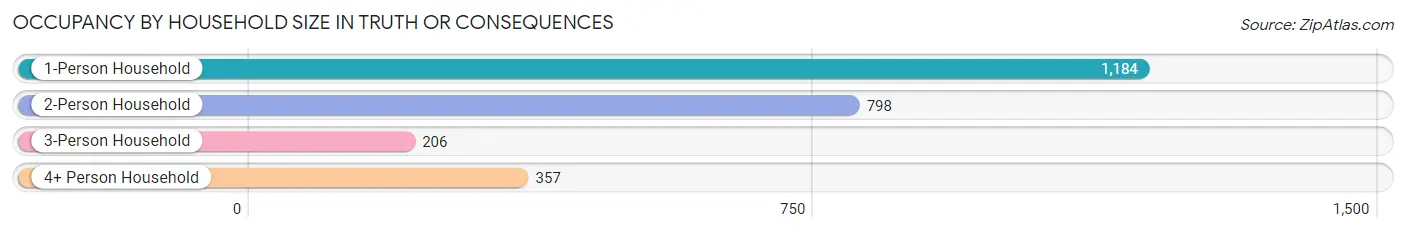
| Household Size | # Housing Units | % Housing Units |
| 1-Person Household | 1,184 | 46.5% |
| 2-Person Household | 798 | 31.4% |
| 3-Person Household | 206 | 8.1% |
| 4+ Person Household | 357 | 14.0% |
| Total Housing Units | 2,545 | 100.0% |
Occupancy by Ownership by Household Size in Truth Or Consequences
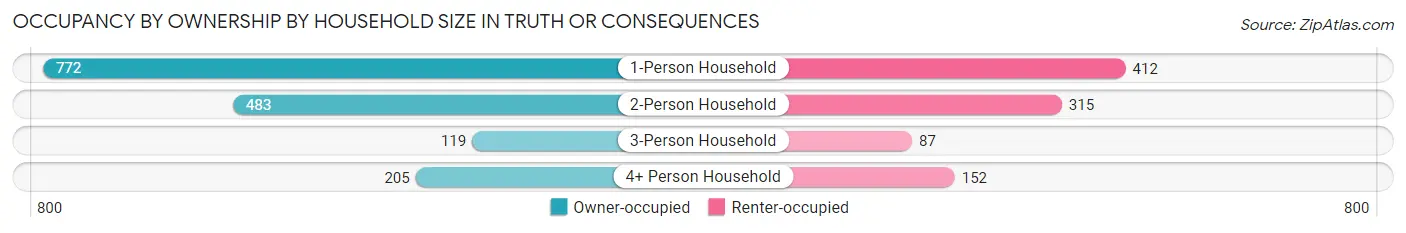
| Household Size | Owner-occupied | Renter-occupied |
| 1-Person Household | 772 (65.2%) | 412 (34.8%) |
| 2-Person Household | 483 (60.5%) | 315 (39.5%) |
| 3-Person Household | 119 (57.8%) | 87 (42.2%) |
| 4+ Person Household | 205 (57.4%) | 152 (42.6%) |
| Total Housing Units | 1,579 (62.0%) | 966 (38.0%) |
Occupancy by Educational Attainment in Truth Or Consequences
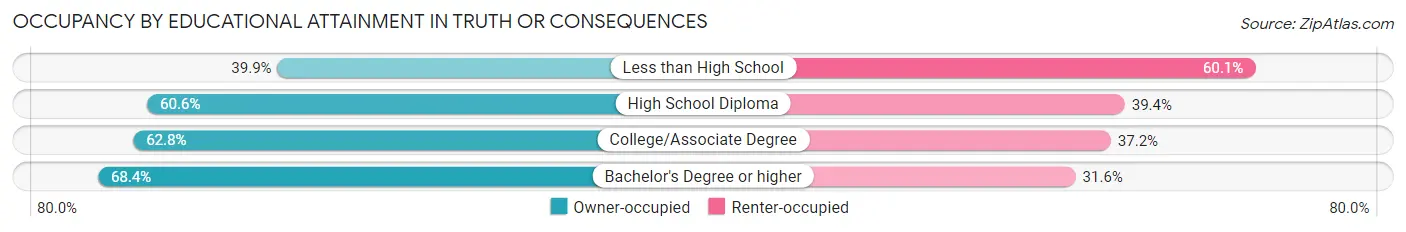
| Household Size | Owner-occupied | Renter-occupied |
| Less than High School | 83 (39.9%) | 125 (60.1%) |
| High School Diploma | 381 (60.6%) | 248 (39.4%) |
| College/Associate Degree | 590 (62.8%) | 350 (37.2%) |
| Bachelor's Degree or higher | 525 (68.4%) | 243 (31.6%) |
Occupancy by Age of Householder in Truth Or Consequences
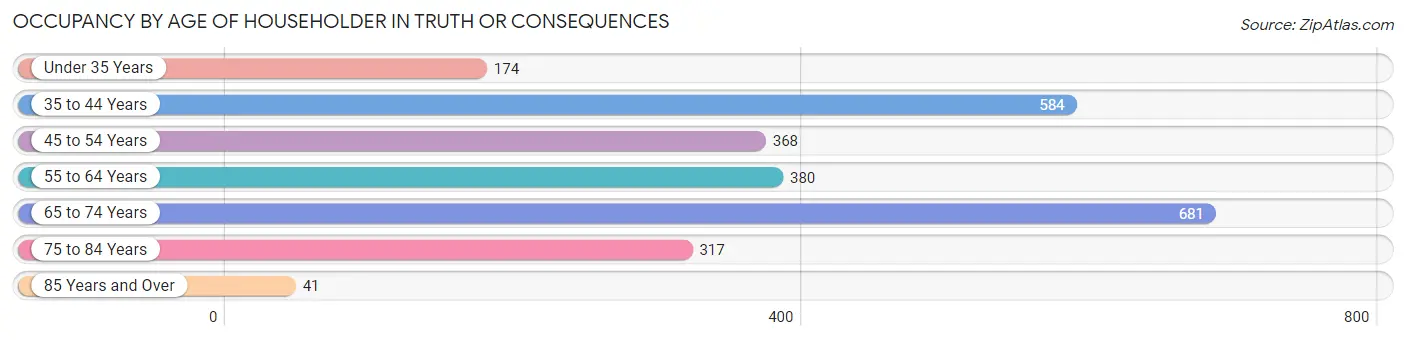
| Age Bracket | # Households | % Households |
| Under 35 Years | 174 | 6.8% |
| 35 to 44 Years | 584 | 23.0% |
| 45 to 54 Years | 368 | 14.5% |
| 55 to 64 Years | 380 | 14.9% |
| 65 to 74 Years | 681 | 26.8% |
| 75 to 84 Years | 317 | 12.5% |
| 85 Years and Over | 41 | 1.6% |
| Total | 2,545 | 100.0% |
Housing Finances in Truth Or Consequences
Median Income by Occupancy in Truth Or Consequences
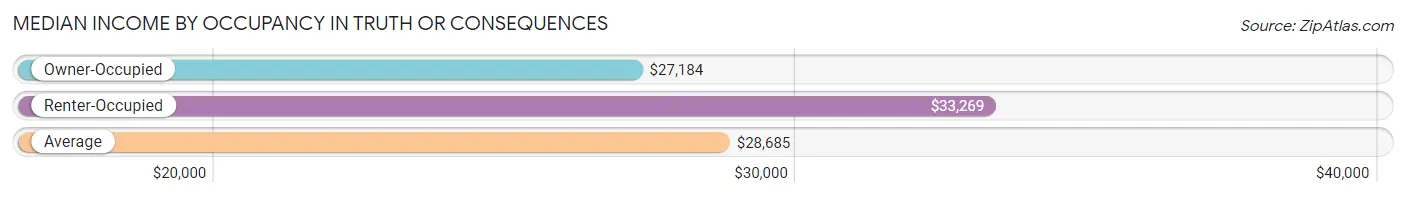
| Occupancy Type | # Households | Median Income |
| Owner-Occupied | 1,579 (62.0%) | $27,184 |
| Renter-Occupied | 966 (38.0%) | $33,269 |
| Average | 2,545 (100.0%) | $28,685 |
Occupancy by Householder Income Bracket in Truth Or Consequences
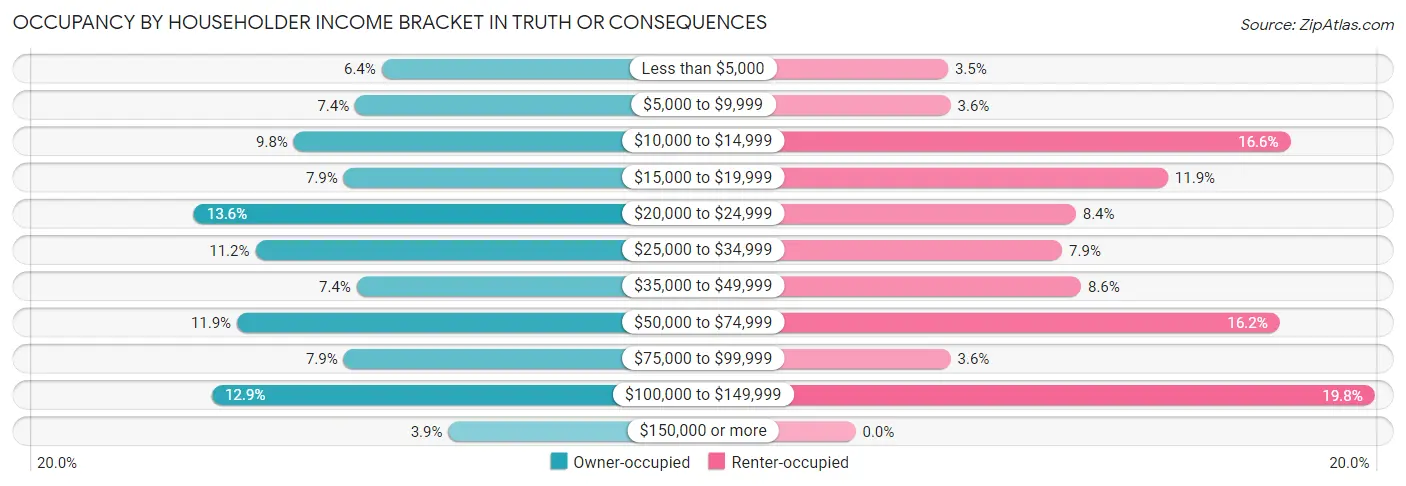
| Income Bracket | Owner-occupied | Renter-occupied |
| Less than $5,000 | 101 (6.4%) | 34 (3.5%) |
| $5,000 to $9,999 | 117 (7.4%) | 35 (3.6%) |
| $10,000 to $14,999 | 154 (9.8%) | 160 (16.6%) |
| $15,000 to $19,999 | 124 (7.9%) | 115 (11.9%) |
| $20,000 to $24,999 | 214 (13.6%) | 81 (8.4%) |
| $25,000 to $34,999 | 177 (11.2%) | 76 (7.9%) |
| $35,000 to $49,999 | 116 (7.3%) | 83 (8.6%) |
| $50,000 to $74,999 | 188 (11.9%) | 156 (16.2%) |
| $75,000 to $99,999 | 124 (7.9%) | 35 (3.6%) |
| $100,000 to $149,999 | 203 (12.9%) | 191 (19.8%) |
| $150,000 or more | 61 (3.9%) | 0 (0.0%) |
| Total | 1,579 (100.0%) | 966 (100.0%) |
Monthly Housing Cost Tiers in Truth Or Consequences
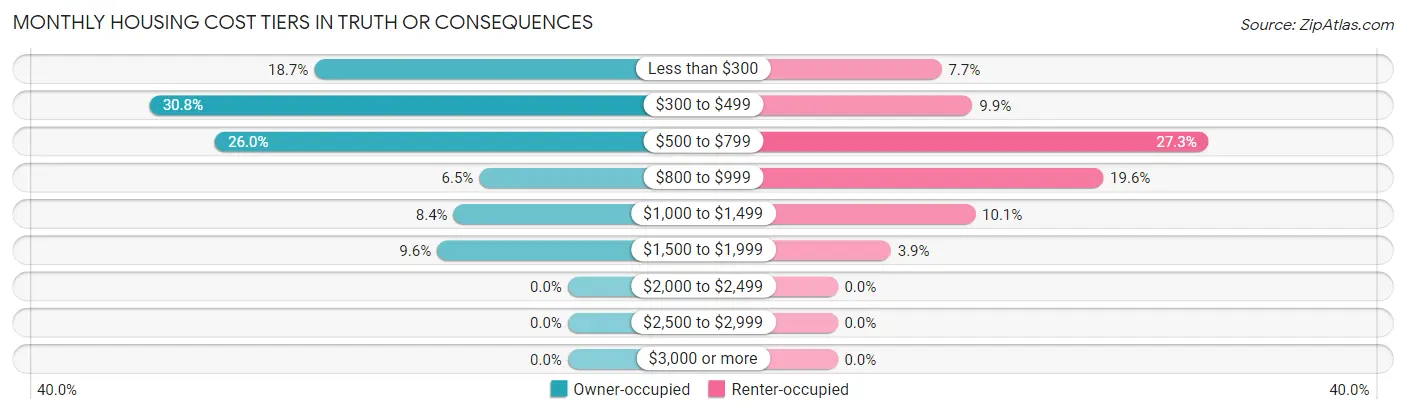
| Monthly Cost | Owner-occupied | Renter-occupied |
| Less than $300 | 295 (18.7%) | 74 (7.7%) |
| $300 to $499 | 486 (30.8%) | 96 (9.9%) |
| $500 to $799 | 410 (26.0%) | 264 (27.3%) |
| $800 to $999 | 103 (6.5%) | 189 (19.6%) |
| $1,000 to $1,499 | 133 (8.4%) | 98 (10.1%) |
| $1,500 to $1,999 | 152 (9.6%) | 38 (3.9%) |
| $2,000 to $2,499 | 0 (0.0%) | 0 (0.0%) |
| $2,500 to $2,999 | 0 (0.0%) | 0 (0.0%) |
| $3,000 or more | 0 (0.0%) | 0 (0.0%) |
| Total | 1,579 (100.0%) | 966 (100.0%) |
Physical Housing Characteristics in Truth Or Consequences
Housing Structures in Truth Or Consequences
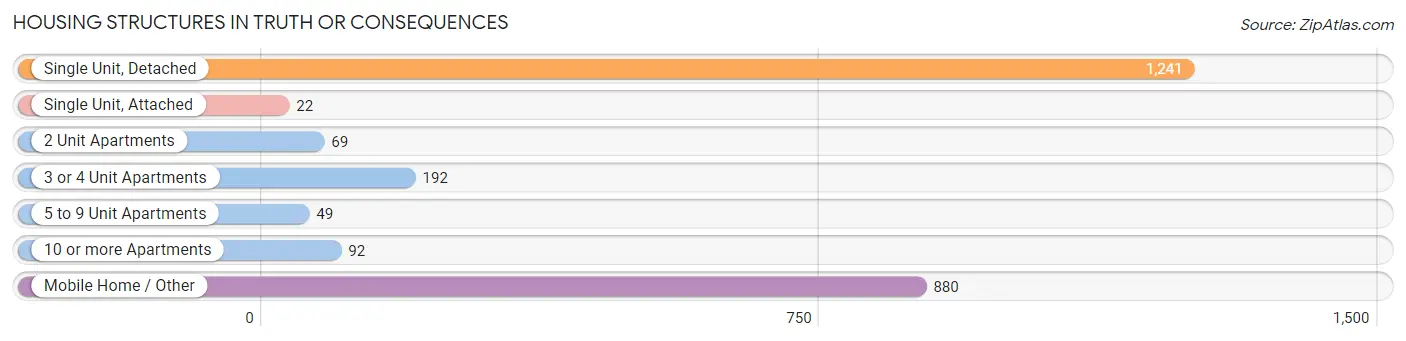
| Structure Type | # Housing Units | % Housing Units |
| Single Unit, Detached | 1,241 | 48.8% |
| Single Unit, Attached | 22 | 0.9% |
| 2 Unit Apartments | 69 | 2.7% |
| 3 or 4 Unit Apartments | 192 | 7.5% |
| 5 to 9 Unit Apartments | 49 | 1.9% |
| 10 or more Apartments | 92 | 3.6% |
| Mobile Home / Other | 880 | 34.6% |
| Total | 2,545 | 100.0% |
Housing Structures by Occupancy in Truth Or Consequences
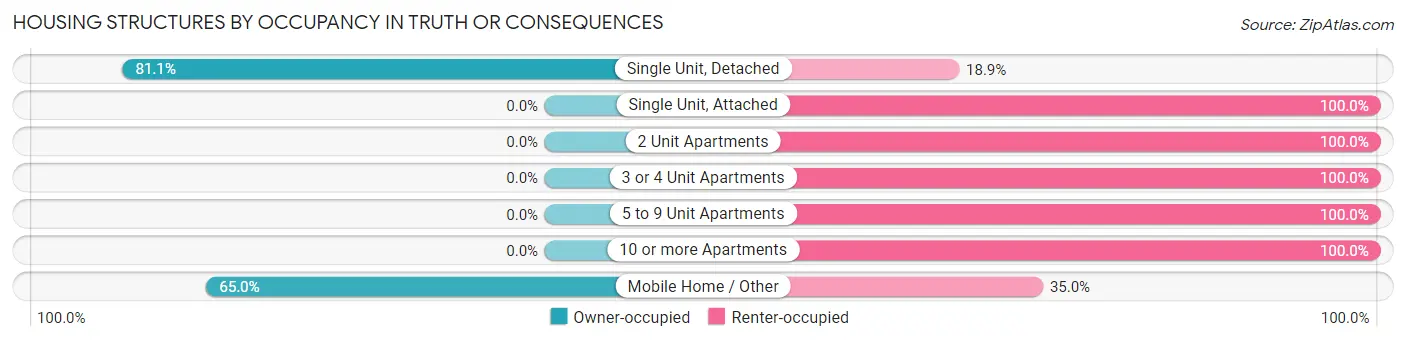
| Structure Type | Owner-occupied | Renter-occupied |
| Single Unit, Detached | 1,007 (81.1%) | 234 (18.9%) |
| Single Unit, Attached | 0 (0.0%) | 22 (100.0%) |
| 2 Unit Apartments | 0 (0.0%) | 69 (100.0%) |
| 3 or 4 Unit Apartments | 0 (0.0%) | 192 (100.0%) |
| 5 to 9 Unit Apartments | 0 (0.0%) | 49 (100.0%) |
| 10 or more Apartments | 0 (0.0%) | 92 (100.0%) |
| Mobile Home / Other | 572 (65.0%) | 308 (35.0%) |
| Total | 1,579 (62.0%) | 966 (38.0%) |
Housing Structures by Number of Rooms in Truth Or Consequences
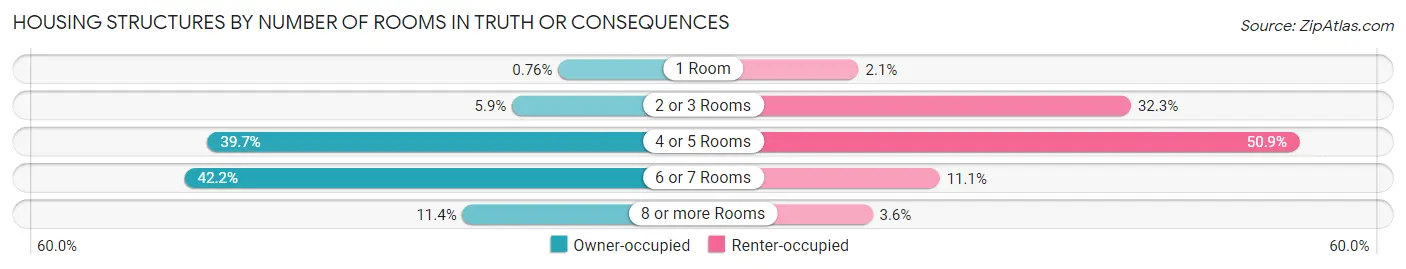
| Number of Rooms | Owner-occupied | Renter-occupied |
| 1 Room | 12 (0.8%) | 20 (2.1%) |
| 2 or 3 Rooms | 93 (5.9%) | 312 (32.3%) |
| 4 or 5 Rooms | 627 (39.7%) | 492 (50.9%) |
| 6 or 7 Rooms | 667 (42.2%) | 107 (11.1%) |
| 8 or more Rooms | 180 (11.4%) | 35 (3.6%) |
| Total | 1,579 (100.0%) | 966 (100.0%) |
Housing Structure by Heating Type in Truth Or Consequences
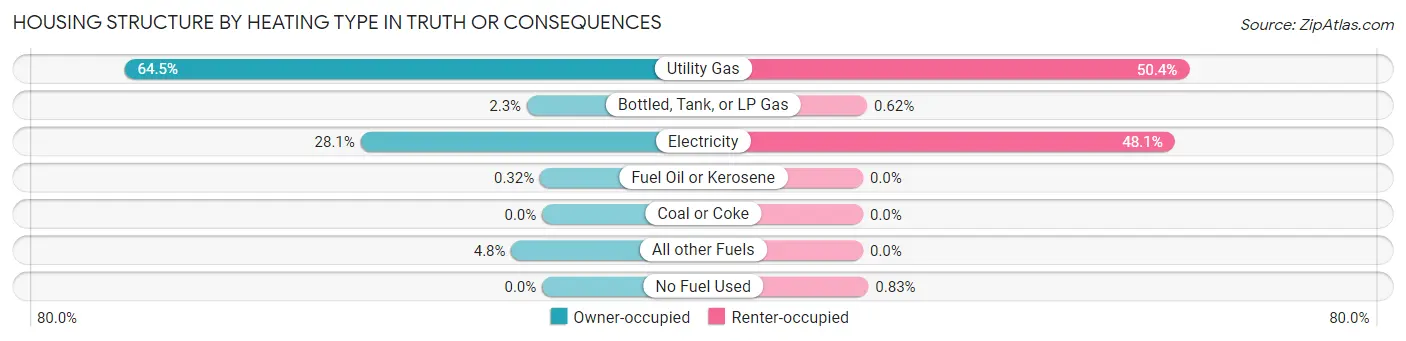
| Heating Type | Owner-occupied | Renter-occupied |
| Utility Gas | 1,019 (64.5%) | 487 (50.4%) |
| Bottled, Tank, or LP Gas | 37 (2.3%) | 6 (0.6%) |
| Electricity | 443 (28.1%) | 465 (48.1%) |
| Fuel Oil or Kerosene | 5 (0.3%) | 0 (0.0%) |
| Coal or Coke | 0 (0.0%) | 0 (0.0%) |
| All other Fuels | 75 (4.8%) | 0 (0.0%) |
| No Fuel Used | 0 (0.0%) | 8 (0.8%) |
| Total | 1,579 (100.0%) | 966 (100.0%) |
Household Vehicle Usage in Truth Or Consequences
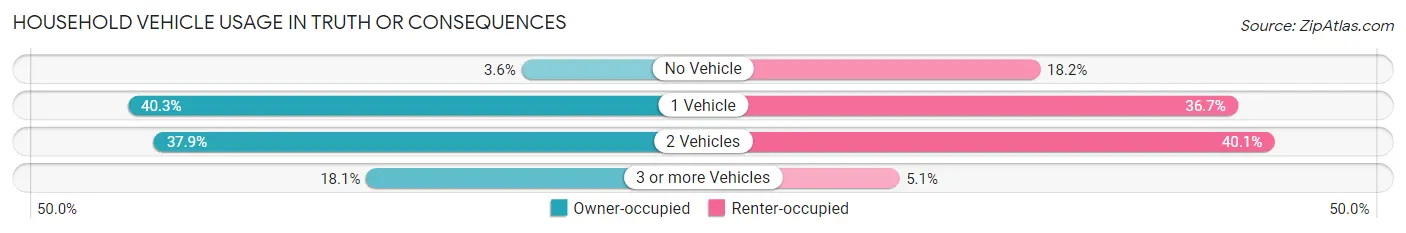
| Vehicles per Household | Owner-occupied | Renter-occupied |
| No Vehicle | 57 (3.6%) | 176 (18.2%) |
| 1 Vehicle | 637 (40.3%) | 354 (36.6%) |
| 2 Vehicles | 599 (37.9%) | 387 (40.1%) |
| 3 or more Vehicles | 286 (18.1%) | 49 (5.1%) |
| Total | 1,579 (100.0%) | 966 (100.0%) |
Real Estate & Mortgages in Truth Or Consequences
Real Estate and Mortgage Overview in Truth Or Consequences
| Characteristic | Without Mortgage | With Mortgage |
| Housing Units | 812 | 767 |
| Median Property Value | $92,300 | $119,400 |
| Median Household Income | $26,400 | $57 |
| Monthly Housing Costs | $328 | $0 |
| Real Estate Taxes | $524 | $9 |
Property Value by Mortgage Status in Truth Or Consequences
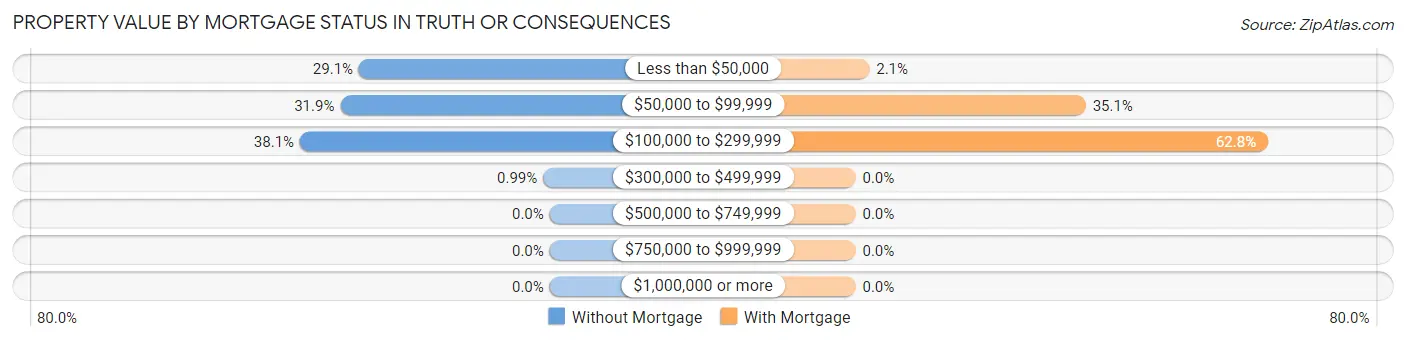
| Property Value | Without Mortgage | With Mortgage |
| Less than $50,000 | 236 (29.1%) | 16 (2.1%) |
| $50,000 to $99,999 | 259 (31.9%) | 269 (35.1%) |
| $100,000 to $299,999 | 309 (38.1%) | 482 (62.8%) |
| $300,000 to $499,999 | 8 (1.0%) | 0 (0.0%) |
| $500,000 to $749,999 | 0 (0.0%) | 0 (0.0%) |
| $750,000 to $999,999 | 0 (0.0%) | 0 (0.0%) |
| $1,000,000 or more | 0 (0.0%) | 0 (0.0%) |
| Total | 812 (100.0%) | 767 (100.0%) |
Household Income by Mortgage Status in Truth Or Consequences
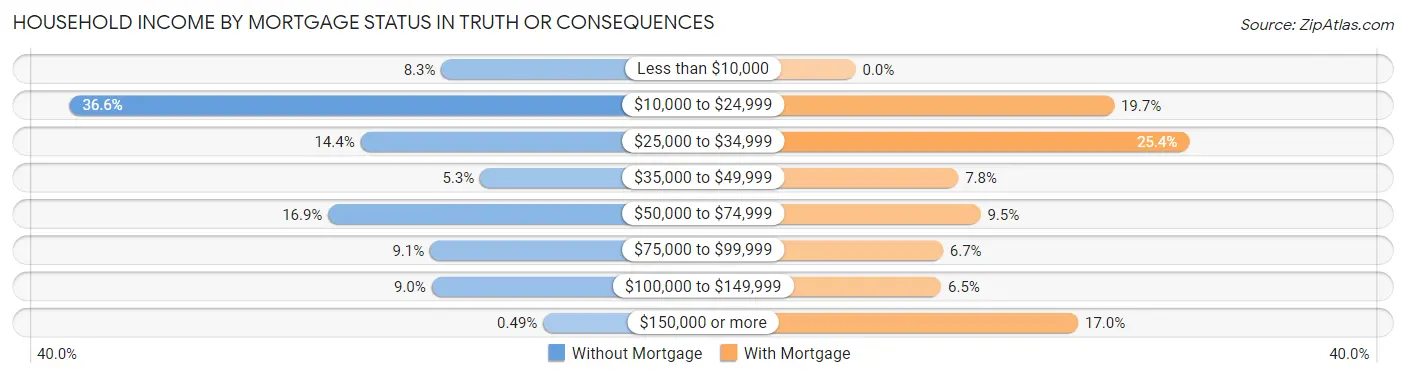
| Household Income | Without Mortgage | With Mortgage |
| Less than $10,000 | 67 (8.3%) | 0 (0.0%) |
| $10,000 to $24,999 | 297 (36.6%) | 151 (19.7%) |
| $25,000 to $34,999 | 117 (14.4%) | 195 (25.4%) |
| $35,000 to $49,999 | 43 (5.3%) | 60 (7.8%) |
| $50,000 to $74,999 | 137 (16.9%) | 73 (9.5%) |
| $75,000 to $99,999 | 74 (9.1%) | 51 (6.7%) |
| $100,000 to $149,999 | 73 (9.0%) | 50 (6.5%) |
| $150,000 or more | 4 (0.5%) | 130 (17.0%) |
| Total | 812 (100.0%) | 767 (100.0%) |
Property Value to Household Income Ratio in Truth Or Consequences
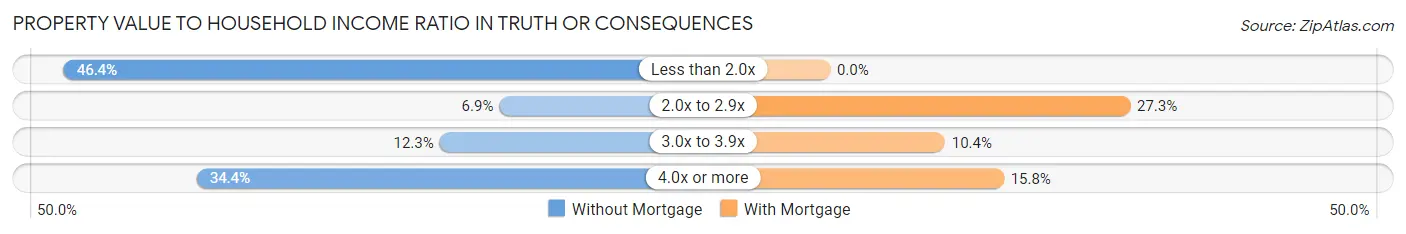
| Value-to-Income Ratio | Without Mortgage | With Mortgage |
| Less than 2.0x | 377 (46.4%) | 0 (0.0%) |
| 2.0x to 2.9x | 56 (6.9%) | 209 (27.3%) |
| 3.0x to 3.9x | 100 (12.3%) | 80 (10.4%) |
| 4.0x or more | 279 (34.4%) | 121 (15.8%) |
| Total | 812 (100.0%) | 767 (100.0%) |
Real Estate Taxes by Mortgage Status in Truth Or Consequences
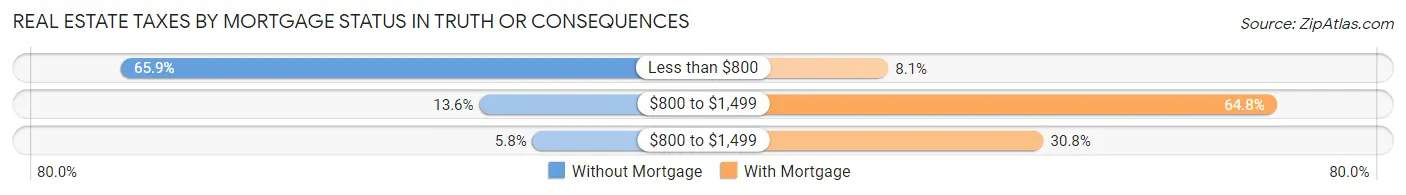
| Property Taxes | Without Mortgage | With Mortgage |
| Less than $800 | 535 (65.9%) | 62 (8.1%) |
| $800 to $1,499 | 110 (13.6%) | 497 (64.8%) |
| $800 to $1,499 | 47 (5.8%) | 236 (30.8%) |
| Total | 812 (100.0%) | 767 (100.0%) |
Health & Disability in Truth Or Consequences
Health Insurance Coverage by Age in Truth Or Consequences
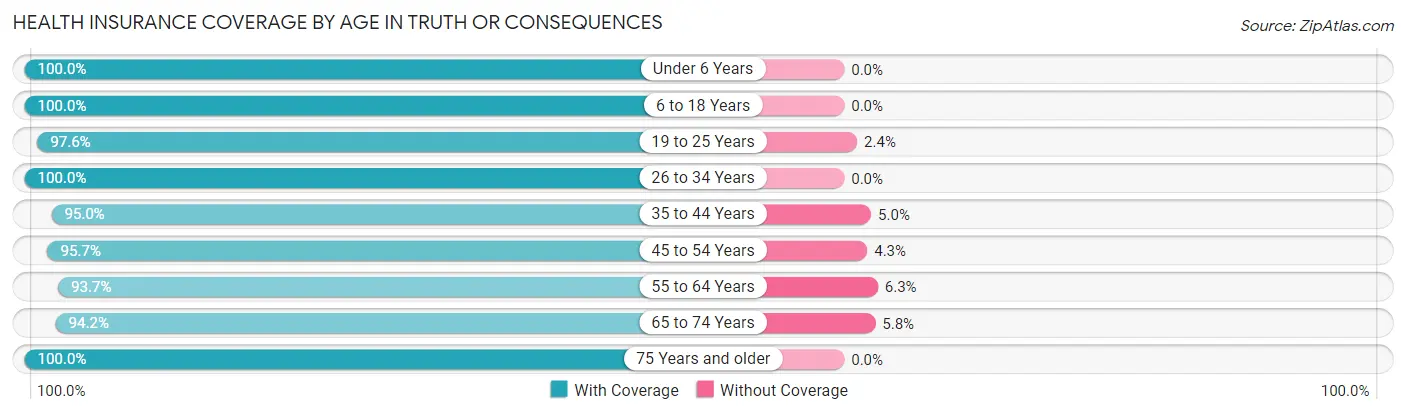
| Age Bracket | With Coverage | Without Coverage |
| Under 6 Years | 334 (100.0%) | 0 (0.0%) |
| 6 to 18 Years | 1,011 (100.0%) | 0 (0.0%) |
| 19 to 25 Years | 326 (97.6%) | 8 (2.4%) |
| 26 to 34 Years | 456 (100.0%) | 0 (0.0%) |
| 35 to 44 Years | 1,043 (95.0%) | 55 (5.0%) |
| 45 to 54 Years | 624 (95.7%) | 28 (4.3%) |
| 55 to 64 Years | 539 (93.7%) | 36 (6.3%) |
| 65 to 74 Years | 798 (94.2%) | 49 (5.8%) |
| 75 Years and older | 463 (100.0%) | 0 (0.0%) |
| Total | 5,594 (97.0%) | 176 (3.0%) |
Health Insurance Coverage by Citizenship Status in Truth Or Consequences
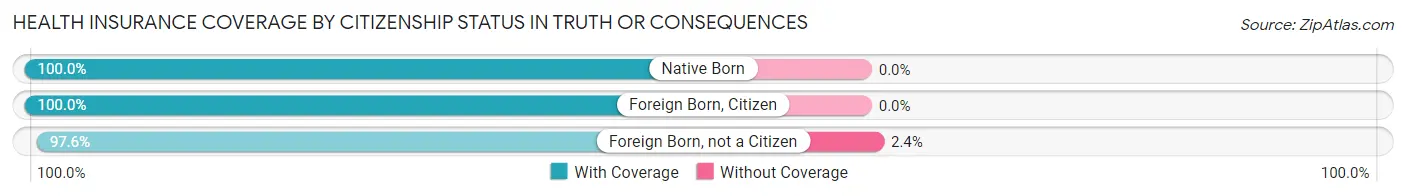
| Citizenship Status | With Coverage | Without Coverage |
| Native Born | 334 (100.0%) | 0 (0.0%) |
| Foreign Born, Citizen | 1,011 (100.0%) | 0 (0.0%) |
| Foreign Born, not a Citizen | 326 (97.6%) | 8 (2.4%) |
Health Insurance Coverage by Household Income in Truth Or Consequences
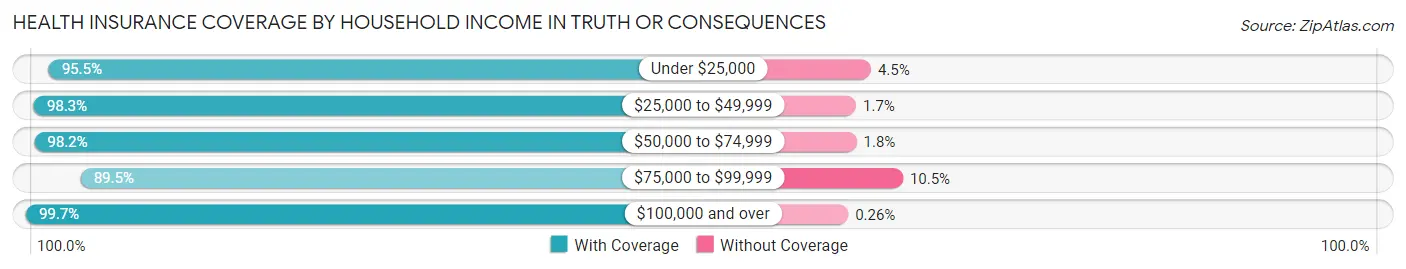
| Household Income | With Coverage | Without Coverage |
| Under $25,000 | 1,897 (95.5%) | 90 (4.5%) |
| $25,000 to $49,999 | 901 (98.3%) | 16 (1.7%) |
| $50,000 to $74,999 | 801 (98.2%) | 15 (1.8%) |
| $75,000 to $99,999 | 434 (89.5%) | 51 (10.5%) |
| $100,000 and over | 1,555 (99.7%) | 4 (0.3%) |
Public vs Private Health Insurance Coverage by Age in Truth Or Consequences
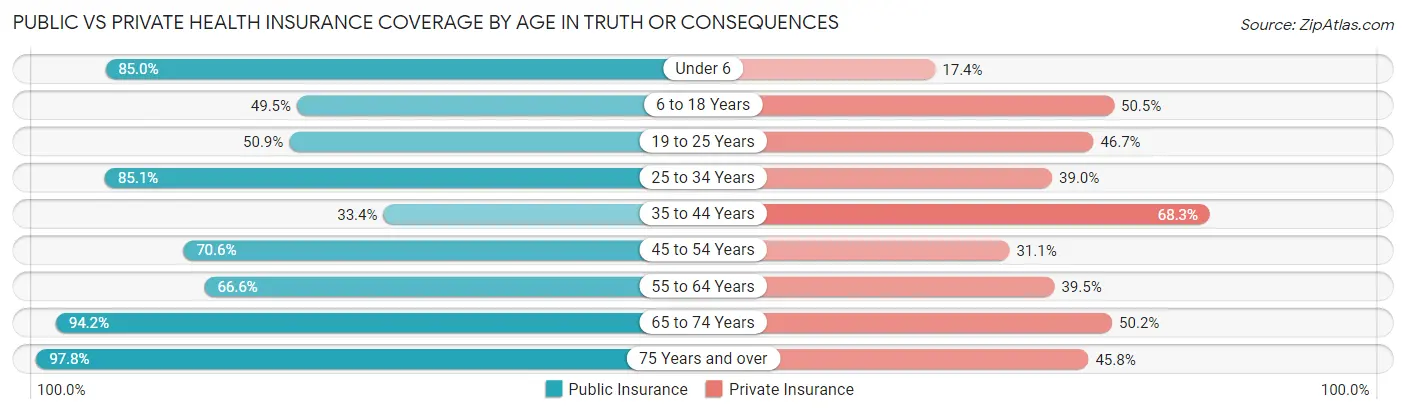
| Age Bracket | Public Insurance | Private Insurance |
| Under 6 | 284 (85.0%) | 58 (17.4%) |
| 6 to 18 Years | 500 (49.5%) | 511 (50.5%) |
| 19 to 25 Years | 170 (50.9%) | 156 (46.7%) |
| 25 to 34 Years | 388 (85.1%) | 178 (39.0%) |
| 35 to 44 Years | 367 (33.4%) | 750 (68.3%) |
| 45 to 54 Years | 460 (70.6%) | 203 (31.1%) |
| 55 to 64 Years | 383 (66.6%) | 227 (39.5%) |
| 65 to 74 Years | 798 (94.2%) | 425 (50.2%) |
| 75 Years and over | 453 (97.8%) | 212 (45.8%) |
| Total | 3,803 (65.9%) | 2,720 (47.1%) |
Disability Status by Sex by Age in Truth Or Consequences
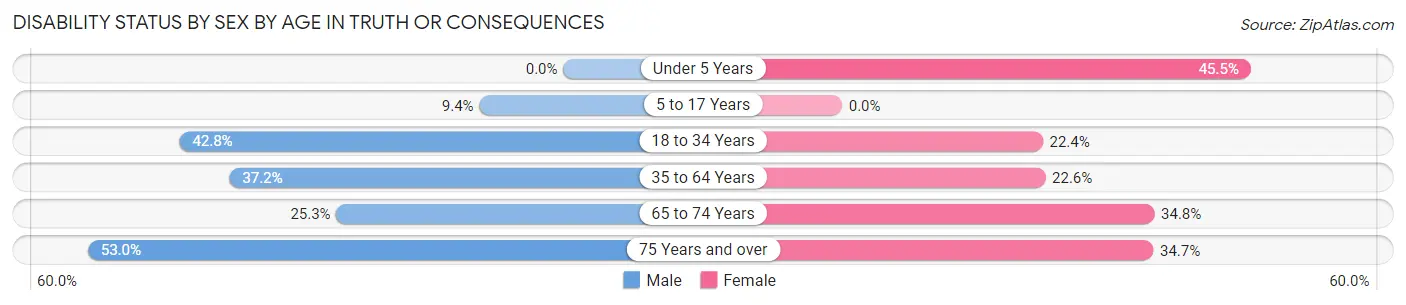
| Age Bracket | Male | Female |
| Under 5 Years | 0 (0.0%) | 46 (45.5%) |
| 5 to 17 Years | 49 (9.3%) | 0 (0.0%) |
| 18 to 34 Years | 233 (42.7%) | 55 (22.4%) |
| 35 to 64 Years | 408 (37.2%) | 278 (22.6%) |
| 65 to 74 Years | 92 (25.3%) | 168 (34.8%) |
| 75 Years and over | 152 (53.0%) | 61 (34.7%) |
Disability Class by Sex by Age in Truth Or Consequences
Disability Class: Hearing Difficulty
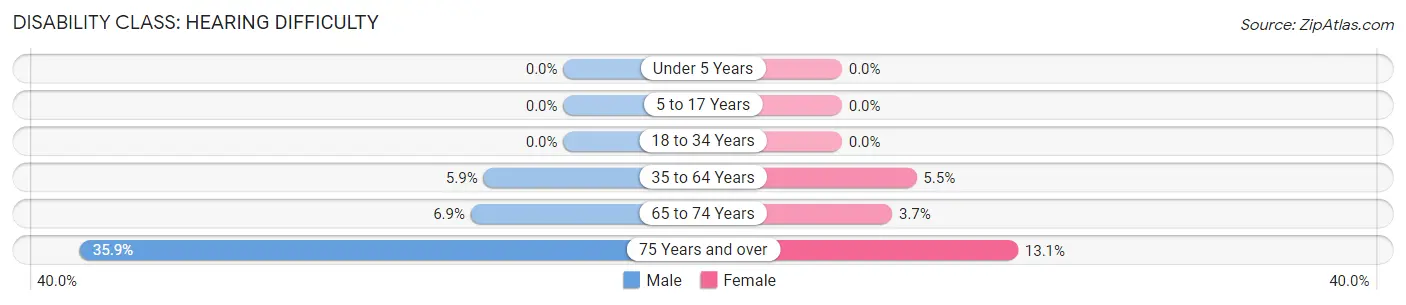
| Age Bracket | Male | Female |
| Under 5 Years | 0 (0.0%) | 0 (0.0%) |
| 5 to 17 Years | 0 (0.0%) | 0 (0.0%) |
| 18 to 34 Years | 0 (0.0%) | 0 (0.0%) |
| 35 to 64 Years | 65 (5.9%) | 68 (5.5%) |
| 65 to 74 Years | 25 (6.9%) | 18 (3.7%) |
| 75 Years and over | 103 (35.9%) | 23 (13.1%) |
Disability Class: Vision Difficulty
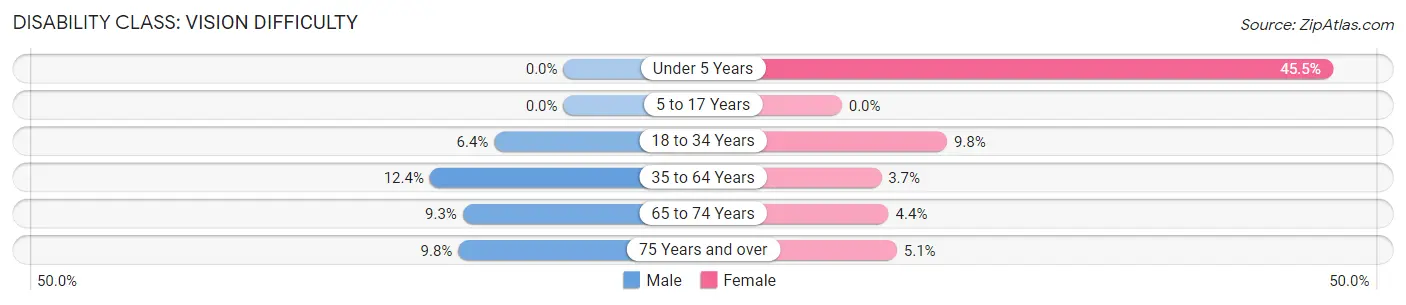
| Age Bracket | Male | Female |
| Under 5 Years | 0 (0.0%) | 46 (45.5%) |
| 5 to 17 Years | 0 (0.0%) | 0 (0.0%) |
| 18 to 34 Years | 35 (6.4%) | 24 (9.8%) |
| 35 to 64 Years | 136 (12.4%) | 45 (3.7%) |
| 65 to 74 Years | 34 (9.3%) | 21 (4.3%) |
| 75 Years and over | 28 (9.8%) | 9 (5.1%) |
Disability Class: Cognitive Difficulty
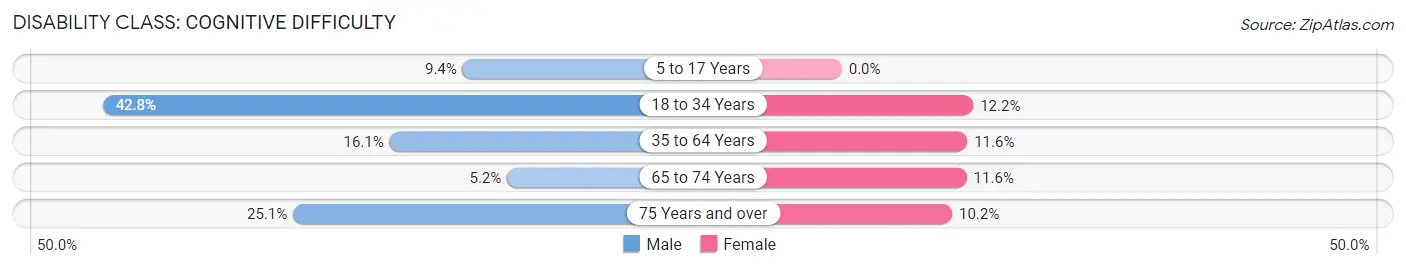
| Age Bracket | Male | Female |
| 5 to 17 Years | 49 (9.3%) | 0 (0.0%) |
| 18 to 34 Years | 233 (42.7%) | 30 (12.2%) |
| 35 to 64 Years | 177 (16.1%) | 143 (11.6%) |
| 65 to 74 Years | 19 (5.2%) | 56 (11.6%) |
| 75 Years and over | 72 (25.1%) | 18 (10.2%) |
Disability Class: Ambulatory Difficulty
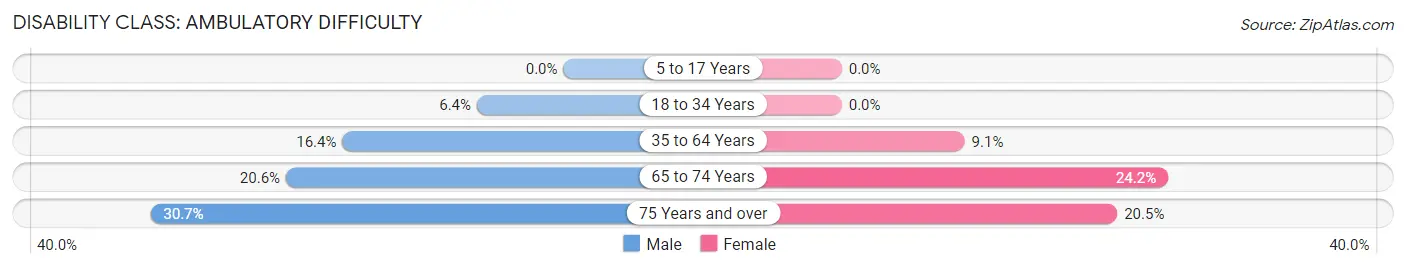
| Age Bracket | Male | Female |
| 5 to 17 Years | 0 (0.0%) | 0 (0.0%) |
| 18 to 34 Years | 35 (6.4%) | 0 (0.0%) |
| 35 to 64 Years | 180 (16.4%) | 112 (9.1%) |
| 65 to 74 Years | 75 (20.6%) | 117 (24.2%) |
| 75 Years and over | 88 (30.7%) | 36 (20.4%) |
Disability Class: Self-Care Difficulty
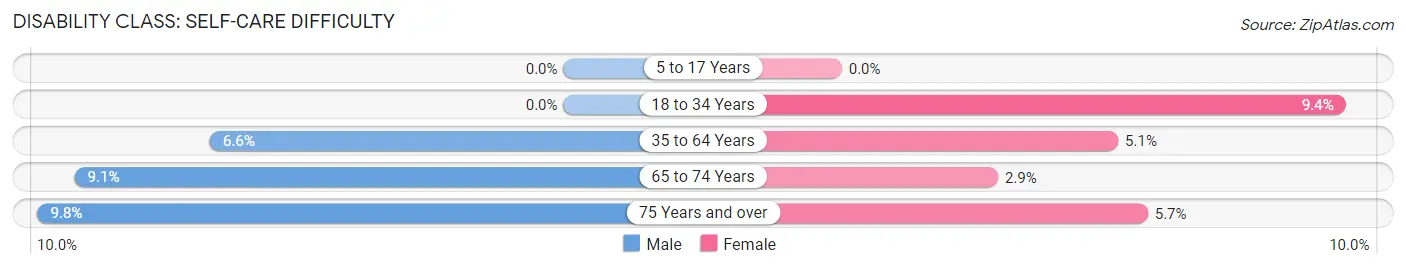
| Age Bracket | Male | Female |
| 5 to 17 Years | 0 (0.0%) | 0 (0.0%) |
| 18 to 34 Years | 0 (0.0%) | 23 (9.3%) |
| 35 to 64 Years | 72 (6.6%) | 63 (5.1%) |
| 65 to 74 Years | 33 (9.1%) | 14 (2.9%) |
| 75 Years and over | 28 (9.8%) | 10 (5.7%) |
Technology Access in Truth Or Consequences
Computing Device Access in Truth Or Consequences
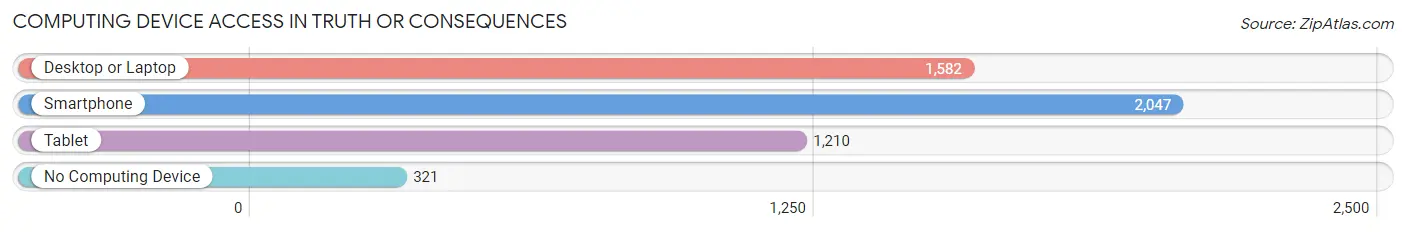
| Device Type | # Households | % Households |
| Desktop or Laptop | 1,582 | 62.2% |
| Smartphone | 2,047 | 80.4% |
| Tablet | 1,210 | 47.5% |
| No Computing Device | 321 | 12.6% |
| Total | 2,545 | 100.0% |
Internet Access in Truth Or Consequences
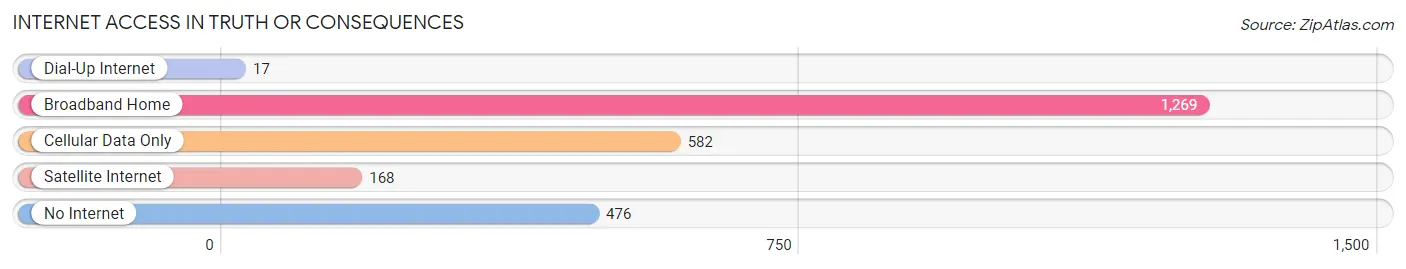
| Internet Type | # Households | % Households |
| Dial-Up Internet | 17 | 0.7% |
| Broadband Home | 1,269 | 49.9% |
| Cellular Data Only | 582 | 22.9% |
| Satellite Internet | 168 | 6.6% |
| No Internet | 476 | 18.7% |
| Total | 2,545 | 100.0% |
Truth Or Consequences Summary
History
Truth or Consequences, New Mexico, is a small city located in Sierra County, in the southwestern part of the state. It was founded in the late 19th century as Hot Springs, and was renamed in 1950 after the popular radio and television game show of the same name. The city is known for its hot springs, which have been used for therapeutic purposes since the late 1800s.
The area around Truth or Consequences was first inhabited by the Mescalero Apache, who used the hot springs for healing and spiritual ceremonies. The first European settlers arrived in the area in the late 1800s, and the town of Hot Springs was established in 1881. The town was named for the hot springs, which were believed to have healing properties.
In the early 1900s, the town began to attract visitors from around the country, who came to take advantage of the healing waters. Hotels and resorts were built to accommodate the influx of visitors, and the town became a popular destination for those seeking relief from various ailments.
In 1950, the town was renamed Truth or Consequences after the popular radio and television game show of the same name. The show’s host, Ralph Edwards, promised to broadcast the show from the first town that renamed itself after the show. Hot Springs was the first to do so, and the name change was made official on March 31, 1950.
Geography
Truth or Consequences is located in Sierra County, in the southwestern part of New Mexico. It is situated at an elevation of 4,000 feet, and is surrounded by the Sierra de las Uvas Mountains. The city is located on the banks of the Rio Grande, and is approximately 90 miles north of El Paso, Texas.
The climate in Truth or Consequences is semi-arid, with hot summers and mild winters. The average annual temperature is 64°F, and the average annual precipitation is 11.5 inches.
Economy
The economy of Truth or Consequences is largely based on tourism. The city is known for its hot springs, which attract visitors from around the country. The city also has a number of restaurants, shops, and other businesses that cater to tourists.
In addition to tourism, the city’s economy is also supported by agriculture, manufacturing, and government services. The city is home to a number of manufacturing plants, including a plant that produces plastic containers. The city is also home to a number of government offices, including a Social Security office and a Veterans Affairs office.
Demographics
As of the 2010 census, the population of Truth or Consequences was 6,475. The population is predominantly Hispanic, with a large percentage of Native Americans. The median household income is $25,972, and the median age is 38.7 years. The city has a poverty rate of 24.3%, and the unemployment rate is 8.2%.
Common Questions
What is Per Capita Income in Truth Or Consequences?
Per Capita income in Truth Or Consequences is $21,986.
What is the Median Family Income in Truth Or Consequences?
Median Family Income in Truth Or Consequences is $59,750.
What is the Median Household income in Truth Or Consequences?
Median Household Income in Truth Or Consequences is $28,685.
What is Income or Wage Gap in Truth Or Consequences?
Income or Wage Gap in Truth Or Consequences is 12.7%.
Women in Truth Or Consequences earn 87.3 cents for every dollar earned by a man.
What is Inequality or Gini Index in Truth Or Consequences?
Inequality or Gini Index in Truth Or Consequences is 0.48.
What is the Total Population of Truth Or Consequences?
Total Population of Truth Or Consequences is 6,030.
What is the Total Male Population of Truth Or Consequences?
Total Male Population of Truth Or Consequences is 3,113.
What is the Total Female Population of Truth Or Consequences?
Total Female Population of Truth Or Consequences is 2,917.
What is the Ratio of Males per 100 Females in Truth Or Consequences?
There are 106.72 Males per 100 Females in Truth Or Consequences.
What is the Ratio of Females per 100 Males in Truth Or Consequences?
There are 93.70 Females per 100 Males in Truth Or Consequences.
What is the Median Population Age in Truth Or Consequences?
Median Population Age in Truth Or Consequences is 42.7 Years.
What is the Average Family Size in Truth Or Consequences
Average Family Size in Truth Or Consequences is 3.2 People.
What is the Average Household Size in Truth Or Consequences
Average Household Size in Truth Or Consequences is 2.3 People.
How Large is the Labor Force in Truth Or Consequences?
There are 2,171 People in the Labor Forcein in Truth Or Consequences.
What is the Percentage of People in the Labor Force in Truth Or Consequences?
45.4% of People are in the Labor Force in Truth Or Consequences.
What is the Unemployment Rate in Truth Or Consequences?
Unemployment Rate in Truth Or Consequences is 2.9%.