Tijeras, NM Map & Demographics
Tijeras Map
Tijeras Overview
$30,842
PER CAPITA INCOME
$59,779
AVG FAMILY INCOME
$59,219
AVG HOUSEHOLD INCOME
66.6%
WAGE / INCOME GAP [ % ]
33.4¢/ $1
WAGE / INCOME GAP [ $ ]
0.40
INEQUALITY / GINI INDEX
539
TOTAL POPULATION
297
MALE POPULATION
242
FEMALE POPULATION
122.73
MALES / 100 FEMALES
81.48
FEMALES / 100 MALES
47.4
MEDIAN AGE
3.0
AVG FAMILY SIZE
2.5
AVG HOUSEHOLD SIZE
237
LABOR FORCE [ PEOPLE ]
53.9%
PERCENT IN LABOR FORCE
6.8%
UNEMPLOYMENT RATE
Tijeras Zip Codes
Tijeras Area Codes
Income in Tijeras
Income Overview in Tijeras
Per Capita Income in Tijeras is $30,842, while median incomes of families and households are $59,779 and $59,219 respectively.
| Characteristic | Number | Measure |
| Per Capita Income | 539 | $30,842 |
| Median Family Income | 149 | $59,779 |
| Mean Family Income | 149 | $79,908 |
| Median Household Income | 218 | $59,219 |
| Mean Household Income | 218 | $73,192 |
| Income Deficit | 149 | $0 |
| Wage / Income Gap (%) | 539 | 66.58% |
| Wage / Income Gap ($) | 539 | 33.42¢ per $1 |
| Gini / Inequality Index | 539 | 0.40 |
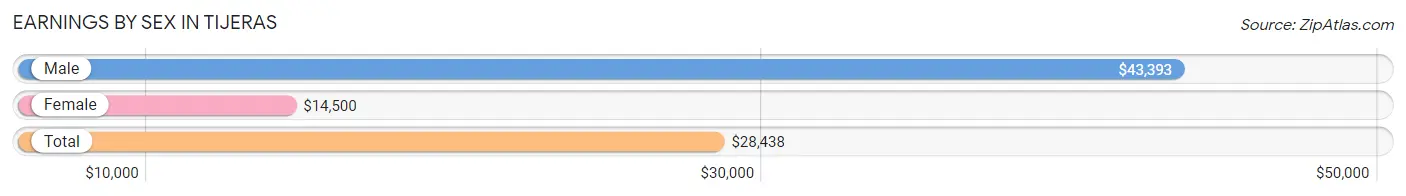
Earnings by Sex in Tijeras
Average Earnings in Tijeras are $28,438, $43,393 for men and $14,500 for women, a difference of 66.6%.
| Sex | Number | Average Earnings |
| Male | 131 (49.4%) | $43,393 |
| Female | 134 (50.6%) | $14,500 |
| Total | 265 (100.0%) | $28,438 |
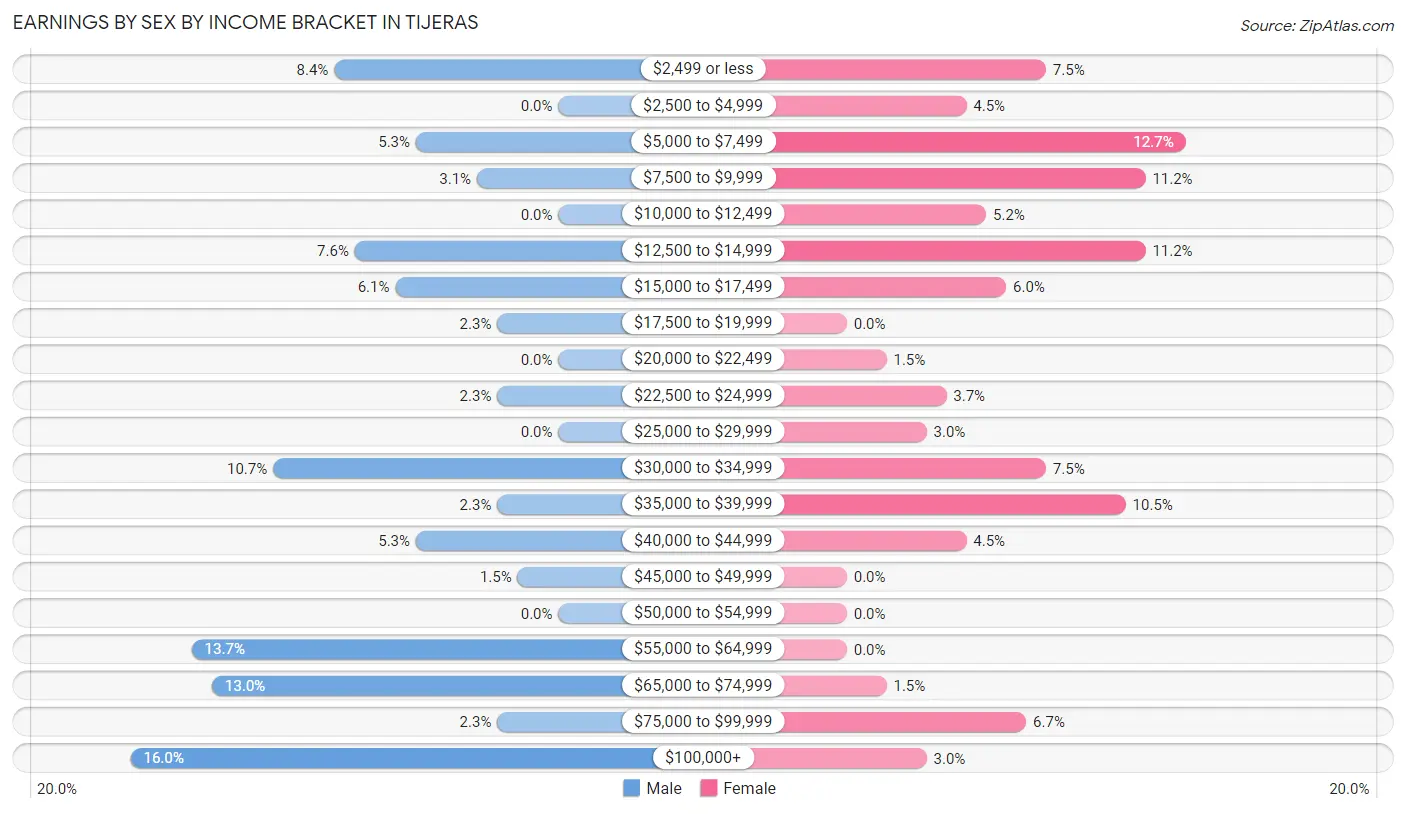
Earnings by Sex by Income Bracket in Tijeras
The most common earnings brackets in Tijeras are $100,000+ for men (21 | 16.0%) and $5,000 to $7,499 for women (17 | 12.7%).
| Income | Male | Female |
| $2,499 or less | 11 (8.4%) | 10 (7.5%) |
| $2,500 to $4,999 | 0 (0.0%) | 6 (4.5%) |
| $5,000 to $7,499 | 7 (5.3%) | 17 (12.7%) |
| $7,500 to $9,999 | 4 (3.0%) | 15 (11.2%) |
| $10,000 to $12,499 | 0 (0.0%) | 7 (5.2%) |
| $12,500 to $14,999 | 10 (7.6%) | 15 (11.2%) |
| $15,000 to $17,499 | 8 (6.1%) | 8 (6.0%) |
| $17,500 to $19,999 | 3 (2.3%) | 0 (0.0%) |
| $20,000 to $22,499 | 0 (0.0%) | 2 (1.5%) |
| $22,500 to $24,999 | 3 (2.3%) | 5 (3.7%) |
| $25,000 to $29,999 | 0 (0.0%) | 4 (3.0%) |
| $30,000 to $34,999 | 14 (10.7%) | 10 (7.5%) |
| $35,000 to $39,999 | 3 (2.3%) | 14 (10.4%) |
| $40,000 to $44,999 | 7 (5.3%) | 6 (4.5%) |
| $45,000 to $49,999 | 2 (1.5%) | 0 (0.0%) |
| $50,000 to $54,999 | 0 (0.0%) | 0 (0.0%) |
| $55,000 to $64,999 | 18 (13.7%) | 0 (0.0%) |
| $65,000 to $74,999 | 17 (13.0%) | 2 (1.5%) |
| $75,000 to $99,999 | 3 (2.3%) | 9 (6.7%) |
| $100,000+ | 21 (16.0%) | 4 (3.0%) |
| Total | 131 (100.0%) | 134 (100.0%) |
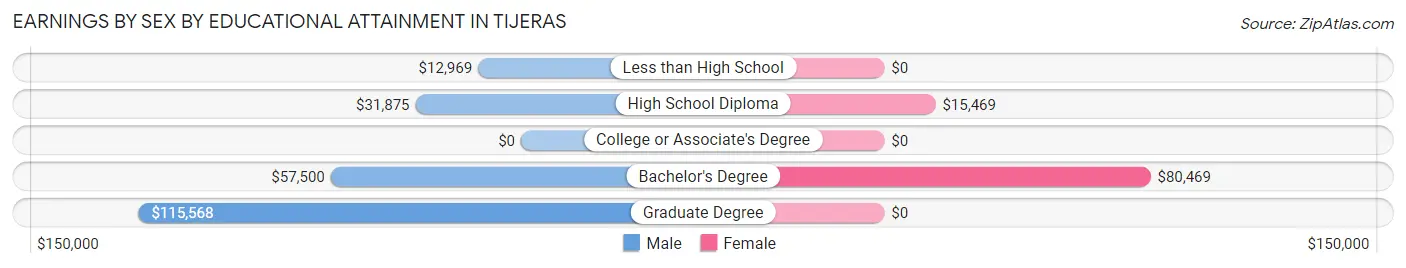
Earnings by Sex by Educational Attainment in Tijeras
Average earnings in Tijeras are $44,643 for men and $17,188 for women, a difference of 61.5%. Men with an educational attainment of graduate degree enjoy the highest average annual earnings of $115,568, while those with less than high school education earn the least with $12,969. Women with an educational attainment of bachelor's degree earn the most with the average annual earnings of $80,469, while those with high school diploma education have the smallest earnings of $15,469.
| Educational Attainment | Male Income | Female Income |
| Less than High School | $12,969 | $0 |
| High School Diploma | $31,875 | $15,469 |
| College or Associate's Degree | - | - |
| Bachelor's Degree | $57,500 | $80,469 |
| Graduate Degree | $115,568 | $0 |
| Total | $44,643 | $17,188 |
Family Income in Tijeras
Family Income Brackets in Tijeras
According to the Tijeras family income data, there are 37 families falling into the $50,000 to $74,999 income range, which is the most common income bracket and makes up 24.8% of all families. Conversely, the less than $10,000 income bracket is the least frequent group with only 5 families (3.4%) belonging to this category.
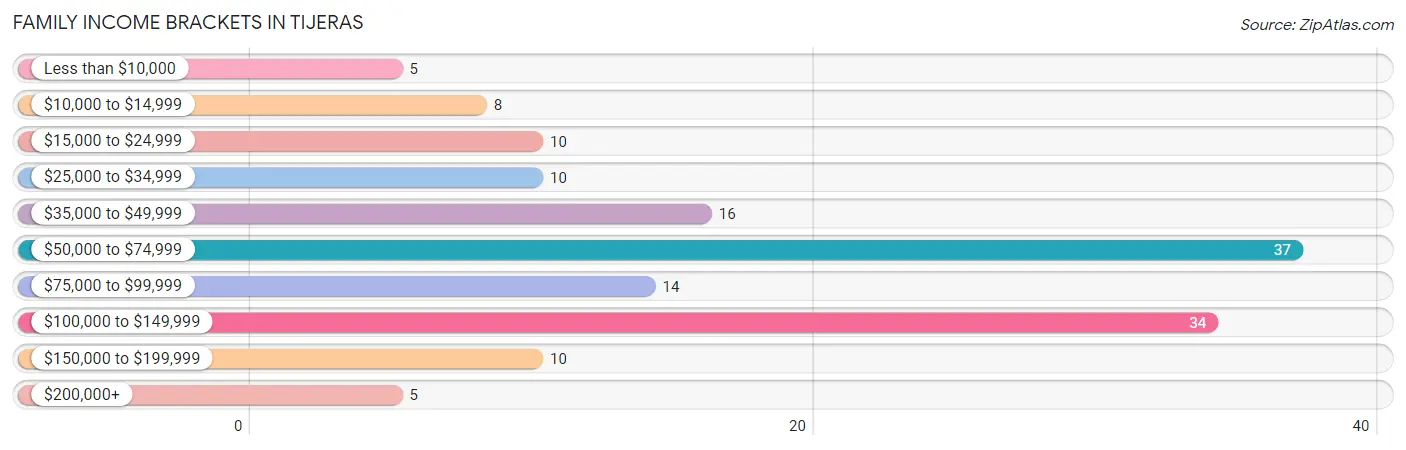
| Income Bracket | # Families | % Families |
| Less than $10,000 | 5 | 3.4% |
| $10,000 to $14,999 | 8 | 5.4% |
| $15,000 to $24,999 | 10 | 6.7% |
| $25,000 to $34,999 | 10 | 6.7% |
| $35,000 to $49,999 | 16 | 10.7% |
| $50,000 to $74,999 | 37 | 24.8% |
| $75,000 to $99,999 | 14 | 9.4% |
| $100,000 to $149,999 | 34 | 22.8% |
| $150,000 to $199,999 | 10 | 6.7% |
| $200,000+ | 5 | 3.4% |
Family Income by Famaliy Size in Tijeras
4-person families (15 | 10.1%) account for the highest median family income in Tijeras with $145,156 per family, while 4-person families (15 | 10.1%) have the highest median income of $36,289 per family member.
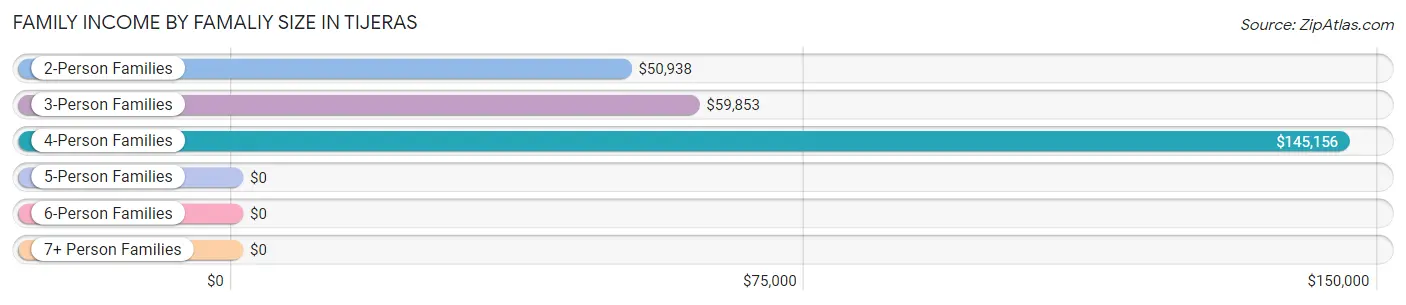
| Income Bracket | # Families | Median Income |
| 2-Person Families | 72 (48.3%) | $50,938 |
| 3-Person Families | 56 (37.6%) | $59,853 |
| 4-Person Families | 15 (10.1%) | $145,156 |
| 5-Person Families | 4 (2.7%) | $0 |
| 6-Person Families | 2 (1.3%) | $0 |
| 7+ Person Families | 0 (0.0%) | $0 |
| Total | 149 (100.0%) | $59,779 |
Family Income by Number of Earners in Tijeras
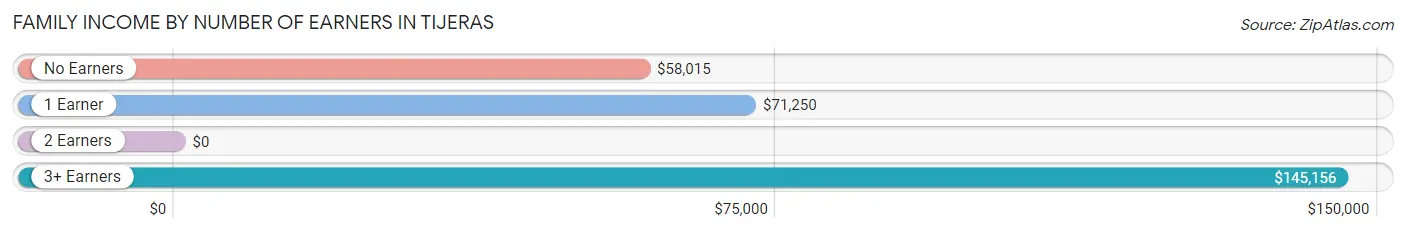
| Number of Earners | # Families | Median Income |
| No Earners | 37 (24.8%) | $58,015 |
| 1 Earner | 35 (23.5%) | $71,250 |
| 2 Earners | 58 (38.9%) | $0 |
| 3+ Earners | 19 (12.8%) | $145,156 |
| Total | 149 (100.0%) | $59,779 |
Household Income in Tijeras
Household Income Brackets in Tijeras
With 65 households falling in the category, the $50,000 to $74,999 income range is the most frequent in Tijeras, accounting for 29.8% of all households. In contrast, only 5 households (2.3%) fall into the $200,000+ income bracket, making it the least populous group.
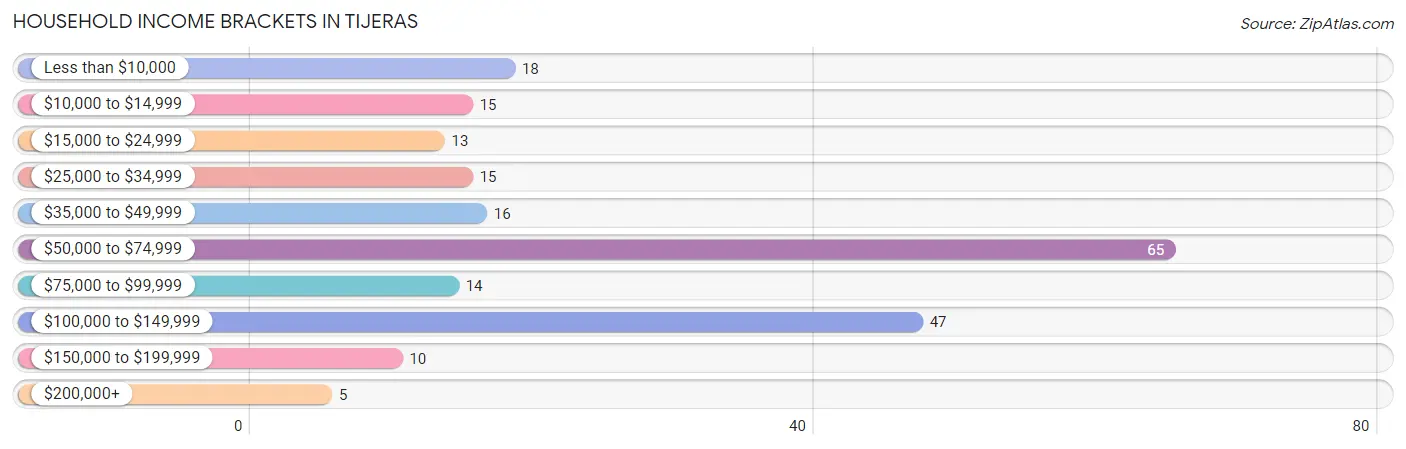
| Income Bracket | # Households | % Households |
| Less than $10,000 | 18 | 8.3% |
| $10,000 to $14,999 | 15 | 6.9% |
| $15,000 to $24,999 | 13 | 6.0% |
| $25,000 to $34,999 | 15 | 6.9% |
| $35,000 to $49,999 | 16 | 7.3% |
| $50,000 to $74,999 | 65 | 29.8% |
| $75,000 to $99,999 | 14 | 6.4% |
| $100,000 to $149,999 | 47 | 21.6% |
| $150,000 to $199,999 | 10 | 4.6% |
| $200,000+ | 5 | 2.3% |
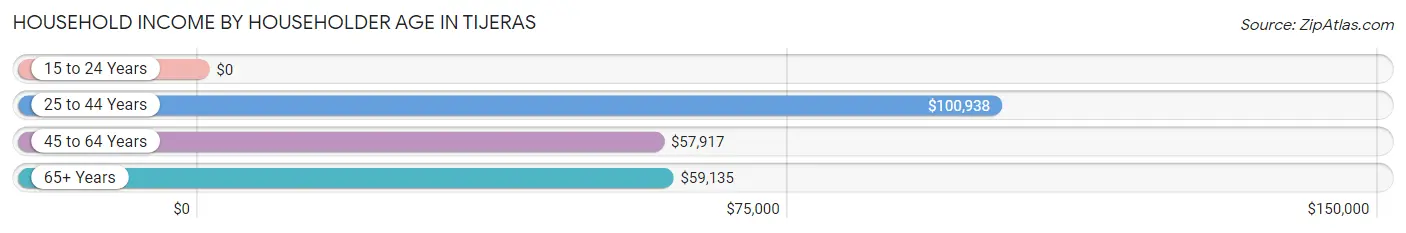
Household Income by Householder Age in Tijeras
The median household income in Tijeras is $59,219, with the highest median household income of $100,938 found in the 25 to 44 years age bracket for the primary householder. A total of 31 households (14.2%) fall into this category. Meanwhile, the 15 to 24 years age bracket for the primary householder has the lowest median household income of $0, with 5 households (2.3%) in this group.
| Income Bracket | # Households | Median Income |
| 15 to 24 Years | 5 (2.3%) | $0 |
| 25 to 44 Years | 31 (14.2%) | $100,938 |
| 45 to 64 Years | 88 (40.4%) | $57,917 |
| 65+ Years | 94 (43.1%) | $59,135 |
| Total | 218 (100.0%) | $59,219 |
Poverty in Tijeras
Income Below Poverty by Sex and Age in Tijeras
With 13.8% poverty level for males and 22.4% for females among the residents of Tijeras, 55 to 64 year old males and 35 to 44 year old females are the most vulnerable to poverty, with 16 males (51.6%) and 13 females (40.6%) in their respective age groups living below the poverty level.
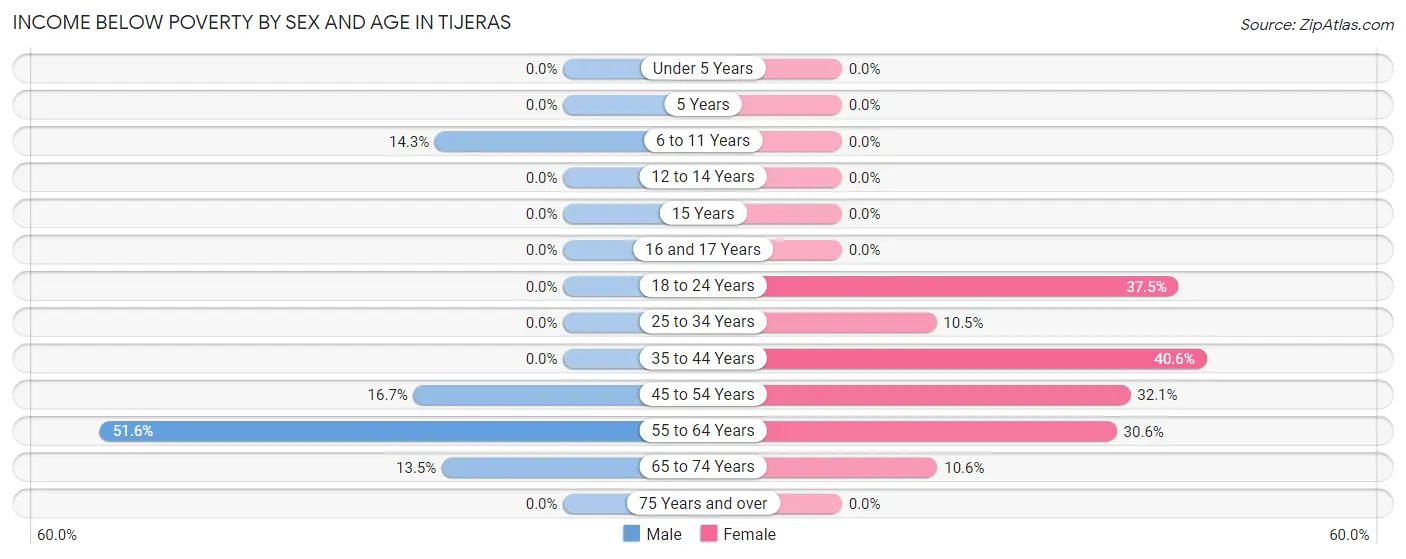
| Age Bracket | Male | Female |
| Under 5 Years | 0 (0.0%) | 0 (0.0%) |
| 5 Years | 0 (0.0%) | 0 (0.0%) |
| 6 to 11 Years | 8 (14.3%) | 0 (0.0%) |
| 12 to 14 Years | 0 (0.0%) | 0 (0.0%) |
| 15 Years | 0 (0.0%) | 0 (0.0%) |
| 16 and 17 Years | 0 (0.0%) | 0 (0.0%) |
| 18 to 24 Years | 0 (0.0%) | 9 (37.5%) |
| 25 to 34 Years | 0 (0.0%) | 2 (10.5%) |
| 35 to 44 Years | 0 (0.0%) | 13 (40.6%) |
| 45 to 54 Years | 7 (16.7%) | 9 (32.1%) |
| 55 to 64 Years | 16 (51.6%) | 15 (30.6%) |
| 65 to 74 Years | 10 (13.5%) | 5 (10.6%) |
| 75 Years and over | 0 (0.0%) | 0 (0.0%) |
| Total | 41 (13.8%) | 53 (22.4%) |
Income Above Poverty by Sex and Age in Tijeras
According to the poverty statistics in Tijeras, males aged under 5 years and females aged under 5 years are the age groups that are most secure financially, with 100.0% of males and 100.0% of females in these age groups living above the poverty line.
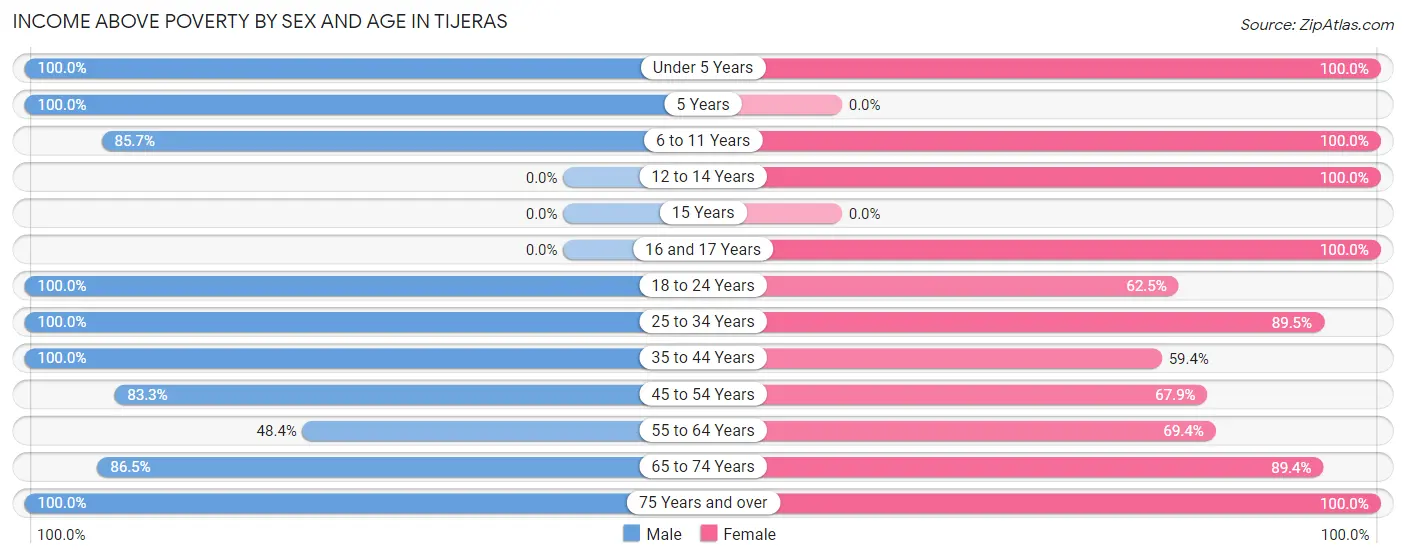
| Age Bracket | Male | Female |
| Under 5 Years | 6 (100.0%) | 3 (100.0%) |
| 5 Years | 5 (100.0%) | 0 (0.0%) |
| 6 to 11 Years | 48 (85.7%) | 22 (100.0%) |
| 12 to 14 Years | 0 (0.0%) | 2 (100.0%) |
| 15 Years | 0 (0.0%) | 0 (0.0%) |
| 16 and 17 Years | 0 (0.0%) | 4 (100.0%) |
| 18 to 24 Years | 9 (100.0%) | 15 (62.5%) |
| 25 to 34 Years | 38 (100.0%) | 17 (89.5%) |
| 35 to 44 Years | 25 (100.0%) | 19 (59.4%) |
| 45 to 54 Years | 35 (83.3%) | 19 (67.9%) |
| 55 to 64 Years | 15 (48.4%) | 34 (69.4%) |
| 65 to 74 Years | 64 (86.5%) | 42 (89.4%) |
| 75 Years and over | 11 (100.0%) | 7 (100.0%) |
| Total | 256 (86.2%) | 184 (77.6%) |
Income Below Poverty Among Married-Couple Families in Tijeras
The poverty statistics for married-couple families in Tijeras show that 10.5% or 13 of the total 124 families live below the poverty line. Families with no children have the highest poverty rate of 17.6%, comprising of 13 families. On the other hand, families with 1 or 2 children have the lowest poverty rate of 0.0%, which includes 0 families.
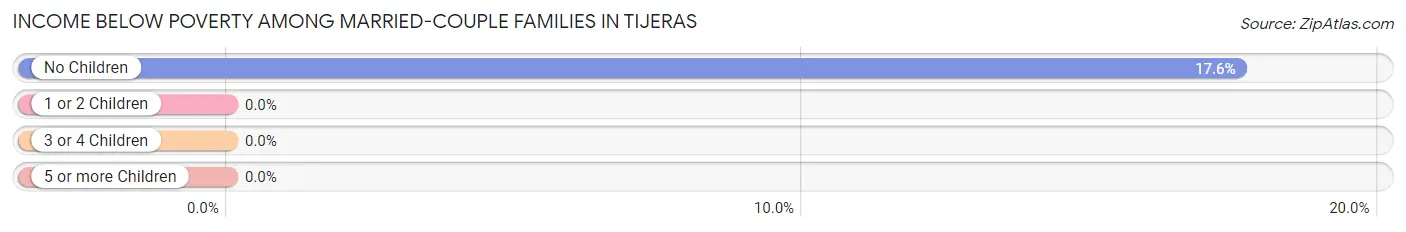
| Children | Above Poverty | Below Poverty |
| No Children | 61 (82.4%) | 13 (17.6%) |
| 1 or 2 Children | 48 (100.0%) | 0 (0.0%) |
| 3 or 4 Children | 2 (100.0%) | 0 (0.0%) |
| 5 or more Children | 0 (0.0%) | 0 (0.0%) |
| Total | 111 (89.5%) | 13 (10.5%) |
Income Below Poverty Among Single-Parent Households in Tijeras
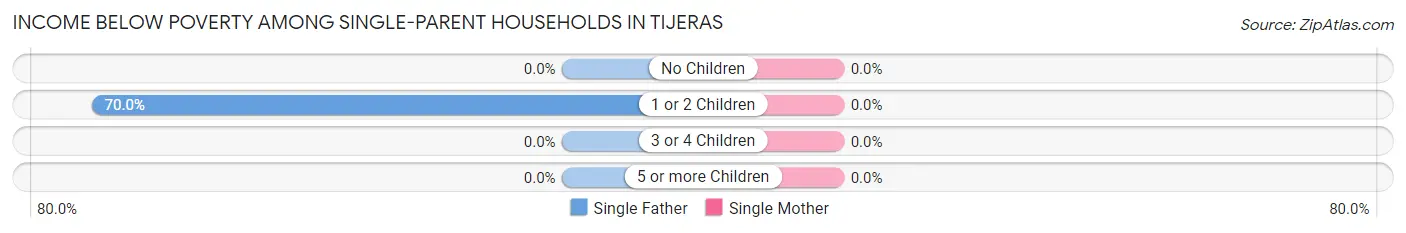
| Children | Single Father | Single Mother |
| No Children | 0 (0.0%) | 0 (0.0%) |
| 1 or 2 Children | 7 (70.0%) | 0 (0.0%) |
| 3 or 4 Children | 0 (0.0%) | 0 (0.0%) |
| 5 or more Children | 0 (0.0%) | 0 (0.0%) |
| Total | 7 (46.7%) | 0 (0.0%) |
Income Below Poverty Among Married-Couple vs Single-Parent Households in Tijeras
The poverty data for Tijeras shows that 13 of the married-couple family households (10.5%) and 7 of the single-parent households (28.0%) are living below the poverty level. Within the married-couple family households, those with no children have the highest poverty rate, with 13 households (17.6%) falling below the poverty line. Among the single-parent households, those with 1 or 2 children have the highest poverty rate, with 7 household (70.0%) living below poverty.
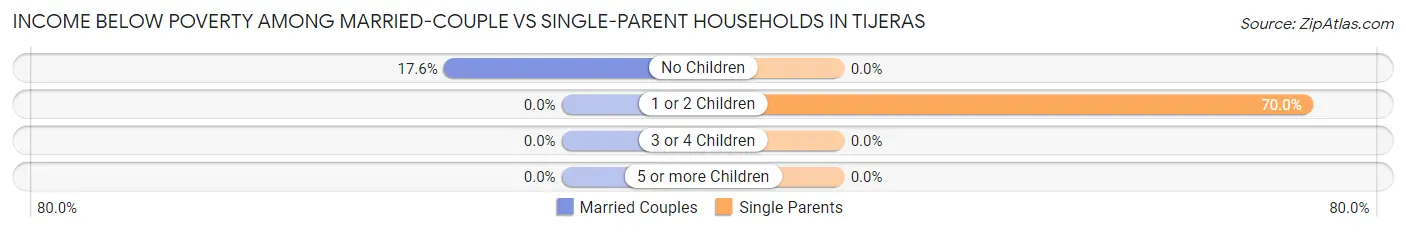
| Children | Married-Couple Families | Single-Parent Households |
| No Children | 13 (17.6%) | 0 (0.0%) |
| 1 or 2 Children | 0 (0.0%) | 7 (70.0%) |
| 3 or 4 Children | 0 (0.0%) | 0 (0.0%) |
| 5 or more Children | 0 (0.0%) | 0 (0.0%) |
| Total | 13 (10.5%) | 7 (28.0%) |
Race in Tijeras
The most populous races in Tijeras are White / Caucasian (383 | 71.1%), Hispanic or Latino (322 | 59.7%), and Two or more Races (129 | 23.9%).
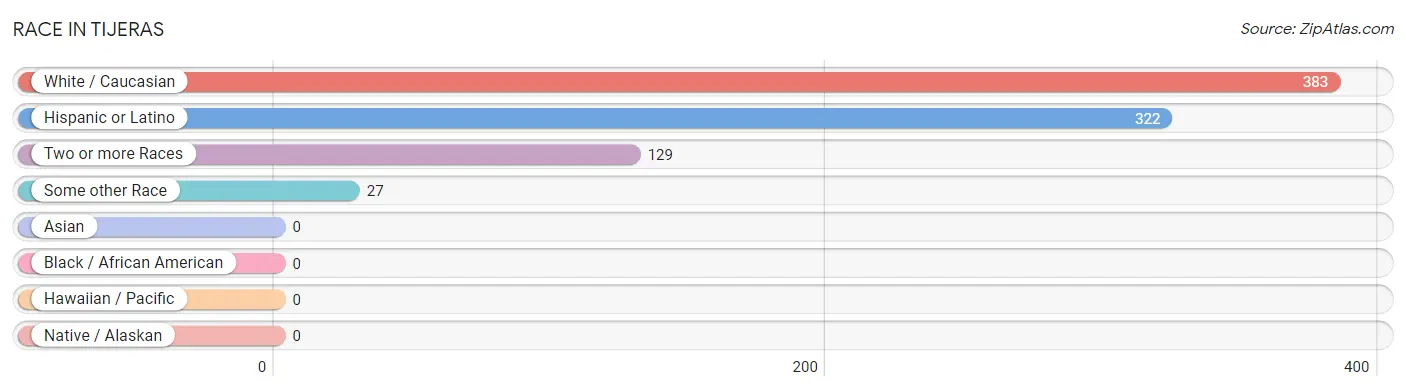
| Race | # Population | % Population |
| Asian | 0 | 0.0% |
| Black / African American | 0 | 0.0% |
| Hawaiian / Pacific | 0 | 0.0% |
| Hispanic or Latino | 322 | 59.7% |
| Native / Alaskan | 0 | 0.0% |
| White / Caucasian | 383 | 71.1% |
| Two or more Races | 129 | 23.9% |
| Some other Race | 27 | 5.0% |
| Total | 539 | 100.0% |
Ancestry in Tijeras
The most populous ancestries reported in Tijeras are Mexican (225 | 41.7%), English (60 | 11.1%), German (41 | 7.6%), American (30 | 5.6%), and Spanish (26 | 4.8%), together accounting for 70.9% of all Tijeras residents.
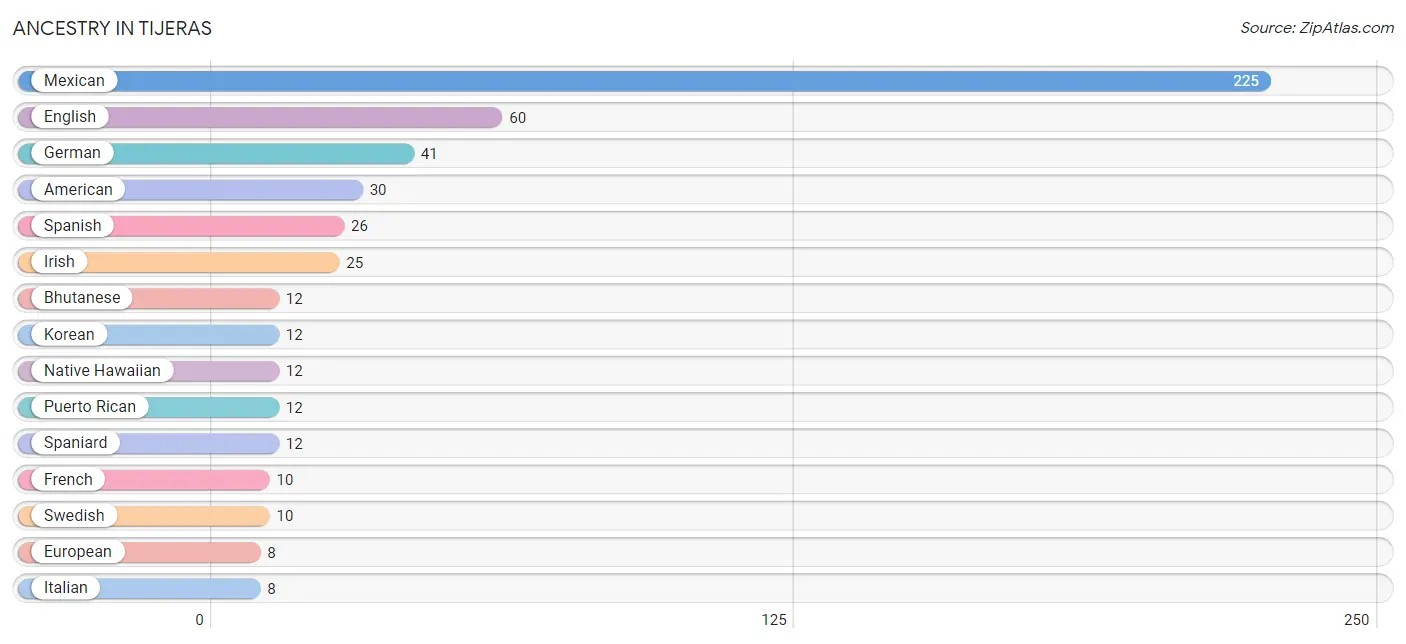
| Ancestry | # Population | % Population |
| American | 30 | 5.6% |
| Bhutanese | 12 | 2.2% |
| British | 4 | 0.7% |
| Cherokee | 5 | 0.9% |
| Eastern European | 5 | 0.9% |
| English | 60 | 11.1% |
| European | 8 | 1.5% |
| French | 10 | 1.9% |
| French Canadian | 4 | 0.7% |
| German | 41 | 7.6% |
| Irish | 25 | 4.6% |
| Italian | 8 | 1.5% |
| Korean | 12 | 2.2% |
| Mexican | 225 | 41.7% |
| Native Hawaiian | 12 | 2.2% |
| Puerto Rican | 12 | 2.2% |
| Scottish | 6 | 1.1% |
| Spaniard | 12 | 2.2% |
| Spanish | 26 | 4.8% |
| Swedish | 10 | 1.9% | View All 20 Rows |
Immigrants in Tijeras
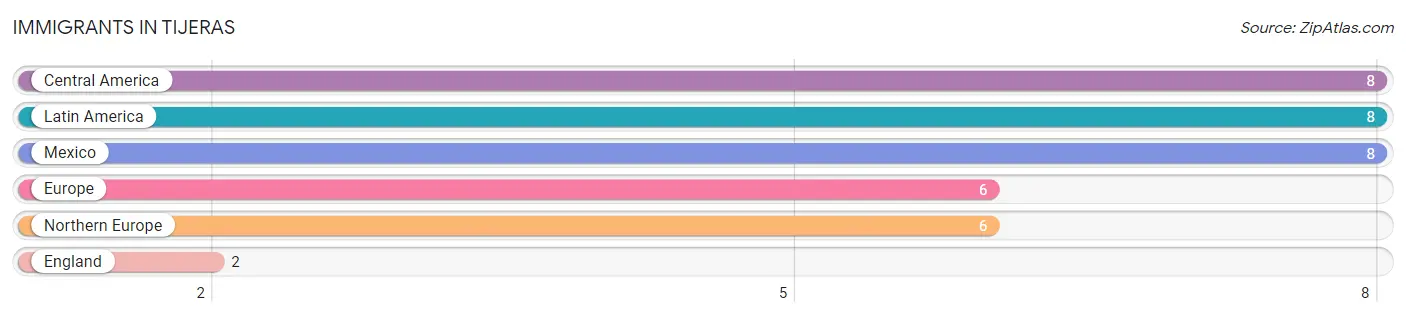
The most numerous immigrant groups reported in Tijeras came from Central America (8 | 1.5%), Latin America (8 | 1.5%), Mexico (8 | 1.5%), Europe (6 | 1.1%), and Northern Europe (6 | 1.1%), together accounting for 6.7% of all Tijeras residents.
| Immigration Origin | # Population | % Population |
| Central America | 8 | 1.5% |
| England | 2 | 0.4% |
| Europe | 6 | 1.1% |
| Latin America | 8 | 1.5% |
| Mexico | 8 | 1.5% |
| Northern Europe | 6 | 1.1% | View All 6 Rows |
Sex and Age in Tijeras
Sex and Age in Tijeras
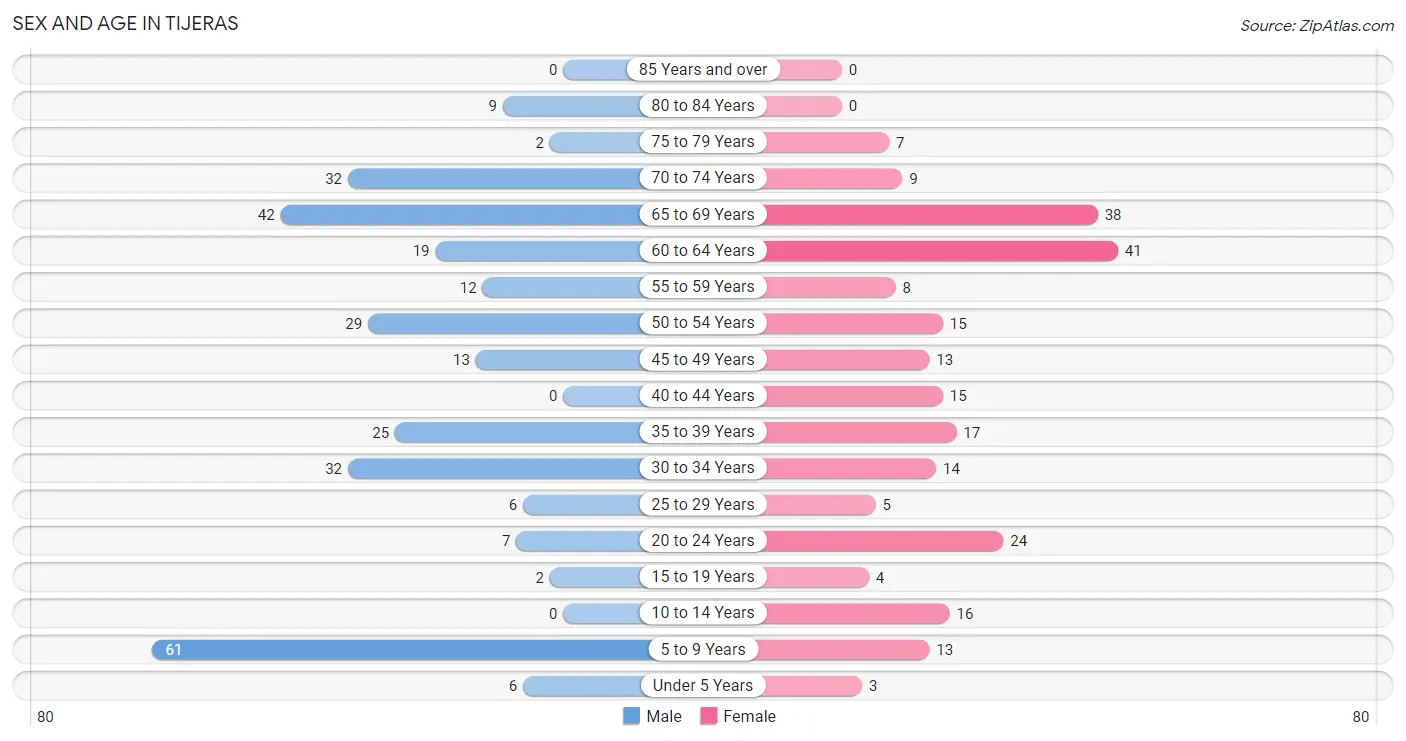
The most populous age groups in Tijeras are 5 to 9 Years (61 | 20.5%) for men and 60 to 64 Years (41 | 16.9%) for women.
| Age Bracket | Male | Female |
| Under 5 Years | 6 (2.0%) | 3 (1.2%) |
| 5 to 9 Years | 61 (20.5%) | 13 (5.4%) |
| 10 to 14 Years | 0 (0.0%) | 16 (6.6%) |
| 15 to 19 Years | 2 (0.7%) | 4 (1.7%) |
| 20 to 24 Years | 7 (2.4%) | 24 (9.9%) |
| 25 to 29 Years | 6 (2.0%) | 5 (2.1%) |
| 30 to 34 Years | 32 (10.8%) | 14 (5.8%) |
| 35 to 39 Years | 25 (8.4%) | 17 (7.0%) |
| 40 to 44 Years | 0 (0.0%) | 15 (6.2%) |
| 45 to 49 Years | 13 (4.4%) | 13 (5.4%) |
| 50 to 54 Years | 29 (9.8%) | 15 (6.2%) |
| 55 to 59 Years | 12 (4.0%) | 8 (3.3%) |
| 60 to 64 Years | 19 (6.4%) | 41 (16.9%) |
| 65 to 69 Years | 42 (14.1%) | 38 (15.7%) |
| 70 to 74 Years | 32 (10.8%) | 9 (3.7%) |
| 75 to 79 Years | 2 (0.7%) | 7 (2.9%) |
| 80 to 84 Years | 9 (3.0%) | 0 (0.0%) |
| 85 Years and over | 0 (0.0%) | 0 (0.0%) |
| Total | 297 (100.0%) | 242 (100.0%) |
Families and Households in Tijeras
Median Family Size in Tijeras
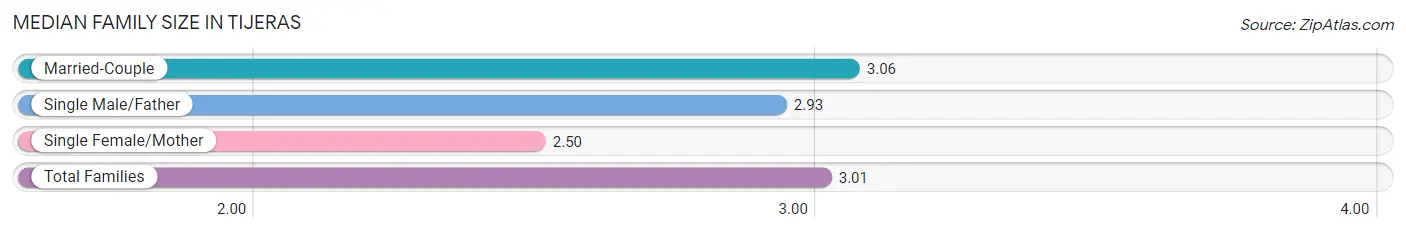
The median family size in Tijeras is 3.01 persons per family, with married-couple families (124 | 83.2%) accounting for the largest median family size of 3.06 persons per family. On the other hand, single female/mother families (10 | 6.7%) represent the smallest median family size with 2.50 persons per family.
| Family Type | # Families | Family Size |
| Married-Couple | 124 (83.2%) | 3.06 |
| Single Male/Father | 15 (10.1%) | 2.93 |
| Single Female/Mother | 10 (6.7%) | 2.50 |
| Total Families | 149 (100.0%) | 3.01 |
Median Household Size in Tijeras
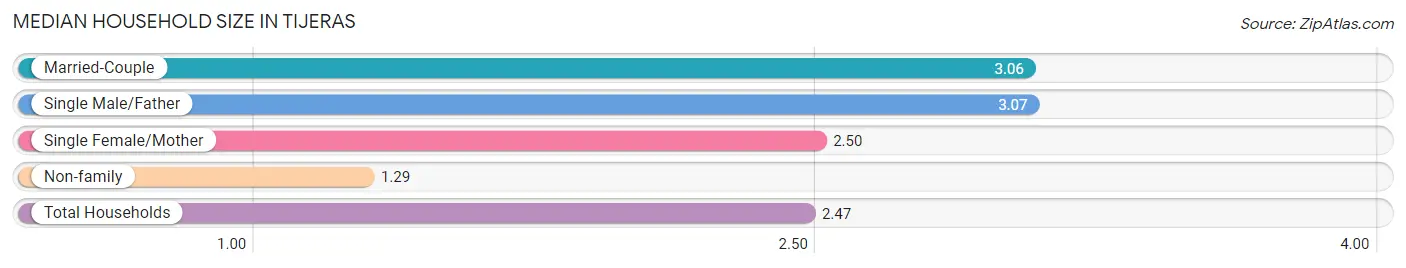
The median household size in Tijeras is 2.47 persons per household, with single male/father households (15 | 6.9%) accounting for the largest median household size of 3.07 persons per household. non-family households (69 | 31.7%) represent the smallest median household size with 1.29 persons per household.
| Household Type | # Households | Household Size |
| Married-Couple | 124 (56.9%) | 3.06 |
| Single Male/Father | 15 (6.9%) | 3.07 |
| Single Female/Mother | 10 (4.6%) | 2.50 |
| Non-family | 69 (31.7%) | 1.29 |
| Total Households | 218 (100.0%) | 2.47 |
Household Size by Marriage Status in Tijeras
Out of a total of 218 households in Tijeras, 149 (68.3%) are family households, while 69 (31.7%) are nonfamily households. The most numerous type of family households are 2-person households, comprising 69, and the most common type of nonfamily households are 1-person households, comprising 56.
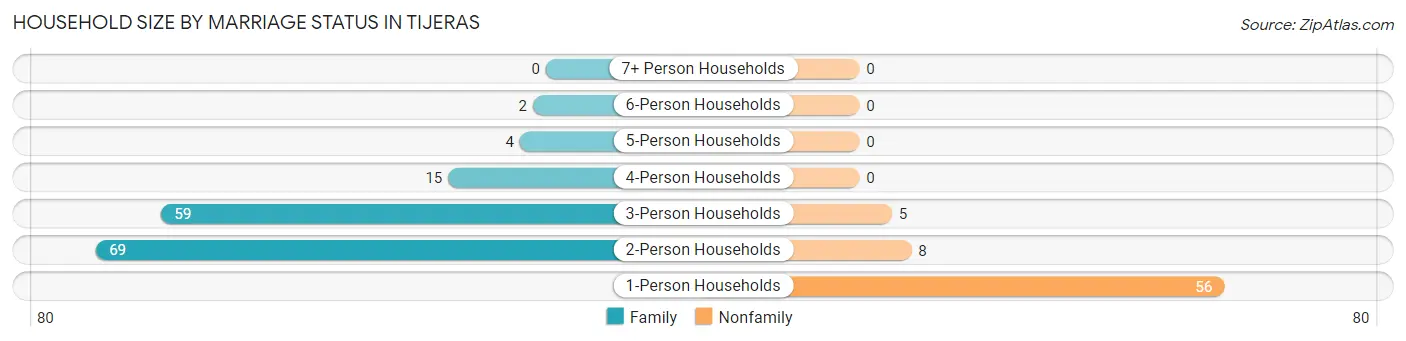
| Household Size | Family Households | Nonfamily Households |
| 1-Person Households | - | 56 (25.7%) |
| 2-Person Households | 69 (31.7%) | 8 (3.7%) |
| 3-Person Households | 59 (27.1%) | 5 (2.3%) |
| 4-Person Households | 15 (6.9%) | 0 (0.0%) |
| 5-Person Households | 4 (1.8%) | 0 (0.0%) |
| 6-Person Households | 2 (0.9%) | 0 (0.0%) |
| 7+ Person Households | 0 (0.0%) | 0 (0.0%) |
| Total | 149 (68.3%) | 69 (31.7%) |
Female Fertility in Tijeras
Fertility by Age in Tijeras
Average fertility rate in Tijeras is 22.0 births per 1,000 women. Women in the age bracket of 20 to 34 years have the highest fertility rate with 47.0 births per 1,000 women. Women in the age bracket of 20 to 34 years acount for 100.0% of all women with births.
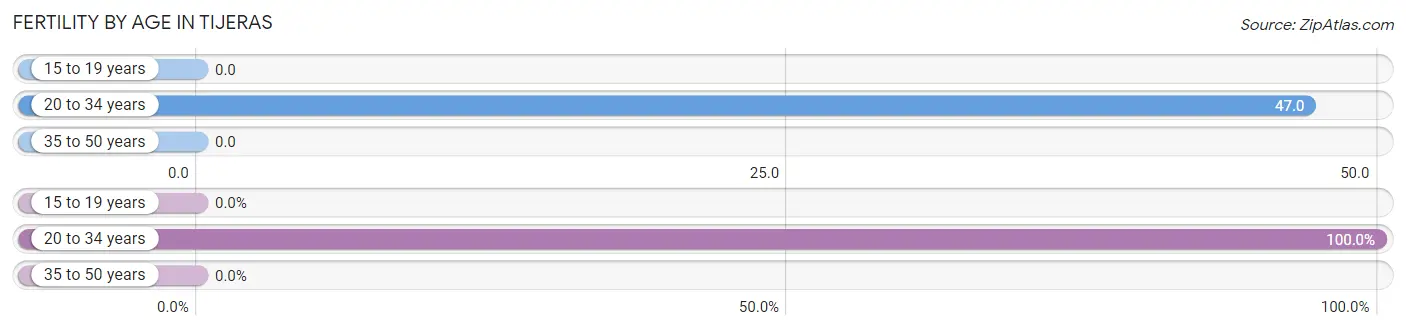
| Age Bracket | Women with Births | Births / 1,000 Women |
| 15 to 19 years | 0 (0.0%) | 0.0 |
| 20 to 34 years | 2 (100.0%) | 47.0 |
| 35 to 50 years | 0 (0.0%) | 0.0 |
| Total | 2 (100.0%) | 22.0 |
Fertility by Age by Marriage Status in Tijeras
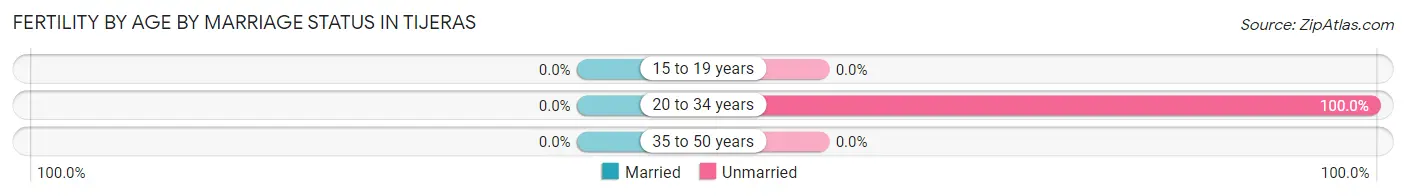
| Age Bracket | Married | Unmarried |
| 15 to 19 years | 0 (0.0%) | 0 (0.0%) |
| 20 to 34 years | 0 (0.0%) | 2 (100.0%) |
| 35 to 50 years | 0 (0.0%) | 0 (0.0%) |
| Total | 0 (0.0%) | 2 (100.0%) |
Fertility by Education in Tijeras
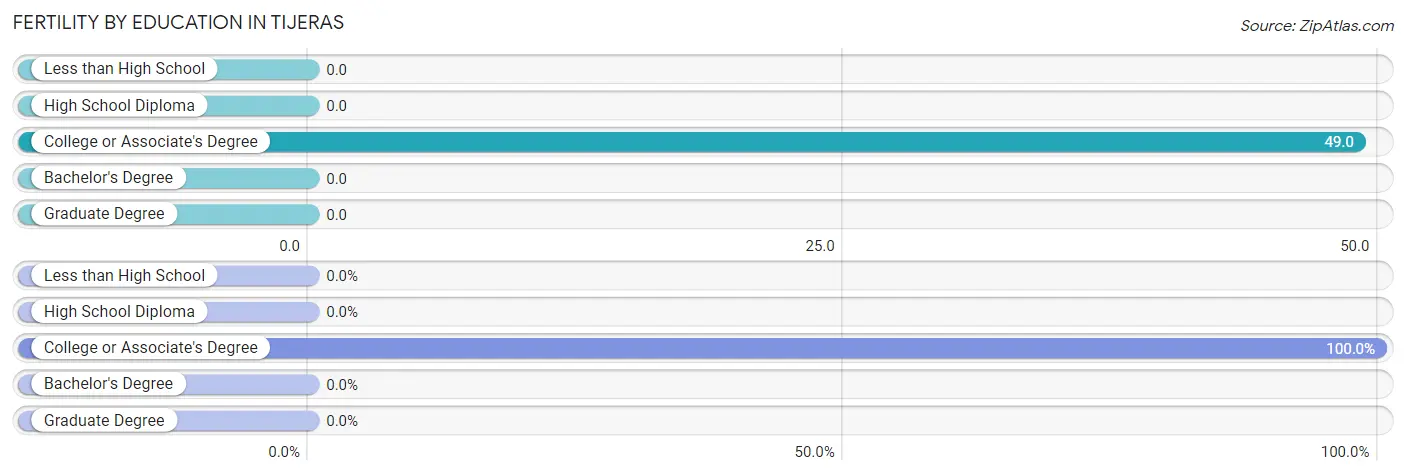
| Educational Attainment | Women with Births | Births / 1,000 Women |
| Less than High School | 0 (0.0%) | 0.0 |
| High School Diploma | 0 (0.0%) | 0.0 |
| College or Associate's Degree | 2 (100.0%) | 49.0 |
| Bachelor's Degree | 0 (0.0%) | 0.0 |
| Graduate Degree | 0 (0.0%) | 0.0 |
| Total | 2 (100.0%) | 22.0 |
Fertility by Education by Marriage Status in Tijeras
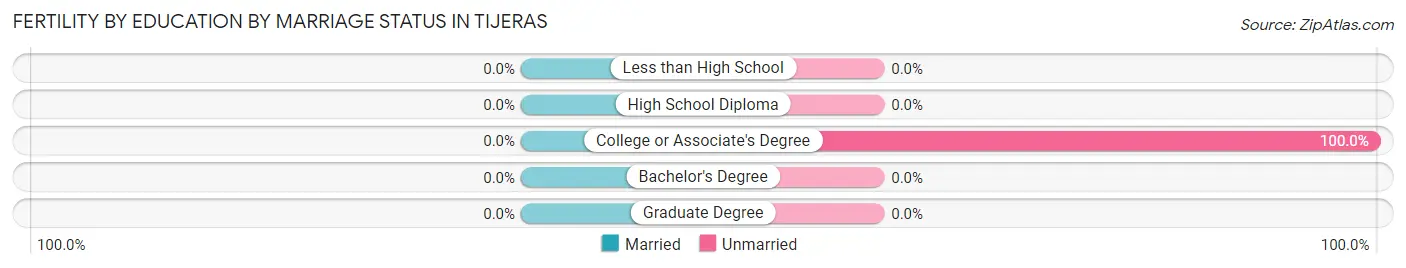
| Educational Attainment | Married | Unmarried |
| Less than High School | 0 (0.0%) | 0 (0.0%) |
| High School Diploma | 0 (0.0%) | 0 (0.0%) |
| College or Associate's Degree | 0 (0.0%) | 2 (100.0%) |
| Bachelor's Degree | 0 (0.0%) | 0 (0.0%) |
| Graduate Degree | 0 (0.0%) | 0 (0.0%) |
| Total | 0 (0.0%) | 2 (100.0%) |
Employment Characteristics in Tijeras
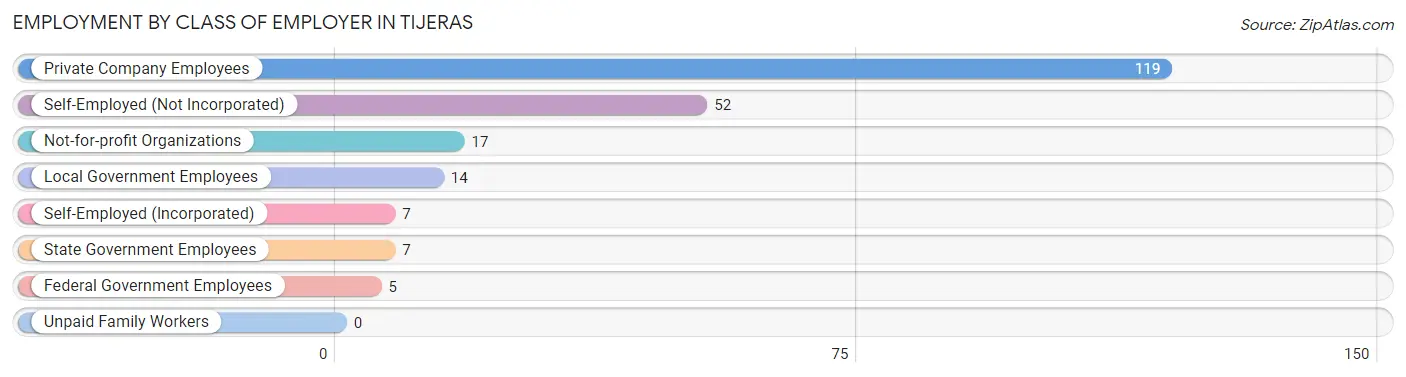
Employment by Class of Employer in Tijeras
Among the 221 employed individuals in Tijeras, private company employees (119 | 53.8%), self-employed (not incorporated) (52 | 23.5%), and not-for-profit organizations (17 | 7.7%) make up the most common classes of employment.
| Employer Class | # Employees | % Employees |
| Private Company Employees | 119 | 53.8% |
| Self-Employed (Incorporated) | 7 | 3.2% |
| Self-Employed (Not Incorporated) | 52 | 23.5% |
| Not-for-profit Organizations | 17 | 7.7% |
| Local Government Employees | 14 | 6.3% |
| State Government Employees | 7 | 3.2% |
| Federal Government Employees | 5 | 2.3% |
| Unpaid Family Workers | 0 | 0.0% |
| Total | 221 | 100.0% |
Employment Status by Age in Tijeras
According to the labor force statistics for Tijeras, out of the total population over 16 years of age (440), 53.9% or 237 individuals are in the labor force, with 6.8% or 16 of them unemployed. The age group with the highest labor force participation rate is 20 to 24 years, with 100.0% or 31 individuals in the labor force. Within the labor force, the 35 to 44 years age range has the highest percentage of unemployed individuals, with 18.4% or 7 of them being unemployed.
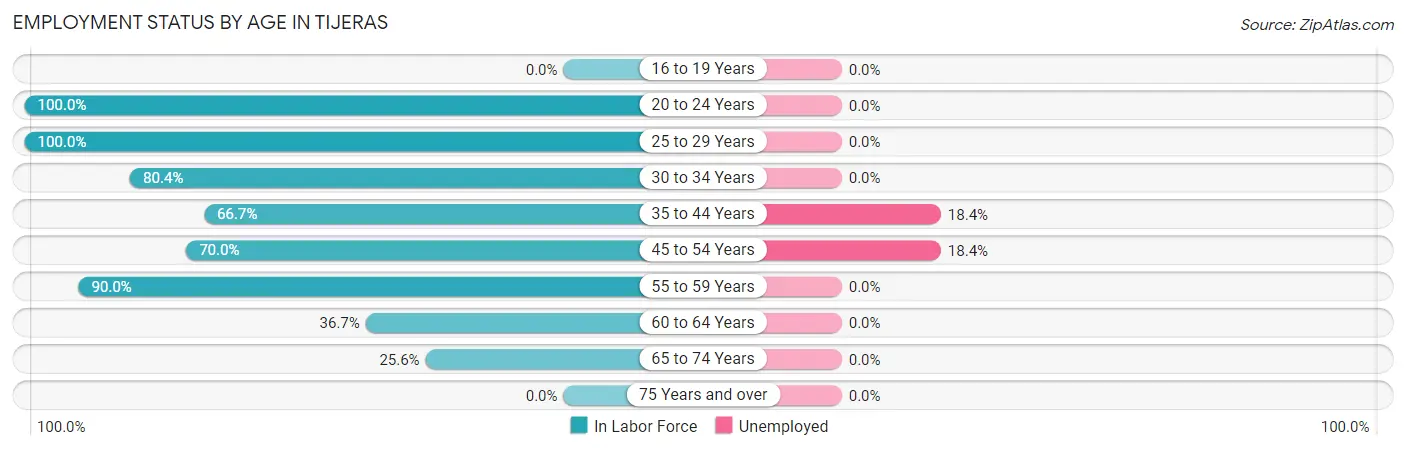
| Age Bracket | In Labor Force | Unemployed |
| 16 to 19 Years | 0 (0.0%) | 0 (0.0%) |
| 20 to 24 Years | 31 (100.0%) | 0 (0.0%) |
| 25 to 29 Years | 11 (100.0%) | 0 (0.0%) |
| 30 to 34 Years | 37 (80.4%) | 0 (0.0%) |
| 35 to 44 Years | 38 (66.7%) | 7 (18.4%) |
| 45 to 54 Years | 49 (70.0%) | 9 (18.4%) |
| 55 to 59 Years | 18 (90.0%) | 0 (0.0%) |
| 60 to 64 Years | 22 (36.7%) | 0 (0.0%) |
| 65 to 74 Years | 31 (25.6%) | 0 (0.0%) |
| 75 Years and over | 0 (0.0%) | 0 (0.0%) |
| Total | 237 (53.9%) | 16 (6.8%) |
Employment Status by Educational Attainment in Tijeras
According to labor force statistics for Tijeras, 66.3% of individuals (175) out of the total population between 25 and 64 years of age (264) are in the labor force, with 9.1% or 16 of them being unemployed. The group with the highest labor force participation rate are those with the educational attainment of bachelor's degree or higher, with 100.0% or 64 individuals in the labor force. Within the labor force, individuals with college / associate degree education have the highest percentage of unemployment, with 17.6% or 9 of them being unemployed.
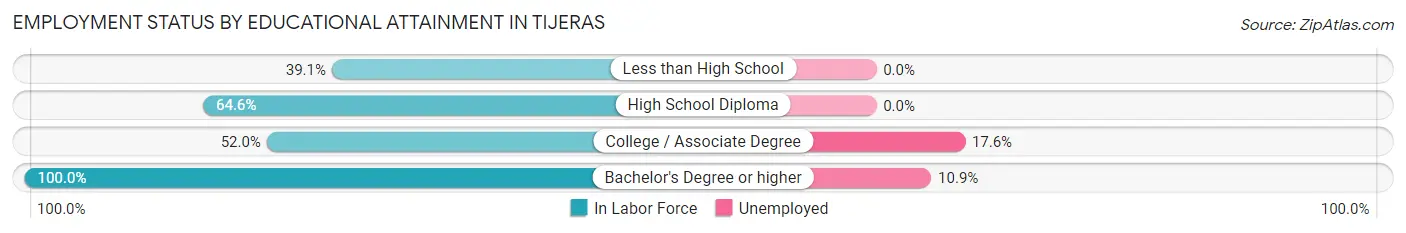
| Educational Attainment | In Labor Force | Unemployed |
| Less than High School | 9 (39.1%) | 0 (0.0%) |
| High School Diploma | 51 (64.6%) | 0 (0.0%) |
| College / Associate Degree | 51 (52.0%) | 17 (17.6%) |
| Bachelor's Degree or higher | 64 (100.0%) | 7 (10.9%) |
| Total | 175 (66.3%) | 24 (9.1%) |
Employment Occupations by Sex in Tijeras
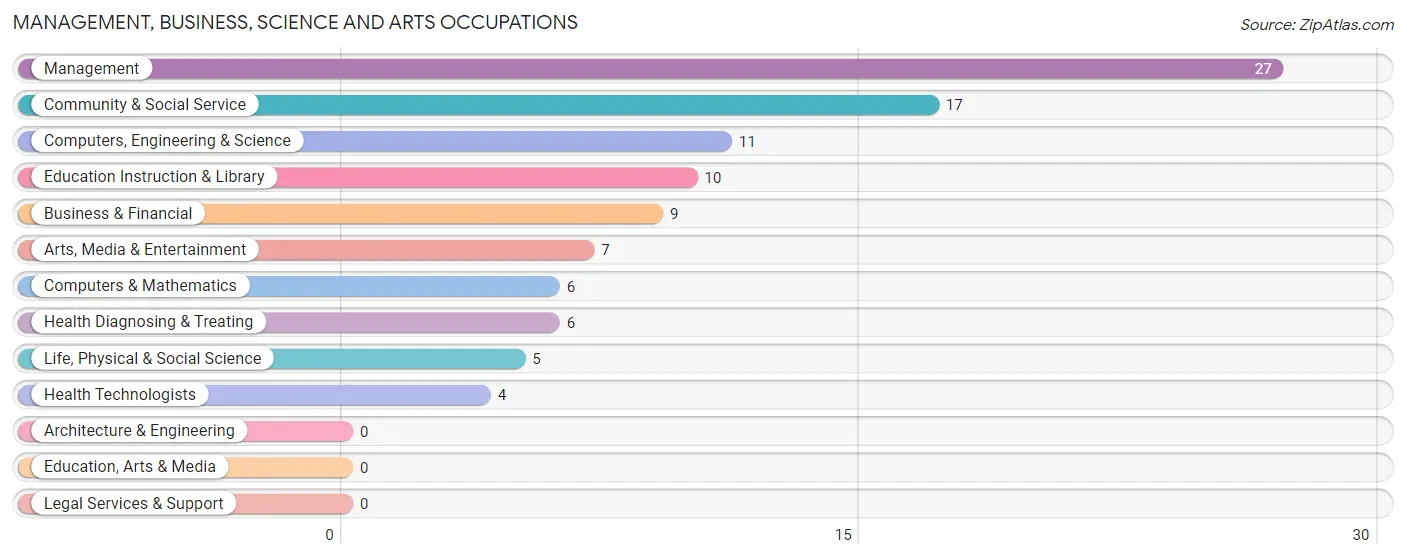
Management, Business, Science and Arts Occupations
The most common Management, Business, Science and Arts occupations in Tijeras are Management (27 | 12.2%), Community & Social Service (17 | 7.7%), Computers, Engineering & Science (11 | 5.0%), Education Instruction & Library (10 | 4.5%), and Business & Financial (9 | 4.1%).
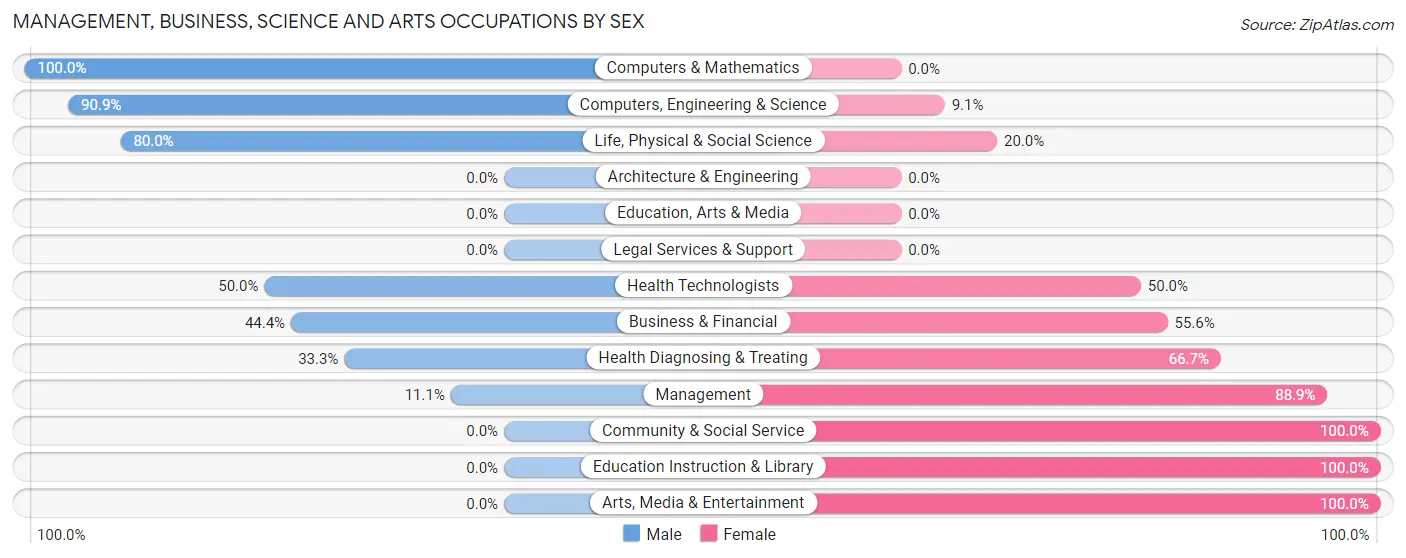
Management, Business, Science and Arts Occupations by Sex
Within the Management, Business, Science and Arts occupations in Tijeras, the most male-oriented occupations are Computers & Mathematics (100.0%), Computers, Engineering & Science (90.9%), and Life, Physical & Social Science (80.0%), while the most female-oriented occupations are Community & Social Service (100.0%), Education Instruction & Library (100.0%), and Arts, Media & Entertainment (100.0%).
| Occupation | Male | Female |
| Management | 3 (11.1%) | 24 (88.9%) |
| Business & Financial | 4 (44.4%) | 5 (55.6%) |
| Computers, Engineering & Science | 10 (90.9%) | 1 (9.1%) |
| Computers & Mathematics | 6 (100.0%) | 0 (0.0%) |
| Architecture & Engineering | 0 (0.0%) | 0 (0.0%) |
| Life, Physical & Social Science | 4 (80.0%) | 1 (20.0%) |
| Community & Social Service | 0 (0.0%) | 17 (100.0%) |
| Education, Arts & Media | 0 (0.0%) | 0 (0.0%) |
| Legal Services & Support | 0 (0.0%) | 0 (0.0%) |
| Education Instruction & Library | 0 (0.0%) | 10 (100.0%) |
| Arts, Media & Entertainment | 0 (0.0%) | 7 (100.0%) |
| Health Diagnosing & Treating | 2 (33.3%) | 4 (66.7%) |
| Health Technologists | 2 (50.0%) | 2 (50.0%) |
| Total (Category) | 19 (27.1%) | 51 (72.9%) |
| Total (Overall) | 108 (48.9%) | 113 (51.1%) |
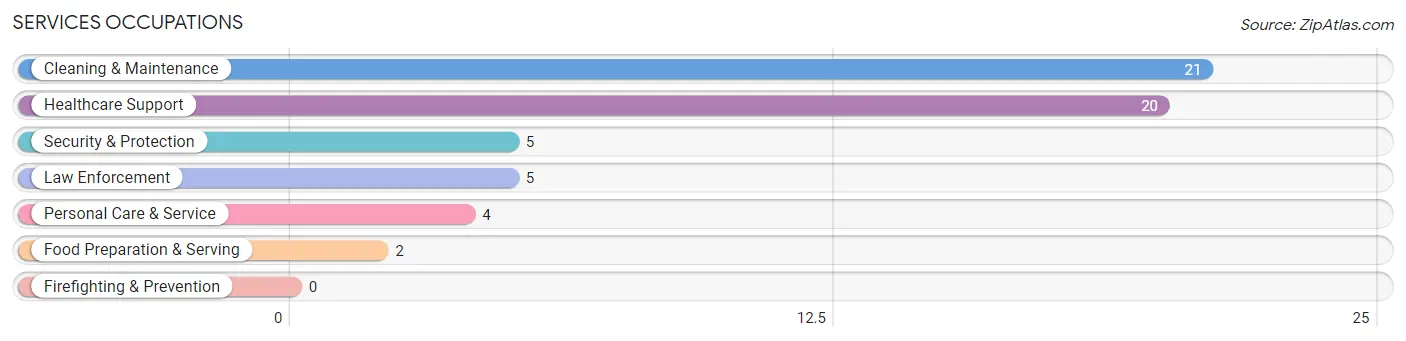
Services Occupations
The most common Services occupations in Tijeras are Cleaning & Maintenance (21 | 9.5%), Healthcare Support (20 | 9.0%), Security & Protection (5 | 2.3%), Law Enforcement (5 | 2.3%), and Personal Care & Service (4 | 1.8%).
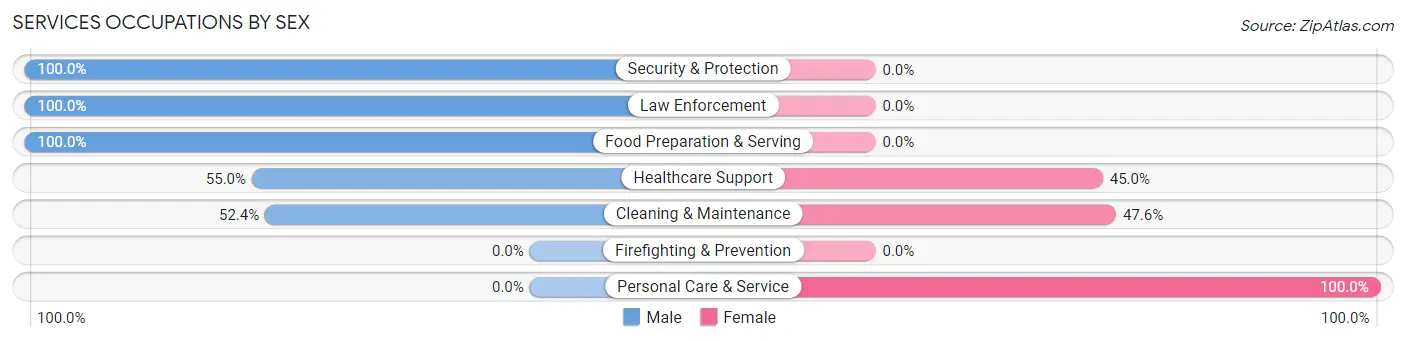
Services Occupations by Sex
Within the Services occupations in Tijeras, the most male-oriented occupations are Security & Protection (100.0%), Law Enforcement (100.0%), and Food Preparation & Serving (100.0%), while the most female-oriented occupations are Personal Care & Service (100.0%), Cleaning & Maintenance (47.6%), and Healthcare Support (45.0%).
| Occupation | Male | Female |
| Healthcare Support | 11 (55.0%) | 9 (45.0%) |
| Security & Protection | 5 (100.0%) | 0 (0.0%) |
| Firefighting & Prevention | 0 (0.0%) | 0 (0.0%) |
| Law Enforcement | 5 (100.0%) | 0 (0.0%) |
| Food Preparation & Serving | 2 (100.0%) | 0 (0.0%) |
| Cleaning & Maintenance | 11 (52.4%) | 10 (47.6%) |
| Personal Care & Service | 0 (0.0%) | 4 (100.0%) |
| Total (Category) | 29 (55.8%) | 23 (44.2%) |
| Total (Overall) | 108 (48.9%) | 113 (51.1%) |
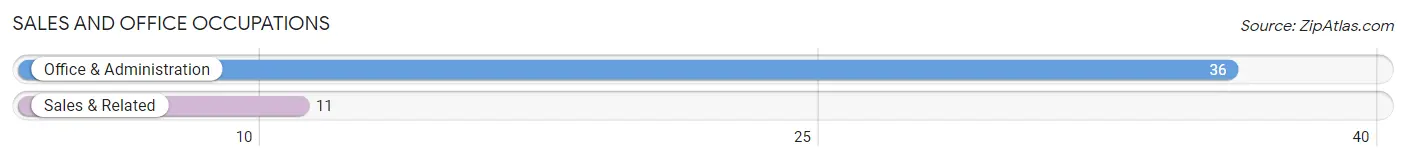
Sales and Office Occupations
The most common Sales and Office occupations in Tijeras are Office & Administration (36 | 16.3%), and Sales & Related (11 | 5.0%).
Sales and Office Occupations by Sex
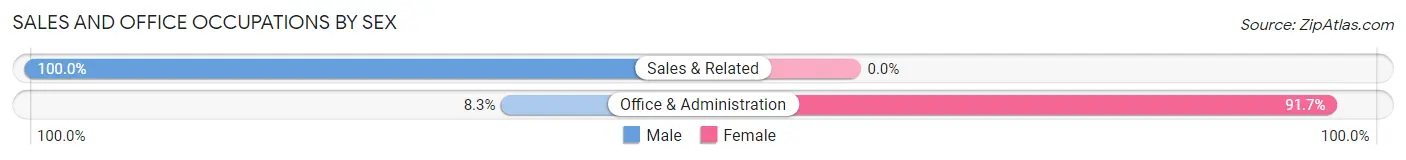
| Occupation | Male | Female |
| Sales & Related | 11 (100.0%) | 0 (0.0%) |
| Office & Administration | 3 (8.3%) | 33 (91.7%) |
| Total (Category) | 14 (29.8%) | 33 (70.2%) |
| Total (Overall) | 108 (48.9%) | 113 (51.1%) |
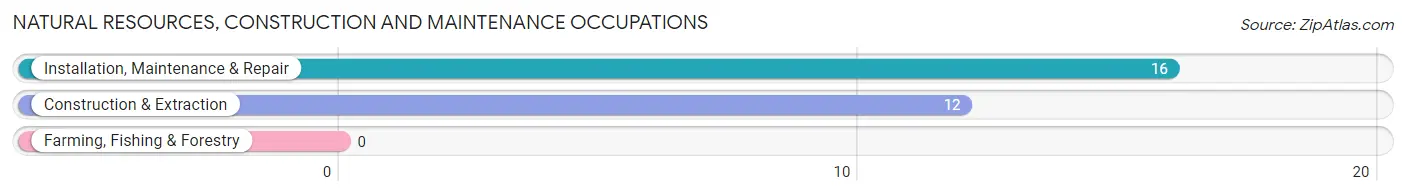
Natural Resources, Construction and Maintenance Occupations
The most common Natural Resources, Construction and Maintenance occupations in Tijeras are Installation, Maintenance & Repair (16 | 7.2%), and Construction & Extraction (12 | 5.4%).
Natural Resources, Construction and Maintenance Occupations by Sex
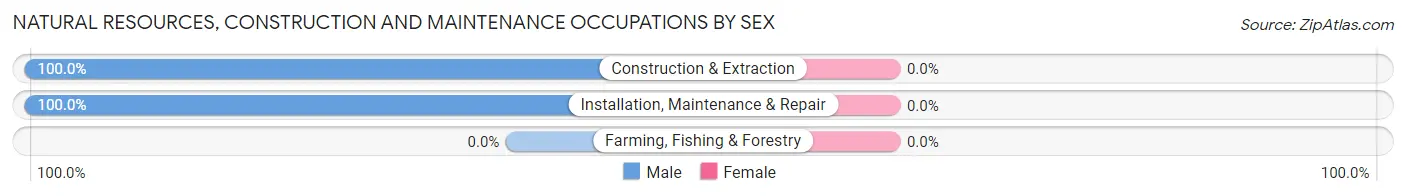
| Occupation | Male | Female |
| Farming, Fishing & Forestry | 0 (0.0%) | 0 (0.0%) |
| Construction & Extraction | 12 (100.0%) | 0 (0.0%) |
| Installation, Maintenance & Repair | 16 (100.0%) | 0 (0.0%) |
| Total (Category) | 28 (100.0%) | 0 (0.0%) |
| Total (Overall) | 108 (48.9%) | 113 (51.1%) |
Production, Transportation and Moving Occupations
The most common Production, Transportation and Moving occupations in Tijeras are Transportation (15 | 6.8%), and Production (9 | 4.1%).
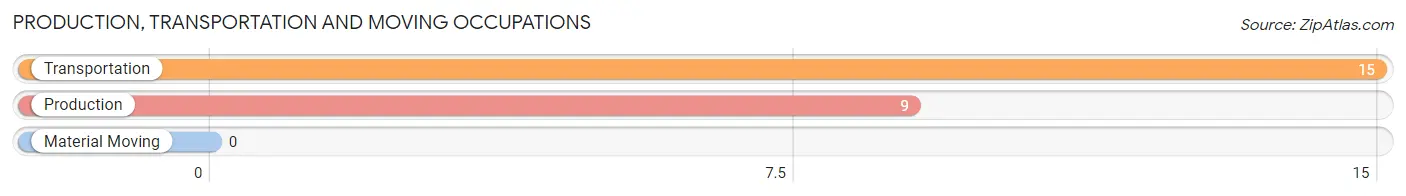
Production, Transportation and Moving Occupations by Sex
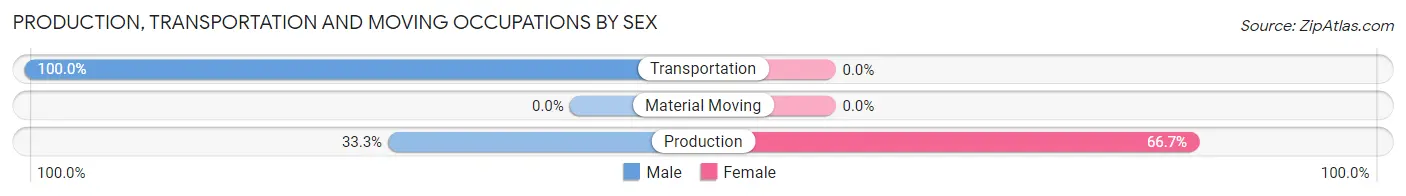
| Occupation | Male | Female |
| Production | 3 (33.3%) | 6 (66.7%) |
| Transportation | 15 (100.0%) | 0 (0.0%) |
| Material Moving | 0 (0.0%) | 0 (0.0%) |
| Total (Category) | 18 (75.0%) | 6 (25.0%) |
| Total (Overall) | 108 (48.9%) | 113 (51.1%) |
Employment Industries by Sex in Tijeras
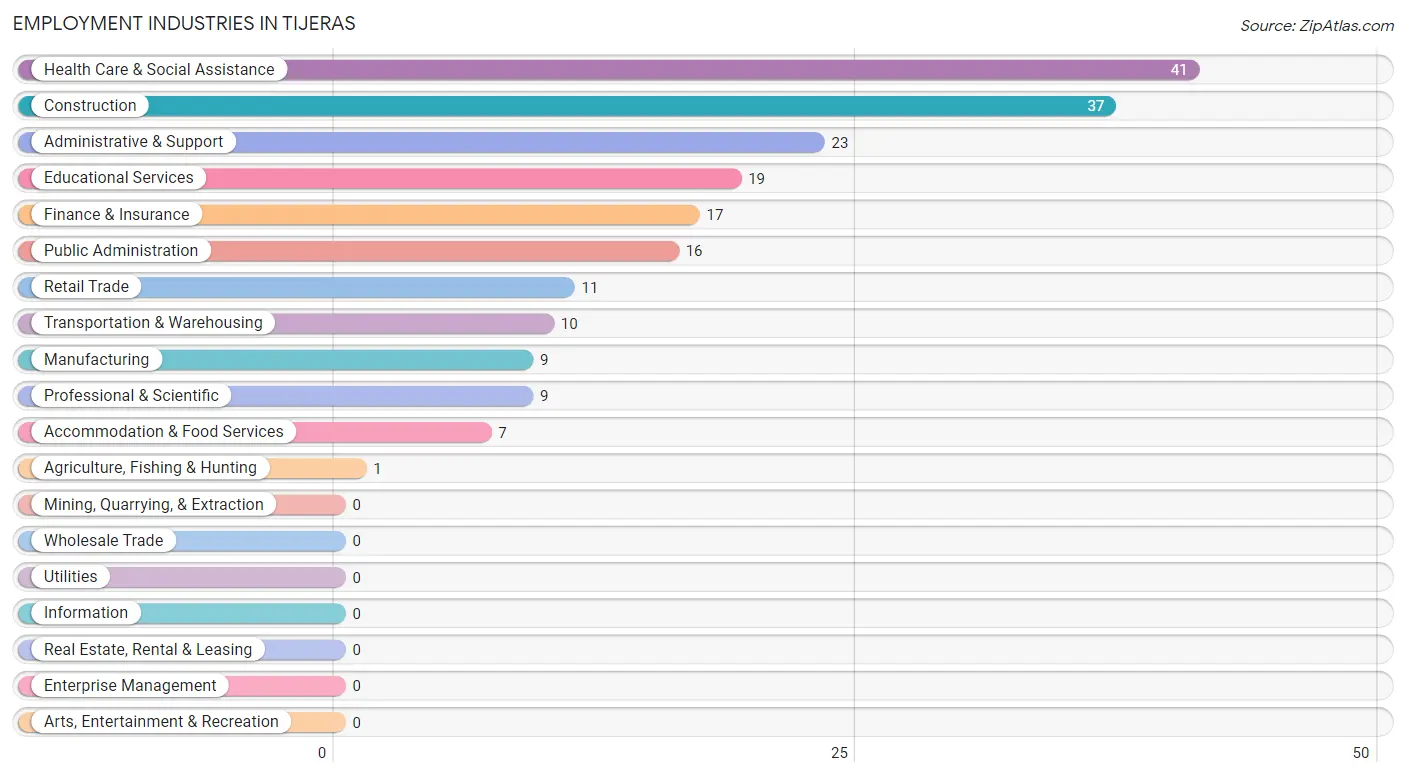
Employment Industries in Tijeras
The major employment industries in Tijeras include Health Care & Social Assistance (41 | 18.5%), Construction (37 | 16.7%), Administrative & Support (23 | 10.4%), Educational Services (19 | 8.6%), and Finance & Insurance (17 | 7.7%).
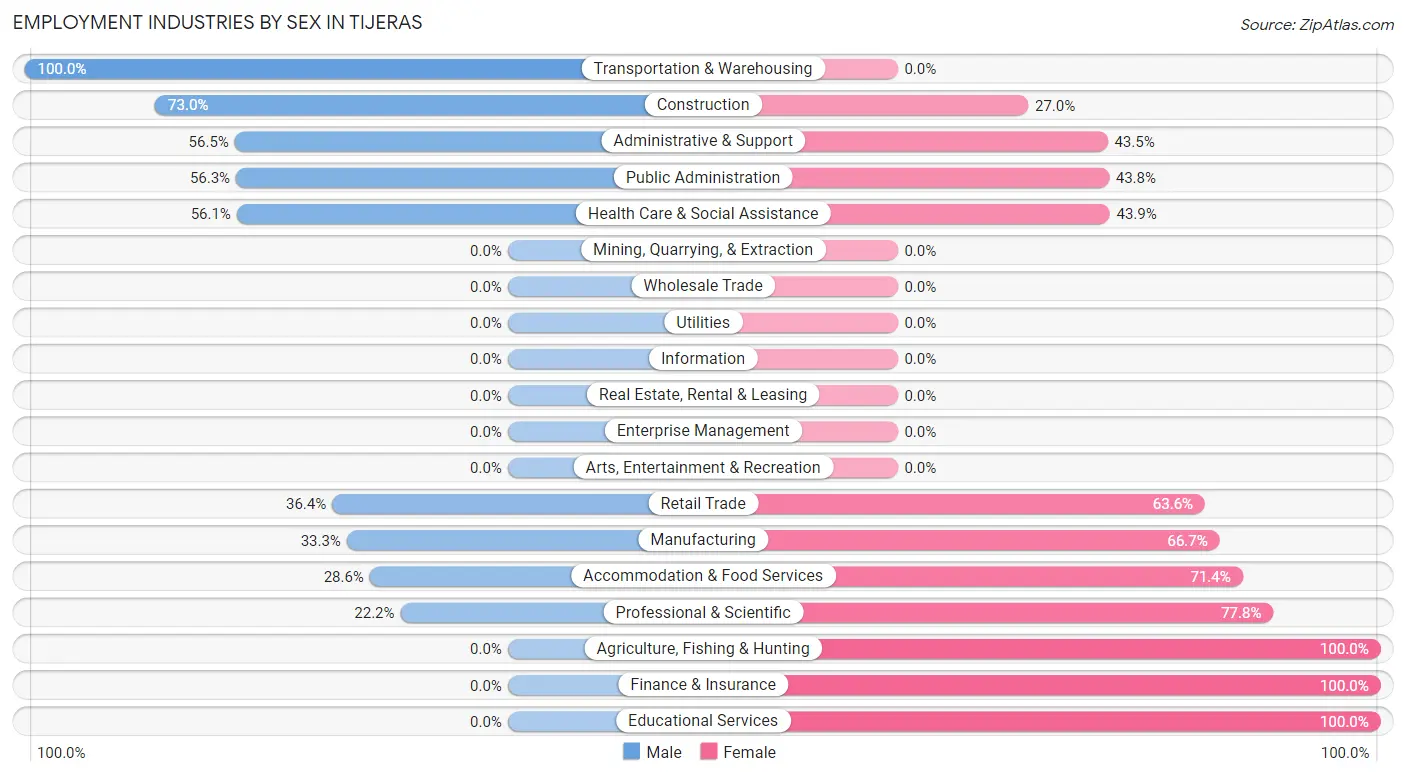
Employment Industries by Sex in Tijeras
The Tijeras industries that see more men than women are Transportation & Warehousing (100.0%), Construction (73.0%), and Administrative & Support (56.5%), whereas the industries that tend to have a higher number of women are Agriculture, Fishing & Hunting (100.0%), Finance & Insurance (100.0%), and Educational Services (100.0%).
| Industry | Male | Female |
| Agriculture, Fishing & Hunting | 0 (0.0%) | 1 (100.0%) |
| Mining, Quarrying, & Extraction | 0 (0.0%) | 0 (0.0%) |
| Construction | 27 (73.0%) | 10 (27.0%) |
| Manufacturing | 3 (33.3%) | 6 (66.7%) |
| Wholesale Trade | 0 (0.0%) | 0 (0.0%) |
| Retail Trade | 4 (36.4%) | 7 (63.6%) |
| Transportation & Warehousing | 10 (100.0%) | 0 (0.0%) |
| Utilities | 0 (0.0%) | 0 (0.0%) |
| Information | 0 (0.0%) | 0 (0.0%) |
| Finance & Insurance | 0 (0.0%) | 17 (100.0%) |
| Real Estate, Rental & Leasing | 0 (0.0%) | 0 (0.0%) |
| Professional & Scientific | 2 (22.2%) | 7 (77.8%) |
| Enterprise Management | 0 (0.0%) | 0 (0.0%) |
| Administrative & Support | 13 (56.5%) | 10 (43.5%) |
| Educational Services | 0 (0.0%) | 19 (100.0%) |
| Health Care & Social Assistance | 23 (56.1%) | 18 (43.9%) |
| Arts, Entertainment & Recreation | 0 (0.0%) | 0 (0.0%) |
| Accommodation & Food Services | 2 (28.6%) | 5 (71.4%) |
| Public Administration | 9 (56.2%) | 7 (43.8%) |
| Total | 108 (48.9%) | 113 (51.1%) |
Education in Tijeras
School Enrollment in Tijeras
The most common levels of schooling among the 132 students in Tijeras are kindergarten (50 | 37.9%), college / undergraduate (29 | 22.0%), and elementary school (22 | 16.7%).
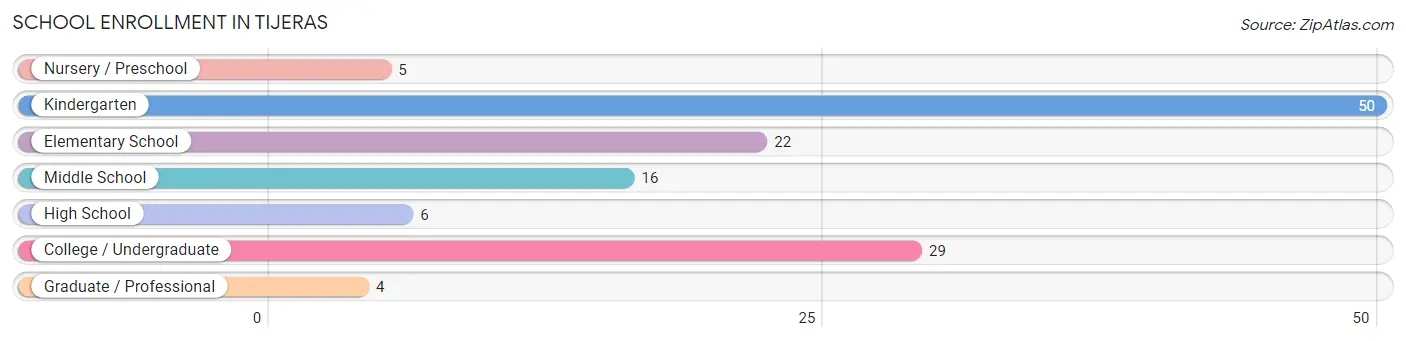
| School Level | # Students | % Students |
| Nursery / Preschool | 5 | 3.8% |
| Kindergarten | 50 | 37.9% |
| Elementary School | 22 | 16.7% |
| Middle School | 16 | 12.1% |
| High School | 6 | 4.5% |
| College / Undergraduate | 29 | 22.0% |
| Graduate / Professional | 4 | 3.0% |
| Total | 132 | 100.0% |
School Enrollment by Age by Funding Source in Tijeras
Out of a total of 132 students who are enrolled in schools in Tijeras, 60 (45.5%) attend a private institution, while the remaining 72 (54.5%) are enrolled in public schools. The age group of 3 to 4 year olds has the highest likelihood of being enrolled in private schools, with 3 (100.0% in the age bracket) enrolled. Conversely, the age group of 18 to 19 year olds has the lowest likelihood of being enrolled in a private school, with 2 (100.0% in the age bracket) attending a public institution.
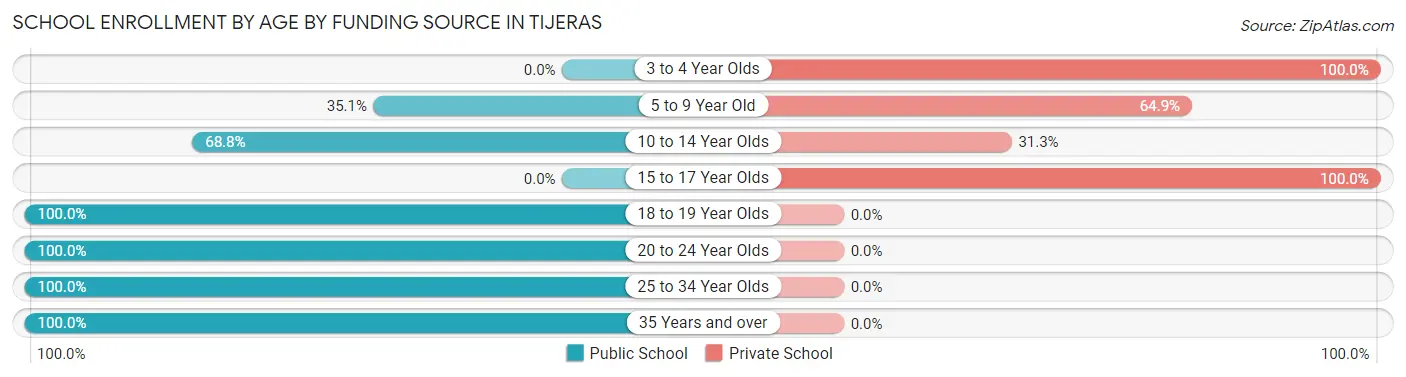
| Age Bracket | Public School | Private School |
| 3 to 4 Year Olds | 0 (0.0%) | 3 (100.0%) |
| 5 to 9 Year Old | 26 (35.1%) | 48 (64.9%) |
| 10 to 14 Year Olds | 11 (68.8%) | 5 (31.2%) |
| 15 to 17 Year Olds | 0 (0.0%) | 4 (100.0%) |
| 18 to 19 Year Olds | 2 (100.0%) | 0 (0.0%) |
| 20 to 24 Year Olds | 25 (100.0%) | 0 (0.0%) |
| 25 to 34 Year Olds | 6 (100.0%) | 0 (0.0%) |
| 35 Years and over | 2 (100.0%) | 0 (0.0%) |
| Total | 72 (54.5%) | 60 (45.5%) |
Educational Attainment by Field of Study in Tijeras
Psychology (24 | 25.5%), social sciences (20 | 21.3%), business (14 | 14.9%), education (8 | 8.5%), and literature & languages (8 | 8.5%) are the most common fields of study among 94 individuals in Tijeras who have obtained a bachelor's degree or higher.
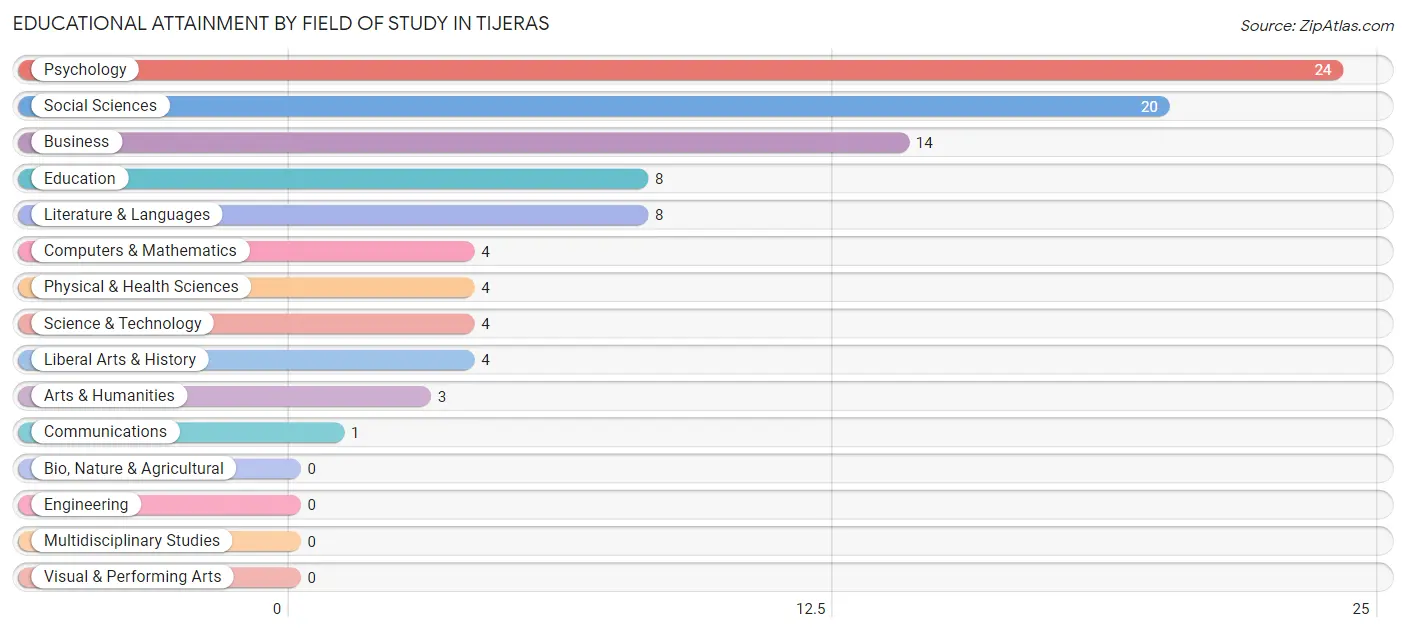
| Field of Study | # Graduates | % Graduates |
| Computers & Mathematics | 4 | 4.3% |
| Bio, Nature & Agricultural | 0 | 0.0% |
| Physical & Health Sciences | 4 | 4.3% |
| Psychology | 24 | 25.5% |
| Social Sciences | 20 | 21.3% |
| Engineering | 0 | 0.0% |
| Multidisciplinary Studies | 0 | 0.0% |
| Science & Technology | 4 | 4.3% |
| Business | 14 | 14.9% |
| Education | 8 | 8.5% |
| Literature & Languages | 8 | 8.5% |
| Liberal Arts & History | 4 | 4.3% |
| Visual & Performing Arts | 0 | 0.0% |
| Communications | 1 | 1.1% |
| Arts & Humanities | 3 | 3.2% |
| Total | 94 | 100.0% |
Transportation & Commute in Tijeras
Vehicle Availability by Sex in Tijeras
The most prevalent vehicle ownership categories in Tijeras are males with 2 vehicles (37, accounting for 34.3%) and females with 2 vehicles (36, making up 32.7%).
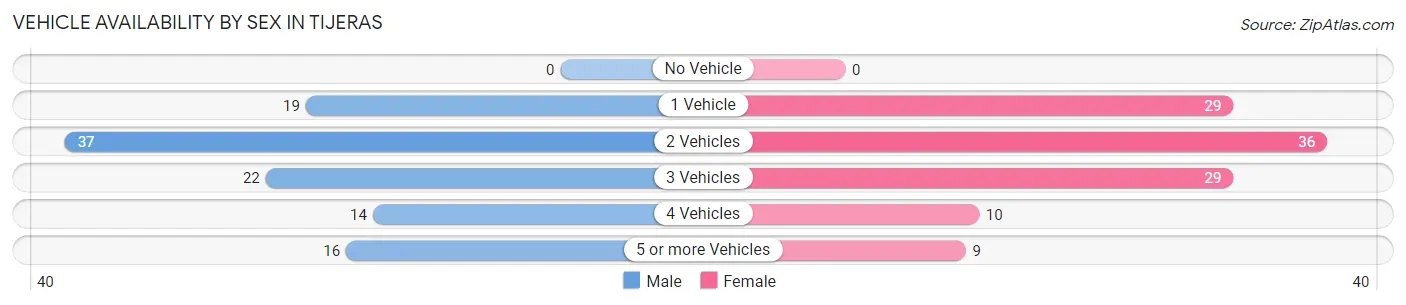
| Vehicles Available | Male | Female |
| No Vehicle | 0 (0.0%) | 0 (0.0%) |
| 1 Vehicle | 19 (17.6%) | 29 (25.7%) |
| 2 Vehicles | 37 (34.3%) | 36 (31.9%) |
| 3 Vehicles | 22 (20.4%) | 29 (25.7%) |
| 4 Vehicles | 14 (13.0%) | 10 (8.8%) |
| 5 or more Vehicles | 16 (14.8%) | 9 (8.0%) |
| Total | 108 (100.0%) | 113 (100.0%) |
Commute Time in Tijeras
The most frequently occuring commute durations in Tijeras are 30 to 34 minutes (43 commuters, 23.6%), 20 to 24 minutes (28 commuters, 15.4%), and 25 to 29 minutes (22 commuters, 12.1%).
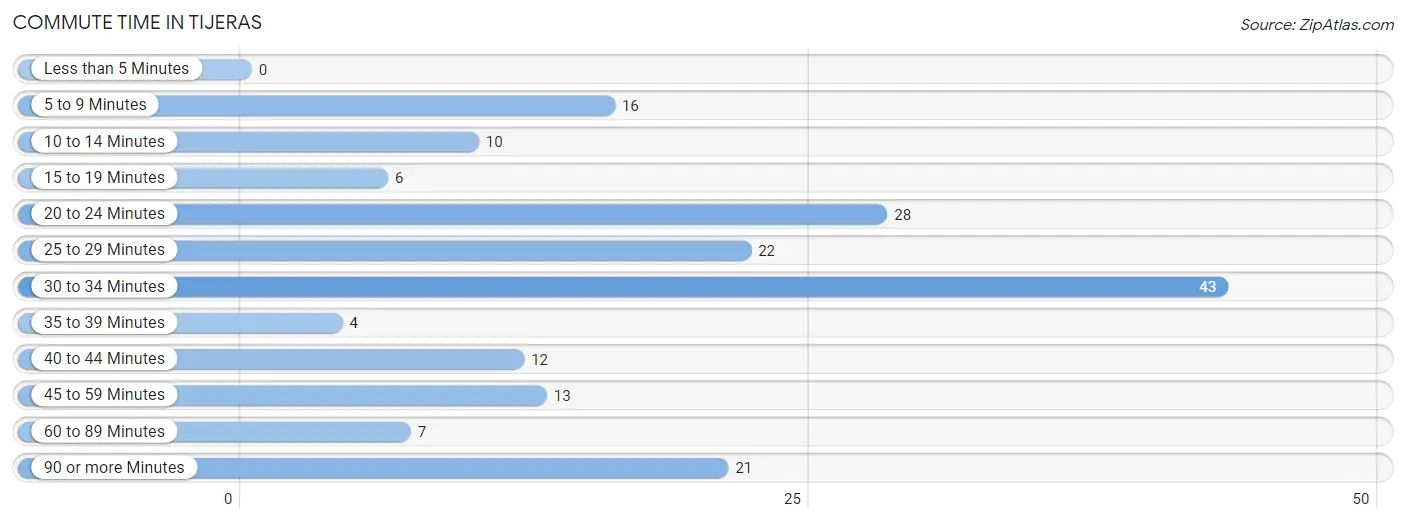
| Commute Time | # Commuters | % Commuters |
| Less than 5 Minutes | 0 | 0.0% |
| 5 to 9 Minutes | 16 | 8.8% |
| 10 to 14 Minutes | 10 | 5.5% |
| 15 to 19 Minutes | 6 | 3.3% |
| 20 to 24 Minutes | 28 | 15.4% |
| 25 to 29 Minutes | 22 | 12.1% |
| 30 to 34 Minutes | 43 | 23.6% |
| 35 to 39 Minutes | 4 | 2.2% |
| 40 to 44 Minutes | 12 | 6.6% |
| 45 to 59 Minutes | 13 | 7.1% |
| 60 to 89 Minutes | 7 | 3.8% |
| 90 or more Minutes | 21 | 11.5% |
Commute Time by Sex in Tijeras
The most common commute times in Tijeras are 30 to 34 minutes (22 commuters, 25.3%) for males and 20 to 24 minutes (22 commuters, 23.2%) for females.
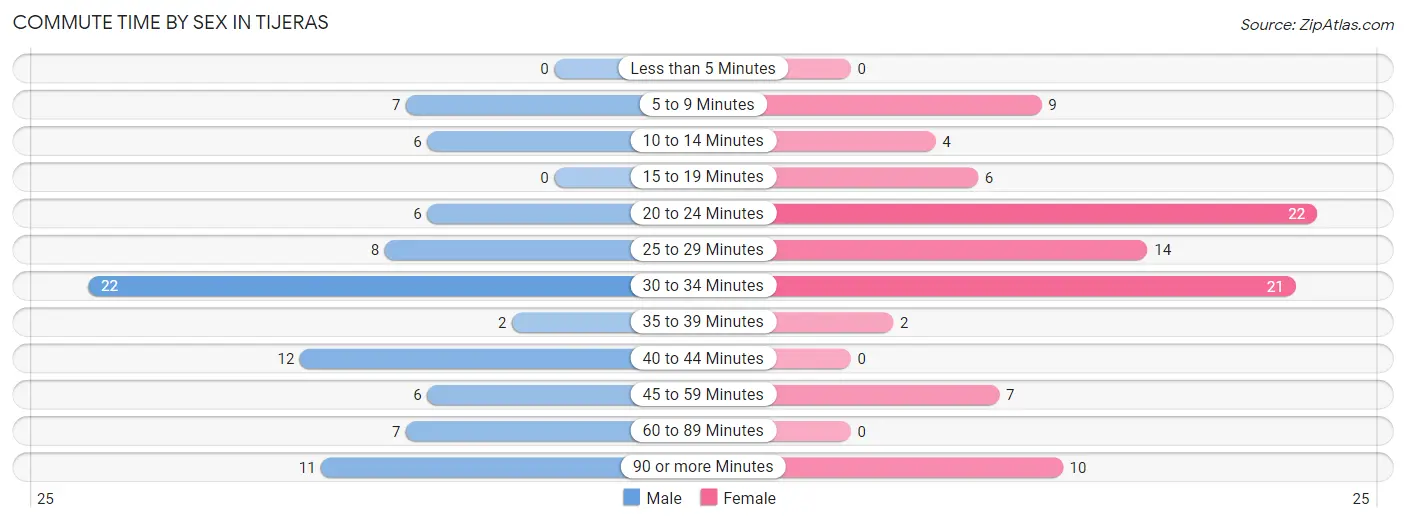
| Commute Time | Male | Female |
| Less than 5 Minutes | 0 (0.0%) | 0 (0.0%) |
| 5 to 9 Minutes | 7 (8.1%) | 9 (9.5%) |
| 10 to 14 Minutes | 6 (6.9%) | 4 (4.2%) |
| 15 to 19 Minutes | 0 (0.0%) | 6 (6.3%) |
| 20 to 24 Minutes | 6 (6.9%) | 22 (23.2%) |
| 25 to 29 Minutes | 8 (9.2%) | 14 (14.7%) |
| 30 to 34 Minutes | 22 (25.3%) | 21 (22.1%) |
| 35 to 39 Minutes | 2 (2.3%) | 2 (2.1%) |
| 40 to 44 Minutes | 12 (13.8%) | 0 (0.0%) |
| 45 to 59 Minutes | 6 (6.9%) | 7 (7.4%) |
| 60 to 89 Minutes | 7 (8.1%) | 0 (0.0%) |
| 90 or more Minutes | 11 (12.6%) | 10 (10.5%) |
Time of Departure to Work by Sex in Tijeras
The most frequent times of departure to work in Tijeras are 6:30 AM to 6:59 AM (24, 27.6%) for males and 7:00 AM to 7:29 AM (27, 28.4%) for females.
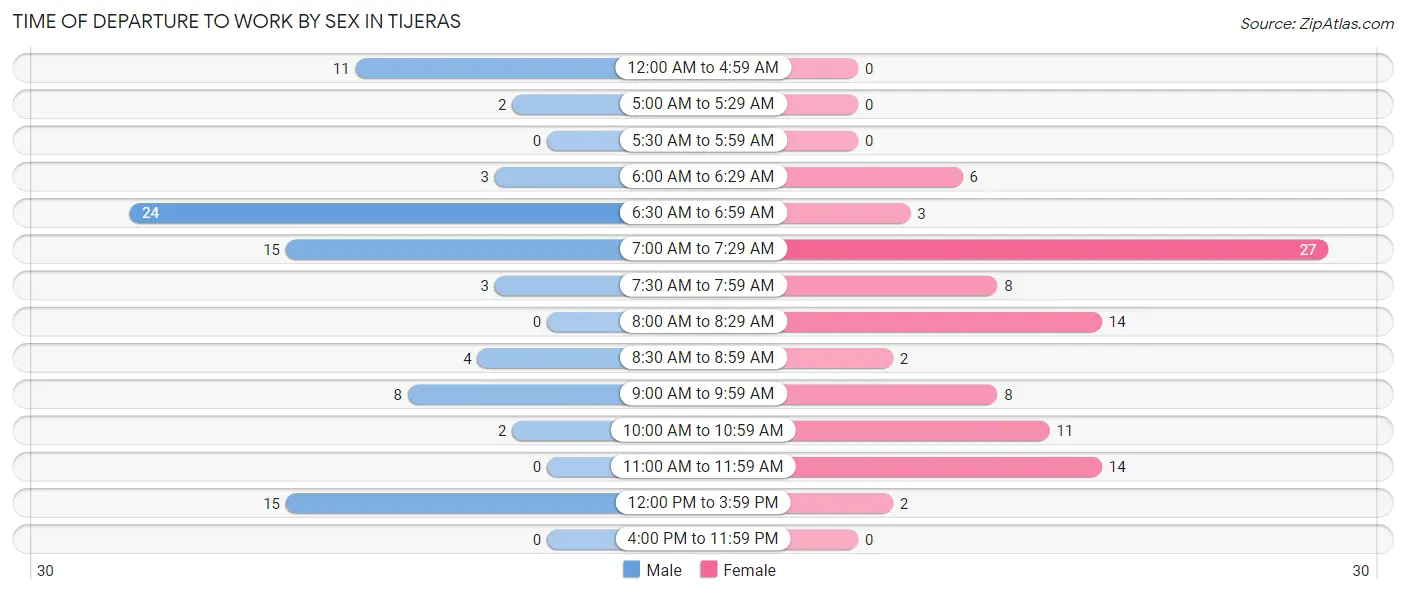
| Time of Departure | Male | Female |
| 12:00 AM to 4:59 AM | 11 (12.6%) | 0 (0.0%) |
| 5:00 AM to 5:29 AM | 2 (2.3%) | 0 (0.0%) |
| 5:30 AM to 5:59 AM | 0 (0.0%) | 0 (0.0%) |
| 6:00 AM to 6:29 AM | 3 (3.5%) | 6 (6.3%) |
| 6:30 AM to 6:59 AM | 24 (27.6%) | 3 (3.2%) |
| 7:00 AM to 7:29 AM | 15 (17.2%) | 27 (28.4%) |
| 7:30 AM to 7:59 AM | 3 (3.5%) | 8 (8.4%) |
| 8:00 AM to 8:29 AM | 0 (0.0%) | 14 (14.7%) |
| 8:30 AM to 8:59 AM | 4 (4.6%) | 2 (2.1%) |
| 9:00 AM to 9:59 AM | 8 (9.2%) | 8 (8.4%) |
| 10:00 AM to 10:59 AM | 2 (2.3%) | 11 (11.6%) |
| 11:00 AM to 11:59 AM | 0 (0.0%) | 14 (14.7%) |
| 12:00 PM to 3:59 PM | 15 (17.2%) | 2 (2.1%) |
| 4:00 PM to 11:59 PM | 0 (0.0%) | 0 (0.0%) |
| Total | 87 (100.0%) | 95 (100.0%) |
Housing Occupancy in Tijeras
Occupancy by Ownership in Tijeras
Of the total 218 dwellings in Tijeras, owner-occupied units account for 167 (76.6%), while renter-occupied units make up 51 (23.4%).
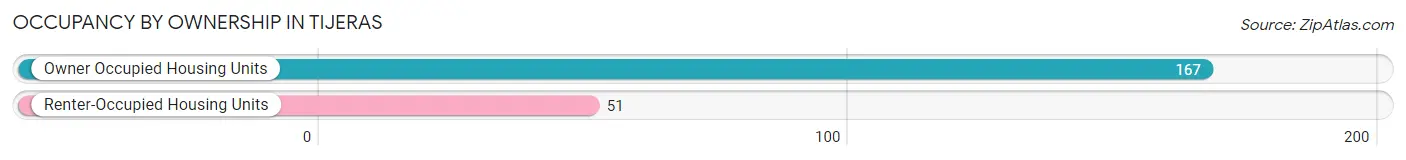
| Occupancy | # Housing Units | % Housing Units |
| Owner Occupied Housing Units | 167 | 76.6% |
| Renter-Occupied Housing Units | 51 | 23.4% |
| Total Occupied Housing Units | 218 | 100.0% |
Occupancy by Household Size in Tijeras
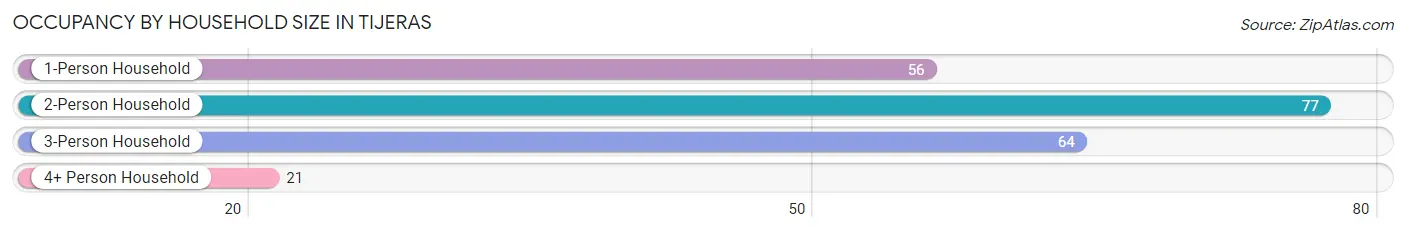
| Household Size | # Housing Units | % Housing Units |
| 1-Person Household | 56 | 25.7% |
| 2-Person Household | 77 | 35.3% |
| 3-Person Household | 64 | 29.4% |
| 4+ Person Household | 21 | 9.6% |
| Total Housing Units | 218 | 100.0% |
Occupancy by Ownership by Household Size in Tijeras
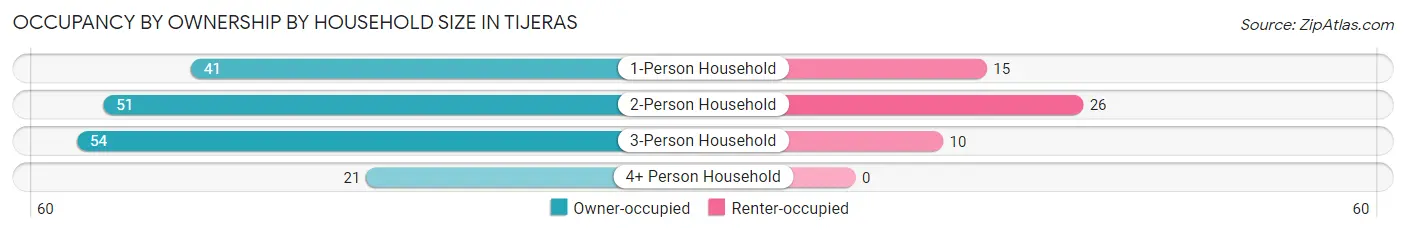
| Household Size | Owner-occupied | Renter-occupied |
| 1-Person Household | 41 (73.2%) | 15 (26.8%) |
| 2-Person Household | 51 (66.2%) | 26 (33.8%) |
| 3-Person Household | 54 (84.4%) | 10 (15.6%) |
| 4+ Person Household | 21 (100.0%) | 0 (0.0%) |
| Total Housing Units | 167 (76.6%) | 51 (23.4%) |
Occupancy by Educational Attainment in Tijeras
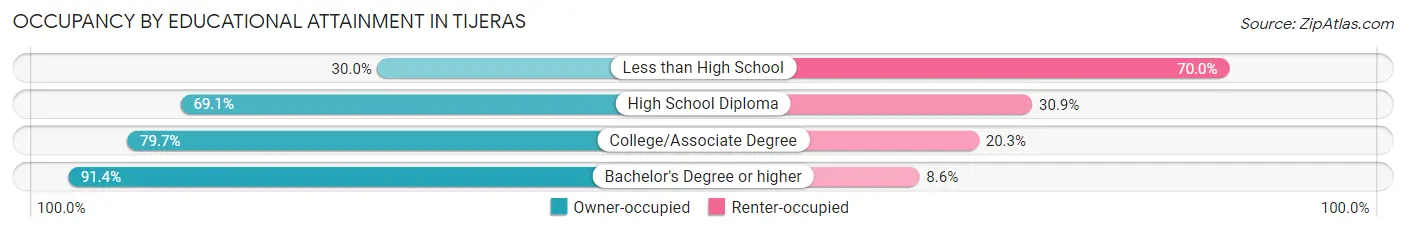
| Household Size | Owner-occupied | Renter-occupied |
| Less than High School | 3 (30.0%) | 7 (70.0%) |
| High School Diploma | 38 (69.1%) | 17 (30.9%) |
| College/Associate Degree | 94 (79.7%) | 24 (20.3%) |
| Bachelor's Degree or higher | 32 (91.4%) | 3 (8.6%) |
Occupancy by Age of Householder in Tijeras
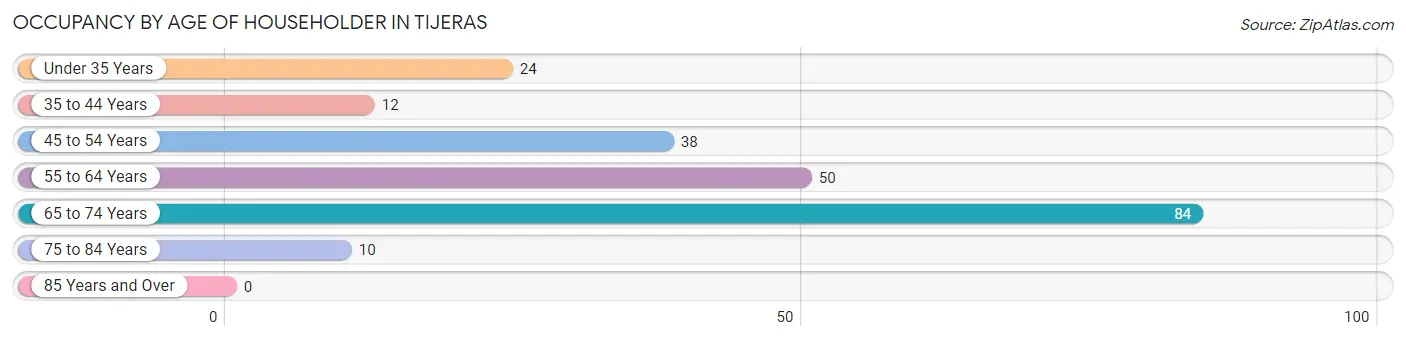
| Age Bracket | # Households | % Households |
| Under 35 Years | 24 | 11.0% |
| 35 to 44 Years | 12 | 5.5% |
| 45 to 54 Years | 38 | 17.4% |
| 55 to 64 Years | 50 | 22.9% |
| 65 to 74 Years | 84 | 38.5% |
| 75 to 84 Years | 10 | 4.6% |
| 85 Years and Over | 0 | 0.0% |
| Total | 218 | 100.0% |
Housing Finances in Tijeras
Median Income by Occupancy in Tijeras
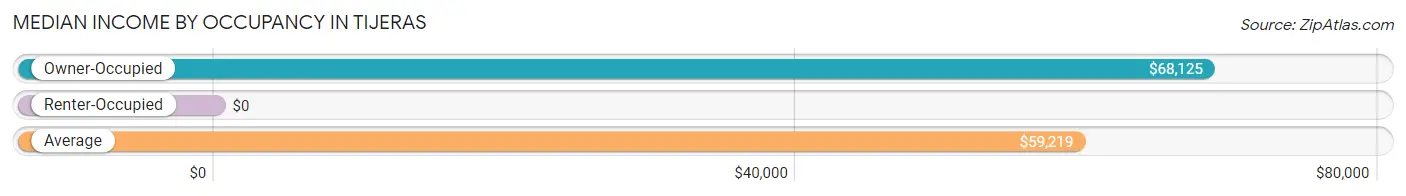
| Occupancy Type | # Households | Median Income |
| Owner-Occupied | 167 (76.6%) | $68,125 |
| Renter-Occupied | 51 (23.4%) | $0 |
| Average | 218 (100.0%) | $59,219 |
Occupancy by Householder Income Bracket in Tijeras
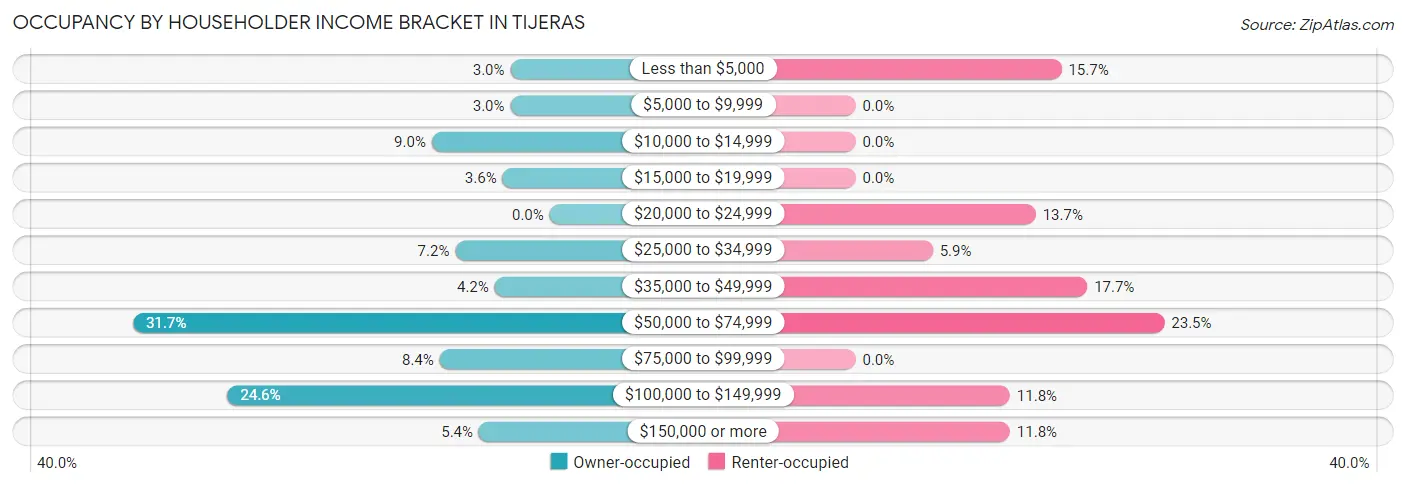
| Income Bracket | Owner-occupied | Renter-occupied |
| Less than $5,000 | 5 (3.0%) | 8 (15.7%) |
| $5,000 to $9,999 | 5 (3.0%) | 0 (0.0%) |
| $10,000 to $14,999 | 15 (9.0%) | 0 (0.0%) |
| $15,000 to $19,999 | 6 (3.6%) | 0 (0.0%) |
| $20,000 to $24,999 | 0 (0.0%) | 7 (13.7%) |
| $25,000 to $34,999 | 12 (7.2%) | 3 (5.9%) |
| $35,000 to $49,999 | 7 (4.2%) | 9 (17.6%) |
| $50,000 to $74,999 | 53 (31.7%) | 12 (23.5%) |
| $75,000 to $99,999 | 14 (8.4%) | 0 (0.0%) |
| $100,000 to $149,999 | 41 (24.5%) | 6 (11.8%) |
| $150,000 or more | 9 (5.4%) | 6 (11.8%) |
| Total | 167 (100.0%) | 51 (100.0%) |
Monthly Housing Cost Tiers in Tijeras
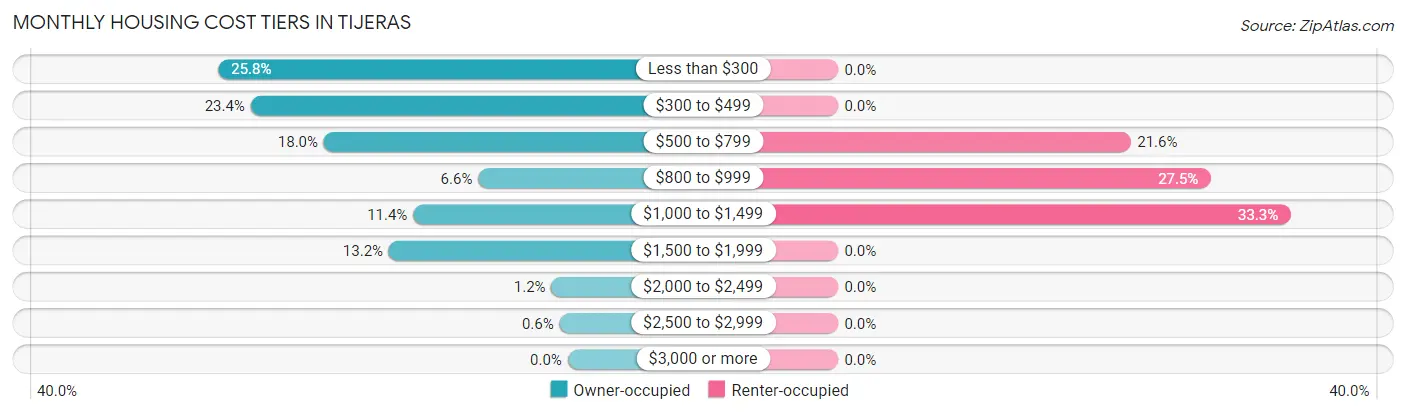
| Monthly Cost | Owner-occupied | Renter-occupied |
| Less than $300 | 43 (25.8%) | 0 (0.0%) |
| $300 to $499 | 39 (23.4%) | 0 (0.0%) |
| $500 to $799 | 30 (18.0%) | 11 (21.6%) |
| $800 to $999 | 11 (6.6%) | 14 (27.5%) |
| $1,000 to $1,499 | 19 (11.4%) | 17 (33.3%) |
| $1,500 to $1,999 | 22 (13.2%) | 0 (0.0%) |
| $2,000 to $2,499 | 2 (1.2%) | 0 (0.0%) |
| $2,500 to $2,999 | 1 (0.6%) | 0 (0.0%) |
| $3,000 or more | 0 (0.0%) | 0 (0.0%) |
| Total | 167 (100.0%) | 51 (100.0%) |
Physical Housing Characteristics in Tijeras
Housing Structures in Tijeras
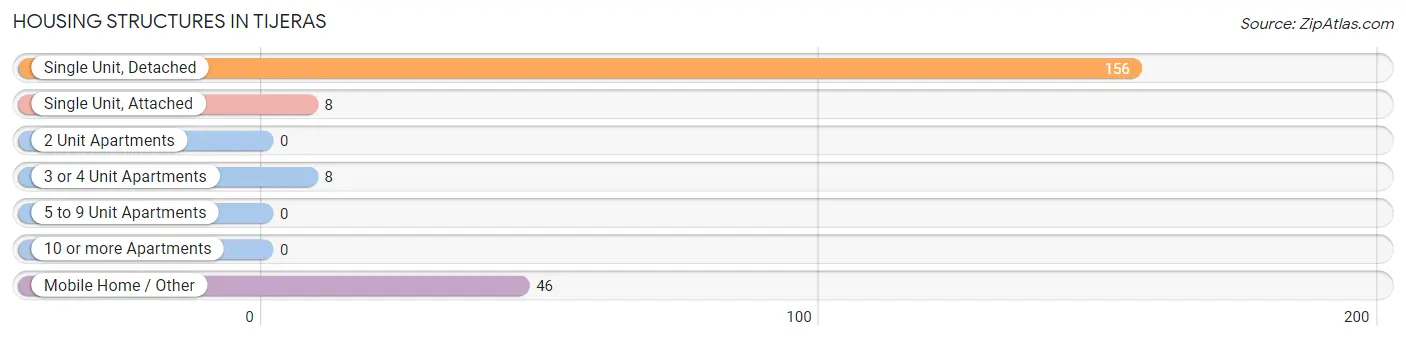
| Structure Type | # Housing Units | % Housing Units |
| Single Unit, Detached | 156 | 71.6% |
| Single Unit, Attached | 8 | 3.7% |
| 2 Unit Apartments | 0 | 0.0% |
| 3 or 4 Unit Apartments | 8 | 3.7% |
| 5 to 9 Unit Apartments | 0 | 0.0% |
| 10 or more Apartments | 0 | 0.0% |
| Mobile Home / Other | 46 | 21.1% |
| Total | 218 | 100.0% |
Housing Structures by Occupancy in Tijeras
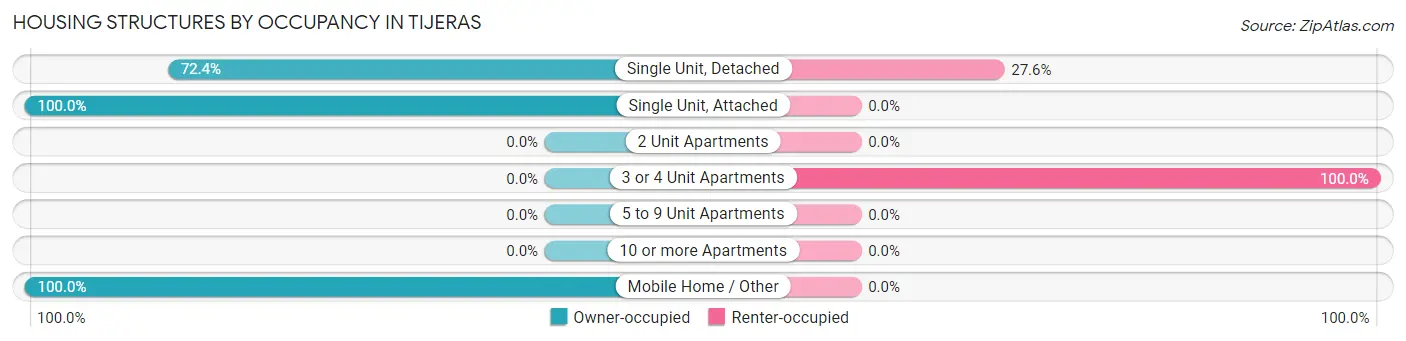
| Structure Type | Owner-occupied | Renter-occupied |
| Single Unit, Detached | 113 (72.4%) | 43 (27.6%) |
| Single Unit, Attached | 8 (100.0%) | 0 (0.0%) |
| 2 Unit Apartments | 0 (0.0%) | 0 (0.0%) |
| 3 or 4 Unit Apartments | 0 (0.0%) | 8 (100.0%) |
| 5 to 9 Unit Apartments | 0 (0.0%) | 0 (0.0%) |
| 10 or more Apartments | 0 (0.0%) | 0 (0.0%) |
| Mobile Home / Other | 46 (100.0%) | 0 (0.0%) |
| Total | 167 (76.6%) | 51 (23.4%) |
Housing Structures by Number of Rooms in Tijeras
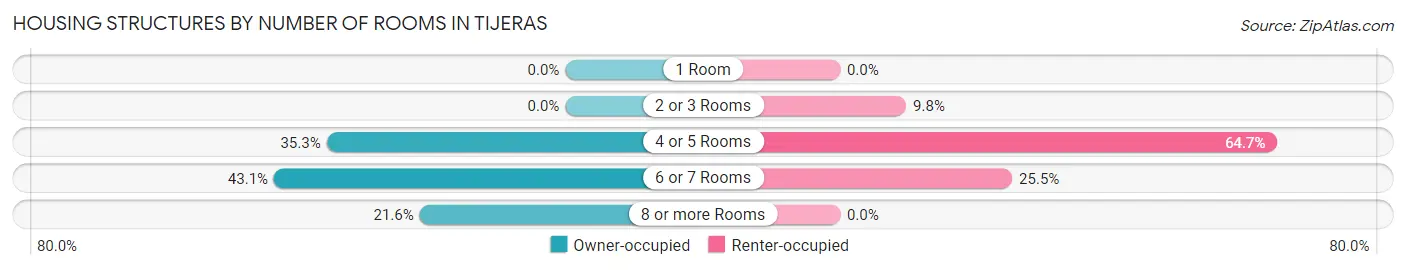
| Number of Rooms | Owner-occupied | Renter-occupied |
| 1 Room | 0 (0.0%) | 0 (0.0%) |
| 2 or 3 Rooms | 0 (0.0%) | 5 (9.8%) |
| 4 or 5 Rooms | 59 (35.3%) | 33 (64.7%) |
| 6 or 7 Rooms | 72 (43.1%) | 13 (25.5%) |
| 8 or more Rooms | 36 (21.6%) | 0 (0.0%) |
| Total | 167 (100.0%) | 51 (100.0%) |
Housing Structure by Heating Type in Tijeras
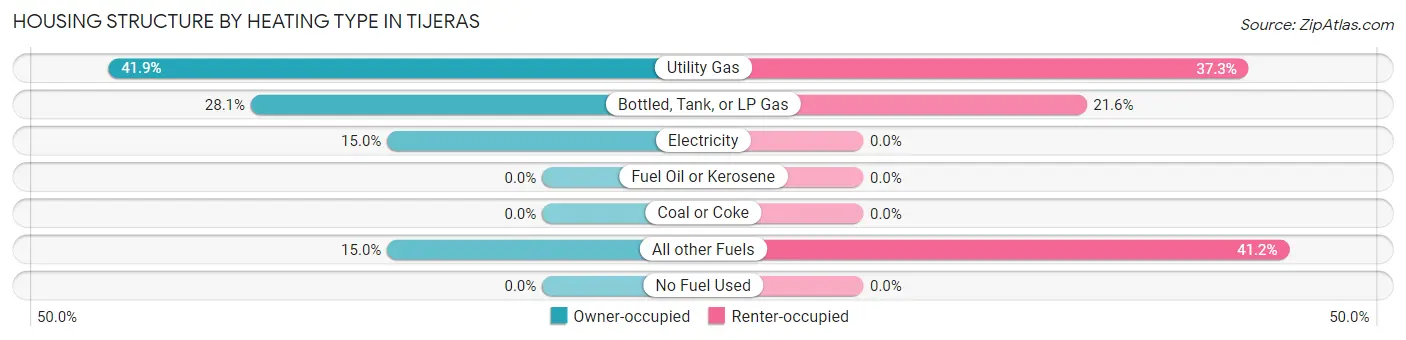
| Heating Type | Owner-occupied | Renter-occupied |
| Utility Gas | 70 (41.9%) | 19 (37.2%) |
| Bottled, Tank, or LP Gas | 47 (28.1%) | 11 (21.6%) |
| Electricity | 25 (15.0%) | 0 (0.0%) |
| Fuel Oil or Kerosene | 0 (0.0%) | 0 (0.0%) |
| Coal or Coke | 0 (0.0%) | 0 (0.0%) |
| All other Fuels | 25 (15.0%) | 21 (41.2%) |
| No Fuel Used | 0 (0.0%) | 0 (0.0%) |
| Total | 167 (100.0%) | 51 (100.0%) |
Household Vehicle Usage in Tijeras
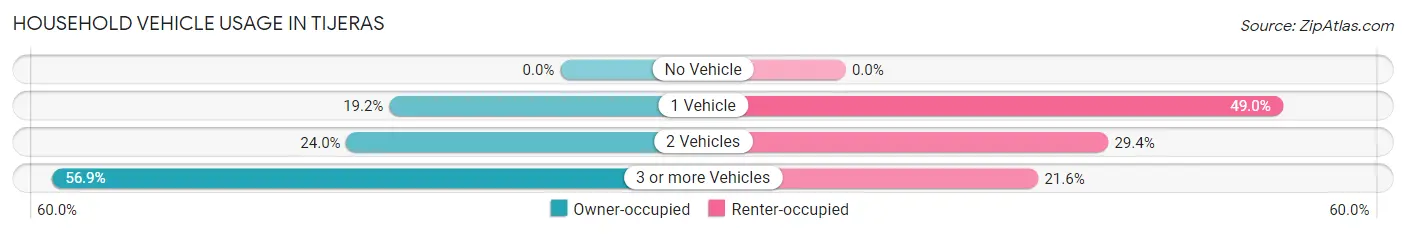
| Vehicles per Household | Owner-occupied | Renter-occupied |
| No Vehicle | 0 (0.0%) | 0 (0.0%) |
| 1 Vehicle | 32 (19.2%) | 25 (49.0%) |
| 2 Vehicles | 40 (23.9%) | 15 (29.4%) |
| 3 or more Vehicles | 95 (56.9%) | 11 (21.6%) |
| Total | 167 (100.0%) | 51 (100.0%) |
Real Estate & Mortgages in Tijeras
Real Estate and Mortgage Overview in Tijeras
| Characteristic | Without Mortgage | With Mortgage |
| Housing Units | 95 | 72 |
| Median Property Value | $230,200 | $250,000 |
| Median Household Income | $58,424 | $2 |
| Monthly Housing Costs | $345 | $0 |
| Real Estate Taxes | $1,153 | $4 |
Property Value by Mortgage Status in Tijeras
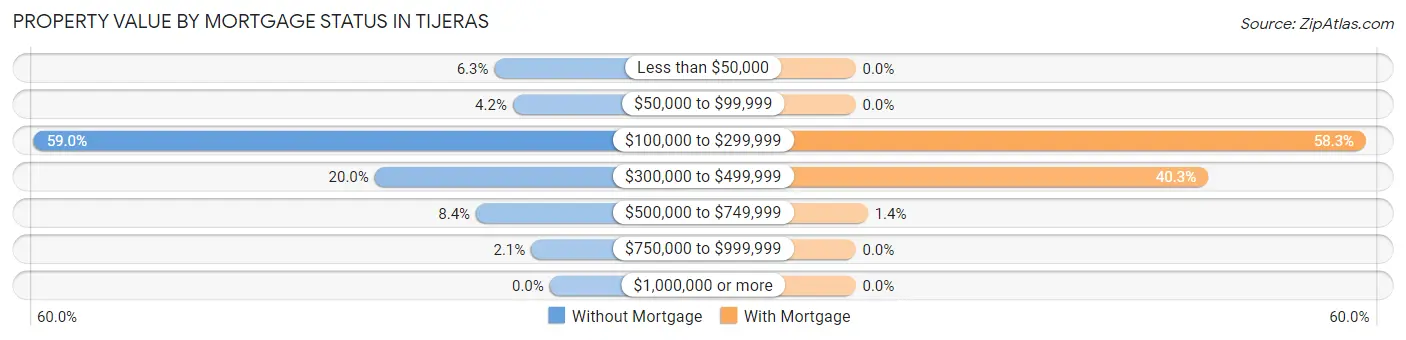
| Property Value | Without Mortgage | With Mortgage |
| Less than $50,000 | 6 (6.3%) | 0 (0.0%) |
| $50,000 to $99,999 | 4 (4.2%) | 0 (0.0%) |
| $100,000 to $299,999 | 56 (59.0%) | 42 (58.3%) |
| $300,000 to $499,999 | 19 (20.0%) | 29 (40.3%) |
| $500,000 to $749,999 | 8 (8.4%) | 1 (1.4%) |
| $750,000 to $999,999 | 2 (2.1%) | 0 (0.0%) |
| $1,000,000 or more | 0 (0.0%) | 0 (0.0%) |
| Total | 95 (100.0%) | 72 (100.0%) |
Household Income by Mortgage Status in Tijeras
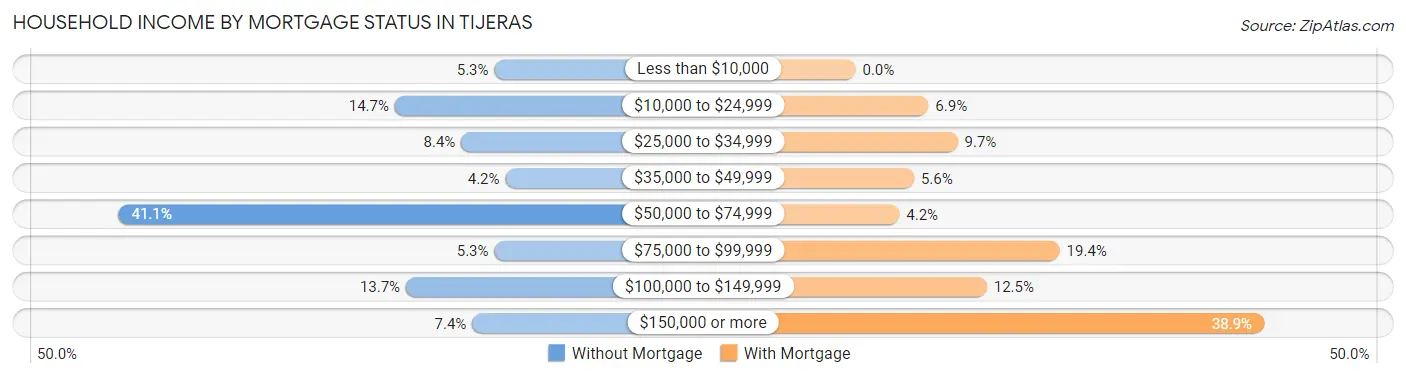
| Household Income | Without Mortgage | With Mortgage |
| Less than $10,000 | 5 (5.3%) | 0 (0.0%) |
| $10,000 to $24,999 | 14 (14.7%) | 5 (6.9%) |
| $25,000 to $34,999 | 8 (8.4%) | 7 (9.7%) |
| $35,000 to $49,999 | 4 (4.2%) | 4 (5.6%) |
| $50,000 to $74,999 | 39 (41.0%) | 3 (4.2%) |
| $75,000 to $99,999 | 5 (5.3%) | 14 (19.4%) |
| $100,000 to $149,999 | 13 (13.7%) | 9 (12.5%) |
| $150,000 or more | 7 (7.4%) | 28 (38.9%) |
| Total | 95 (100.0%) | 72 (100.0%) |
Property Value to Household Income Ratio in Tijeras
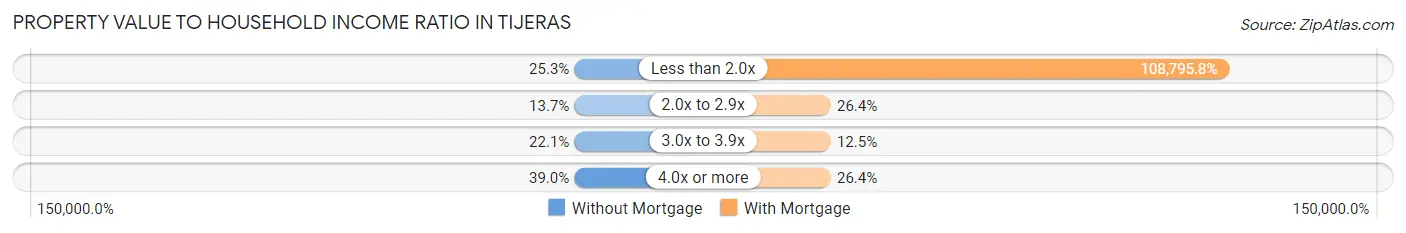
| Value-to-Income Ratio | Without Mortgage | With Mortgage |
| Less than 2.0x | 24 (25.3%) | 78,333 (108,795.8%) |
| 2.0x to 2.9x | 13 (13.7%) | 19 (26.4%) |
| 3.0x to 3.9x | 21 (22.1%) | 9 (12.5%) |
| 4.0x or more | 37 (39.0%) | 19 (26.4%) |
| Total | 95 (100.0%) | 72 (100.0%) |
Real Estate Taxes by Mortgage Status in Tijeras
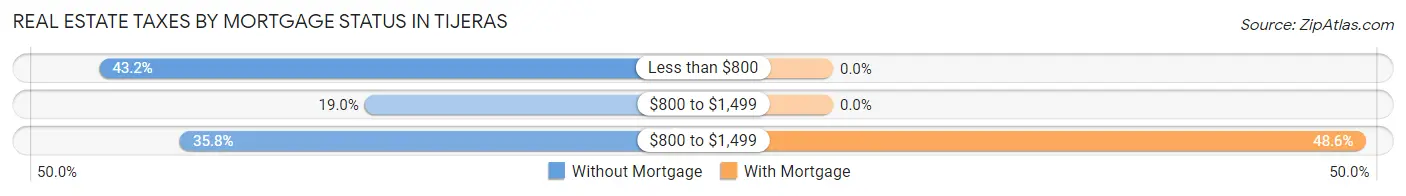
| Property Taxes | Without Mortgage | With Mortgage |
| Less than $800 | 41 (43.2%) | 0 (0.0%) |
| $800 to $1,499 | 18 (19.0%) | 0 (0.0%) |
| $800 to $1,499 | 34 (35.8%) | 35 (48.6%) |
| Total | 95 (100.0%) | 72 (100.0%) |
Health & Disability in Tijeras
Health Insurance Coverage by Age in Tijeras
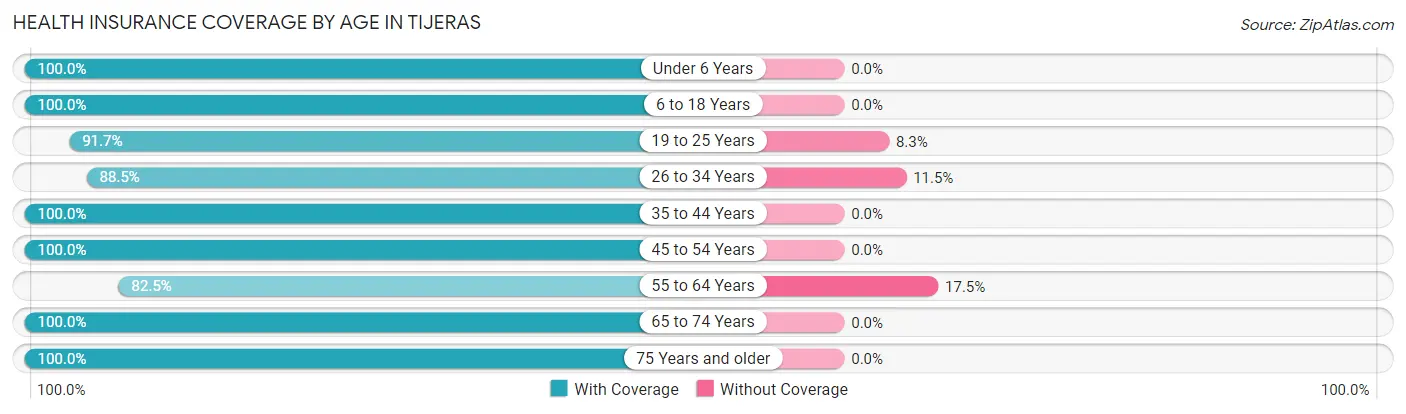
| Age Bracket | With Coverage | Without Coverage |
| Under 6 Years | 14 (100.0%) | 0 (0.0%) |
| 6 to 18 Years | 91 (100.0%) | 0 (0.0%) |
| 19 to 25 Years | 33 (91.7%) | 3 (8.3%) |
| 26 to 34 Years | 46 (88.5%) | 6 (11.5%) |
| 35 to 44 Years | 57 (100.0%) | 0 (0.0%) |
| 45 to 54 Years | 70 (100.0%) | 0 (0.0%) |
| 55 to 64 Years | 66 (82.5%) | 14 (17.5%) |
| 65 to 74 Years | 121 (100.0%) | 0 (0.0%) |
| 75 Years and older | 18 (100.0%) | 0 (0.0%) |
| Total | 516 (95.7%) | 23 (4.3%) |
Health Insurance Coverage by Citizenship Status in Tijeras
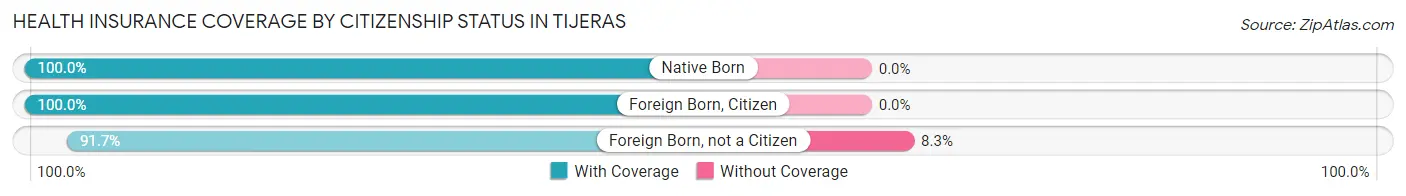
| Citizenship Status | With Coverage | Without Coverage |
| Native Born | 14 (100.0%) | 0 (0.0%) |
| Foreign Born, Citizen | 91 (100.0%) | 0 (0.0%) |
| Foreign Born, not a Citizen | 33 (91.7%) | 3 (8.3%) |
Health Insurance Coverage by Household Income in Tijeras
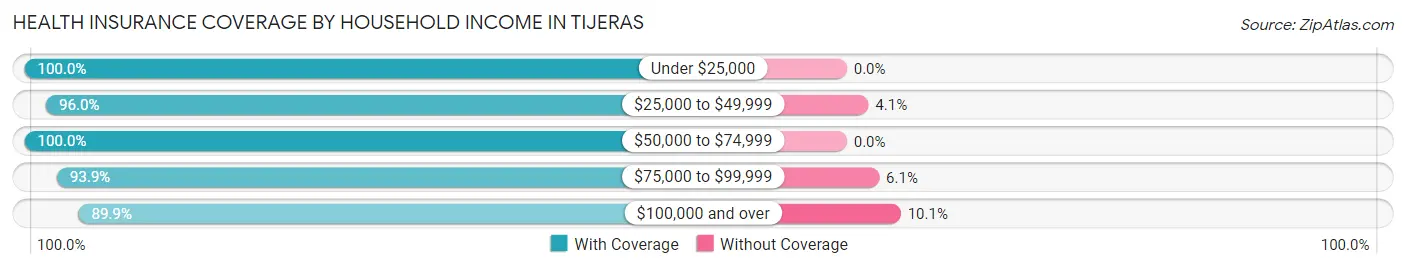
| Household Income | With Coverage | Without Coverage |
| Under $25,000 | 92 (100.0%) | 0 (0.0%) |
| $25,000 to $49,999 | 71 (96.0%) | 3 (4.1%) |
| $50,000 to $74,999 | 162 (100.0%) | 0 (0.0%) |
| $75,000 to $99,999 | 31 (93.9%) | 2 (6.1%) |
| $100,000 and over | 160 (89.9%) | 18 (10.1%) |
Public vs Private Health Insurance Coverage by Age in Tijeras
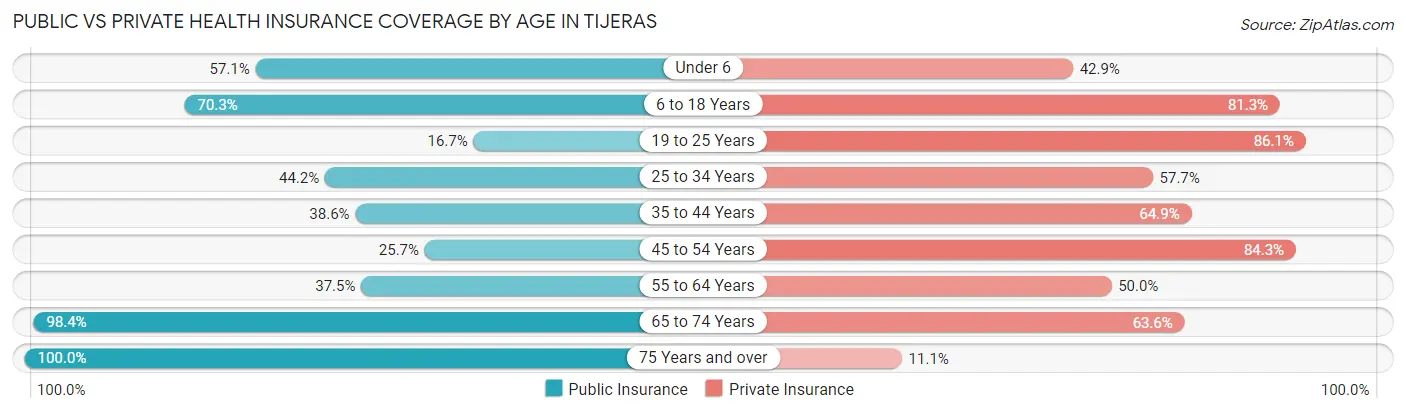
| Age Bracket | Public Insurance | Private Insurance |
| Under 6 | 8 (57.1%) | 6 (42.9%) |
| 6 to 18 Years | 64 (70.3%) | 74 (81.3%) |
| 19 to 25 Years | 6 (16.7%) | 31 (86.1%) |
| 25 to 34 Years | 23 (44.2%) | 30 (57.7%) |
| 35 to 44 Years | 22 (38.6%) | 37 (64.9%) |
| 45 to 54 Years | 18 (25.7%) | 59 (84.3%) |
| 55 to 64 Years | 30 (37.5%) | 40 (50.0%) |
| 65 to 74 Years | 119 (98.4%) | 77 (63.6%) |
| 75 Years and over | 18 (100.0%) | 2 (11.1%) |
| Total | 308 (57.1%) | 356 (66.0%) |
Disability Status by Sex by Age in Tijeras
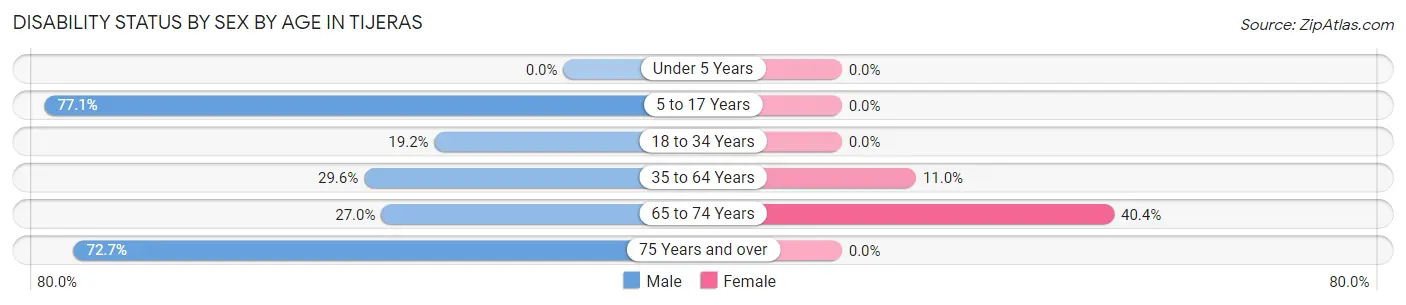
| Age Bracket | Male | Female |
| Under 5 Years | 0 (0.0%) | 0 (0.0%) |
| 5 to 17 Years | 47 (77.0%) | 0 (0.0%) |
| 18 to 34 Years | 9 (19.2%) | 0 (0.0%) |
| 35 to 64 Years | 29 (29.6%) | 12 (11.0%) |
| 65 to 74 Years | 20 (27.0%) | 19 (40.4%) |
| 75 Years and over | 8 (72.7%) | 0 (0.0%) |
Disability Class by Sex by Age in Tijeras
Disability Class: Hearing Difficulty
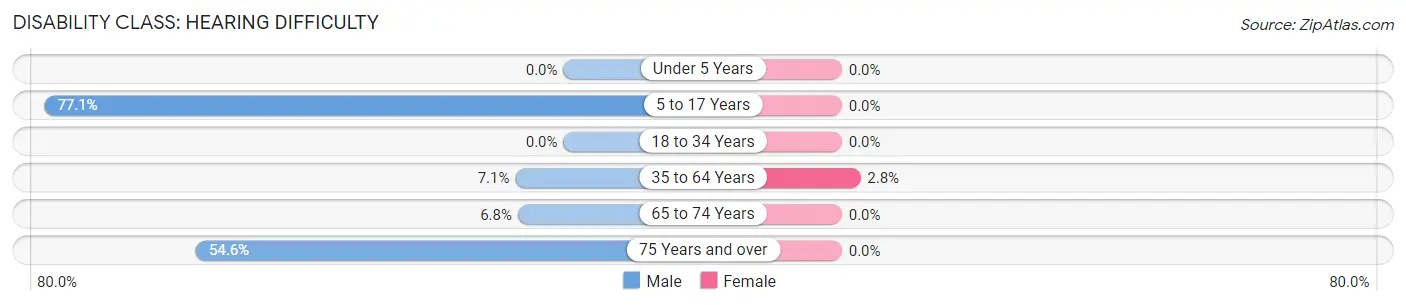
| Age Bracket | Male | Female |
| Under 5 Years | 0 (0.0%) | 0 (0.0%) |
| 5 to 17 Years | 47 (77.0%) | 0 (0.0%) |
| 18 to 34 Years | 0 (0.0%) | 0 (0.0%) |
| 35 to 64 Years | 7 (7.1%) | 3 (2.8%) |
| 65 to 74 Years | 5 (6.8%) | 0 (0.0%) |
| 75 Years and over | 6 (54.5%) | 0 (0.0%) |
Disability Class: Vision Difficulty
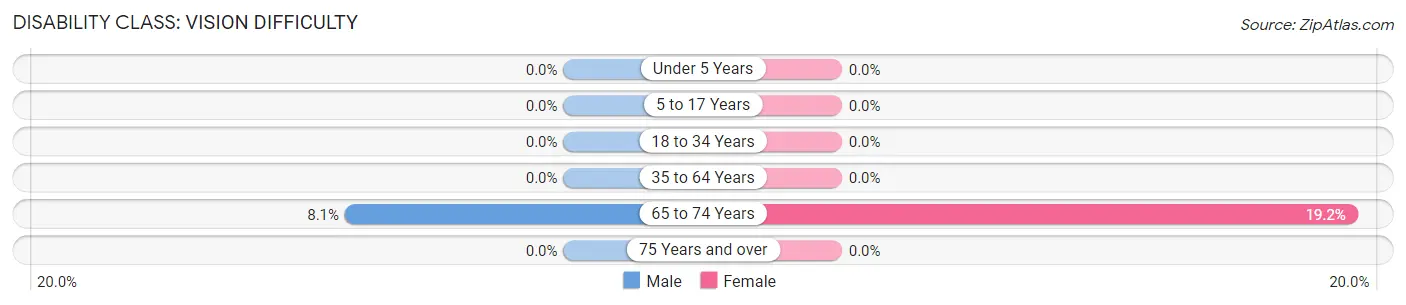
| Age Bracket | Male | Female |
| Under 5 Years | 0 (0.0%) | 0 (0.0%) |
| 5 to 17 Years | 0 (0.0%) | 0 (0.0%) |
| 18 to 34 Years | 0 (0.0%) | 0 (0.0%) |
| 35 to 64 Years | 0 (0.0%) | 0 (0.0%) |
| 65 to 74 Years | 6 (8.1%) | 9 (19.2%) |
| 75 Years and over | 0 (0.0%) | 0 (0.0%) |
Disability Class: Cognitive Difficulty
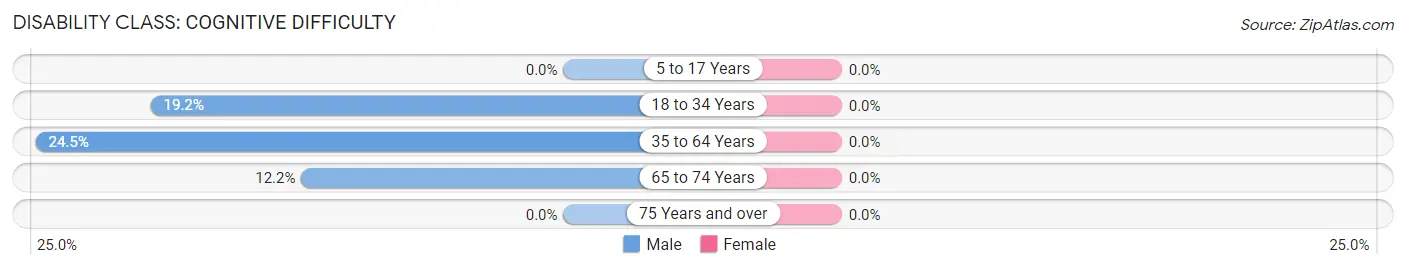
| Age Bracket | Male | Female |
| 5 to 17 Years | 0 (0.0%) | 0 (0.0%) |
| 18 to 34 Years | 9 (19.2%) | 0 (0.0%) |
| 35 to 64 Years | 24 (24.5%) | 0 (0.0%) |
| 65 to 74 Years | 9 (12.2%) | 0 (0.0%) |
| 75 Years and over | 0 (0.0%) | 0 (0.0%) |
Disability Class: Ambulatory Difficulty
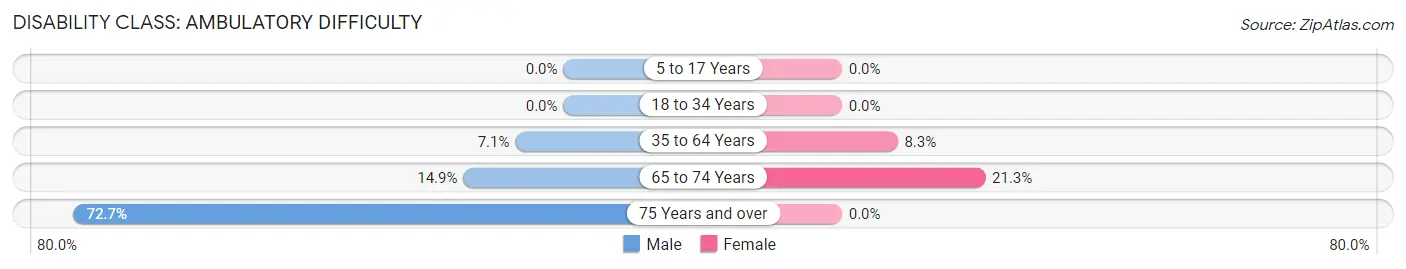
| Age Bracket | Male | Female |
| 5 to 17 Years | 0 (0.0%) | 0 (0.0%) |
| 18 to 34 Years | 0 (0.0%) | 0 (0.0%) |
| 35 to 64 Years | 7 (7.1%) | 9 (8.3%) |
| 65 to 74 Years | 11 (14.9%) | 10 (21.3%) |
| 75 Years and over | 8 (72.7%) | 0 (0.0%) |
Disability Class: Self-Care Difficulty
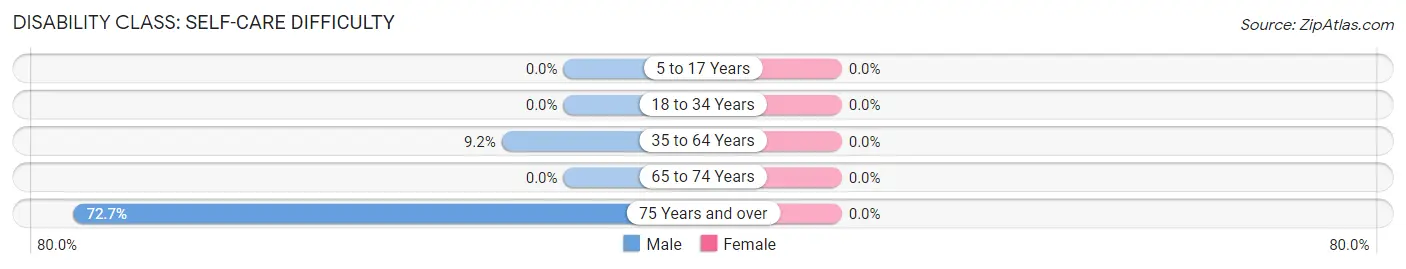
| Age Bracket | Male | Female |
| 5 to 17 Years | 0 (0.0%) | 0 (0.0%) |
| 18 to 34 Years | 0 (0.0%) | 0 (0.0%) |
| 35 to 64 Years | 9 (9.2%) | 0 (0.0%) |
| 65 to 74 Years | 0 (0.0%) | 0 (0.0%) |
| 75 Years and over | 8 (72.7%) | 0 (0.0%) |
Technology Access in Tijeras
Computing Device Access in Tijeras
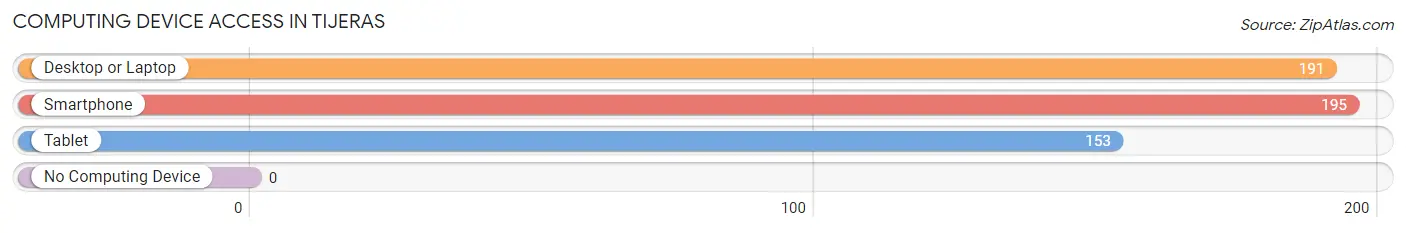
| Device Type | # Households | % Households |
| Desktop or Laptop | 191 | 87.6% |
| Smartphone | 195 | 89.4% |
| Tablet | 153 | 70.2% |
| No Computing Device | 0 | 0.0% |
| Total | 218 | 100.0% |
Internet Access in Tijeras
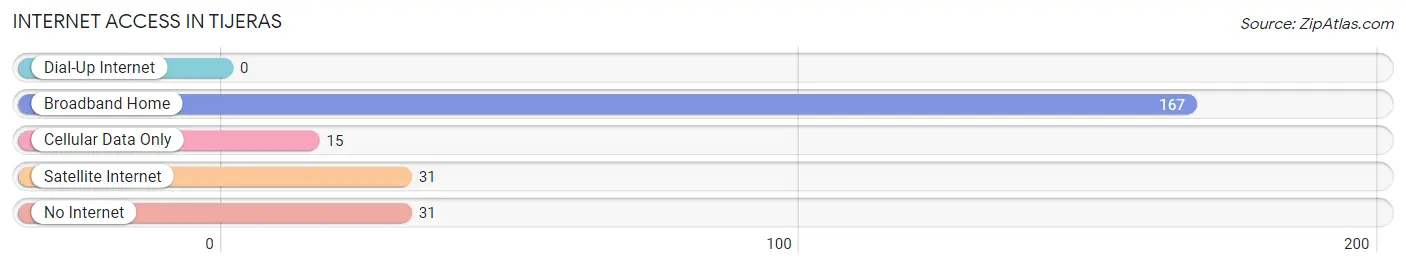
| Internet Type | # Households | % Households |
| Dial-Up Internet | 0 | 0.0% |
| Broadband Home | 167 | 76.6% |
| Cellular Data Only | 15 | 6.9% |
| Satellite Internet | 31 | 14.2% |
| No Internet | 31 | 14.2% |
| Total | 218 | 100.0% |
Tijeras Summary
Tijeras is a small village located in Bernalillo County, New Mexico. It is situated in the foothills of the Sandia Mountains, about 15 miles east of Albuquerque. The village is home to about 1,500 people and is part of the Albuquerque Metropolitan Statistical Area.
History
Tijeras was founded in 1881 by a group of settlers from the nearby town of Isleta. The settlers named the village after the Spanish word for “scissors”, as the area was known for its abundance of yucca plants, which were used to make scissors. The village was incorporated in 1912 and has remained relatively small since then.
Geography
Tijeras is located in the foothills of the Sandia Mountains, about 15 miles east of Albuquerque. The village is situated at an elevation of 6,000 feet and is surrounded by the Cibola National Forest. The climate is semi-arid, with hot summers and cold winters. The average annual precipitation is about 12 inches.
Economy
The economy of Tijeras is largely based on tourism and agriculture. The village is home to several small businesses, including restaurants, shops, and galleries. The nearby Sandia Mountains provide a variety of recreational activities, such as hiking, camping, and skiing. The village also has a small airport, which serves as a base for private aircraft.
Demographics
As of the 2010 census, the population of Tijeras was 1,521. The racial makeup of the village was 79.3% White, 0.7% African American, 1.2% Native American, 0.3% Asian, 0.1% Pacific Islander, 16.2% from other races, and 2.4% from two or more races. Hispanic or Latino of any race were 33.2% of the population. The median household income was $37,917, and the median family income was $45,938.
Tijeras is a small village with a rich history and a unique culture. The village is home to a diverse population and offers a variety of recreational activities. The economy is largely based on tourism and agriculture, and the village is a popular destination for visitors from all over the world.
Common Questions
What is Per Capita Income in Tijeras?
Per Capita income in Tijeras is $30,842.
What is the Median Family Income in Tijeras?
Median Family Income in Tijeras is $59,779.
What is the Median Household income in Tijeras?
Median Household Income in Tijeras is $59,219.
What is Income or Wage Gap in Tijeras?
Income or Wage Gap in Tijeras is 66.6%.
Women in Tijeras earn 33.4 cents for every dollar earned by a man.
What is Inequality or Gini Index in Tijeras?
Inequality or Gini Index in Tijeras is 0.40.
What is the Total Population of Tijeras?
Total Population of Tijeras is 539.
What is the Total Male Population of Tijeras?
Total Male Population of Tijeras is 297.
What is the Total Female Population of Tijeras?
Total Female Population of Tijeras is 242.
What is the Ratio of Males per 100 Females in Tijeras?
There are 122.73 Males per 100 Females in Tijeras.
What is the Ratio of Females per 100 Males in Tijeras?
There are 81.48 Females per 100 Males in Tijeras.
What is the Median Population Age in Tijeras?
Median Population Age in Tijeras is 47.4 Years.
What is the Average Family Size in Tijeras
Average Family Size in Tijeras is 3.0 People.
What is the Average Household Size in Tijeras
Average Household Size in Tijeras is 2.5 People.
How Large is the Labor Force in Tijeras?
There are 237 People in the Labor Forcein in Tijeras.
What is the Percentage of People in the Labor Force in Tijeras?
53.9% of People are in the Labor Force in Tijeras.
What is the Unemployment Rate in Tijeras?
Unemployment Rate in Tijeras is 6.8%.