Texico, NM Map & Demographics
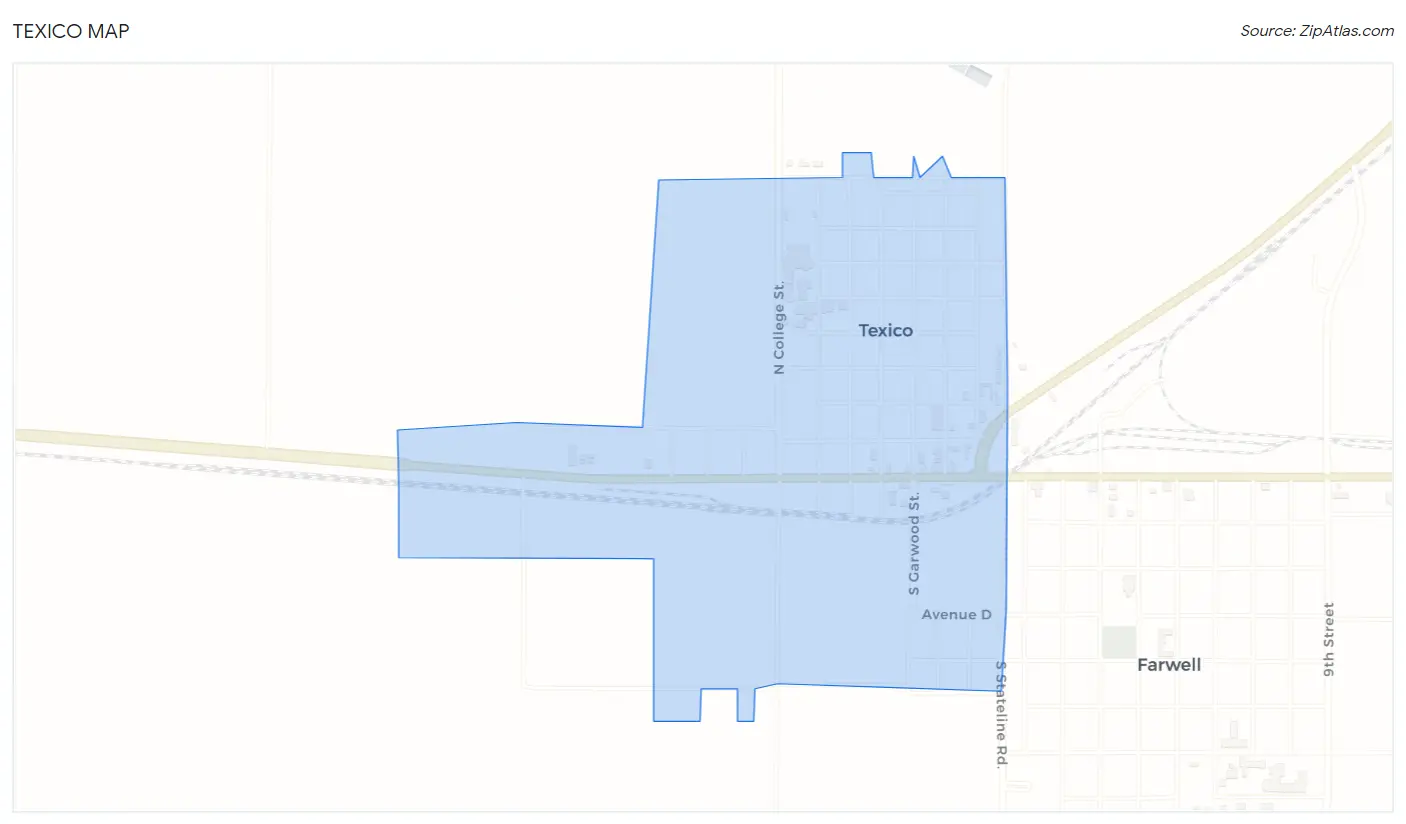
Texico Map
Texico Overview
$26,023
PER CAPITA INCOME
$68,889
AVG FAMILY INCOME
$56,250
AVG HOUSEHOLD INCOME
48.4%
WAGE / INCOME GAP [ % ]
51.6¢/ $1
WAGE / INCOME GAP [ $ ]
0.41
INEQUALITY / GINI INDEX
873
TOTAL POPULATION
391
MALE POPULATION
482
FEMALE POPULATION
81.12
MALES / 100 FEMALES
123.27
FEMALES / 100 MALES
46.7
MEDIAN AGE
2.9
AVG FAMILY SIZE
2.2
AVG HOUSEHOLD SIZE
447
LABOR FORCE [ PEOPLE ]
65.3%
PERCENT IN LABOR FORCE
2.7%
UNEMPLOYMENT RATE
Texico Zip Codes
Texico Area Codes
Income in Texico
Income Overview in Texico
Per Capita Income in Texico is $26,023, while median incomes of families and households are $68,889 and $56,250 respectively.
| Characteristic | Number | Measure |
| Per Capita Income | 873 | $26,023 |
| Median Family Income | 232 | $68,889 |
| Mean Family Income | 232 | $78,758 |
| Median Household Income | 400 | $56,250 |
| Mean Household Income | 400 | $64,298 |
| Income Deficit | 232 | $0 |
| Wage / Income Gap (%) | 873 | 48.43% |
| Wage / Income Gap ($) | 873 | 51.57¢ per $1 |
| Gini / Inequality Index | 873 | 0.41 |
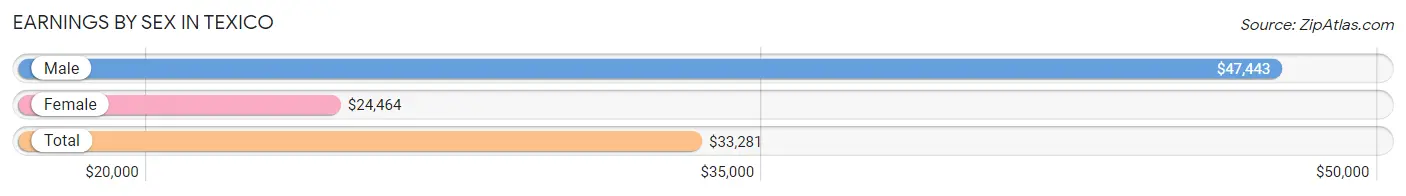
Earnings by Sex in Texico
Average Earnings in Texico are $33,281, $47,443 for men and $24,464 for women, a difference of 48.4%.
| Sex | Number | Average Earnings |
| Male | 233 (48.6%) | $47,443 |
| Female | 246 (51.4%) | $24,464 |
| Total | 479 (100.0%) | $33,281 |
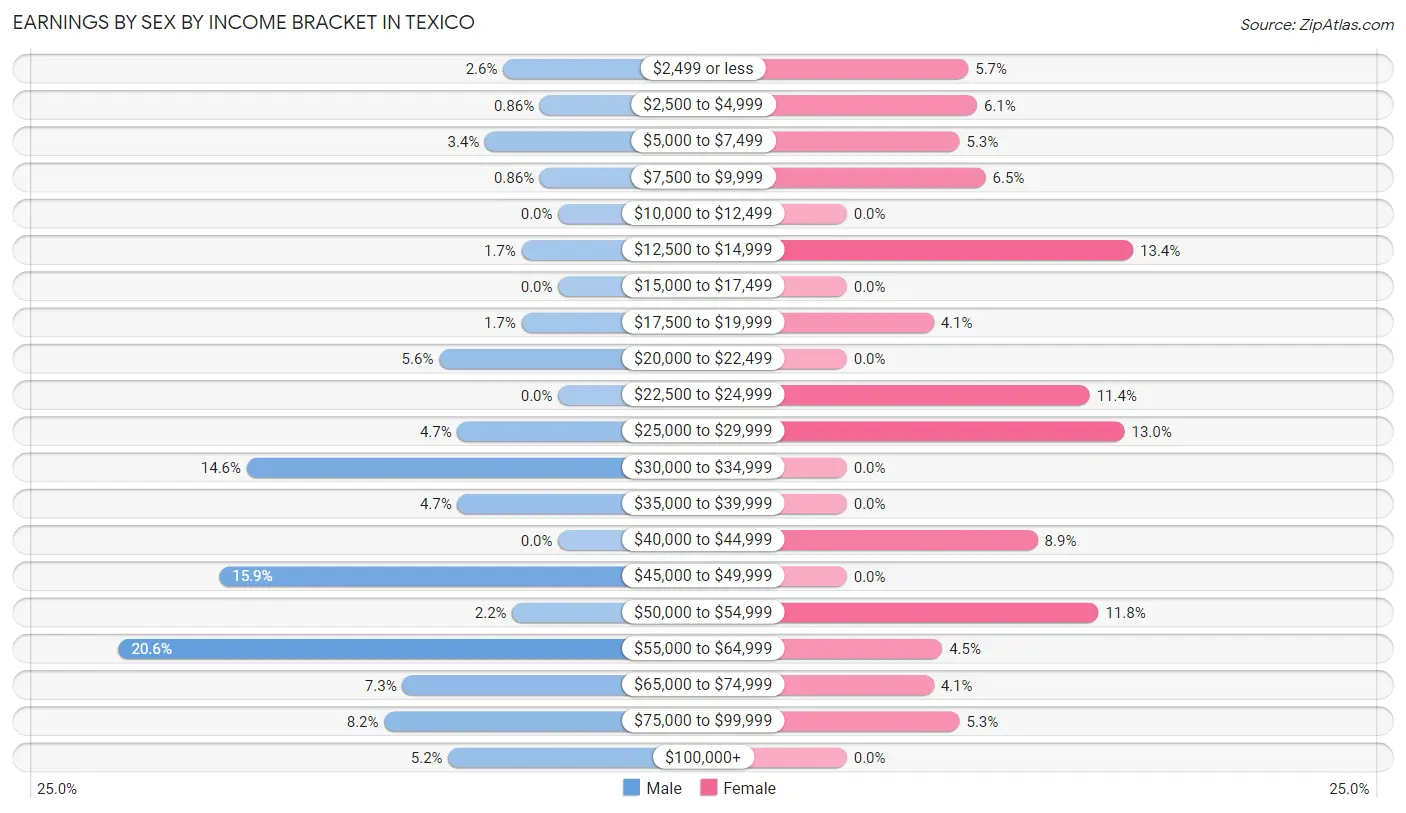
Earnings by Sex by Income Bracket in Texico
The most common earnings brackets in Texico are $55,000 to $64,999 for men (48 | 20.6%) and $12,500 to $14,999 for women (33 | 13.4%).
| Income | Male | Female |
| $2,499 or less | 6 (2.6%) | 14 (5.7%) |
| $2,500 to $4,999 | 2 (0.9%) | 15 (6.1%) |
| $5,000 to $7,499 | 8 (3.4%) | 13 (5.3%) |
| $7,500 to $9,999 | 2 (0.9%) | 16 (6.5%) |
| $10,000 to $12,499 | 0 (0.0%) | 0 (0.0%) |
| $12,500 to $14,999 | 4 (1.7%) | 33 (13.4%) |
| $15,000 to $17,499 | 0 (0.0%) | 0 (0.0%) |
| $17,500 to $19,999 | 4 (1.7%) | 10 (4.1%) |
| $20,000 to $22,499 | 13 (5.6%) | 0 (0.0%) |
| $22,500 to $24,999 | 0 (0.0%) | 28 (11.4%) |
| $25,000 to $29,999 | 11 (4.7%) | 32 (13.0%) |
| $30,000 to $34,999 | 34 (14.6%) | 0 (0.0%) |
| $35,000 to $39,999 | 11 (4.7%) | 0 (0.0%) |
| $40,000 to $44,999 | 0 (0.0%) | 22 (8.9%) |
| $45,000 to $49,999 | 37 (15.9%) | 0 (0.0%) |
| $50,000 to $54,999 | 5 (2.1%) | 29 (11.8%) |
| $55,000 to $64,999 | 48 (20.6%) | 11 (4.5%) |
| $65,000 to $74,999 | 17 (7.3%) | 10 (4.1%) |
| $75,000 to $99,999 | 19 (8.2%) | 13 (5.3%) |
| $100,000+ | 12 (5.1%) | 0 (0.0%) |
| Total | 233 (100.0%) | 246 (100.0%) |
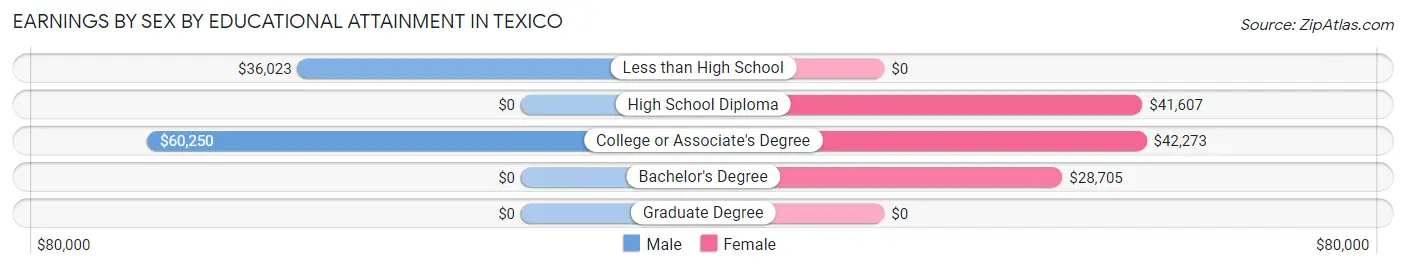
Earnings by Sex by Educational Attainment in Texico
Average earnings in Texico are $48,333 for men and $26,250 for women, a difference of 45.7%. Men with an educational attainment of college or associate's degree enjoy the highest average annual earnings of $60,250, while those with less than high school education earn the least with $36,023. Women with an educational attainment of college or associate's degree earn the most with the average annual earnings of $42,273, while those with bachelor's degree education have the smallest earnings of $28,705.
| Educational Attainment | Male Income | Female Income |
| Less than High School | $36,023 | $0 |
| High School Diploma | - | - |
| College or Associate's Degree | $60,250 | $42,273 |
| Bachelor's Degree | - | - |
| Graduate Degree | - | - |
| Total | $48,333 | $26,250 |
Family Income in Texico
Family Income Brackets in Texico
According to the Texico family income data, there are 63 families falling into the $100,000 to $149,999 income range, which is the most common income bracket and makes up 27.2% of all families.
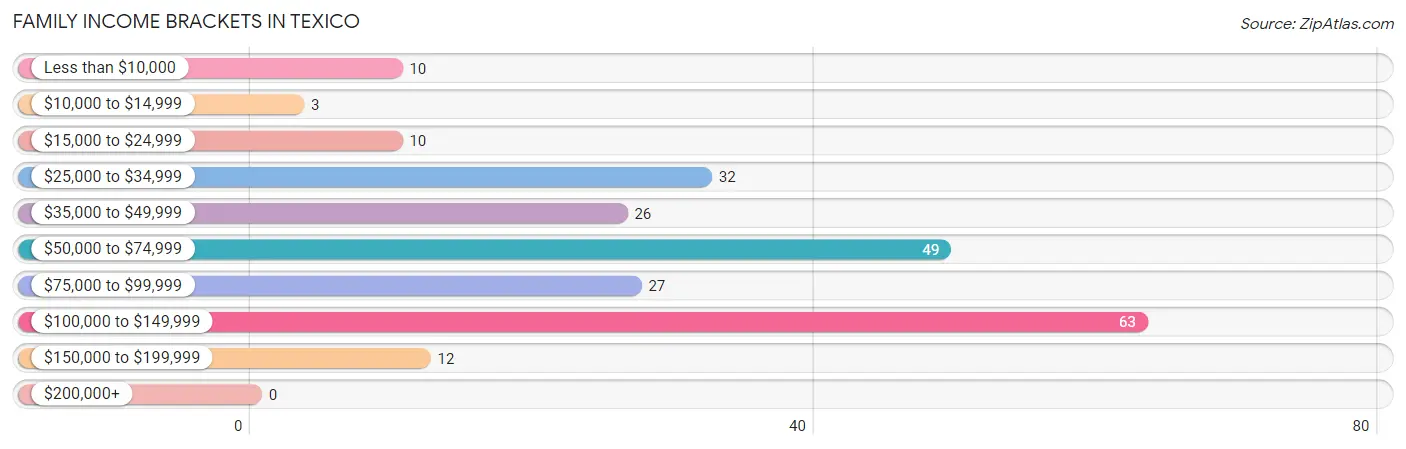
| Income Bracket | # Families | % Families |
| Less than $10,000 | 10 | 4.3% |
| $10,000 to $14,999 | 3 | 1.3% |
| $15,000 to $24,999 | 10 | 4.3% |
| $25,000 to $34,999 | 32 | 13.8% |
| $35,000 to $49,999 | 26 | 11.2% |
| $50,000 to $74,999 | 49 | 21.1% |
| $75,000 to $99,999 | 27 | 11.6% |
| $100,000 to $149,999 | 63 | 27.2% |
| $150,000 to $199,999 | 12 | 5.2% |
| $200,000+ | 0 | 0.0% |
Family Income by Famaliy Size in Texico
4-person families (41 | 17.7%) account for the highest median family income in Texico with $130,511 per family, while 2-person families (72 | 31.0%) have the highest median income of $44,038 per family member.
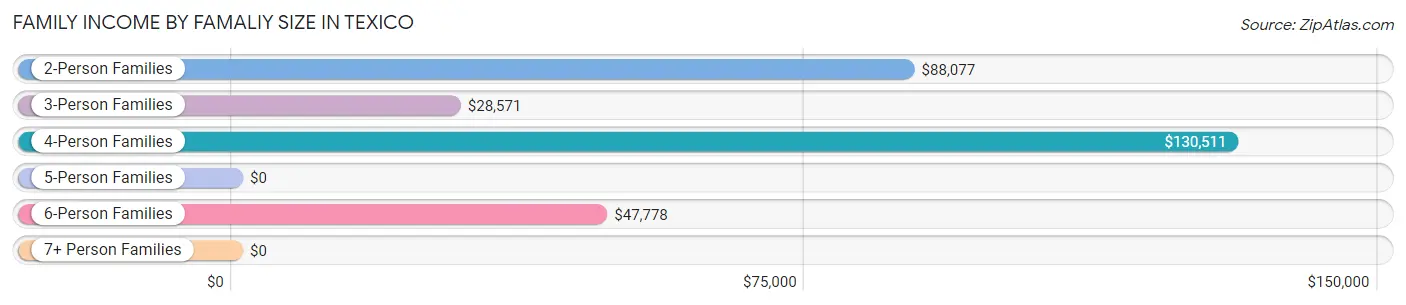
| Income Bracket | # Families | Median Income |
| 2-Person Families | 72 (31.0%) | $88,077 |
| 3-Person Families | 64 (27.6%) | $28,571 |
| 4-Person Families | 41 (17.7%) | $130,511 |
| 5-Person Families | 31 (13.4%) | $0 |
| 6-Person Families | 24 (10.3%) | $47,778 |
| 7+ Person Families | 0 (0.0%) | $0 |
| Total | 232 (100.0%) | $68,889 |
Family Income by Number of Earners in Texico
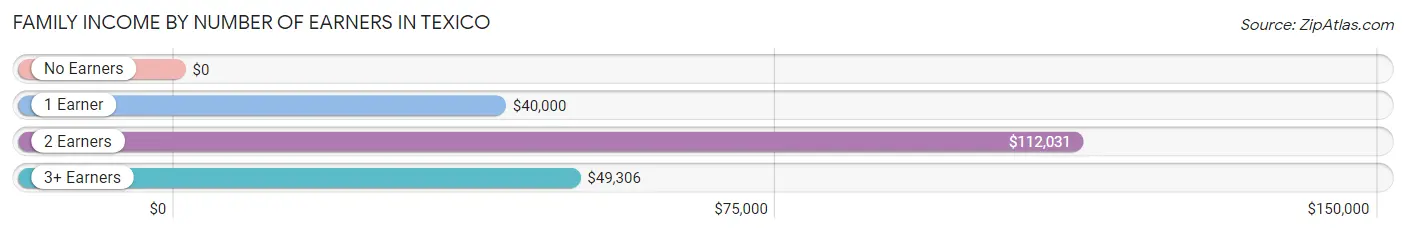
| Number of Earners | # Families | Median Income |
| No Earners | 0 (0.0%) | $0 |
| 1 Earner | 100 (43.1%) | $40,000 |
| 2 Earners | 113 (48.7%) | $112,031 |
| 3+ Earners | 19 (8.2%) | $49,306 |
| Total | 232 (100.0%) | $68,889 |
Household Income in Texico
Household Income Brackets in Texico
With 89 households falling in the category, the $100,000 to $149,999 income range is the most frequent in Texico, accounting for 22.3% of all households.
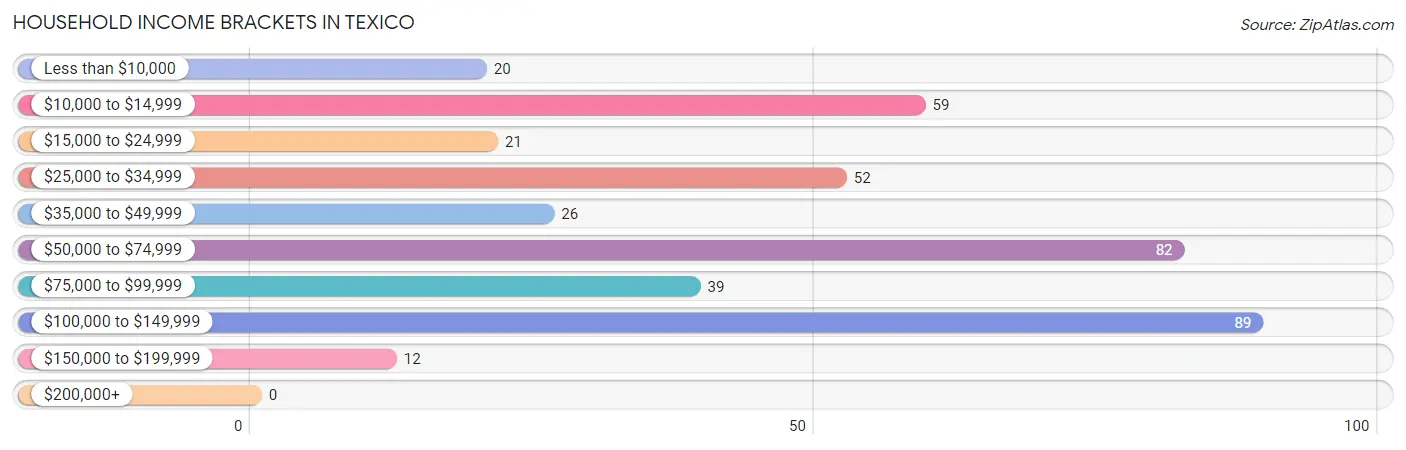
| Income Bracket | # Households | % Households |
| Less than $10,000 | 20 | 5.0% |
| $10,000 to $14,999 | 59 | 14.8% |
| $15,000 to $24,999 | 21 | 5.3% |
| $25,000 to $34,999 | 52 | 13.0% |
| $35,000 to $49,999 | 26 | 6.5% |
| $50,000 to $74,999 | 82 | 20.5% |
| $75,000 to $99,999 | 39 | 9.8% |
| $100,000 to $149,999 | 89 | 22.3% |
| $150,000 to $199,999 | 12 | 3.0% |
| $200,000+ | 0 | 0.0% |
Household Income by Householder Age in Texico
The median household income in Texico is $56,250, with the highest median household income of $74,750 found in the 45 to 64 years age bracket for the primary householder. A total of 196 households (49.0%) fall into this category. Meanwhile, the 15 to 24 years age bracket for the primary householder has the lowest median household income of $0, with 10 households (2.5%) in this group.
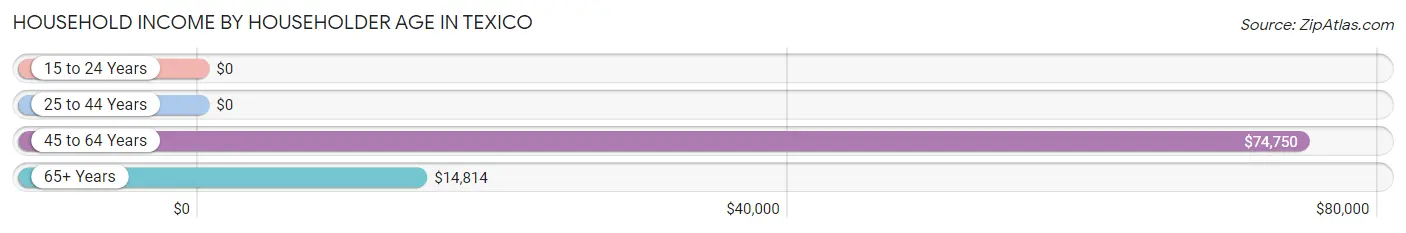
| Income Bracket | # Households | Median Income |
| 15 to 24 Years | 10 (2.5%) | $0 |
| 25 to 44 Years | 89 (22.3%) | $0 |
| 45 to 64 Years | 196 (49.0%) | $74,750 |
| 65+ Years | 105 (26.3%) | $14,814 |
| Total | 400 (100.0%) | $56,250 |
Poverty in Texico
Income Below Poverty by Sex and Age in Texico
With 7.4% poverty level for males and 17.6% for females among the residents of Texico, 35 to 44 year old males and 75 year old and over females are the most vulnerable to poverty, with 8 males (53.3%) and 28 females (43.8%) in their respective age groups living below the poverty level.
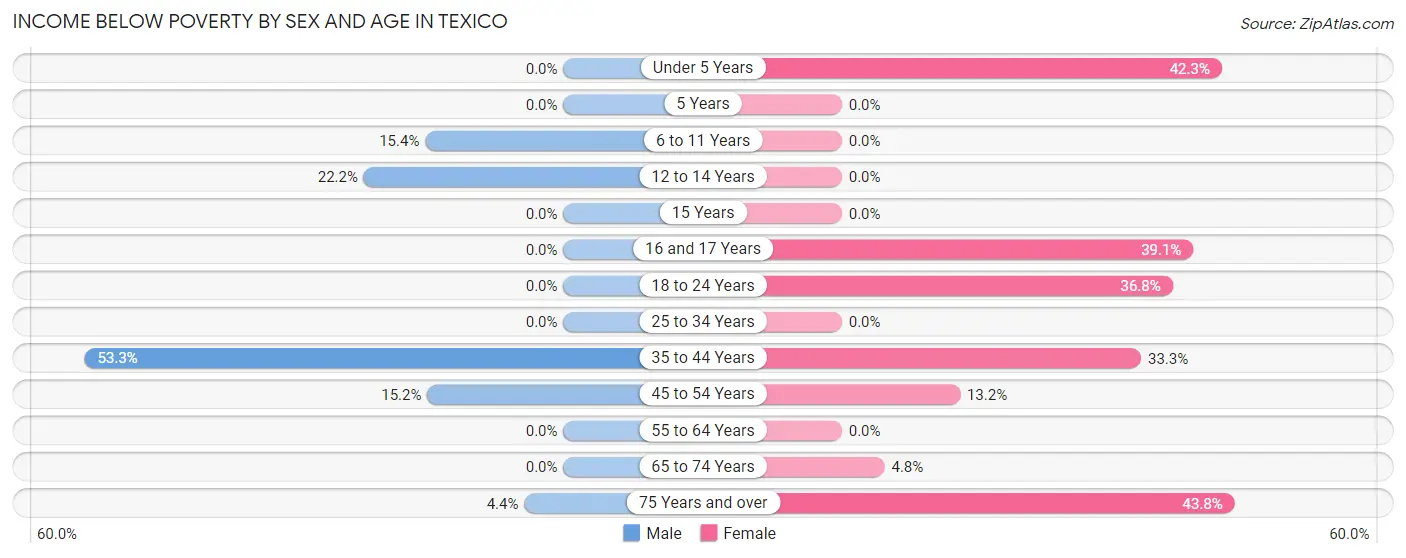
| Age Bracket | Male | Female |
| Under 5 Years | 0 (0.0%) | 11 (42.3%) |
| 5 Years | 0 (0.0%) | 0 (0.0%) |
| 6 to 11 Years | 8 (15.4%) | 0 (0.0%) |
| 12 to 14 Years | 2 (22.2%) | 0 (0.0%) |
| 15 Years | 0 (0.0%) | 0 (0.0%) |
| 16 and 17 Years | 0 (0.0%) | 9 (39.1%) |
| 18 to 24 Years | 0 (0.0%) | 14 (36.8%) |
| 25 to 34 Years | 0 (0.0%) | 0 (0.0%) |
| 35 to 44 Years | 8 (53.3%) | 11 (33.3%) |
| 45 to 54 Years | 10 (15.1%) | 10 (13.2%) |
| 55 to 64 Years | 0 (0.0%) | 0 (0.0%) |
| 65 to 74 Years | 0 (0.0%) | 2 (4.8%) |
| 75 Years and over | 1 (4.3%) | 28 (43.8%) |
| Total | 29 (7.4%) | 85 (17.6%) |
Income Above Poverty by Sex and Age in Texico
According to the poverty statistics in Texico, males aged under 5 years and females aged 5 years are the age groups that are most secure financially, with 100.0% of males and 100.0% of females in these age groups living above the poverty line.
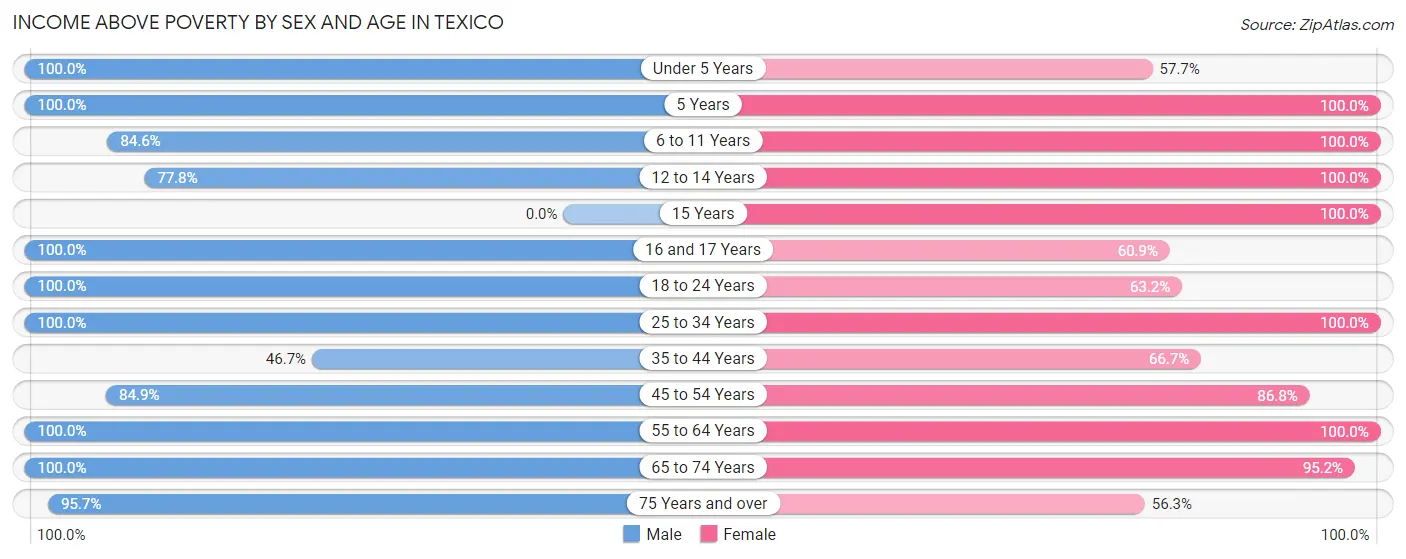
| Age Bracket | Male | Female |
| Under 5 Years | 29 (100.0%) | 15 (57.7%) |
| 5 Years | 3 (100.0%) | 17 (100.0%) |
| 6 to 11 Years | 44 (84.6%) | 42 (100.0%) |
| 12 to 14 Years | 7 (77.8%) | 7 (100.0%) |
| 15 Years | 0 (0.0%) | 3 (100.0%) |
| 16 and 17 Years | 10 (100.0%) | 14 (60.9%) |
| 18 to 24 Years | 11 (100.0%) | 24 (63.2%) |
| 25 to 34 Years | 43 (100.0%) | 54 (100.0%) |
| 35 to 44 Years | 7 (46.7%) | 22 (66.7%) |
| 45 to 54 Years | 56 (84.9%) | 66 (86.8%) |
| 55 to 64 Years | 119 (100.0%) | 57 (100.0%) |
| 65 to 74 Years | 11 (100.0%) | 40 (95.2%) |
| 75 Years and over | 22 (95.7%) | 36 (56.2%) |
| Total | 362 (92.6%) | 397 (82.4%) |
Income Below Poverty Among Married-Couple Families in Texico
The poverty statistics for married-couple families in Texico show that 5.9% or 10 of the total 169 families live below the poverty line. Families with 1 or 2 children have the highest poverty rate of 17.5%, comprising of 10 families. On the other hand, families with no children have the lowest poverty rate of 0.0%, which includes 0 families.
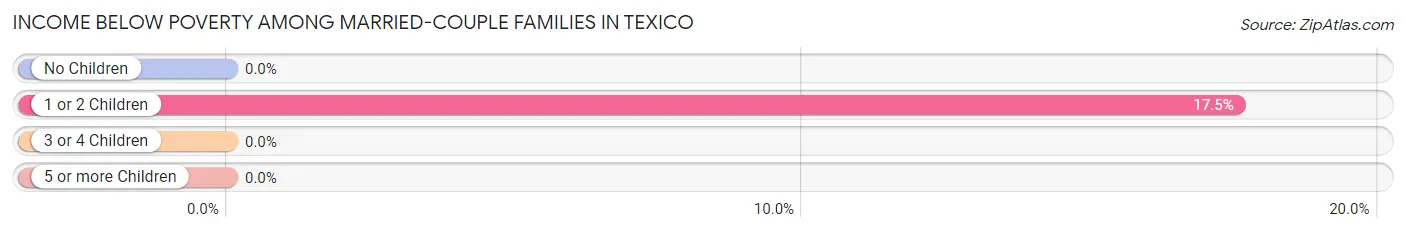
| Children | Above Poverty | Below Poverty |
| No Children | 99 (100.0%) | 0 (0.0%) |
| 1 or 2 Children | 47 (82.5%) | 10 (17.5%) |
| 3 or 4 Children | 13 (100.0%) | 0 (0.0%) |
| 5 or more Children | 0 (0.0%) | 0 (0.0%) |
| Total | 159 (94.1%) | 10 (5.9%) |
Income Below Poverty Among Single-Parent Households in Texico
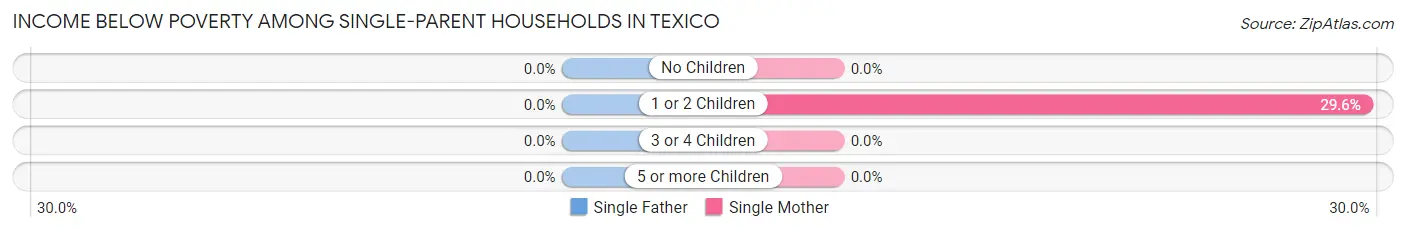
| Children | Single Father | Single Mother |
| No Children | 0 (0.0%) | 0 (0.0%) |
| 1 or 2 Children | 0 (0.0%) | 13 (29.5%) |
| 3 or 4 Children | 0 (0.0%) | 0 (0.0%) |
| 5 or more Children | 0 (0.0%) | 0 (0.0%) |
| Total | 0 (0.0%) | 13 (20.6%) |
Income Below Poverty Among Married-Couple vs Single-Parent Households in Texico
The poverty data for Texico shows that 10 of the married-couple family households (5.9%) and 13 of the single-parent households (20.6%) are living below the poverty level. Within the married-couple family households, those with 1 or 2 children have the highest poverty rate, with 10 households (17.5%) falling below the poverty line. Among the single-parent households, those with 1 or 2 children have the highest poverty rate, with 13 household (29.5%) living below poverty.
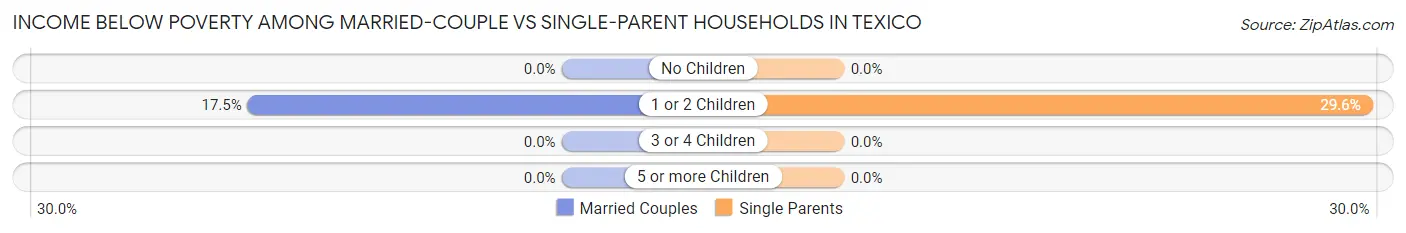
| Children | Married-Couple Families | Single-Parent Households |
| No Children | 0 (0.0%) | 0 (0.0%) |
| 1 or 2 Children | 10 (17.5%) | 13 (29.5%) |
| 3 or 4 Children | 0 (0.0%) | 0 (0.0%) |
| 5 or more Children | 0 (0.0%) | 0 (0.0%) |
| Total | 10 (5.9%) | 13 (20.6%) |
Race in Texico
The most populous races in Texico are Hispanic or Latino (486 | 55.7%), White / Caucasian (404 | 46.3%), and Some other Race (314 | 36.0%).
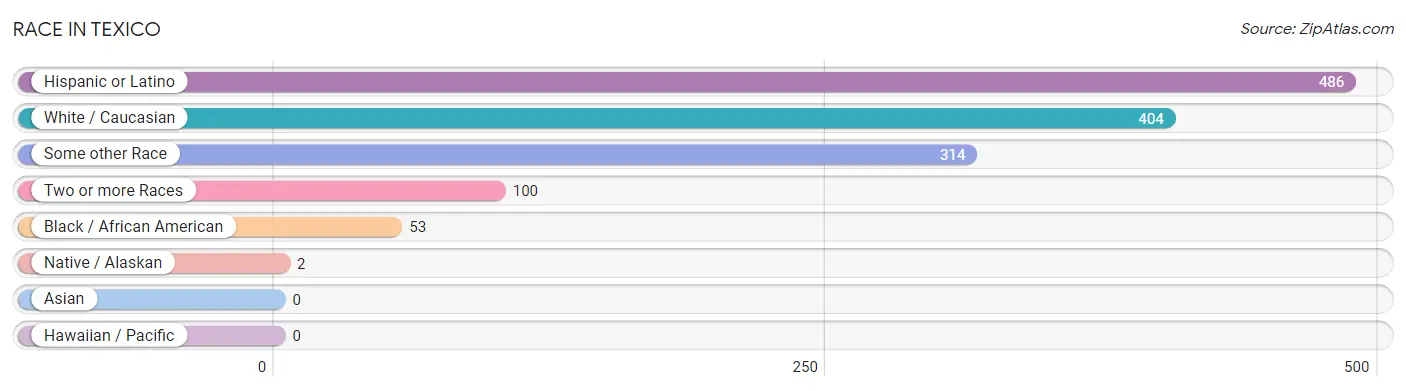
| Race | # Population | % Population |
| Asian | 0 | 0.0% |
| Black / African American | 53 | 6.1% |
| Hawaiian / Pacific | 0 | 0.0% |
| Hispanic or Latino | 486 | 55.7% |
| Native / Alaskan | 2 | 0.2% |
| White / Caucasian | 404 | 46.3% |
| Two or more Races | 100 | 11.5% |
| Some other Race | 314 | 36.0% |
| Total | 873 | 100.0% |
Ancestry in Texico
The most populous ancestries reported in Texico are Mexican (350 | 40.1%), German (136 | 15.6%), Irish (98 | 11.2%), Polish (66 | 7.6%), and English (50 | 5.7%), together accounting for 80.2% of all Texico residents.
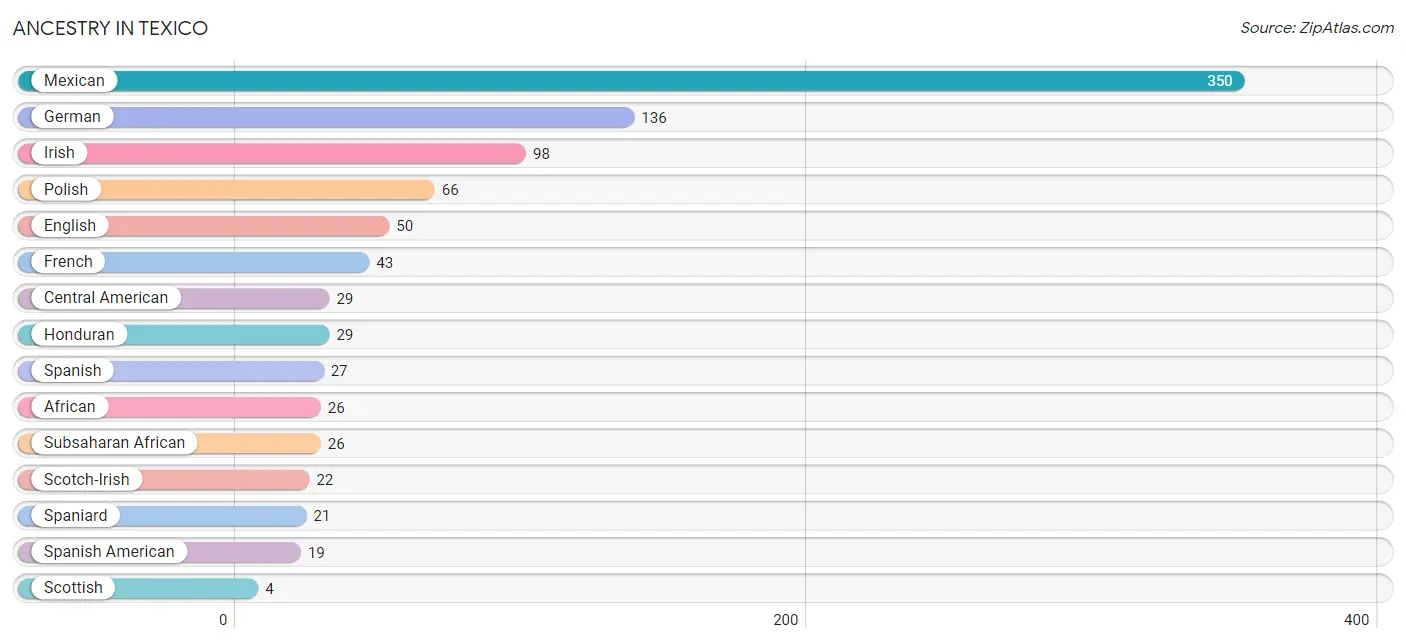
| Ancestry | # Population | % Population |
| African | 26 | 3.0% |
| American | 2 | 0.2% |
| Central American | 29 | 3.3% |
| Cherokee | 1 | 0.1% |
| English | 50 | 5.7% |
| French | 43 | 4.9% |
| German | 136 | 15.6% |
| Honduran | 29 | 3.3% |
| Irish | 98 | 11.2% |
| Italian | 3 | 0.3% |
| Mexican | 350 | 40.1% |
| Polish | 66 | 7.6% |
| Scotch-Irish | 22 | 2.5% |
| Scottish | 4 | 0.5% |
| Spaniard | 21 | 2.4% |
| Spanish | 27 | 3.1% |
| Spanish American | 19 | 2.2% |
| Subsaharan African | 26 | 3.0% | View All 18 Rows |
Immigrants in Texico
The most numerous immigrant groups reported in Texico came from Central America (188 | 21.5%), Latin America (188 | 21.5%), Mexico (151 | 17.3%), and Honduras (37 | 4.2%), together accounting for 64.6% of all Texico residents.
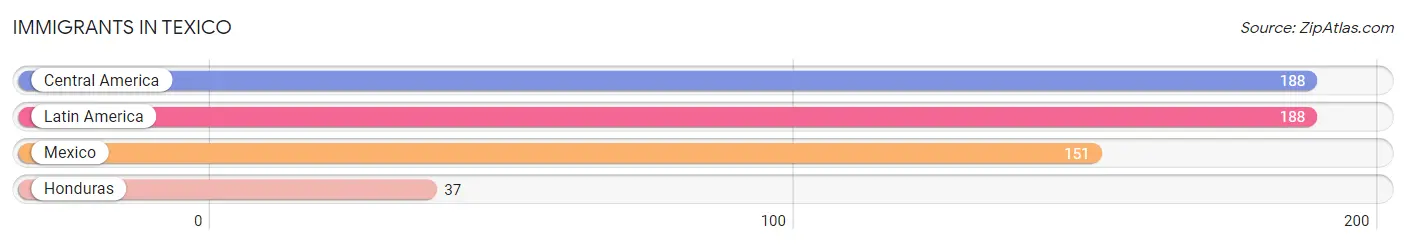
| Immigration Origin | # Population | % Population |
| Central America | 188 | 21.5% |
| Honduras | 37 | 4.2% |
| Latin America | 188 | 21.5% |
| Mexico | 151 | 17.3% | View All 4 Rows |
Sex and Age in Texico
Sex and Age in Texico
The most populous age groups in Texico are 60 to 64 Years (71 | 18.2%) for men and 50 to 54 Years (56 | 11.6%) for women.
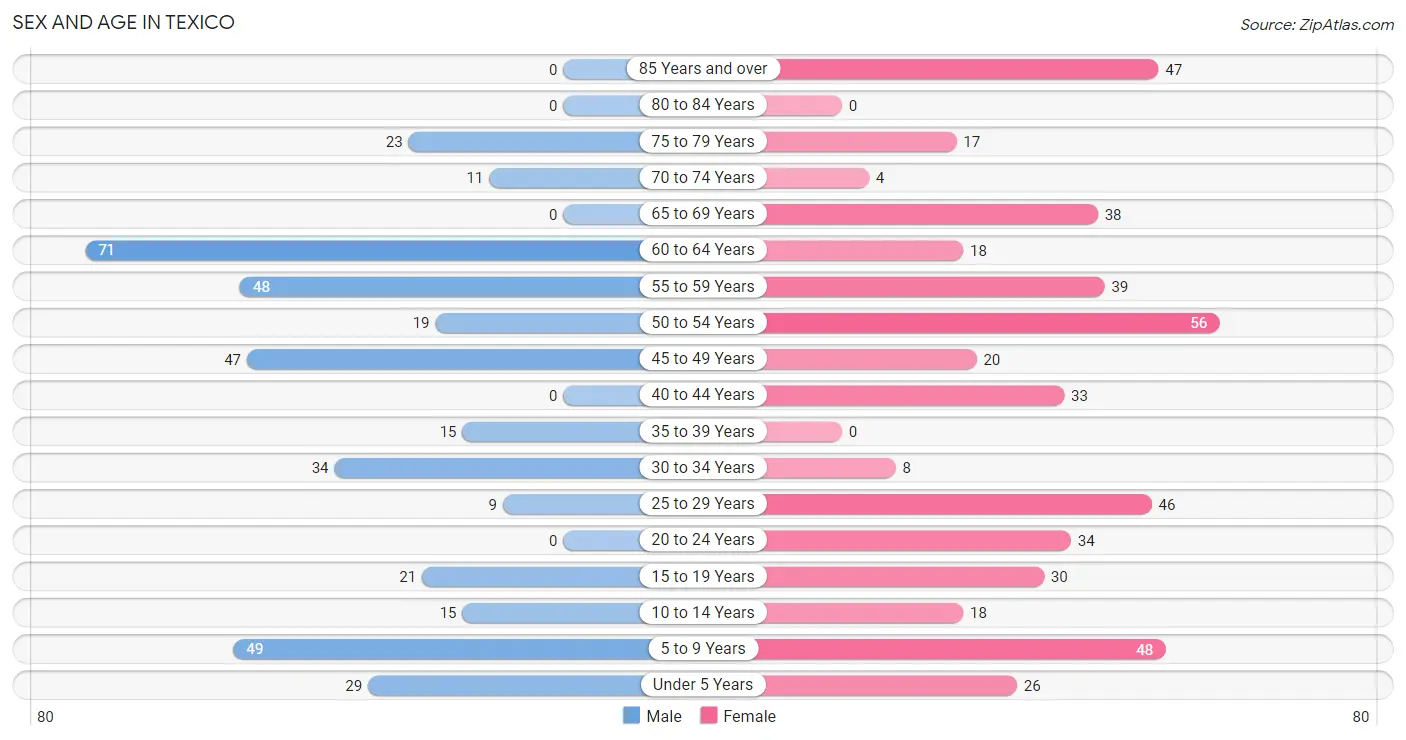
| Age Bracket | Male | Female |
| Under 5 Years | 29 (7.4%) | 26 (5.4%) |
| 5 to 9 Years | 49 (12.5%) | 48 (10.0%) |
| 10 to 14 Years | 15 (3.8%) | 18 (3.7%) |
| 15 to 19 Years | 21 (5.4%) | 30 (6.2%) |
| 20 to 24 Years | 0 (0.0%) | 34 (7.0%) |
| 25 to 29 Years | 9 (2.3%) | 46 (9.5%) |
| 30 to 34 Years | 34 (8.7%) | 8 (1.7%) |
| 35 to 39 Years | 15 (3.8%) | 0 (0.0%) |
| 40 to 44 Years | 0 (0.0%) | 33 (6.9%) |
| 45 to 49 Years | 47 (12.0%) | 20 (4.2%) |
| 50 to 54 Years | 19 (4.9%) | 56 (11.6%) |
| 55 to 59 Years | 48 (12.3%) | 39 (8.1%) |
| 60 to 64 Years | 71 (18.2%) | 18 (3.7%) |
| 65 to 69 Years | 0 (0.0%) | 38 (7.9%) |
| 70 to 74 Years | 11 (2.8%) | 4 (0.8%) |
| 75 to 79 Years | 23 (5.9%) | 17 (3.5%) |
| 80 to 84 Years | 0 (0.0%) | 0 (0.0%) |
| 85 Years and over | 0 (0.0%) | 47 (9.8%) |
| Total | 391 (100.0%) | 482 (100.0%) |
Families and Households in Texico
Median Family Size in Texico
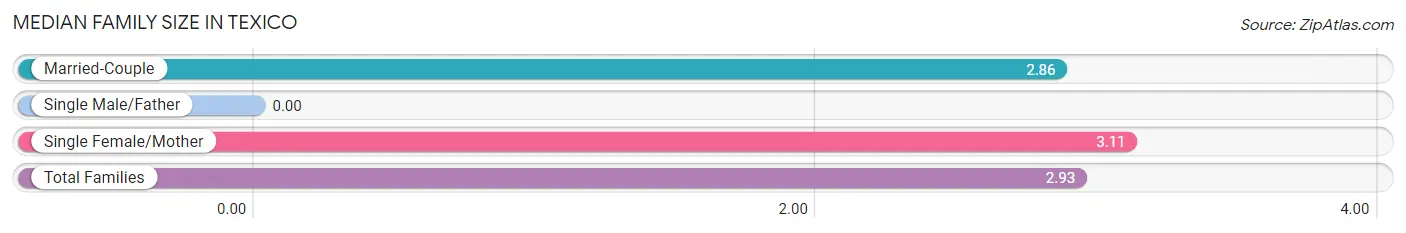
| Family Type | # Families | Family Size |
| Married-Couple | 169 (72.8%) | 2.86 |
| Single Male/Father | 0 (0.0%) | - |
| Single Female/Mother | 63 (27.2%) | 3.11 |
| Total Families | 232 (100.0%) | 2.93 |
Median Household Size in Texico
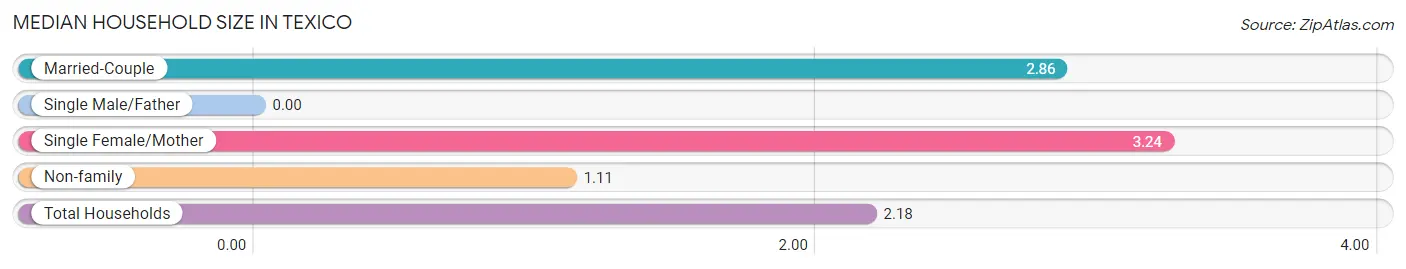
| Household Type | # Households | Household Size |
| Married-Couple | 169 (42.2%) | 2.86 |
| Single Male/Father | 0 (0.0%) | - |
| Single Female/Mother | 63 (15.8%) | 3.24 |
| Non-family | 168 (42.0%) | 1.11 |
| Total Households | 400 (100.0%) | 2.18 |
Household Size by Marriage Status in Texico
Out of a total of 400 households in Texico, 232 (58.0%) are family households, while 168 (42.0%) are nonfamily households. The most numerous type of family households are 2-person households, comprising 72, and the most common type of nonfamily households are 1-person households, comprising 122.
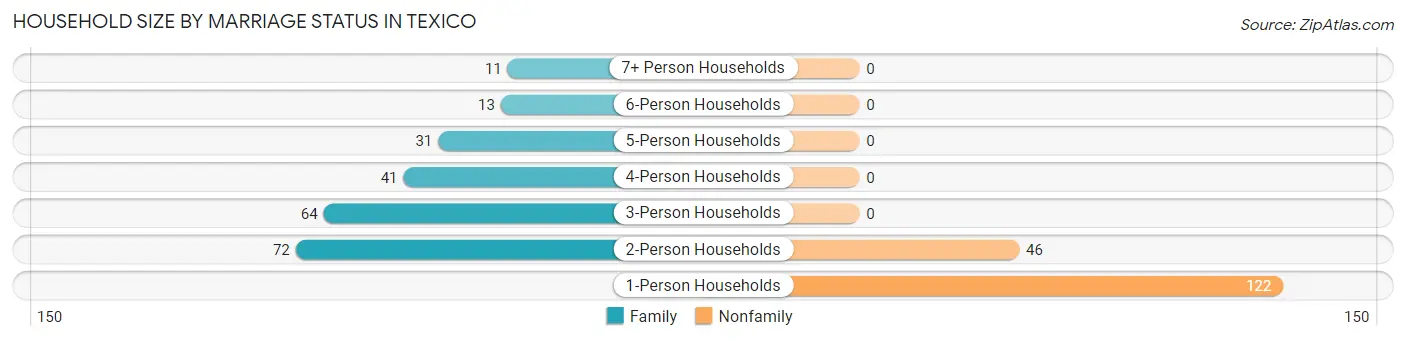
| Household Size | Family Households | Nonfamily Households |
| 1-Person Households | - | 122 (30.5%) |
| 2-Person Households | 72 (18.0%) | 46 (11.5%) |
| 3-Person Households | 64 (16.0%) | 0 (0.0%) |
| 4-Person Households | 41 (10.2%) | 0 (0.0%) |
| 5-Person Households | 31 (7.7%) | 0 (0.0%) |
| 6-Person Households | 13 (3.3%) | 0 (0.0%) |
| 7+ Person Households | 11 (2.8%) | 0 (0.0%) |
| Total | 232 (58.0%) | 168 (42.0%) |
Female Fertility in Texico
Fertility by Age in Texico
| Age Bracket | Women with Births | Births / 1,000 Women |
| 15 to 19 years | 0 (0.0%) | 0.0 |
| 20 to 34 years | 0 (0.0%) | 0.0 |
| 35 to 50 years | 0 (0.0%) | 0.0 |
| Total | 0 (0.0%) | 0.0 |
Fertility by Age by Marriage Status in Texico
| Age Bracket | Married | Unmarried |
| 15 to 19 years | 0 (0.0%) | 0 (0.0%) |
| 20 to 34 years | 0 (0.0%) | 0 (0.0%) |
| 35 to 50 years | 0 (0.0%) | 0 (0.0%) |
| Total | 0 (0.0%) | 0 (0.0%) |
Fertility by Education in Texico
| Educational Attainment | Women with Births | Births / 1,000 Women |
| Less than High School | 0 (0.0%) | 0.0 |
| High School Diploma | 0 (0.0%) | 0.0 |
| College or Associate's Degree | 0 (0.0%) | 0.0 |
| Bachelor's Degree | 0 (0.0%) | 0.0 |
| Graduate Degree | 0 (0.0%) | 0.0 |
| Total | 0 (0.0%) | 0.0 |
Fertility by Education by Marriage Status in Texico
| Educational Attainment | Married | Unmarried |
| Less than High School | 0 (0.0%) | 0 (0.0%) |
| High School Diploma | 0 (0.0%) | 0 (0.0%) |
| College or Associate's Degree | 0 (0.0%) | 0 (0.0%) |
| Bachelor's Degree | 0 (0.0%) | 0 (0.0%) |
| Graduate Degree | 0 (0.0%) | 0 (0.0%) |
| Total | 0 (0.0%) | 0 (0.0%) |
Employment Characteristics in Texico
Employment by Class of Employer in Texico
Among the 435 employed individuals in Texico, private company employees (335 | 77.0%), local government employees (34 | 7.8%), and self-employed (incorporated) (27 | 6.2%) make up the most common classes of employment.
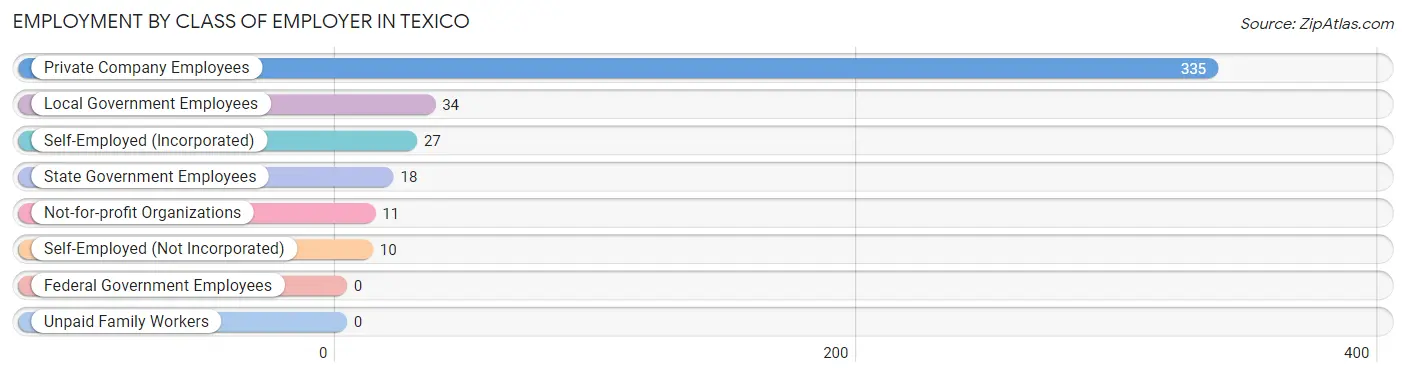
| Employer Class | # Employees | % Employees |
| Private Company Employees | 335 | 77.0% |
| Self-Employed (Incorporated) | 27 | 6.2% |
| Self-Employed (Not Incorporated) | 10 | 2.3% |
| Not-for-profit Organizations | 11 | 2.5% |
| Local Government Employees | 34 | 7.8% |
| State Government Employees | 18 | 4.1% |
| Federal Government Employees | 0 | 0.0% |
| Unpaid Family Workers | 0 | 0.0% |
| Total | 435 | 100.0% |
Employment Status by Age in Texico
According to the labor force statistics for Texico, out of the total population over 16 years of age (685), 65.3% or 447 individuals are in the labor force, with 2.7% or 12 of them unemployed. The age group with the highest labor force participation rate is 30 to 34 years, with 100.0% or 42 individuals in the labor force. Within the labor force, the 35 to 44 years age range has the highest percentage of unemployed individuals, with 29.6% or 8 of them being unemployed.
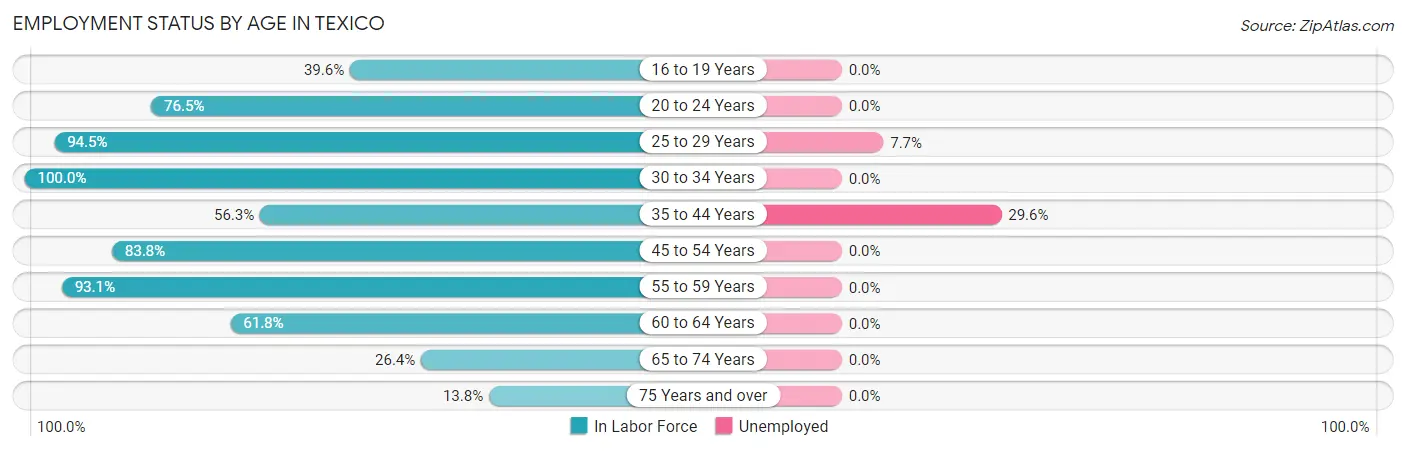
| Age Bracket | In Labor Force | Unemployed |
| 16 to 19 Years | 19 (39.6%) | 0 (0.0%) |
| 20 to 24 Years | 26 (76.5%) | 0 (0.0%) |
| 25 to 29 Years | 52 (94.5%) | 4 (7.7%) |
| 30 to 34 Years | 42 (100.0%) | 0 (0.0%) |
| 35 to 44 Years | 27 (56.3%) | 8 (29.6%) |
| 45 to 54 Years | 119 (83.8%) | 0 (0.0%) |
| 55 to 59 Years | 81 (93.1%) | 0 (0.0%) |
| 60 to 64 Years | 55 (61.8%) | 0 (0.0%) |
| 65 to 74 Years | 14 (26.4%) | 0 (0.0%) |
| 75 Years and over | 12 (13.8%) | 0 (0.0%) |
| Total | 447 (65.3%) | 12 (2.7%) |
Employment Status by Educational Attainment in Texico
According to labor force statistics for Texico, 81.2% of individuals (376) out of the total population between 25 and 64 years of age (463) are in the labor force, with 3.2% or 12 of them being unemployed. The group with the highest labor force participation rate are those with the educational attainment of bachelor's degree or higher, with 100.0% or 54 individuals in the labor force. Within the labor force, individuals with bachelor's degree or higher education have the highest percentage of unemployment, with 7.4% or 4 of them being unemployed.
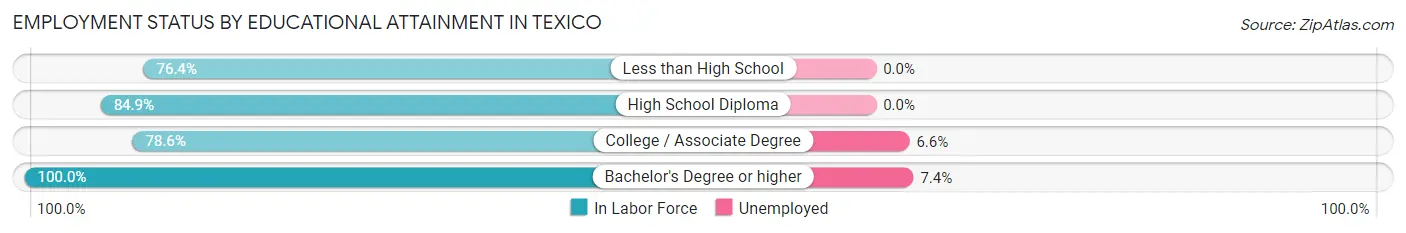
| Educational Attainment | In Labor Force | Unemployed |
| Less than High School | 139 (76.4%) | 0 (0.0%) |
| High School Diploma | 62 (84.9%) | 0 (0.0%) |
| College / Associate Degree | 121 (78.6%) | 10 (6.6%) |
| Bachelor's Degree or higher | 54 (100.0%) | 4 (7.4%) |
| Total | 376 (81.2%) | 15 (3.2%) |
Employment Occupations by Sex in Texico
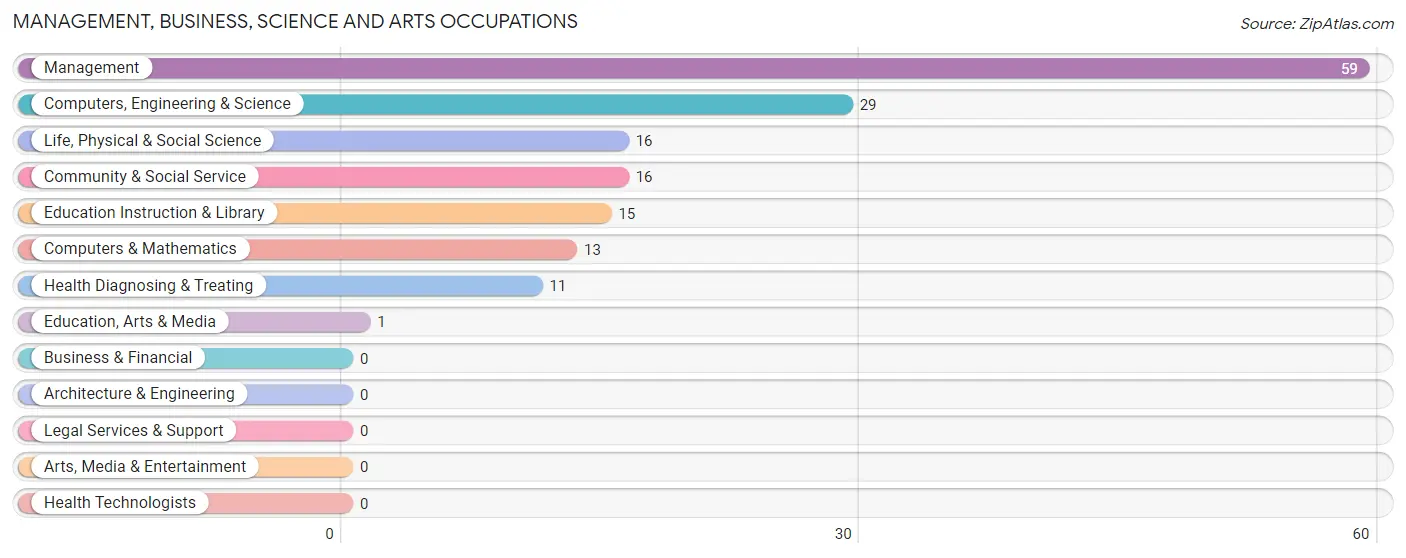
Management, Business, Science and Arts Occupations
The most common Management, Business, Science and Arts occupations in Texico are Management (59 | 13.6%), Computers, Engineering & Science (29 | 6.7%), Life, Physical & Social Science (16 | 3.7%), Community & Social Service (16 | 3.7%), and Education Instruction & Library (15 | 3.5%).
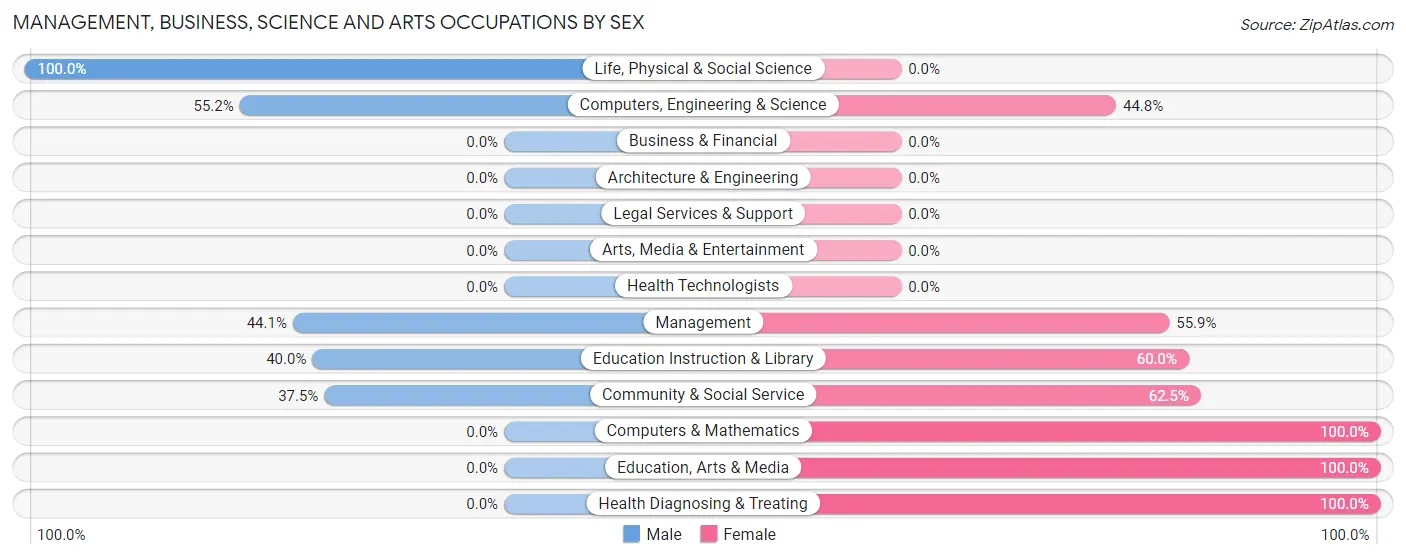
Management, Business, Science and Arts Occupations by Sex
Within the Management, Business, Science and Arts occupations in Texico, the most male-oriented occupations are Life, Physical & Social Science (100.0%), Computers, Engineering & Science (55.2%), and Management (44.1%), while the most female-oriented occupations are Computers & Mathematics (100.0%), Education, Arts & Media (100.0%), and Health Diagnosing & Treating (100.0%).
| Occupation | Male | Female |
| Management | 26 (44.1%) | 33 (55.9%) |
| Business & Financial | 0 (0.0%) | 0 (0.0%) |
| Computers, Engineering & Science | 16 (55.2%) | 13 (44.8%) |
| Computers & Mathematics | 0 (0.0%) | 13 (100.0%) |
| Architecture & Engineering | 0 (0.0%) | 0 (0.0%) |
| Life, Physical & Social Science | 16 (100.0%) | 0 (0.0%) |
| Community & Social Service | 6 (37.5%) | 10 (62.5%) |
| Education, Arts & Media | 0 (0.0%) | 1 (100.0%) |
| Legal Services & Support | 0 (0.0%) | 0 (0.0%) |
| Education Instruction & Library | 6 (40.0%) | 9 (60.0%) |
| Arts, Media & Entertainment | 0 (0.0%) | 0 (0.0%) |
| Health Diagnosing & Treating | 0 (0.0%) | 11 (100.0%) |
| Health Technologists | 0 (0.0%) | 0 (0.0%) |
| Total (Category) | 48 (41.7%) | 67 (58.3%) |
| Total (Overall) | 222 (51.0%) | 213 (49.0%) |
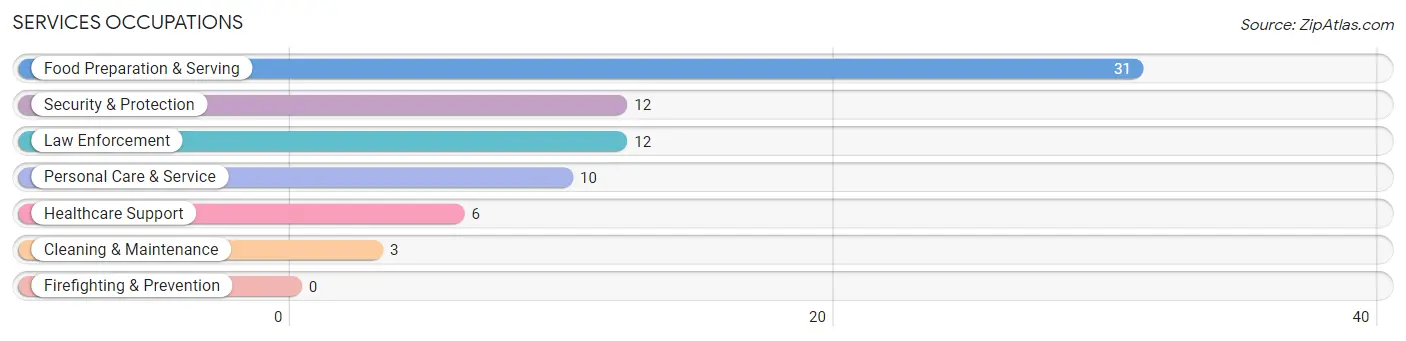
Services Occupations
The most common Services occupations in Texico are Food Preparation & Serving (31 | 7.1%), Security & Protection (12 | 2.8%), Law Enforcement (12 | 2.8%), Personal Care & Service (10 | 2.3%), and Healthcare Support (6 | 1.4%).
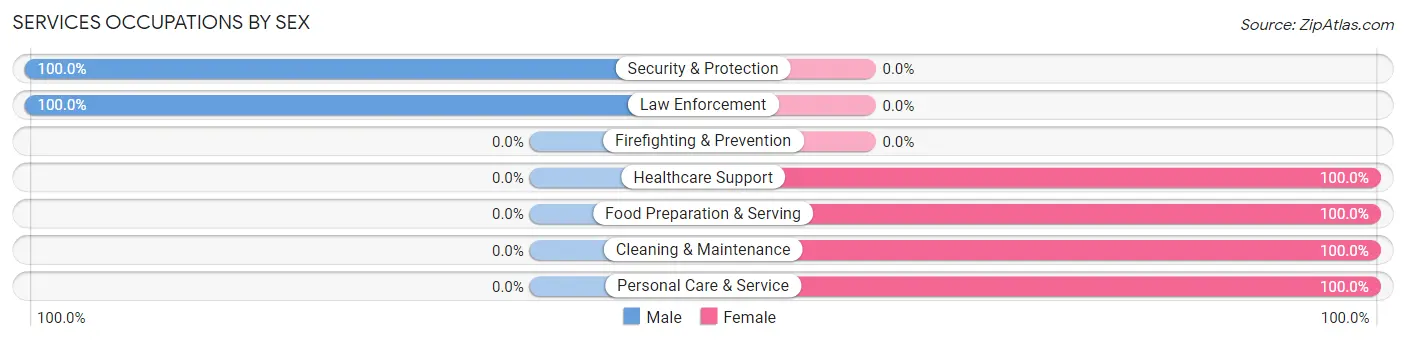
Services Occupations by Sex
Within the Services occupations in Texico, the most male-oriented occupations are Security & Protection (100.0%), and Law Enforcement (100.0%), while the most female-oriented occupations are Healthcare Support (100.0%), Food Preparation & Serving (100.0%), and Cleaning & Maintenance (100.0%).
| Occupation | Male | Female |
| Healthcare Support | 0 (0.0%) | 6 (100.0%) |
| Security & Protection | 12 (100.0%) | 0 (0.0%) |
| Firefighting & Prevention | 0 (0.0%) | 0 (0.0%) |
| Law Enforcement | 12 (100.0%) | 0 (0.0%) |
| Food Preparation & Serving | 0 (0.0%) | 31 (100.0%) |
| Cleaning & Maintenance | 0 (0.0%) | 3 (100.0%) |
| Personal Care & Service | 0 (0.0%) | 10 (100.0%) |
| Total (Category) | 12 (19.4%) | 50 (80.6%) |
| Total (Overall) | 222 (51.0%) | 213 (49.0%) |
Sales and Office Occupations
The most common Sales and Office occupations in Texico are Office & Administration (55 | 12.6%), and Sales & Related (29 | 6.7%).

Sales and Office Occupations by Sex

| Occupation | Male | Female |
| Sales & Related | 15 (51.7%) | 14 (48.3%) |
| Office & Administration | 3 (5.4%) | 52 (94.6%) |
| Total (Category) | 18 (21.4%) | 66 (78.6%) |
| Total (Overall) | 222 (51.0%) | 213 (49.0%) |
Natural Resources, Construction and Maintenance Occupations
The most common Natural Resources, Construction and Maintenance occupations in Texico are Farming, Fishing & Forestry (37 | 8.5%), and Construction & Extraction (24 | 5.5%).
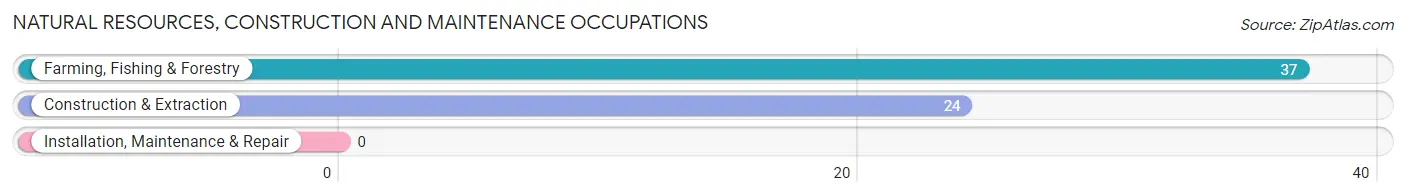
Natural Resources, Construction and Maintenance Occupations by Sex
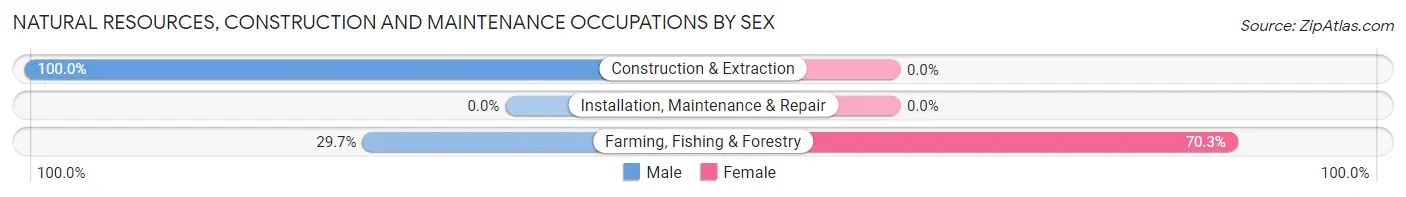
| Occupation | Male | Female |
| Farming, Fishing & Forestry | 11 (29.7%) | 26 (70.3%) |
| Construction & Extraction | 24 (100.0%) | 0 (0.0%) |
| Installation, Maintenance & Repair | 0 (0.0%) | 0 (0.0%) |
| Total (Category) | 35 (57.4%) | 26 (42.6%) |
| Total (Overall) | 222 (51.0%) | 213 (49.0%) |
Production, Transportation and Moving Occupations
The most common Production, Transportation and Moving occupations in Texico are Transportation (83 | 19.1%), Production (22 | 5.1%), and Material Moving (8 | 1.8%).
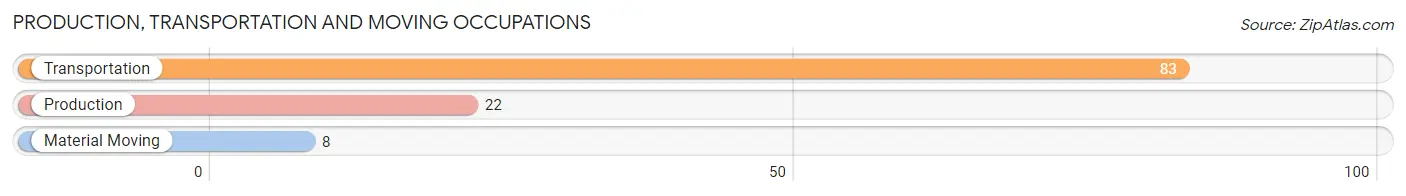
Production, Transportation and Moving Occupations by Sex
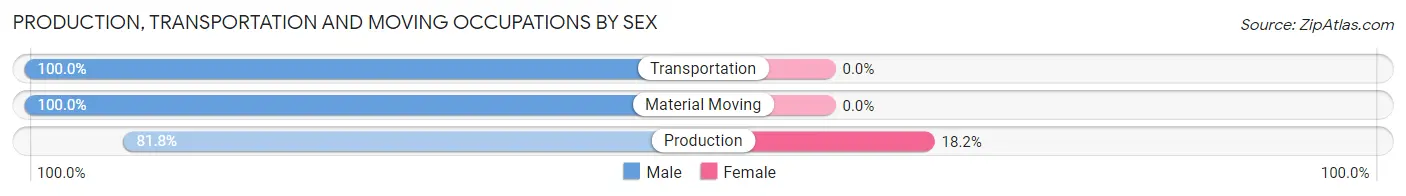
| Occupation | Male | Female |
| Production | 18 (81.8%) | 4 (18.2%) |
| Transportation | 83 (100.0%) | 0 (0.0%) |
| Material Moving | 8 (100.0%) | 0 (0.0%) |
| Total (Category) | 109 (96.5%) | 4 (3.5%) |
| Total (Overall) | 222 (51.0%) | 213 (49.0%) |
Employment Industries by Sex in Texico
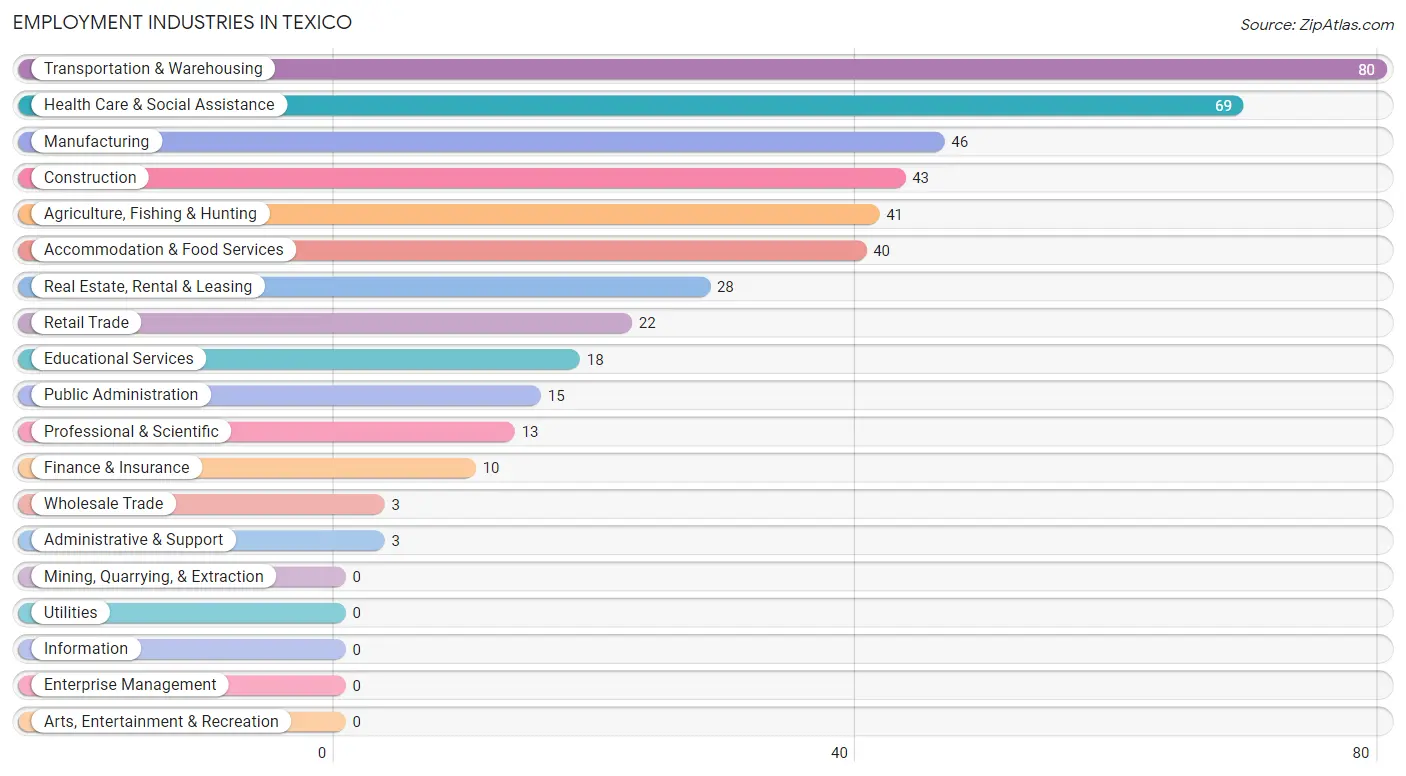
Employment Industries in Texico
The major employment industries in Texico include Transportation & Warehousing (80 | 18.4%), Health Care & Social Assistance (69 | 15.9%), Manufacturing (46 | 10.6%), Construction (43 | 9.9%), and Agriculture, Fishing & Hunting (41 | 9.4%).
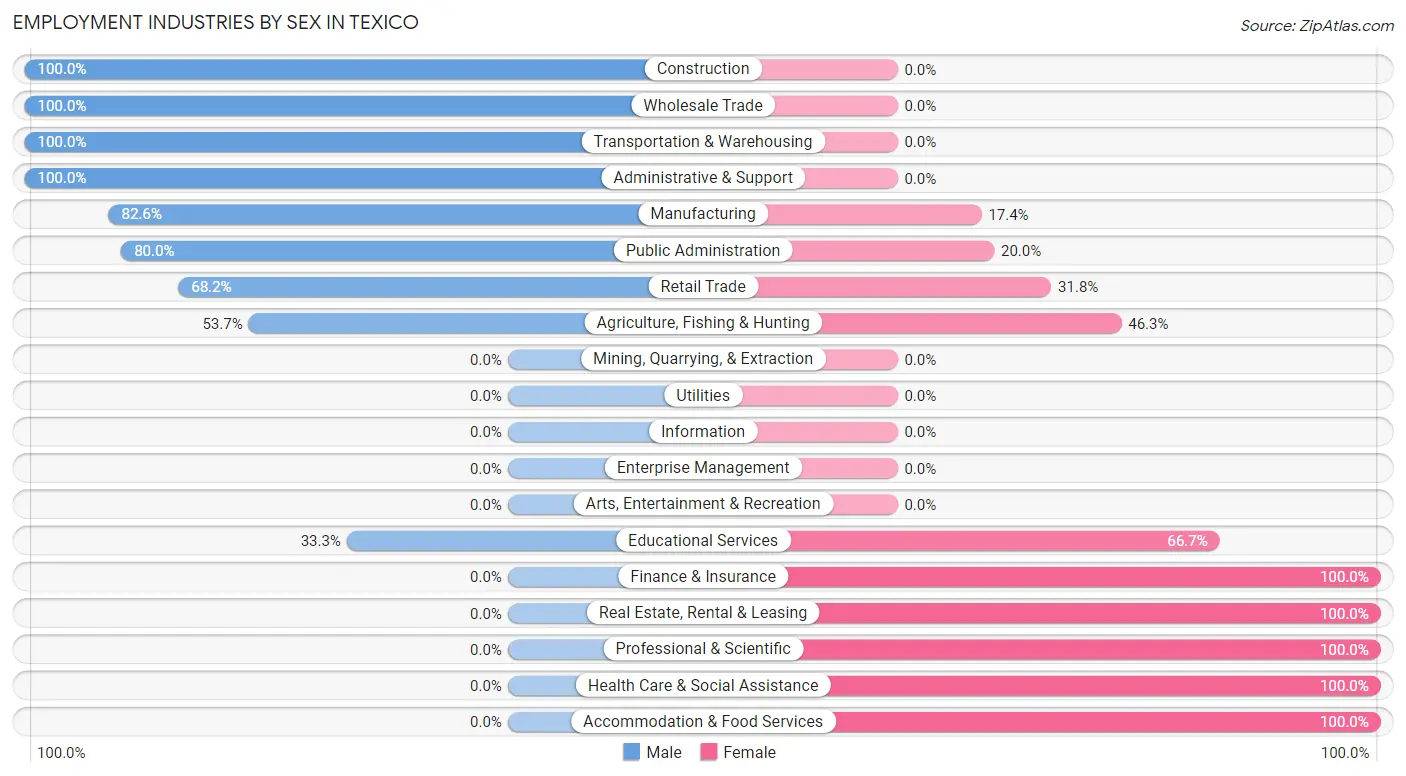
Employment Industries by Sex in Texico
The Texico industries that see more men than women are Construction (100.0%), Wholesale Trade (100.0%), and Transportation & Warehousing (100.0%), whereas the industries that tend to have a higher number of women are Finance & Insurance (100.0%), Real Estate, Rental & Leasing (100.0%), and Professional & Scientific (100.0%).
| Industry | Male | Female |
| Agriculture, Fishing & Hunting | 22 (53.7%) | 19 (46.3%) |
| Mining, Quarrying, & Extraction | 0 (0.0%) | 0 (0.0%) |
| Construction | 43 (100.0%) | 0 (0.0%) |
| Manufacturing | 38 (82.6%) | 8 (17.4%) |
| Wholesale Trade | 3 (100.0%) | 0 (0.0%) |
| Retail Trade | 15 (68.2%) | 7 (31.8%) |
| Transportation & Warehousing | 80 (100.0%) | 0 (0.0%) |
| Utilities | 0 (0.0%) | 0 (0.0%) |
| Information | 0 (0.0%) | 0 (0.0%) |
| Finance & Insurance | 0 (0.0%) | 10 (100.0%) |
| Real Estate, Rental & Leasing | 0 (0.0%) | 28 (100.0%) |
| Professional & Scientific | 0 (0.0%) | 13 (100.0%) |
| Enterprise Management | 0 (0.0%) | 0 (0.0%) |
| Administrative & Support | 3 (100.0%) | 0 (0.0%) |
| Educational Services | 6 (33.3%) | 12 (66.7%) |
| Health Care & Social Assistance | 0 (0.0%) | 69 (100.0%) |
| Arts, Entertainment & Recreation | 0 (0.0%) | 0 (0.0%) |
| Accommodation & Food Services | 0 (0.0%) | 40 (100.0%) |
| Public Administration | 12 (80.0%) | 3 (20.0%) |
| Total | 222 (51.0%) | 213 (49.0%) |
Education in Texico
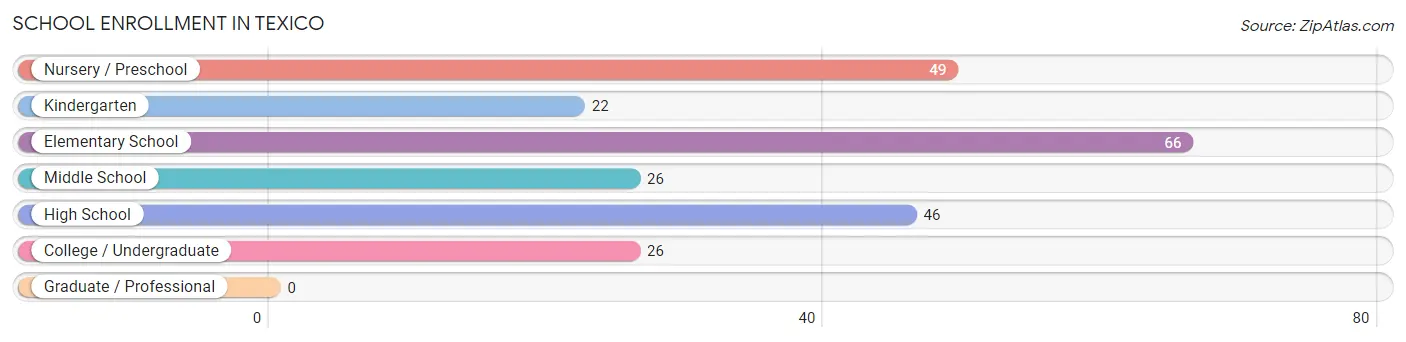
School Enrollment in Texico
The most common levels of schooling among the 235 students in Texico are elementary school (66 | 28.1%), nursery / preschool (49 | 20.8%), and high school (46 | 19.6%).
| School Level | # Students | % Students |
| Nursery / Preschool | 49 | 20.8% |
| Kindergarten | 22 | 9.4% |
| Elementary School | 66 | 28.1% |
| Middle School | 26 | 11.1% |
| High School | 46 | 19.6% |
| College / Undergraduate | 26 | 11.1% |
| Graduate / Professional | 0 | 0.0% |
| Total | 235 | 100.0% |
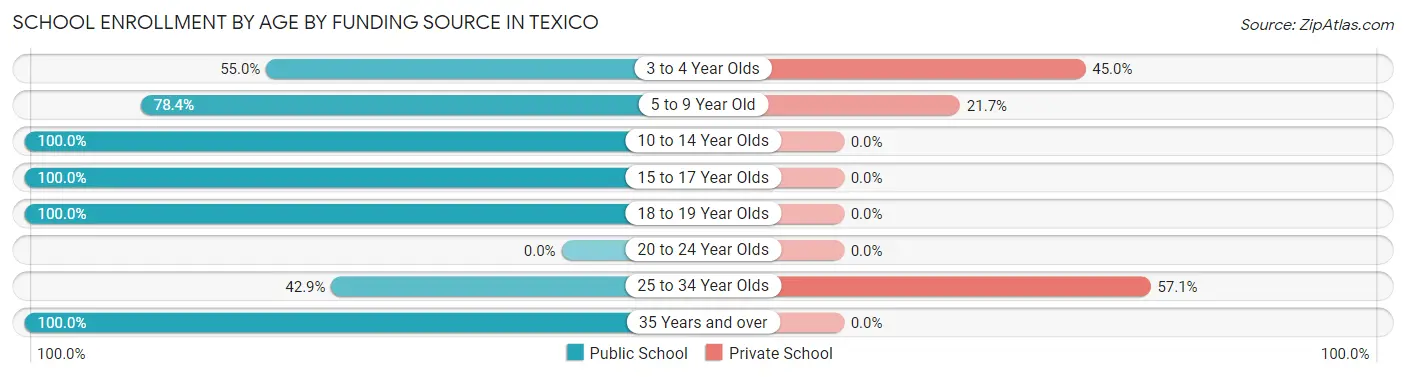
School Enrollment by Age by Funding Source in Texico
Out of a total of 235 students who are enrolled in schools in Texico, 43 (18.3%) attend a private institution, while the remaining 192 (81.7%) are enrolled in public schools. The age group of 25 to 34 year olds has the highest likelihood of being enrolled in private schools, with 4 (57.1% in the age bracket) enrolled. Conversely, the age group of 10 to 14 year olds has the lowest likelihood of being enrolled in a private school, with 33 (100.0% in the age bracket) attending a public institution.
| Age Bracket | Public School | Private School |
| 3 to 4 Year Olds | 22 (55.0%) | 18 (45.0%) |
| 5 to 9 Year Old | 76 (78.3%) | 21 (21.6%) |
| 10 to 14 Year Olds | 33 (100.0%) | 0 (0.0%) |
| 15 to 17 Year Olds | 36 (100.0%) | 0 (0.0%) |
| 18 to 19 Year Olds | 15 (100.0%) | 0 (0.0%) |
| 20 to 24 Year Olds | 0 (0.0%) | 0 (0.0%) |
| 25 to 34 Year Olds | 3 (42.9%) | 4 (57.1%) |
| 35 Years and over | 7 (100.0%) | 0 (0.0%) |
| Total | 192 (81.7%) | 43 (18.3%) |
Educational Attainment by Field of Study in Texico
Psychology (28 | 51.8%), education (22 | 40.7%), and communications (4 | 7.4%) are the most common fields of study among 54 individuals in Texico who have obtained a bachelor's degree or higher.
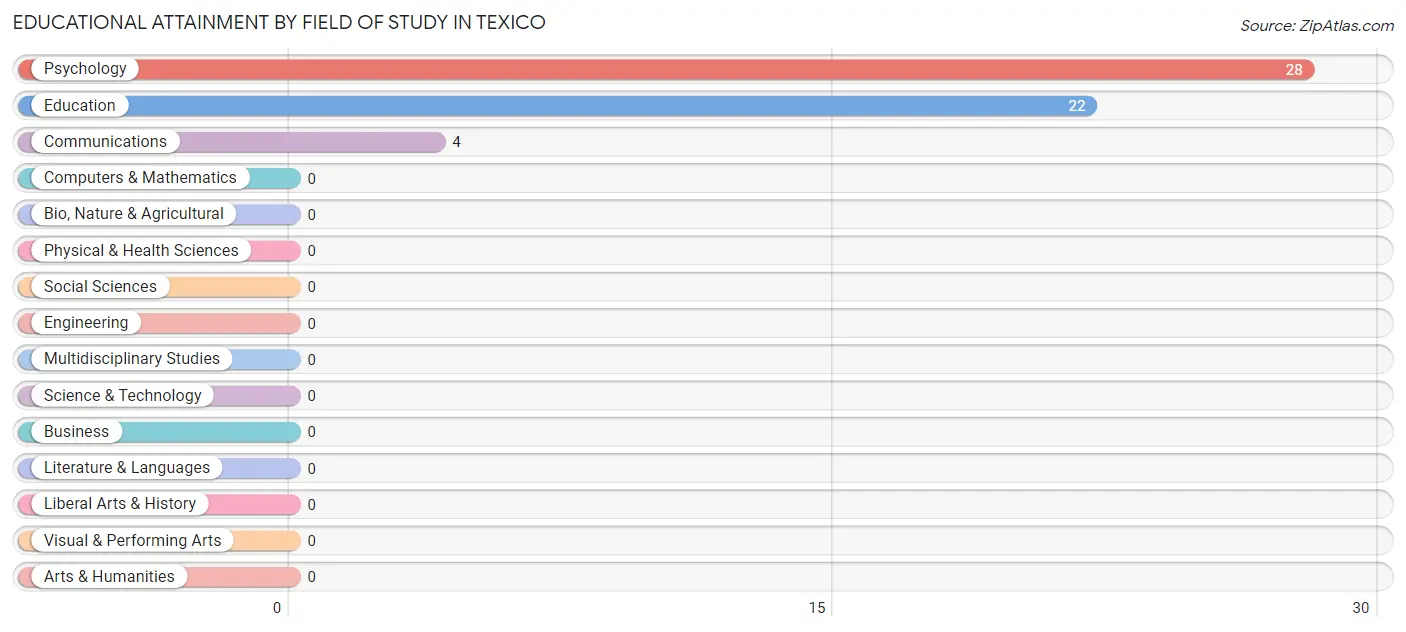
| Field of Study | # Graduates | % Graduates |
| Computers & Mathematics | 0 | 0.0% |
| Bio, Nature & Agricultural | 0 | 0.0% |
| Physical & Health Sciences | 0 | 0.0% |
| Psychology | 28 | 51.8% |
| Social Sciences | 0 | 0.0% |
| Engineering | 0 | 0.0% |
| Multidisciplinary Studies | 0 | 0.0% |
| Science & Technology | 0 | 0.0% |
| Business | 0 | 0.0% |
| Education | 22 | 40.7% |
| Literature & Languages | 0 | 0.0% |
| Liberal Arts & History | 0 | 0.0% |
| Visual & Performing Arts | 0 | 0.0% |
| Communications | 4 | 7.4% |
| Arts & Humanities | 0 | 0.0% |
| Total | 54 | 100.0% |
Transportation & Commute in Texico
Vehicle Availability by Sex in Texico
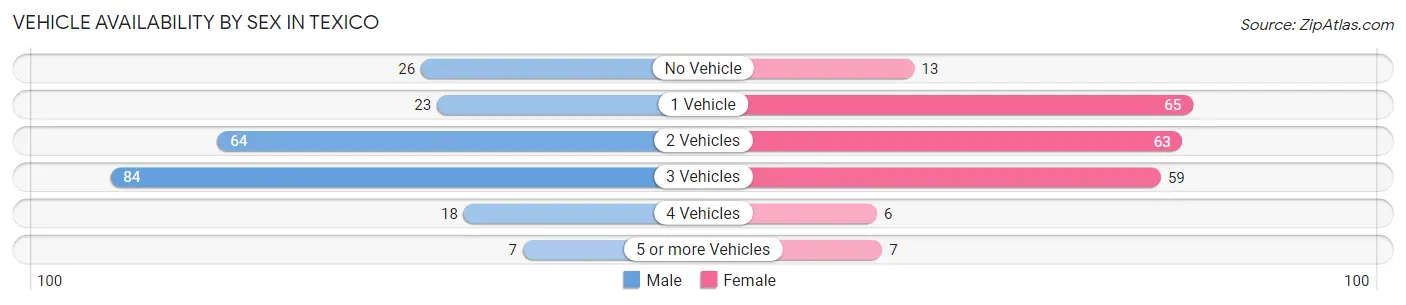
The most prevalent vehicle ownership categories in Texico are males with 3 vehicles (84, accounting for 37.8%) and females with 3 vehicles (59, making up 39.4%).
| Vehicles Available | Male | Female |
| No Vehicle | 26 (11.7%) | 13 (6.1%) |
| 1 Vehicle | 23 (10.4%) | 65 (30.5%) |
| 2 Vehicles | 64 (28.8%) | 63 (29.6%) |
| 3 Vehicles | 84 (37.8%) | 59 (27.7%) |
| 4 Vehicles | 18 (8.1%) | 6 (2.8%) |
| 5 or more Vehicles | 7 (3.2%) | 7 (3.3%) |
| Total | 222 (100.0%) | 213 (100.0%) |
Commute Time in Texico
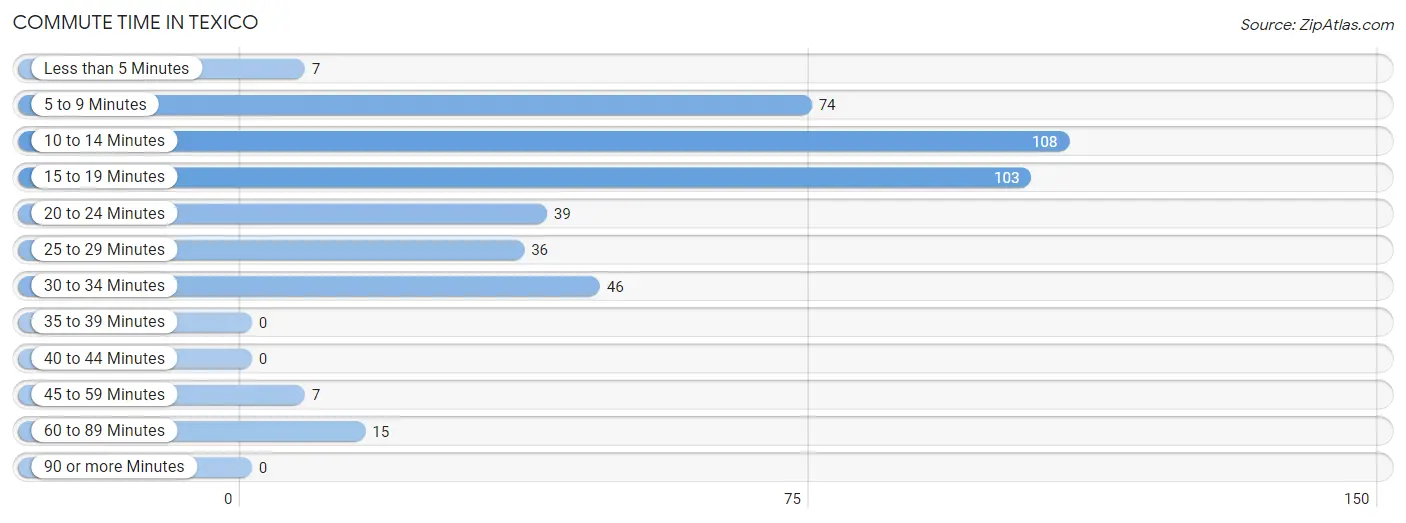
The most frequently occuring commute durations in Texico are 10 to 14 minutes (108 commuters, 24.8%), 15 to 19 minutes (103 commuters, 23.7%), and 5 to 9 minutes (74 commuters, 17.0%).
| Commute Time | # Commuters | % Commuters |
| Less than 5 Minutes | 7 | 1.6% |
| 5 to 9 Minutes | 74 | 17.0% |
| 10 to 14 Minutes | 108 | 24.8% |
| 15 to 19 Minutes | 103 | 23.7% |
| 20 to 24 Minutes | 39 | 9.0% |
| 25 to 29 Minutes | 36 | 8.3% |
| 30 to 34 Minutes | 46 | 10.6% |
| 35 to 39 Minutes | 0 | 0.0% |
| 40 to 44 Minutes | 0 | 0.0% |
| 45 to 59 Minutes | 7 | 1.6% |
| 60 to 89 Minutes | 15 | 3.5% |
| 90 or more Minutes | 0 | 0.0% |
Commute Time by Sex in Texico
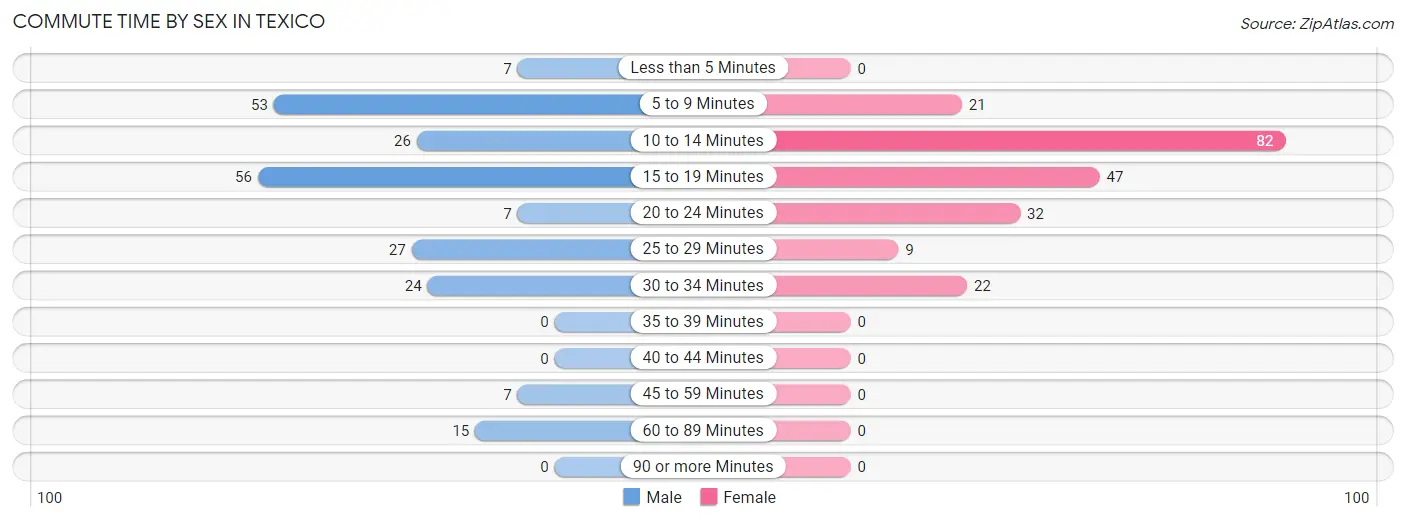
The most common commute times in Texico are 15 to 19 minutes (56 commuters, 25.2%) for males and 10 to 14 minutes (82 commuters, 38.5%) for females.
| Commute Time | Male | Female |
| Less than 5 Minutes | 7 (3.2%) | 0 (0.0%) |
| 5 to 9 Minutes | 53 (23.9%) | 21 (9.9%) |
| 10 to 14 Minutes | 26 (11.7%) | 82 (38.5%) |
| 15 to 19 Minutes | 56 (25.2%) | 47 (22.1%) |
| 20 to 24 Minutes | 7 (3.2%) | 32 (15.0%) |
| 25 to 29 Minutes | 27 (12.2%) | 9 (4.2%) |
| 30 to 34 Minutes | 24 (10.8%) | 22 (10.3%) |
| 35 to 39 Minutes | 0 (0.0%) | 0 (0.0%) |
| 40 to 44 Minutes | 0 (0.0%) | 0 (0.0%) |
| 45 to 59 Minutes | 7 (3.2%) | 0 (0.0%) |
| 60 to 89 Minutes | 15 (6.8%) | 0 (0.0%) |
| 90 or more Minutes | 0 (0.0%) | 0 (0.0%) |
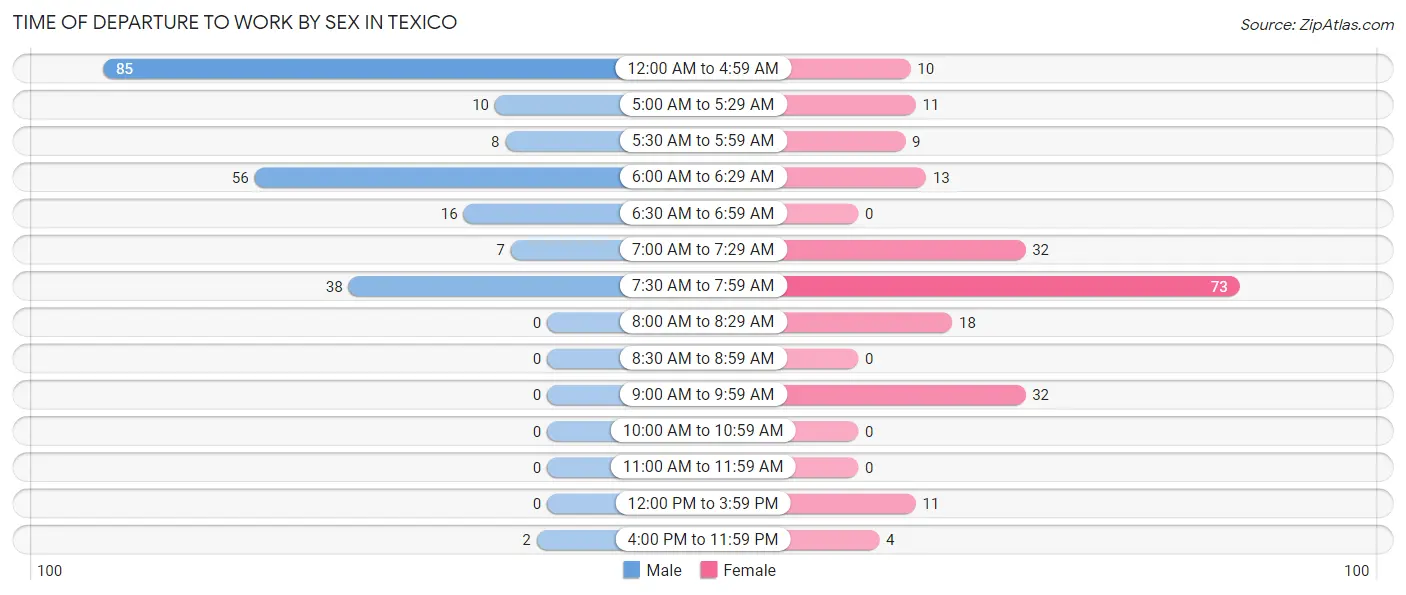
Time of Departure to Work by Sex in Texico
The most frequent times of departure to work in Texico are 12:00 AM to 4:59 AM (85, 38.3%) for males and 7:30 AM to 7:59 AM (73, 34.3%) for females.
| Time of Departure | Male | Female |
| 12:00 AM to 4:59 AM | 85 (38.3%) | 10 (4.7%) |
| 5:00 AM to 5:29 AM | 10 (4.5%) | 11 (5.2%) |
| 5:30 AM to 5:59 AM | 8 (3.6%) | 9 (4.2%) |
| 6:00 AM to 6:29 AM | 56 (25.2%) | 13 (6.1%) |
| 6:30 AM to 6:59 AM | 16 (7.2%) | 0 (0.0%) |
| 7:00 AM to 7:29 AM | 7 (3.2%) | 32 (15.0%) |
| 7:30 AM to 7:59 AM | 38 (17.1%) | 73 (34.3%) |
| 8:00 AM to 8:29 AM | 0 (0.0%) | 18 (8.5%) |
| 8:30 AM to 8:59 AM | 0 (0.0%) | 0 (0.0%) |
| 9:00 AM to 9:59 AM | 0 (0.0%) | 32 (15.0%) |
| 10:00 AM to 10:59 AM | 0 (0.0%) | 0 (0.0%) |
| 11:00 AM to 11:59 AM | 0 (0.0%) | 0 (0.0%) |
| 12:00 PM to 3:59 PM | 0 (0.0%) | 11 (5.2%) |
| 4:00 PM to 11:59 PM | 2 (0.9%) | 4 (1.9%) |
| Total | 222 (100.0%) | 213 (100.0%) |
Housing Occupancy in Texico
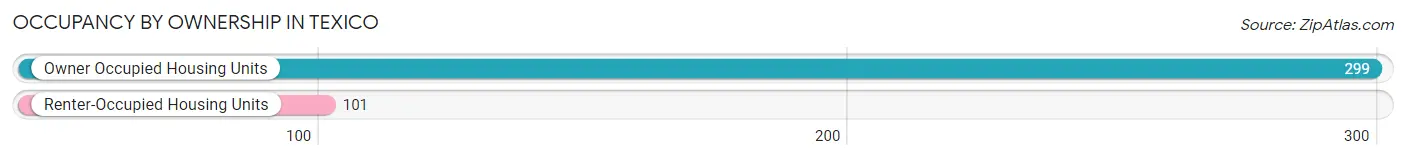
Occupancy by Ownership in Texico
Of the total 400 dwellings in Texico, owner-occupied units account for 299 (74.8%), while renter-occupied units make up 101 (25.3%).
| Occupancy | # Housing Units | % Housing Units |
| Owner Occupied Housing Units | 299 | 74.8% |
| Renter-Occupied Housing Units | 101 | 25.3% |
| Total Occupied Housing Units | 400 | 100.0% |
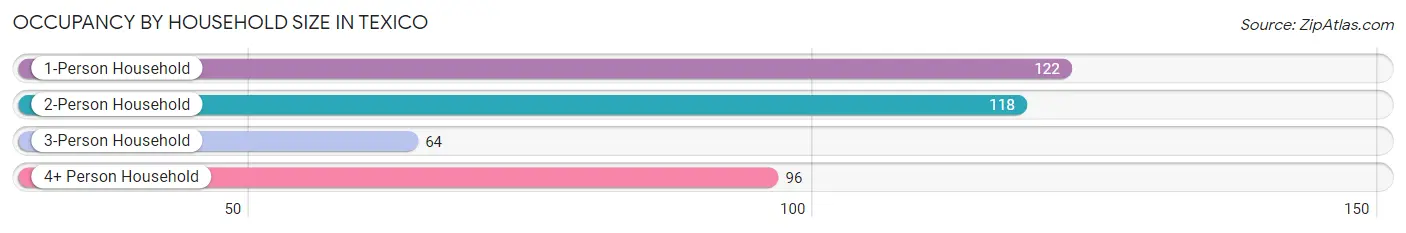
Occupancy by Household Size in Texico
| Household Size | # Housing Units | % Housing Units |
| 1-Person Household | 122 | 30.5% |
| 2-Person Household | 118 | 29.5% |
| 3-Person Household | 64 | 16.0% |
| 4+ Person Household | 96 | 24.0% |
| Total Housing Units | 400 | 100.0% |
Occupancy by Ownership by Household Size in Texico
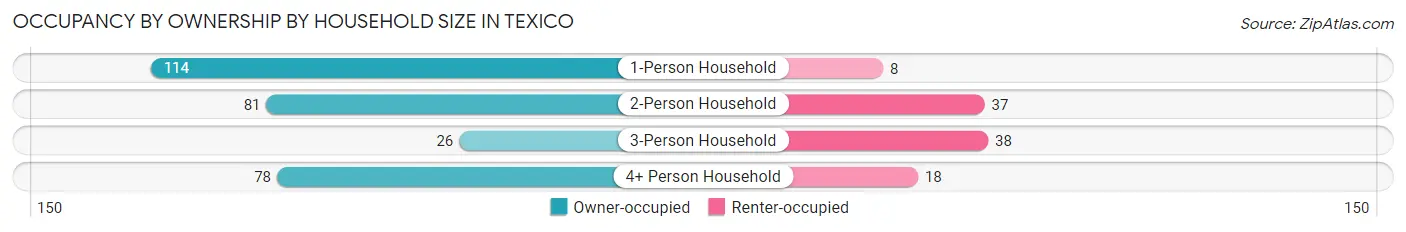
| Household Size | Owner-occupied | Renter-occupied |
| 1-Person Household | 114 (93.4%) | 8 (6.6%) |
| 2-Person Household | 81 (68.6%) | 37 (31.4%) |
| 3-Person Household | 26 (40.6%) | 38 (59.4%) |
| 4+ Person Household | 78 (81.2%) | 18 (18.8%) |
| Total Housing Units | 299 (74.8%) | 101 (25.3%) |
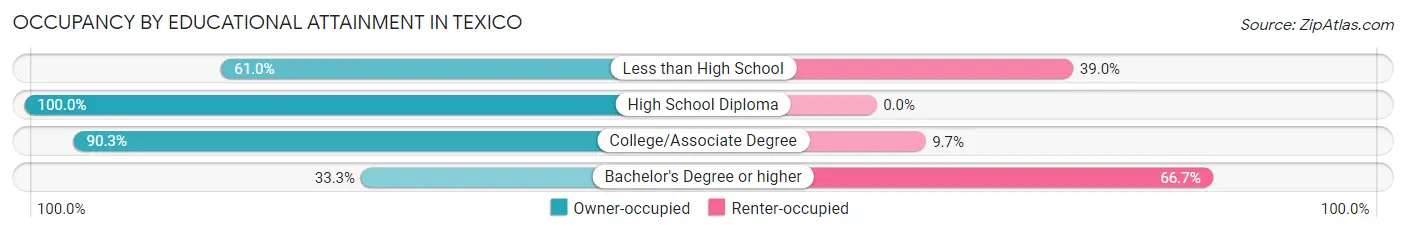
Occupancy by Educational Attainment in Texico
| Household Size | Owner-occupied | Renter-occupied |
| Less than High School | 86 (61.0%) | 55 (39.0%) |
| High School Diploma | 67 (100.0%) | 0 (0.0%) |
| College/Associate Degree | 130 (90.3%) | 14 (9.7%) |
| Bachelor's Degree or higher | 16 (33.3%) | 32 (66.7%) |
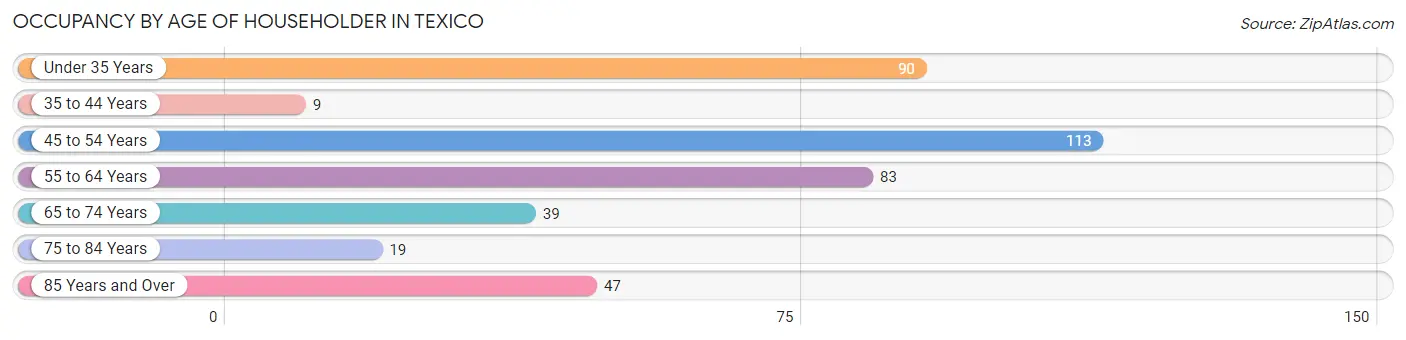
Occupancy by Age of Householder in Texico
| Age Bracket | # Households | % Households |
| Under 35 Years | 90 | 22.5% |
| 35 to 44 Years | 9 | 2.2% |
| 45 to 54 Years | 113 | 28.2% |
| 55 to 64 Years | 83 | 20.7% |
| 65 to 74 Years | 39 | 9.8% |
| 75 to 84 Years | 19 | 4.8% |
| 85 Years and Over | 47 | 11.7% |
| Total | 400 | 100.0% |
Housing Finances in Texico
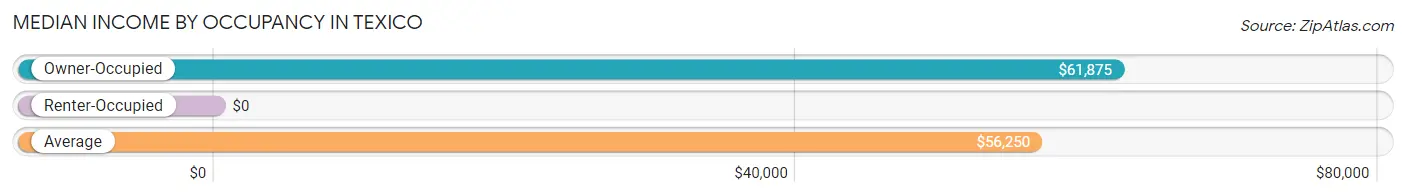
Median Income by Occupancy in Texico
| Occupancy Type | # Households | Median Income |
| Owner-Occupied | 299 (74.8%) | $61,875 |
| Renter-Occupied | 101 (25.3%) | $0 |
| Average | 400 (100.0%) | $56,250 |
Occupancy by Householder Income Bracket in Texico
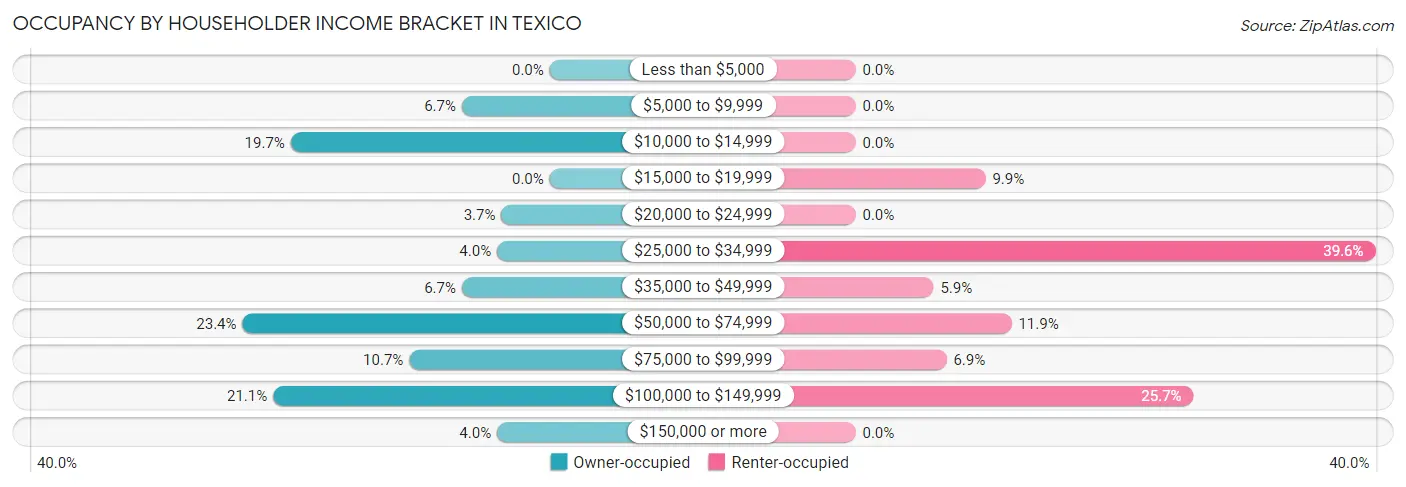
| Income Bracket | Owner-occupied | Renter-occupied |
| Less than $5,000 | 0 (0.0%) | 0 (0.0%) |
| $5,000 to $9,999 | 20 (6.7%) | 0 (0.0%) |
| $10,000 to $14,999 | 59 (19.7%) | 0 (0.0%) |
| $15,000 to $19,999 | 0 (0.0%) | 10 (9.9%) |
| $20,000 to $24,999 | 11 (3.7%) | 0 (0.0%) |
| $25,000 to $34,999 | 12 (4.0%) | 40 (39.6%) |
| $35,000 to $49,999 | 20 (6.7%) | 6 (5.9%) |
| $50,000 to $74,999 | 70 (23.4%) | 12 (11.9%) |
| $75,000 to $99,999 | 32 (10.7%) | 7 (6.9%) |
| $100,000 to $149,999 | 63 (21.1%) | 26 (25.7%) |
| $150,000 or more | 12 (4.0%) | 0 (0.0%) |
| Total | 299 (100.0%) | 101 (100.0%) |
Monthly Housing Cost Tiers in Texico
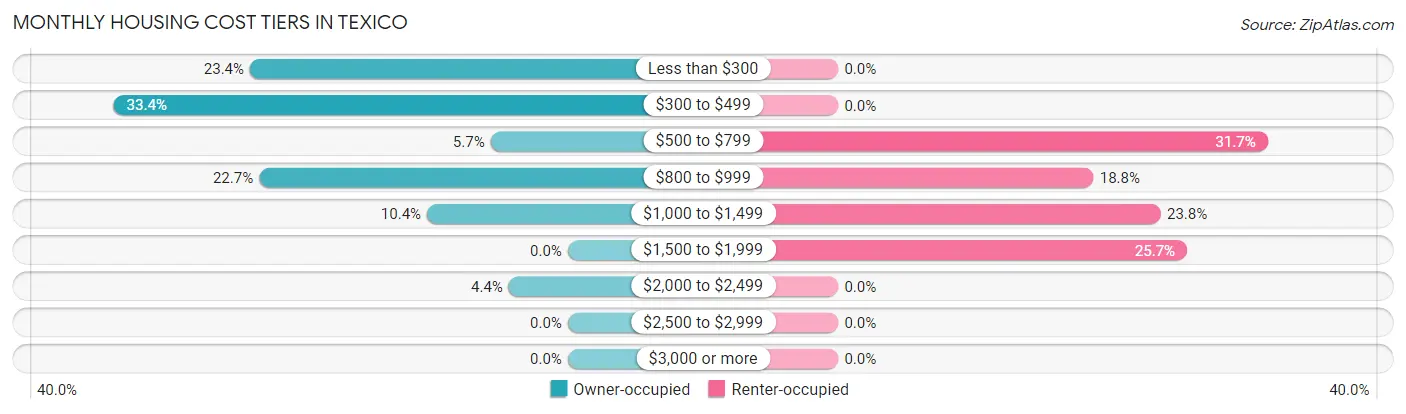
| Monthly Cost | Owner-occupied | Renter-occupied |
| Less than $300 | 70 (23.4%) | 0 (0.0%) |
| $300 to $499 | 100 (33.4%) | 0 (0.0%) |
| $500 to $799 | 17 (5.7%) | 32 (31.7%) |
| $800 to $999 | 68 (22.7%) | 19 (18.8%) |
| $1,000 to $1,499 | 31 (10.4%) | 24 (23.8%) |
| $1,500 to $1,999 | 0 (0.0%) | 26 (25.7%) |
| $2,000 to $2,499 | 13 (4.3%) | 0 (0.0%) |
| $2,500 to $2,999 | 0 (0.0%) | 0 (0.0%) |
| $3,000 or more | 0 (0.0%) | 0 (0.0%) |
| Total | 299 (100.0%) | 101 (100.0%) |
Physical Housing Characteristics in Texico
Housing Structures in Texico
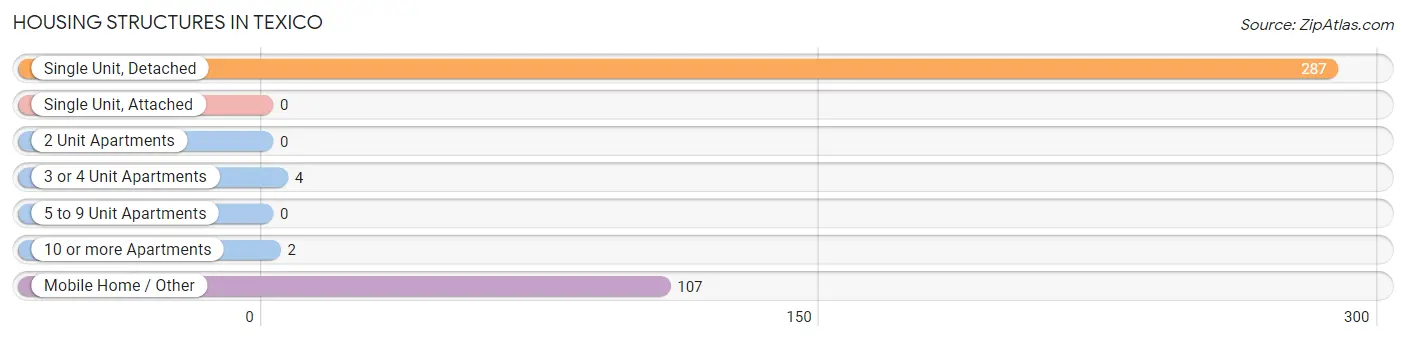
| Structure Type | # Housing Units | % Housing Units |
| Single Unit, Detached | 287 | 71.8% |
| Single Unit, Attached | 0 | 0.0% |
| 2 Unit Apartments | 0 | 0.0% |
| 3 or 4 Unit Apartments | 4 | 1.0% |
| 5 to 9 Unit Apartments | 0 | 0.0% |
| 10 or more Apartments | 2 | 0.5% |
| Mobile Home / Other | 107 | 26.8% |
| Total | 400 | 100.0% |
Housing Structures by Occupancy in Texico
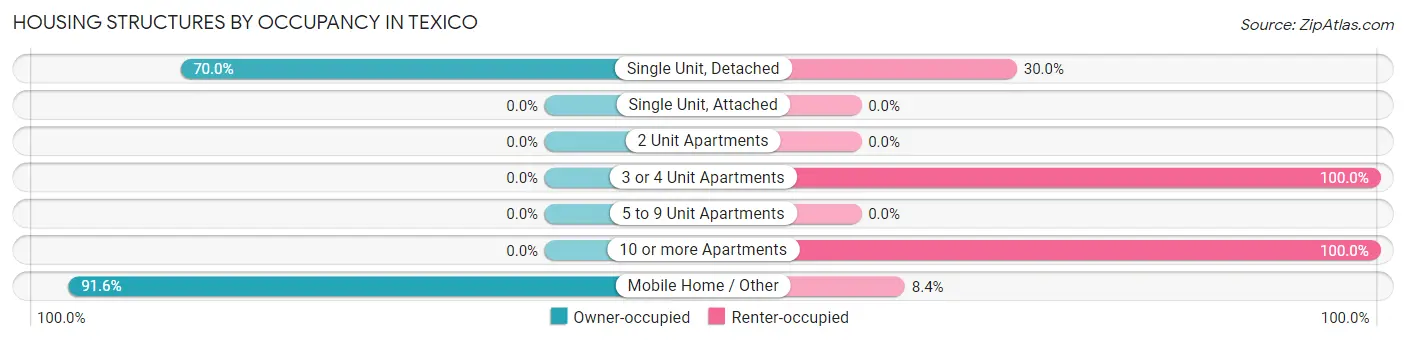
| Structure Type | Owner-occupied | Renter-occupied |
| Single Unit, Detached | 201 (70.0%) | 86 (30.0%) |
| Single Unit, Attached | 0 (0.0%) | 0 (0.0%) |
| 2 Unit Apartments | 0 (0.0%) | 0 (0.0%) |
| 3 or 4 Unit Apartments | 0 (0.0%) | 4 (100.0%) |
| 5 to 9 Unit Apartments | 0 (0.0%) | 0 (0.0%) |
| 10 or more Apartments | 0 (0.0%) | 2 (100.0%) |
| Mobile Home / Other | 98 (91.6%) | 9 (8.4%) |
| Total | 299 (74.8%) | 101 (25.3%) |
Housing Structures by Number of Rooms in Texico
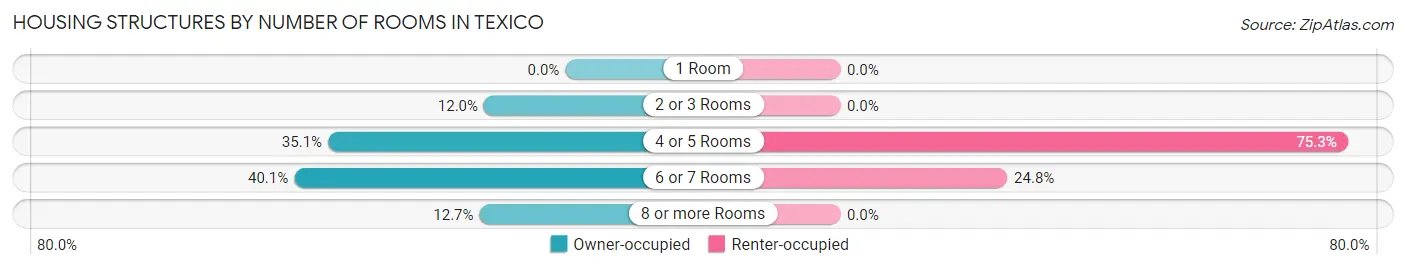
| Number of Rooms | Owner-occupied | Renter-occupied |
| 1 Room | 0 (0.0%) | 0 (0.0%) |
| 2 or 3 Rooms | 36 (12.0%) | 0 (0.0%) |
| 4 or 5 Rooms | 105 (35.1%) | 76 (75.2%) |
| 6 or 7 Rooms | 120 (40.1%) | 25 (24.7%) |
| 8 or more Rooms | 38 (12.7%) | 0 (0.0%) |
| Total | 299 (100.0%) | 101 (100.0%) |
Housing Structure by Heating Type in Texico
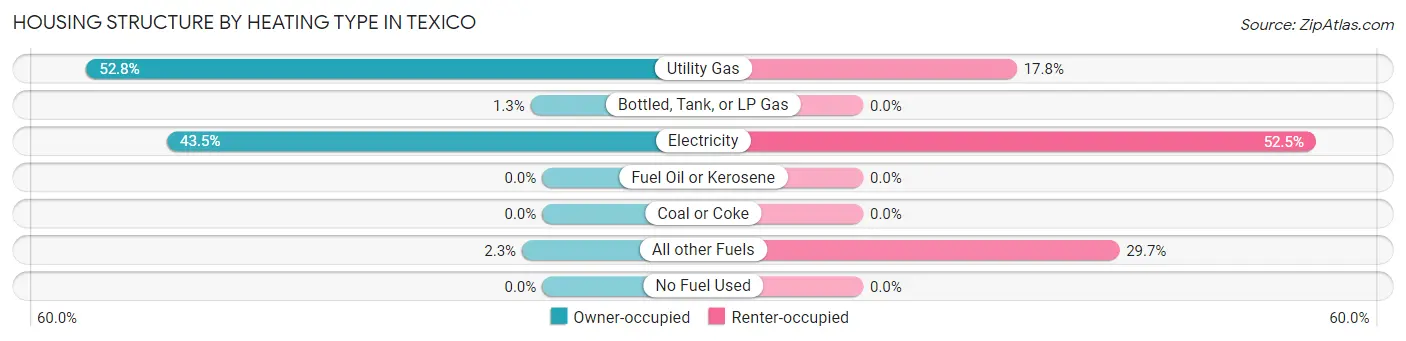
| Heating Type | Owner-occupied | Renter-occupied |
| Utility Gas | 158 (52.8%) | 18 (17.8%) |
| Bottled, Tank, or LP Gas | 4 (1.3%) | 0 (0.0%) |
| Electricity | 130 (43.5%) | 53 (52.5%) |
| Fuel Oil or Kerosene | 0 (0.0%) | 0 (0.0%) |
| Coal or Coke | 0 (0.0%) | 0 (0.0%) |
| All other Fuels | 7 (2.3%) | 30 (29.7%) |
| No Fuel Used | 0 (0.0%) | 0 (0.0%) |
| Total | 299 (100.0%) | 101 (100.0%) |
Household Vehicle Usage in Texico
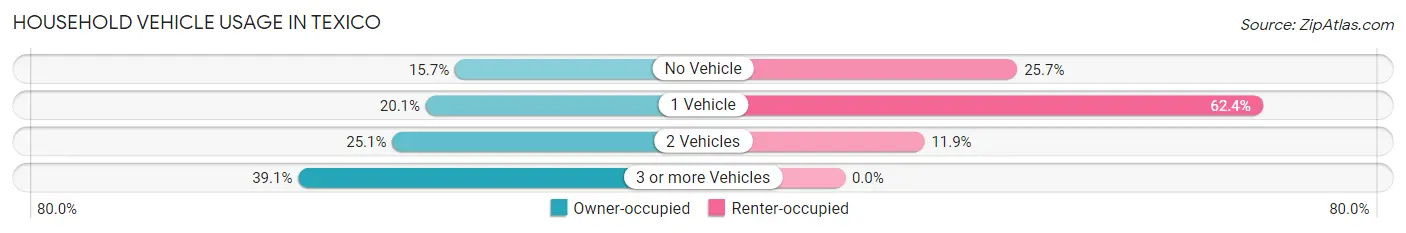
| Vehicles per Household | Owner-occupied | Renter-occupied |
| No Vehicle | 47 (15.7%) | 26 (25.7%) |
| 1 Vehicle | 60 (20.1%) | 63 (62.4%) |
| 2 Vehicles | 75 (25.1%) | 12 (11.9%) |
| 3 or more Vehicles | 117 (39.1%) | 0 (0.0%) |
| Total | 299 (100.0%) | 101 (100.0%) |
Real Estate & Mortgages in Texico
Real Estate and Mortgage Overview in Texico
| Characteristic | Without Mortgage | With Mortgage |
| Housing Units | 191 | 108 |
| Median Property Value | $94,200 | $110,000 |
| Median Household Income | - | - |
| Monthly Housing Costs | $326 | $0 |
| Real Estate Taxes | $213 | $7 |
Property Value by Mortgage Status in Texico
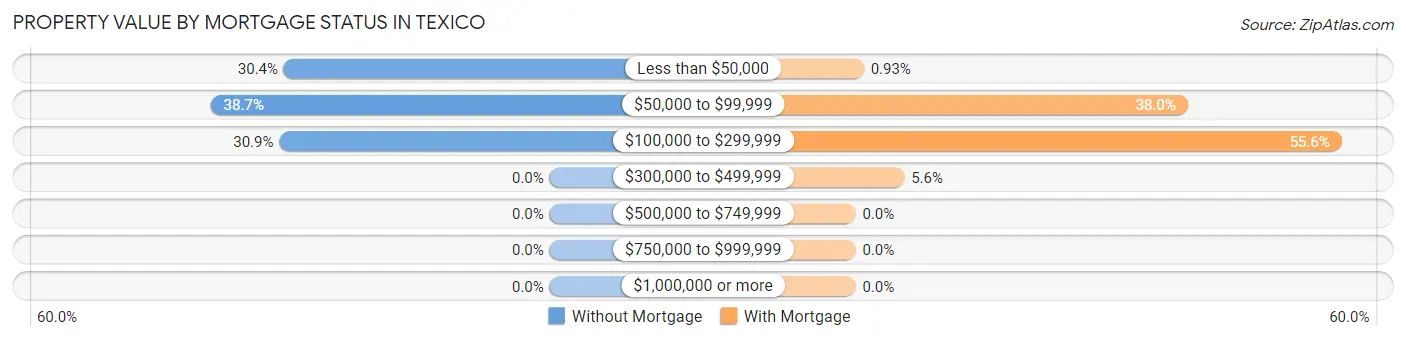
| Property Value | Without Mortgage | With Mortgage |
| Less than $50,000 | 58 (30.4%) | 1 (0.9%) |
| $50,000 to $99,999 | 74 (38.7%) | 41 (38.0%) |
| $100,000 to $299,999 | 59 (30.9%) | 60 (55.6%) |
| $300,000 to $499,999 | 0 (0.0%) | 6 (5.6%) |
| $500,000 to $749,999 | 0 (0.0%) | 0 (0.0%) |
| $750,000 to $999,999 | 0 (0.0%) | 0 (0.0%) |
| $1,000,000 or more | 0 (0.0%) | 0 (0.0%) |
| Total | 191 (100.0%) | 108 (100.0%) |
Household Income by Mortgage Status in Texico
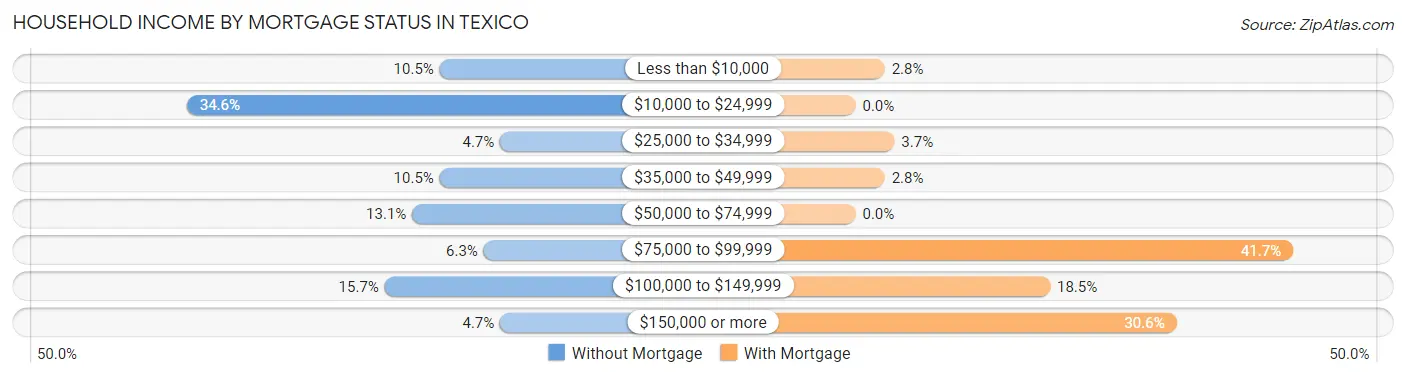
| Household Income | Without Mortgage | With Mortgage |
| Less than $10,000 | 20 (10.5%) | 3 (2.8%) |
| $10,000 to $24,999 | 66 (34.5%) | 0 (0.0%) |
| $25,000 to $34,999 | 9 (4.7%) | 4 (3.7%) |
| $35,000 to $49,999 | 20 (10.5%) | 3 (2.8%) |
| $50,000 to $74,999 | 25 (13.1%) | 0 (0.0%) |
| $75,000 to $99,999 | 12 (6.3%) | 45 (41.7%) |
| $100,000 to $149,999 | 30 (15.7%) | 20 (18.5%) |
| $150,000 or more | 9 (4.7%) | 33 (30.6%) |
| Total | 191 (100.0%) | 108 (100.0%) |
Property Value to Household Income Ratio in Texico
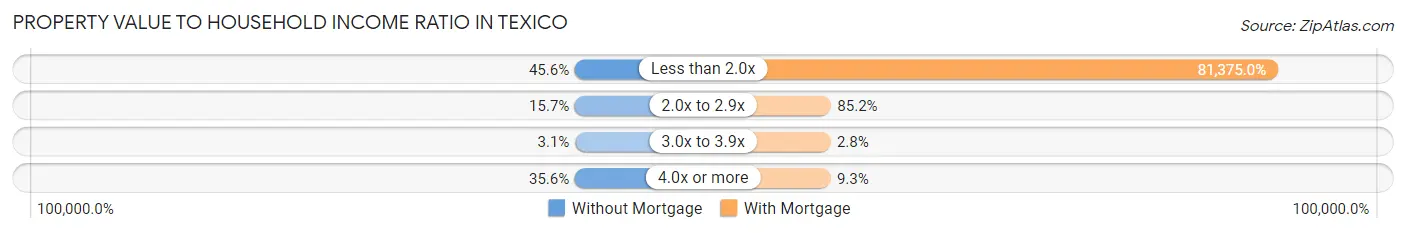
| Value-to-Income Ratio | Without Mortgage | With Mortgage |
| Less than 2.0x | 87 (45.6%) | 87,885 (81,375.0%) |
| 2.0x to 2.9x | 30 (15.7%) | 92 (85.2%) |
| 3.0x to 3.9x | 6 (3.1%) | 3 (2.8%) |
| 4.0x or more | 68 (35.6%) | 10 (9.3%) |
| Total | 191 (100.0%) | 108 (100.0%) |
Real Estate Taxes by Mortgage Status in Texico
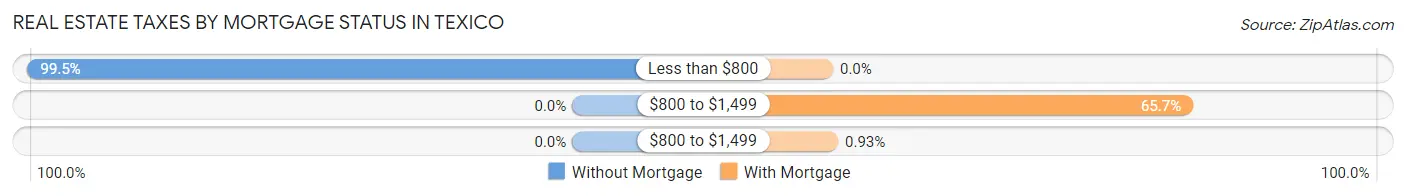
| Property Taxes | Without Mortgage | With Mortgage |
| Less than $800 | 190 (99.5%) | 0 (0.0%) |
| $800 to $1,499 | 0 (0.0%) | 71 (65.7%) |
| $800 to $1,499 | 0 (0.0%) | 1 (0.9%) |
| Total | 191 (100.0%) | 108 (100.0%) |
Health & Disability in Texico
Health Insurance Coverage by Age in Texico
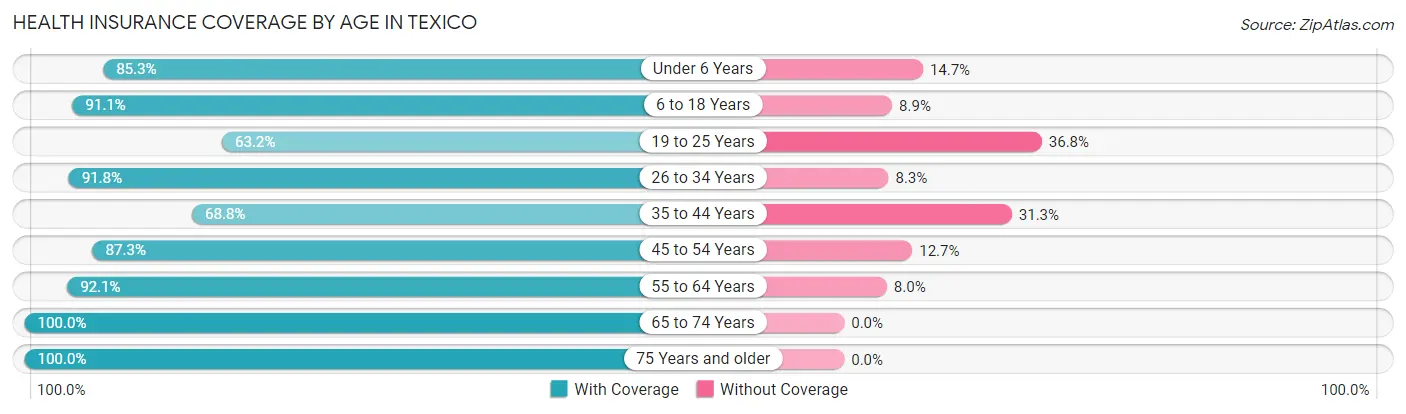
| Age Bracket | With Coverage | Without Coverage |
| Under 6 Years | 64 (85.3%) | 11 (14.7%) |
| 6 to 18 Years | 143 (91.1%) | 14 (8.9%) |
| 19 to 25 Years | 24 (63.2%) | 14 (36.8%) |
| 26 to 34 Years | 89 (91.7%) | 8 (8.3%) |
| 35 to 44 Years | 33 (68.8%) | 15 (31.2%) |
| 45 to 54 Years | 124 (87.3%) | 18 (12.7%) |
| 55 to 64 Years | 162 (92.0%) | 14 (8.0%) |
| 65 to 74 Years | 53 (100.0%) | 0 (0.0%) |
| 75 Years and older | 87 (100.0%) | 0 (0.0%) |
| Total | 779 (89.2%) | 94 (10.8%) |
Health Insurance Coverage by Citizenship Status in Texico
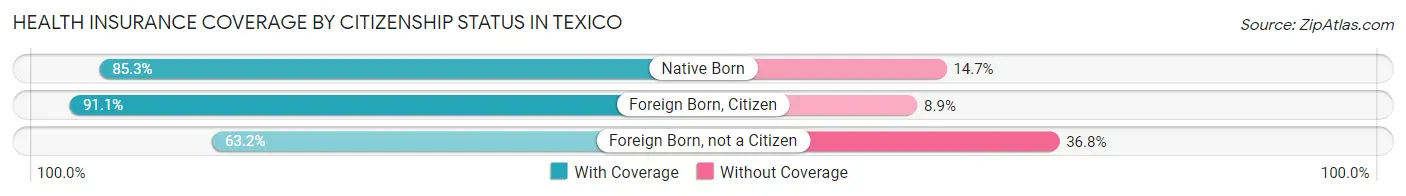
| Citizenship Status | With Coverage | Without Coverage |
| Native Born | 64 (85.3%) | 11 (14.7%) |
| Foreign Born, Citizen | 143 (91.1%) | 14 (8.9%) |
| Foreign Born, not a Citizen | 24 (63.2%) | 14 (36.8%) |
Health Insurance Coverage by Household Income in Texico
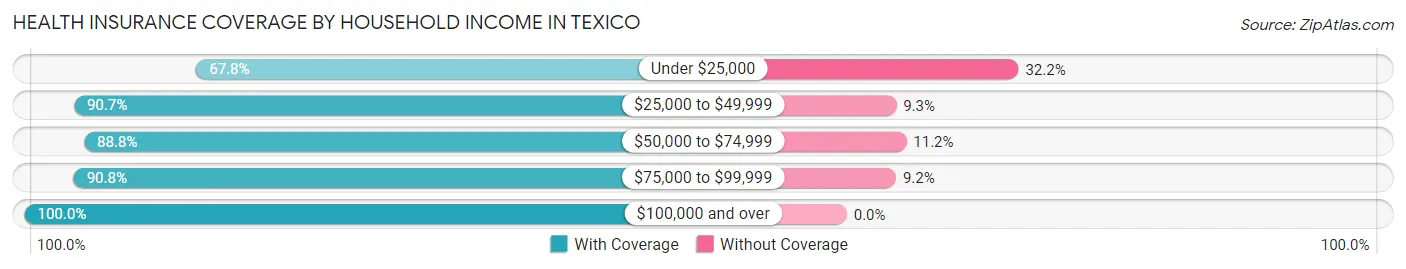
| Household Income | With Coverage | Without Coverage |
| Under $25,000 | 97 (67.8%) | 46 (32.2%) |
| $25,000 to $49,999 | 147 (90.7%) | 15 (9.3%) |
| $50,000 to $74,999 | 207 (88.8%) | 26 (11.2%) |
| $75,000 to $99,999 | 69 (90.8%) | 7 (9.2%) |
| $100,000 and over | 259 (100.0%) | 0 (0.0%) |
Public vs Private Health Insurance Coverage by Age in Texico
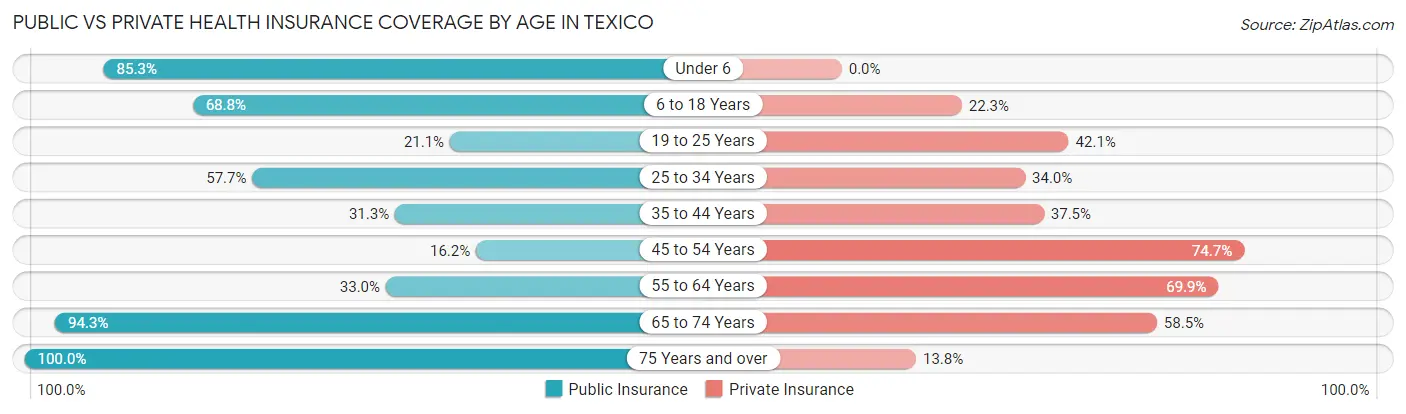
| Age Bracket | Public Insurance | Private Insurance |
| Under 6 | 64 (85.3%) | 0 (0.0%) |
| 6 to 18 Years | 108 (68.8%) | 35 (22.3%) |
| 19 to 25 Years | 8 (21.0%) | 16 (42.1%) |
| 25 to 34 Years | 56 (57.7%) | 33 (34.0%) |
| 35 to 44 Years | 15 (31.2%) | 18 (37.5%) |
| 45 to 54 Years | 23 (16.2%) | 106 (74.7%) |
| 55 to 64 Years | 58 (33.0%) | 123 (69.9%) |
| 65 to 74 Years | 50 (94.3%) | 31 (58.5%) |
| 75 Years and over | 87 (100.0%) | 12 (13.8%) |
| Total | 469 (53.7%) | 374 (42.8%) |
Disability Status by Sex by Age in Texico
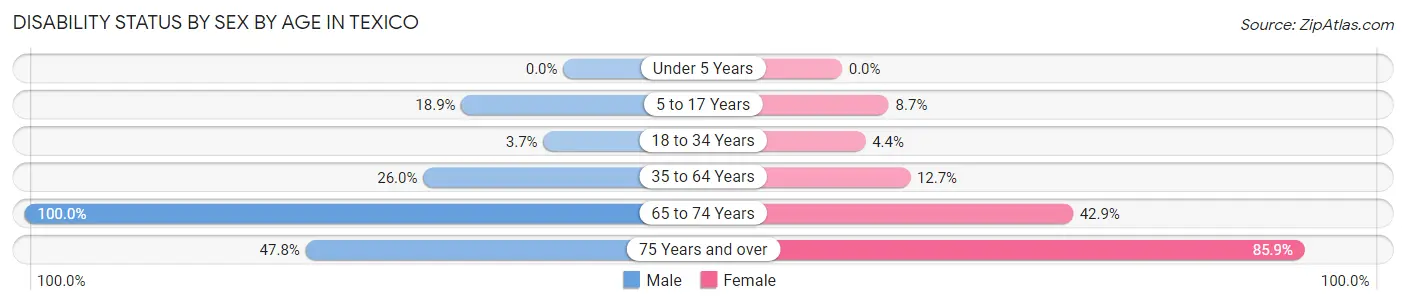
| Age Bracket | Male | Female |
| Under 5 Years | 0 (0.0%) | 0 (0.0%) |
| 5 to 17 Years | 14 (18.9%) | 8 (8.7%) |
| 18 to 34 Years | 2 (3.7%) | 4 (4.3%) |
| 35 to 64 Years | 52 (26.0%) | 21 (12.7%) |
| 65 to 74 Years | 11 (100.0%) | 18 (42.9%) |
| 75 Years and over | 11 (47.8%) | 55 (85.9%) |
Disability Class by Sex by Age in Texico
Disability Class: Hearing Difficulty
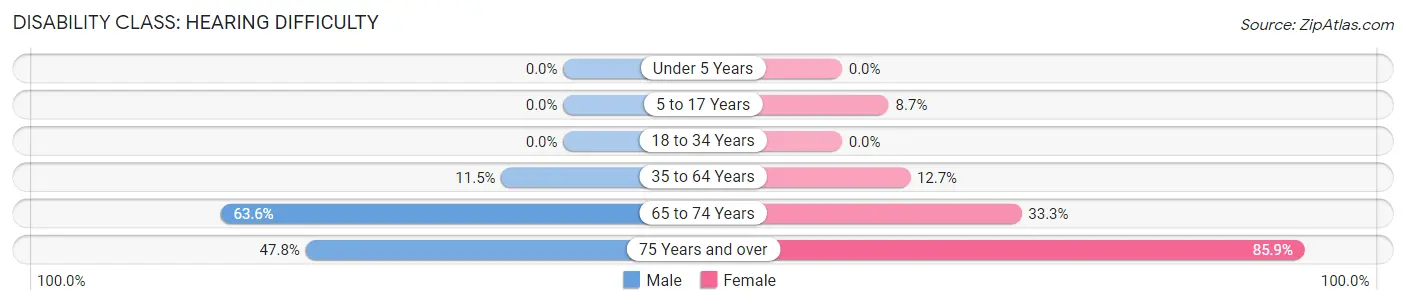
| Age Bracket | Male | Female |
| Under 5 Years | 0 (0.0%) | 0 (0.0%) |
| 5 to 17 Years | 0 (0.0%) | 8 (8.7%) |
| 18 to 34 Years | 0 (0.0%) | 0 (0.0%) |
| 35 to 64 Years | 23 (11.5%) | 21 (12.7%) |
| 65 to 74 Years | 7 (63.6%) | 14 (33.3%) |
| 75 Years and over | 11 (47.8%) | 55 (85.9%) |
Disability Class: Vision Difficulty
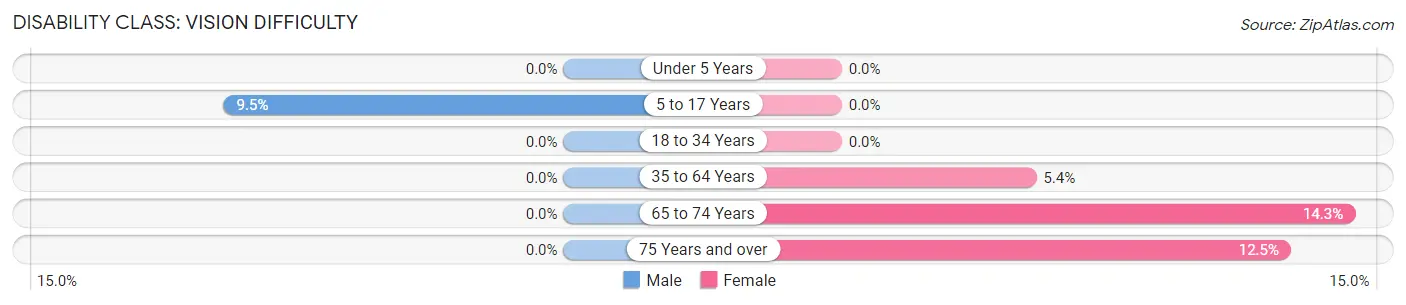
| Age Bracket | Male | Female |
| Under 5 Years | 0 (0.0%) | 0 (0.0%) |
| 5 to 17 Years | 7 (9.5%) | 0 (0.0%) |
| 18 to 34 Years | 0 (0.0%) | 0 (0.0%) |
| 35 to 64 Years | 0 (0.0%) | 9 (5.4%) |
| 65 to 74 Years | 0 (0.0%) | 6 (14.3%) |
| 75 Years and over | 0 (0.0%) | 8 (12.5%) |
Disability Class: Cognitive Difficulty
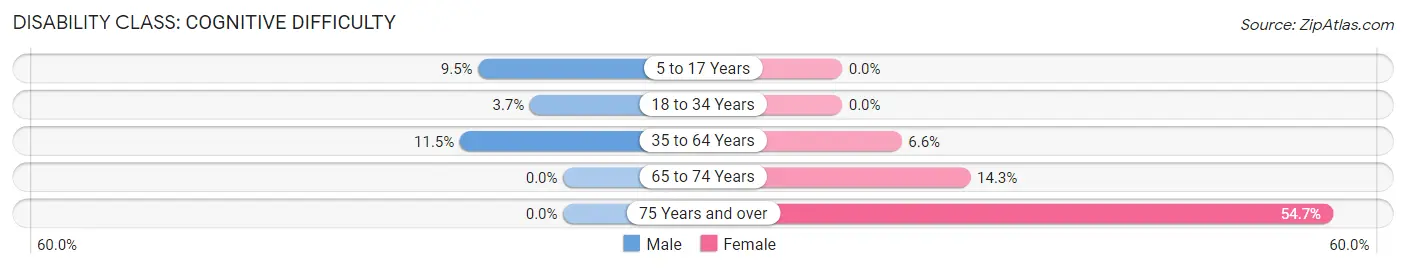
| Age Bracket | Male | Female |
| 5 to 17 Years | 7 (9.5%) | 0 (0.0%) |
| 18 to 34 Years | 2 (3.7%) | 0 (0.0%) |
| 35 to 64 Years | 23 (11.5%) | 11 (6.6%) |
| 65 to 74 Years | 0 (0.0%) | 6 (14.3%) |
| 75 Years and over | 0 (0.0%) | 35 (54.7%) |
Disability Class: Ambulatory Difficulty
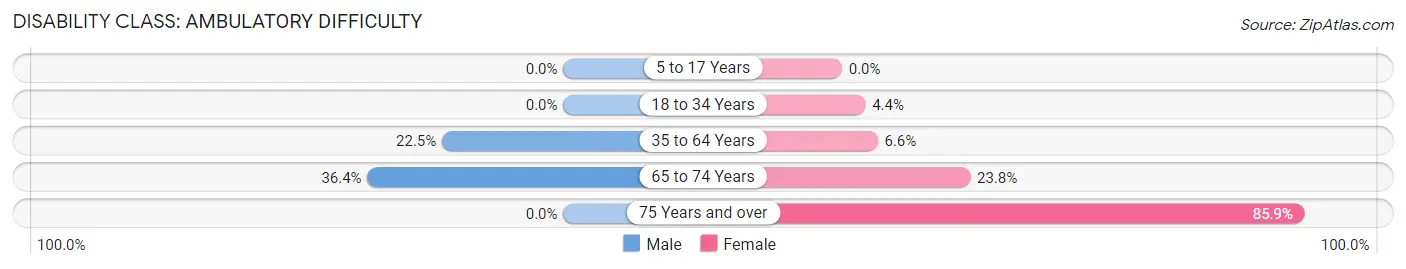
| Age Bracket | Male | Female |
| 5 to 17 Years | 0 (0.0%) | 0 (0.0%) |
| 18 to 34 Years | 0 (0.0%) | 4 (4.3%) |
| 35 to 64 Years | 45 (22.5%) | 11 (6.6%) |
| 65 to 74 Years | 4 (36.4%) | 10 (23.8%) |
| 75 Years and over | 0 (0.0%) | 55 (85.9%) |
Disability Class: Self-Care Difficulty
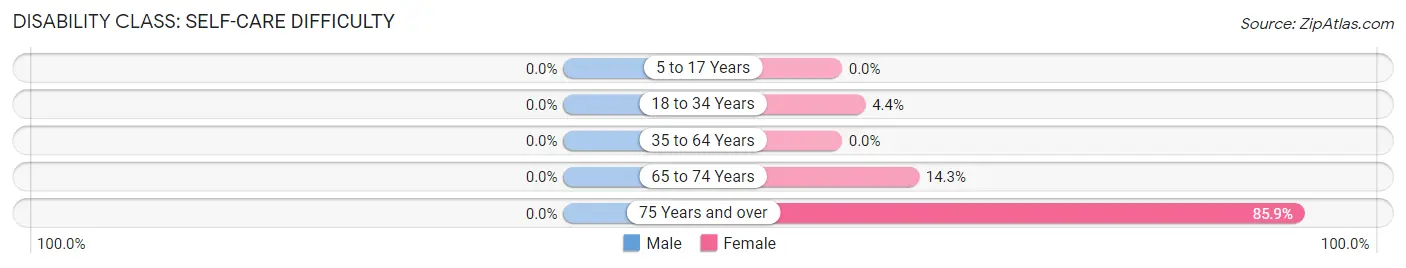
| Age Bracket | Male | Female |
| 5 to 17 Years | 0 (0.0%) | 0 (0.0%) |
| 18 to 34 Years | 0 (0.0%) | 4 (4.3%) |
| 35 to 64 Years | 0 (0.0%) | 0 (0.0%) |
| 65 to 74 Years | 0 (0.0%) | 6 (14.3%) |
| 75 Years and over | 0 (0.0%) | 55 (85.9%) |
Technology Access in Texico
Computing Device Access in Texico
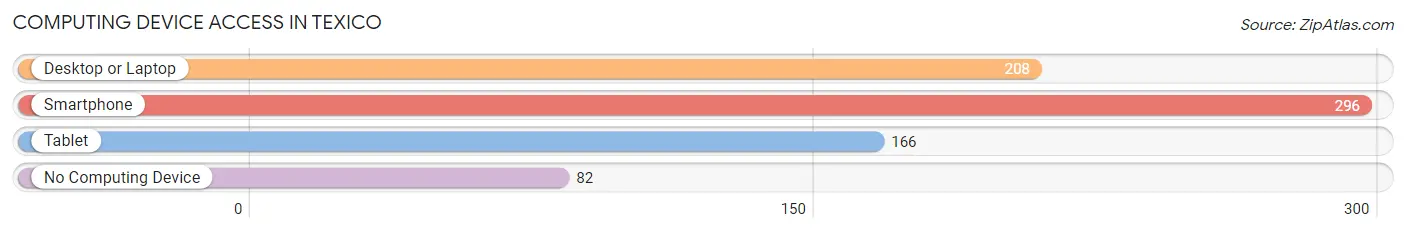
| Device Type | # Households | % Households |
| Desktop or Laptop | 208 | 52.0% |
| Smartphone | 296 | 74.0% |
| Tablet | 166 | 41.5% |
| No Computing Device | 82 | 20.5% |
| Total | 400 | 100.0% |
Internet Access in Texico
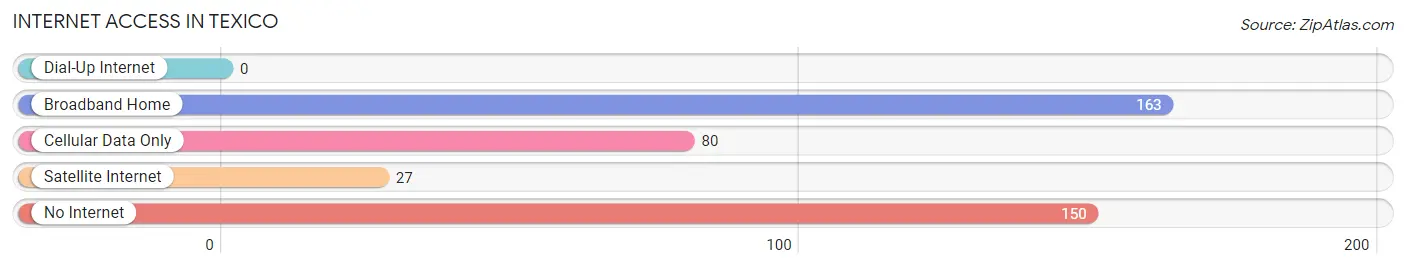
| Internet Type | # Households | % Households |
| Dial-Up Internet | 0 | 0.0% |
| Broadband Home | 163 | 40.7% |
| Cellular Data Only | 80 | 20.0% |
| Satellite Internet | 27 | 6.8% |
| No Internet | 150 | 37.5% |
| Total | 400 | 100.0% |
Texico Summary
Texico is a small city located in Curry County, New Mexico. It is situated on the Texas-New Mexico border, just south of Clovis, New Mexico. The city was founded in 1906 and has a population of 1,719 as of the 2010 census.
Geography
Texico is located at the intersection of U.S. Route 60 and New Mexico State Road 467. It is situated in the Llano Estacado region of the High Plains, and is surrounded by flat, arid terrain. The city is located at an elevation of 3,945 feet above sea level.
History
Texico was founded in 1906 by the Texas and New Mexico Railway Company. The city was named after the Texas and New Mexico Railway Company, which was abbreviated as “Texico”. The city was incorporated in 1909 and has remained a small, rural community ever since.
Economy
The economy of Texico is largely based on agriculture and ranching. The city is home to several large farms and ranches, as well as a number of small businesses. The city also has a small manufacturing sector, which produces a variety of products, including furniture, clothing, and food products.
Demographics
As of the 2010 census, the population of Texico was 1,719. The racial makeup of the city was 79.2% White, 0.2% African American, 0.7% Native American, 0.2% Asian, 0.1% Pacific Islander, 17.3% from other races, and 2.5% from two or more races. Hispanic or Latino of any race were 33.2% of the population.
The median income for a household in Texico was $30,938, and the median income for a family was $35,625. The per capita income for the city was $14,945. About 17.2% of families and 20.2% of the population were below the poverty line, including 28.2% of those under age 18 and 11.2% of those age 65 or over.
Conclusion
Texico is a small city located in Curry County, New Mexico. It is situated on the Texas-New Mexico border, just south of Clovis, New Mexico. The city was founded in 1906 and has a population of 1,719 as of the 2010 census. The economy of Texico is largely based on agriculture and ranching, and the city is home to several large farms and ranches, as well as a number of small businesses. The racial makeup of the city was 79.2% White, 0.2% African American, 0.7% Native American, 0.2% Asian, 0.1% Pacific Islander, 17.3% from other races, and 2.5% from two or more races. Hispanic or Latino of any race were 33.2% of the population. Texico is a small, rural community that has remained largely unchanged since its founding in 1906.
Common Questions
What is Per Capita Income in Texico?
Per Capita income in Texico is $26,023.
What is the Median Family Income in Texico?
Median Family Income in Texico is $68,889.
What is the Median Household income in Texico?
Median Household Income in Texico is $56,250.
What is Income or Wage Gap in Texico?
Income or Wage Gap in Texico is 48.4%.
Women in Texico earn 51.6 cents for every dollar earned by a man.
What is Inequality or Gini Index in Texico?
Inequality or Gini Index in Texico is 0.41.
What is the Total Population of Texico?
Total Population of Texico is 873.
What is the Total Male Population of Texico?
Total Male Population of Texico is 391.
What is the Total Female Population of Texico?
Total Female Population of Texico is 482.
What is the Ratio of Males per 100 Females in Texico?
There are 81.12 Males per 100 Females in Texico.
What is the Ratio of Females per 100 Males in Texico?
There are 123.27 Females per 100 Males in Texico.
What is the Median Population Age in Texico?
Median Population Age in Texico is 46.7 Years.
What is the Average Family Size in Texico
Average Family Size in Texico is 2.9 People.
What is the Average Household Size in Texico
Average Household Size in Texico is 2.2 People.
How Large is the Labor Force in Texico?
There are 447 People in the Labor Forcein in Texico.
What is the Percentage of People in the Labor Force in Texico?
65.3% of People are in the Labor Force in Texico.
What is the Unemployment Rate in Texico?
Unemployment Rate in Texico is 2.7%.